Embed Size (px)
Citation preview

Journal of Exercise Physiologyonline
Volume 15 Number 2 April 2012
Editor-in-ChiefTommy Boone, PhD, MBAReview BoardTodd Astorino, PhDJulien Baker, PhDSteve Brock, PhDLance Dalleck, PhDEric Goulet, PhDRobert Gotshall, PhDAlexander Hutchison, PhDM. Knight-Maloney, PhDLen Kravitz, PhDJames Laskin, PhDYit Aun Lim, PhDLonnie Lowery, PhDDerek Marks, PhDCristine Mermier, PhDRobert Robergs, PhDChantal Vella, PhDDale Wagner, PhDFrank Wyatt, PhDBen Zhou, PhD
Official Research Journal of the American Society of
Exercise Physiologists
ISSN 1097-9751
Editor-in-ChiefTommy Boone, PhD, MBAReview BoardTodd Astorino, PhDJulien Baker, PhDSteve Brock, PhDLance Dalleck, PhDEric Goulet, PhDRobert Gotshall, PhDAlexander Hutchison, PhDM. Knight-Maloney, PhDLen Kravitz, PhDJames Laskin, PhDYit Aun Lim, PhDLonnie Lowery, PhDDerek Marks, PhDCristine Mermier, PhDRobert Robergs, PhDChantal Vella, PhDDale Wagner, PhDFrank Wyatt, PhDBen Zhou, PhD
Official Research Journal of the American Society of Exercise Physiologists
ISSN 1097-9751
JEPonline
Increasing Physical Activity Decreases Hepatic Fat and Metabolic Risk Factors
Tanya L. Alderete1, Lauren E. Gyllenhammer1, Courtney E. Byrd-Williams2, Donna Spruijt-Metz1, Michael I. Goran1,3, Jaimie N. Davis1
1Department of Preventive Medicine, Keck School of Medicine, University of Southern California, Los Angeles, CA, 2School of Public Health, The University of Texas Health Science Center at Houston 3Department of Physiology and Biophysics, Keck School of Medicine, University of Southern California
ABSTRACTAlderete TL, Gyllenhammer LE, Byrd-Williams CE, Spruijt-Metz D, Goran MI, Davis JN. Increasing Physical Activity Decreases Hepatic Fat and Metabolic Risk Factors. JEPonline 2012;15(2):40-54. This study assessed the changes in time spent in moderate to vigorous physical activity (MVPA) on fat depots, insulin action, and inflammation. Longitudinal data were generated from 66 Hispanic adolescents (15.6±1.1 yr; BMI percentile 97.1±3.0) who participated in a 16-wk nutrition or nutrition+exercise intervention. There were no effects of the intervention on PA, but there were inter-individual changes in PA. For purposes of this analysis, all intervention groups were combined to assess how changes in PA during 16 wk affected changes in adiposity, insulin action, and markers of inflammation. MVPA was assessed by 7-day accelerometry, total body fat via DXA, liver fat by MRI, and insulin, glucose and HOMA-IR via a fasting blood draw. A repeated measures ANCOVA was used to assess the effect of MVPA on fat depots, insulin action, and inflammatory markers. Sixty-two percent of participants increased MVPA (mean increase, 19.7±16.5 min/day) and 38% decreased MVPA (mean decrease, 10.7±10.1 min/day). Those who increased MVPA by as little as 20 min per day over 16 wk, compared to those who decreased MVPA, had significant reductions in liver fat (-13% vs. +3%; P=0.01), leptin levels (-18% vs. +4%; P=0.02), and fasting insulin (-23% vs. +5%; P=0.05). These findings indicate that a modest increase in MVPA can improve metabolic health in sedentary overweight Hispanic adolescents.
Key Words: Moderate-to-Vigorous Physical Activity, Obesity,
INTRODUCTION
40

Recent national data indicate that 34% of all adolescents are overweight and 18% are obese. The prevalence of overweight among Hispanic adolescents is even higher than the national average, with 41% being overweight compared to 31% for non-Hispanic white adolescents (24). Additionally, compared with African American youth, Hispanic adolescents report less physical activity and worse metabolic profiles despite similar levels of obesity (17). These high rates of overweight among Hispanic adolescents contribute to increased systemic low-grade inflammation (11,37), risk for pre-diabetes, type 2 diabetes, metabolic syndrome, and fatty liver disease compared to other racial and ethnic groups (20,30).
Increased physical activity is related to decreased obesity (31) as well as reductions in inflammation, adiposity, and metabolic disease risk (3,28). In a cross-sectional study of overweight Latino and African American youth, our group found that those who spent a greater time engaging in moderate to vigorous physical activity (MVPA) were half as likely to have metabolic syndrome (18). Other studies have found mixed results in regards to exercise and physical activity (PA) interventions. Specifically, some studies noted decreases in fat mass (5), modest changes in metabolic indices, or lack of an effect (8,16). These interventions report on the intent-to-treat analysis, which shows the effects of a specific physical activity intervention program on health outcomes (5,8,16). For this reason, it is likely that using the intent-to-treat analysis partially explains mixed results regarding the health benefits associated with increases in PA.
We previously showed that increasing total PA by 28% was associated with a 1.4 kg decrease of total fat mass in overweight Hispanic adolescents (4). However, few studies have examined whether objectively measured changes in habitual PA, with either a longitudinal or intervention design, impact fat depots, insulin action, and inflammatory markers. For example, a longitudinal study using self-reported PA found no association between PA and insulin resistance or C-reactive protein (19). Another study examined the effects of an exercise and dietary intervention among children. Using self-reported PA, they found that PA significantly reduced the prevalence of obesity among females, but failed to increase moderate to vigorous PA among both sexes (13). Therefore, the purpose of this study was to determine how changes in objectively measured PA over 16 wk, independent of energy intake and irrespective of intervention group, affect adiposity, metabolic parameters, and markers of inflammation among overweight Hispanic adolescents. We hypothesize that increases in PA would lead to improvements in adiposity, metabolic markers, and inflammation.
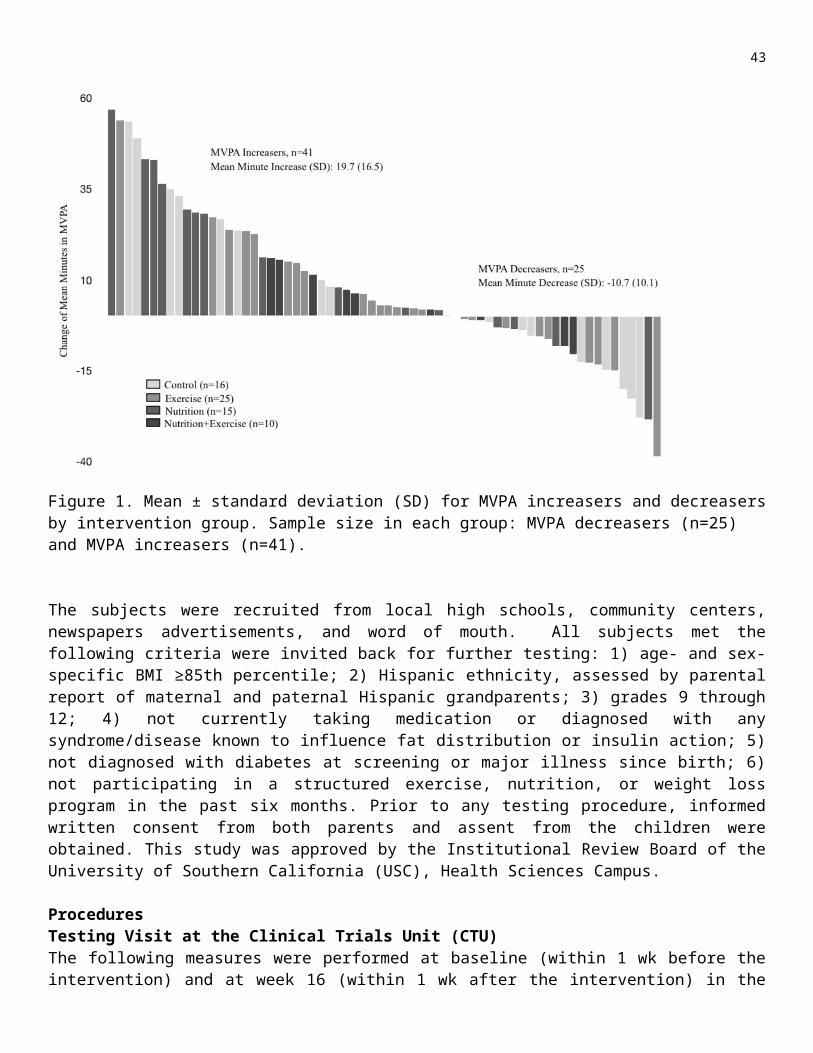
METHODSSubjectsThe subjects consisted of 66 overweight Hispanic adolescents (51 girls, 15 boys) who participated in randomized nutrition and/or exercise programs. Each subject had valid accelerometry, adiposity, and metabolic data at baseline and post-intervention. The subjects’ characteristics, description of intervention, and procedures used in these studies have been previously reported (7,8). Intent-to-treat effects on adiposity and metabolic parameters of the 16-wk nutrition and/or exercise intervention have been previously reported (8). Of note, the interventions were not designed to increase habitual PA. Upon examination of our results, we confirmed that the 16-wk interventions had no effect on PA. Changes in PA were randomly spread across the intervention groups. Specifically, in regards to the subjects who increased in MVPA, as illustrated in Figure 1. There were no significant differences in baseline or changes in physical activity across the intervention groups (P>0.05). Therefore, we examined changes in physical activity across 16 wk, irrespective of the intervention group.
41

Figure 1. Mean ± standard deviation (SD) for MVPA increasers and decreasers by intervention group. Sample size in each group: MVPA decreasers (n=25) and MVPA increasers (n=41).
The subjects were recruited from local high schools, community centers, newspapers advertisements, and word of mouth. All subjects met the following criteria were invited back for further testing: 1) age- and sex-specific BMI ≥85th percentile; 2) Hispanic ethnicity, assessed by parental report of maternal and paternal Hispanic grandparents; 3) grades 9 through 12; 4) not currently taking medication or diagnosed with any syndrome/disease known to influence fat distribution or insulin action; 5) not diagnosed with diabetes at screening or major illness since birth; 6) not participating in a structured exercise, nutrition, or weight loss program in the past six months. Prior to any testing procedure, informed written consent from both parents and assent from the children were obtained. This study was approved by the Institutional Review Board of the University of Southern California (USC), Health Sciences Campus.
ProceduresTesting Visit at the Clinical Trials Unit (CTU) The following measures were performed at baseline (within 1 wk before the intervention) and at week 16 (within 1 wk after the intervention) in the USC CTU. A certified phlebotomist or nurse performed blood draws after an overnight fast (nothing to eat or drink, except water, past 8 p.m. the night before).
Anthropometry and AdiposityUsing a beam medical scale and wall-mounted stadiometer, weight and height were measured in triplicate and then averaged. Body Mass Index (BMI) percentiles for age and sex were determined using EpiInfo 2000, Version 1.1 (CDC, Atlanta, GA). Whole body fat and lean tissue mass were measured by dual-energy x-ray absorptiometry (DEXA) using a Hologiz QDR 4500W (Hologic, Bedford, MA). Abdominal fat distribution and hepatic fat fraction (HFF) were measured by magnetic
42
resonance imaging (MRI) on a General Electric 1.5-Telsa magnet (12). The slice thickness was 10 mm with no inter-slice gaps. A commercially available image segmentation and quantification software (SliceOmatic, Tomovision, Inc.) was used. Subcutaneous and visceral volumes were computed across all 19 image slices in each participant. Hepatic fat fraction was computed as the mean fat fraction in all imaging slices within which the liver was present.
Metabolic ParametersBlood samples were centrifuged immediately for 10 min at 2500 RPM and 8-10 C to obtain plasma, and aliquots were frozen at –70°C until assayed. Glucose was assayed in duplicate on a Yellow Springs Instrument 2700 Analyzer (Yellow Springs Instrument, Yellow Springs, OH; which uses a membrane bound glucose oxidase technique). Insulin was assayed in duplicate using a specific human insulin ELISA kit from Linco (St. Charles, MO). The homeostasis model assessment of insulin resistance (HOMA-IR) was calculated [fasting insulin (µU/ml) X fasting glucose (mmol/l)/22.5]. Leptin, tumor necrosis factor-α (TNF-α), monocyte chemotactic protein-1 (MCP-1), hepatocyte growth factor (HGH), nerve growth factor (NGF), adiponectin, and plasminogen activator inhibitor (PAI-1) were assayed in duplicate using a specific human insulin enzyme-linked immunosorbent assay kit from Linco (St Charles, MO).
Energy Intake and PATo assess energy intake, the subjects completed 3-day diet records at home after undergoing training by the study staff, who were trained and supervised by a Registered Dietitian. The staff clarified records at the time that they were collected. Nutrition data were analyzed using the Nutrition Data System for Research (NDS-R version 5.0_35) developed by the University of Minnesota.
Physical activity was objectively measured using the biaxial Actigraph accelerometer (GT1M or 7164; Actigraph, LLC, Pensacola, FL). The Actigraph accelerometer is a reliable instrument, valid for measuring activity in children and adolescents (9). The subjects were instructed to wear the Actigraph on their right hip for seven consecutive days except while participating in water-based activities or during nighttime sleep. The data were reduced using an adapted version of the SAS code used for the 2003-2004 National Health and Nutrition Examination Survey (NHANES), which is available at http://riskfactor.cancer.gov/tools/nhanes_pam.
To correct for the two Actigraph monitor models used, a correction factor was applied to the code (6). The intensity thresholds for moderate (2,200 counts) and vigorous (5,999 counts) activity were set at the adult and older adolescent cut-points used in NHANES (34) since the average weight of the adolescents in our study was 88.8 kg and all youth were in advanced pubertal stages. Additionally, a sedentary cut point of 100 counts was used (21).
There is no clear consensus on the amount of time required for valid accelerometry measurement (35), so a modest level of 4 days with at least 8 valid hrs of activity each was used for these analyses (34). For baseline measurement, the subjects wore the accelerometer on average for (mean standard deviation) 6.4 2.2 days at 13.1 1.4 hrs per day at pretest and for 6.6 2.3 days at 12.9 1.3 hrs per day at posttest. Accelerometer data are presented as the mean time spent across activity levels, and total PA or mean counts per minute (CPM). The mean time across activity levels was calculated by summing the minutes within moderate and vigorous PA (MVPA), and then dividing that by the total number of valid wear days. Dividing by the mean minutes of wear per day generated percent time. Mean CPM was calculated by dividing the total counts per day by the total minutes of valid wear per day.
43

Statistical AnalysesIndependent t-test and Chi-square were used to determine whether there were baseline differences between MVPA increasers and decreasers. General linear model (GLM) repeated measures were used to assess whether changes in physical activity (e.g., moderate physical activity, MVPA) resulted in changes in adiposity, insulin indices, or inflammatory makers after controlling for covariates. The following a priori covariates were included in our analyses: sex, age, baseline total fat mass, baseline total lean tissue mass, intervention group, and baseline total energy intake. Additional covariates included baseline physical activity and length of measurement. All assumptions of GLM repeated measures were met. Analyses were conducted using SPSS (Version 18; SPSS, Inc., Chicago IL). P<0.05 denotes statistical significance. Results are presented as mean ± standard deviation (SD).
Definition of Increasers and Decreasers of Physical Activity MeasuresThe subjects were divided into categories based on whether they decreased or increased their physical activity over 16 wks. Those who increased their mean minutes of PA of any magnitude (week 16 – baseline > 0) were classified as PA increasers. Participants who decreased their mean minutes of PA of any magnitude (week 16 – baseline < 0) were classified as PA decreasers. Of the 67 total participants, 60% (n=40) were PA increasers and 40% (n=27) were PA decreasers. Those who increased their mean minutes spent in MVPA of any magnitude (week 16 – baseline > 0) were classified as MVPA increasers. Of the 66 total participants, 62% (n=41) were MVPA increasers and 38% (n=25) were MVPA decreasers.
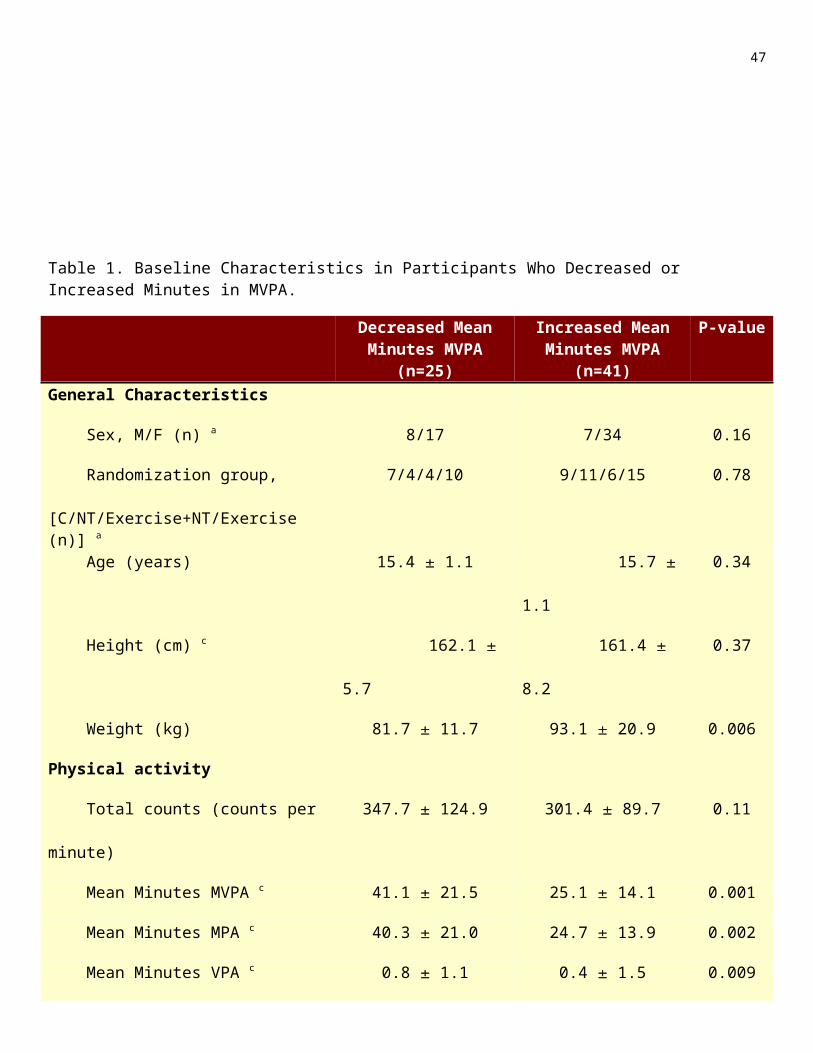
RESULTSParticipant Characteristics at BaselineBaseline characteristics by mean minute MVPA increasers vs. decreasers are shown in Table 1 . At baseline, MVPA increasers and decreasers did not differ in regards to sex, age, or height (P>0.10). MVPA increasers and decreasers had similar total counts per minute (cpm) as well as time spent in sedentary and light physical activity (P>0.10). However, MVPA increasers and decreasers had different mean levels of MVPA at baseline. Specifically, MVPA increases spent less time in MVPA compared to MVPA decreasers (25.1±14.1 min vs. 41.1±21.5 min; P<0.01). On average, MVPA increasers and decreasers consumed the same amount of calories each day (P=0.22). At baseline, MVPA increasers compared to decreasers were heavier (93.1±20.9 kg vs. 81.7±11.7 kg; P<0.01), had more total fat mass (35.6±10.6 kg vs. 29.2±8.7 kg; P=0.01), more VAT (2.0±0.9 L vs. 1.5±0.7 L; P=0.02), and more SAT (14.4±5.6 L vs. 9.3±4.7 L; P<0.01). MVPA increasers and decreasers had similar levels of total lean tissue mass (P=0.65) and hepatic fat (P=0.31). At baseline, MVPA increasers had higher plasma leptin levels compared to MVPA decreasers (48.6±20.0 ng/mL vs. 37.5±26.7 ng/mL; P<0.05). The MVPA increasers and decreasers did not differ in any other insulin indices, hormones, or inflammatory markers. The intervention failed to change total added sugar or total added fiber among mean minute MVPA increasers and decreasers (P>0.68). Finally, mean minute MVPA increasers and decreasers did not differ in percent: total sugar, added sugar, or total fiber at baseline (P>0.10).
Table 1. Baseline Characteristics in Participants Who Decreased or Increased Minutes in MVPA.
44
Decreased Mean Minutes MVPA (n=25)
Increased Mean Minutes MVPA
(n=41)
P-value
General Characteristics
Sex, M/F (n) a 8/17 7/34 0.16
Randomization group, [C/NT/Exercise+NT/Exercise (n)] a
7/4/4/10 9/11/6/15 0.78
Age (years) 15.4 1.1 15.7 1.1 0.34
Height (cm) c 162.1 5.7 161.4 8.2 0.37
Weight (kg) 81.7 11.7 93.1 20.9 0.006
Physical activity
Total counts (counts per minute) 347.7 124.9 301.4 89.7 0.11
Mean Minutes MVPA c 41.1 21.5 25.1 14.1 0.001
Mean Minutes MPA c 40.3 21.0 24.7 13.9 0.002
Mean Minutes VPA c 0.8 1.1 0.4 1.5 0.009
Mean Minutes SPA c 516.4 90.5 485.4 74.3 0.14
Mean Minutes LPA 244.1 50.2 263.2 57.5 0.17
Energy (kcal/day) 1,932.5 600.0 1,762.4 486.9 0.18
Adiposity
BMI (kg/m2) 31.1 3.9 35.5 6.4 0.002
BMI Percentile c 96.5 2.9 97.5 3.1 0.01
Total fat mass (kg) 29.2 8.7 35.6 10.6 0.01
Total Lean Tissue Mass (kg) 47.9 7.1 48.9 9.9 0.65
Visceral fat (L) 1.5 0.7 2.0 0.9 0.02
Subcutaneous fat (L) 9.3 4.7 14.4 5.6 0.001
Hepatic Fat Fraction (%) b 6.8 6.2 7.6 5.3 0.31
Metabolic Parameters
Fasting glucose level (mg/dL) 92.2 7.2 91.3 4.9 0.54
45

Fasting Insulin level (μU/mL) b 16.2 9.4 22.9 14.0 0.06
HOMA-IR b 3.7 2.4 5.2 3.1 0.08
TNF-α (pg/mL) b 13.0 7.4 12.5 7.3 0.77
CRP (mg/L) b 4.0 9.1 3.1 3.5 0.36
IL-6 (pg/mL) b 1.9 1.0 2.3 1.2 0.46
Adiponectin (μg/mL) 26.6 12.3 28.5 14.0 0.57
Leptin (ng/mL) b 37.5 26.7 48.6 20.0 0.01
MCP-1 (pg/mL) 289.2 72.5 256.0 136.1 0.41
PAI-1 (μg/mL) b 136.08 72.3 116.5 74.0 0.32
NGF (μg/mL) b 12.8 5.3 18.3 13.0 0.35
HGF (pg/mL) 1,179.6 571.6 1,158.1 566.8 0.92
Mean SD. Abbreviations: MVPA (Moderate to vigorous physical activity), C (control), NT (nutrition), BMI (body mass index). aχ2 Tests were used for categorical variables and independent t test were used for continuous variables. bVariables were not normally distributed so statistical tests were run with natural log transformed data. cWhen transformations that did not yield normality, nonparametric tests were used. Sample sizes for dual-energy x-ray absorptiometry were 24 in MVPA decreasers and 40 in MVPA increasers. Sample sizes for total energy intake were 24 in MVPA decreasers and 40 in MVPA increasers. Sample sizes for magnetic resonance imaging were 23 in MVPA decreasaers and 37 in MVPA increasers. Sample sizes for CRP were 24 in MVPA decreasers and 38 in MVPA increasers. Sample sizes for IL-6 were 8 in MVPA decreasers and 17 in MVPA increasers. Sample sizes for adiponectin, and leptin were 24 in MVPA decreasers and 38 in MVPA increasers. Sample sizes for TNF-α, MCP-1, PAI-1, and HGF were 14 in MVPA decreasers and 19 in MVPA increasers.
Changes in Activity Relative to Changes in AdiposityThere were no significant changes in weight, BMI parameters, total fat mass, VAT, SAT, or HFF between PA increasers versus decreasers (P>0.06). As shown in Figure 2, MVPA increasers had a 13% reduction in hepatic fat fraction (HFF) compared to a 3% increase in MVPA decreasers (P=0.01). There were no significant changes in weight, BMI parameters, total fat mass, VAT, or SAT between MVPA increasers versus decreasers (P≥0.17). Results were unchanged when including length of measurement and baseline PA as covariates (data not shown).
Changes in Activity and Metabolic ParametersThere were no significant changes in HOMA-IR, fasting insulin, leptin, or inflammatory markers between PA increasers versus decreasers (P>0.07). MVPA increasers showed a trend for a 23% reduction in their HOMA-IR while MVPA decreasers increased their HOMA-IR by 2% (P=0.09). MVPA increasers showed a trend for a 23% reduction in fasting insulin compared to a 5% increase among MVPA decreasers (P=0.05) (Figures 3A and 3B). MVPA increasers significantly decreased leptin levels by 18% compared to a 4% increase in MVPA decreasers (P=0.02) (Figure 4A). Results remained statistically significant when including accelerometer wear time and baseline A as
46
covariates (data not shown). There were no significant differences in inflammatory markers between MVPA increasers and decreasers (P>0.32).
Figure 2. Adjusted means ± standard error. Controlled for total fat mass, total lean tissue mass, sex, age, intervention group, and energy intake. Sample size in each group: decreased mean minutes MVPA (n=20) and increased mean minutes MVPA (n=33). Decreased versus increased mean minutes MVPA*Hepatic fat fraction, P=0.01.
Figure 3. Adjusted means ± standard error. Controlled for baseline total fat mass, total lean tissue mass, sex, age, intervention group and energy intake. Sample size in each group: decreased mean minutes MVPA (n=38) and increased mean minutes MVPA (n=24). (A) Decreased versus increased mean minutes MVPA*HOMA-IR, P=0.09; (B) Decreased versus increased mean minutes MVPA*fasting insulin, P=0.05.
47

Figure 4. Adjusted means ± standard error. Controlled for total fat mass, total lean tissue mass, sex, age, intervention group, and energy intake. Decreased (n=23) versus increased (n=35) min MVPA*Leptin, P=0.02.
DISCUSSIONEffects of Physical Activity The overall purpose of this study was to examine how changes in habitual PA over 16 wks are associated with changes in adiposity, metabolic parameters, and markers of inflammation among overweight Hispanic adolescents. We examined total PA and found that there were no significant changes in adiposity, metabolic indices, and markers of inflammation between total PA increasers and decreasers; therefore, we explored the differences between mean minute MVPA increasers and decreasers. Our findings demonstrate that participants who increased their MVPA levels by 20 min more per day over 16 weeks had reductions in hepatic fat fraction, HOMA-IR, fasting insulin, and leptin levels compared to participants who decreased their MVPA levels. These results suggest that increases in habitual physical activity levels can improve metabolic profiles in high-risk Hispanic youth.
Most previous studies examined intervention effects on metabolic outcomes (7,8,16,29). The studies did not examine the influence of changes in habitual PA over time independent of intervention. We previously examined whether changes in PA over 16 weeks, regardless of intervention group, was associated with changes in adiposity in overweight Hispanic adolescents. Using multivariate linear regression models, our results indicated that increases in total PA were associated with significant decreases in fat mass (4). For the current study, we expanded the sample size and collected additional data on specific fat depots to allow us to examine if changes in habitual PA over 16 wks, regardless of intervention group, affected fat deposition (such as visceral and hepatic fat), metabolic, and inflammatory parameters.
48

PA and Metabolic Parameters, Body Composition, and InflammationSimilar intervention studies (8,14,29,33) using intent-to-treat analysis have found mixed results in regards to the effects of PA interventions on metabolic parameters, body composition, and inflammation. Our group has shown that a 16-wk strength training pilot intervention, among 22 overweight Hispanic adolescent males, resulted in a 40% increased insulin sensitivity (29). Conversely, our laboratory found that a 16-wk nutrition and strength training intervention did not affect insulin sensitivity or body composition in 54 overweight Latino adolescent males and females (8). Another study examined the effects of an eight-month physical training intervention among 80 obese children and adolescents of mixed ethnicity. The physical training intervention occurred five times per week and was based on achieving 250 kcal energy expenditure per session. The physical training intervention showed no significant decreases in percent body fat or visceral adipose tissue (14). Finally, a previous study among 12 obese prepubertal girls found that a five-month strength training intervention, occurring three times per week, failed to decrease adiposity (33). Due to the difficulty associated with increasing PA among children and adolescents (39), we hypothesize that utilizing intent-to-treat analysis explains some of these varying results. Therefore, previous findings may be weakened due to participants failing to engage in PA. By examining changes in PA, irrespective of intervention group, this study was able examine how changes in PA affected adiposity and metabolic indices over 16 wks.
Hepatic FatLittle is known about the effects of diet and exercise interventions on reducing hepatic fat in healthy overweight children and adolescents. A few studies have examined the intent-to-treat effects of an intervention on liver fat depots. A recent study by Nobili et al, conducted with 84 pediatric non-alcoholic fatty liver disease (NAFLD) patients, showed that a two-year lifestyle intervention that included nutrition and physical activity reduced liver enzymes and liver echogenicity. However, a direct effect on reducing hepatic fat was not assessed (23). A study from our laboratory found that a start-up circuit training intervention that consisted of aerobic and strength training decreased visceral fat and insulin resistance in Hispanic adolescents, but failed to reduce hepatic fat (7).
Conversely, van der Heijden and colleagues (36) examined the effects of a 12-week aerobic exercise program among 15 obese Hispanic adolescents and found a significant decrease in liver fat, percent body fat, and total fat mass. Specifically, they found that the intervention resulted in a 3.3% mean decrease in hepatic fat content and a modest 1% mean decrease in percent and total fat mass. Thus, to our knowledge, this is the first study to demonstrate that an increase in MVPA (mean increase of 20 min per day) over 16 wks significantly decreased hepatic fat. Although a 1.3% decrease in hepatic fat is modest, a decrease of this magnitude does have clinical importance. Among MVPA increasers, 6 subjects demonstrated reductions in hepatic fat that brought them below 5.5%, the clinical diagnosis of NAFLD (32). In comparison, among MVPA decreasers only 1 subject was observed to eliminate their NAFLD diagnosis. Overall, these findings have the potential to shape clinical recommendations for overweight Hispanic adolescents with NAFLD and/or pre-diabetes.
LeptinIn addition to our adiposity findings, we also saw reductions in leptin levels among participants who increased MVPA levels. Among two similar PA studies that examined children and adolescents, one found an inverse relationship between leptin and PA (15) while the other failed to find an association (22). The mechanism by which PA influences leptin concentrations is not well understood; however, there is evidence to suggest that insulin plays a role in regulating leptin levels. Specifically, a study by Boden et al. (1) demonstrated that fasting insulin levels were positively associated with leptin levels in healthy and obese participants. Additionally, Falorni et al. (10) found a positive correlation between fasting insulin values and leptin levels among normal weight and obese children and adolescents.
49

Although the mechanisms by which PA acts on the metabolic syndrome are not fully understood, the data indicate that improvements in insulin resistance following increases in PA are not fully explained by decreases in body fat. Given the insulin sensitizing effects of PA, and our observed improvements in fasting insulin and HOMA-IR, it is probable that decreases in leptin were a result of enhanced insulin sensitivity.
Subject MotivationAlthough MVPA increasers and decreasers were similar in regards to age, sex, inflammation, energy intake, and other metabolic parameters, MVPA increasers were heavier, had more total fat mass, had a greater volume of subcutaneous adipose tissue, and spent less time in MVPA at baseline. It is likely that adolescents who were heavier and less physically active at baseline had the greatest opportunity for improving PA were more motivated to lose weight and, therefore, increased their habitual PA levels and improved their metabolic parameters the most. Although we did not collect data on motivation to exercise in this study, this hypothesis is consistent with findings that demonstrated that children were motivated to join and maintain their involvement in a resistance training program by the opportunity to build strength and lose weight (25). More research is warranted to tease out the reasons for changes in PA levels among overweight teens.
LimitationsA potential limitation to this analysis is the fact that accelerometry is not a perfect measure of PA. Accelerometers are worn on the hip and do not accurately detect bicycling or upper body movements. Also, accelerometers cannot be worn during water-based activities, such as swimming. However, a previous cohort study demonstrated that swimming is not a common activity among Hispanic adolescents (2). Additionally, we only measured PA at baseline and at the 16-wk. Having additional measures throughout the 16 wks would have strengthened the current study by allowing for additional analysis in the changes in PA. Another potential limitation of this study is the self-report nature of the dietary data. There is the potential that underreporting occurred, especially given the overweight status of the subjects (26). However, given that all subjects were overweight, it is likely that a similar level of underreporting occurred. Finally, due to missing data, we were limited in the number of subjects with inflammatory markers. It is possible that this reduced sample size inhibited the detection of additional changes in inflammation as a result of PA. However, these results are in line with some previous longitudinal and cross-sectional studies that failed to find significant relationships between PA and the inflammatory marker C-reactive protein (19,27). Despite this limitation, we were able to detect reductions in leptin among the subjects who increased MVPA levels.
CONCLUSIONS
According to data from the National Health and Nutrition Examination Survey, only 41% of Mexican Americans children and 10% of adolescents achieved at least 60 min of MVPA for 5 out of 7 days (38). Comparatively, only 16% of our MVPA decreasers reached the recommended level of at least 60 min per day of MVPA at baseline while none of the MVPA increasers achieved this level. Surprisingly, the findings suggest that a modest increase of 20 min or more of MVPA daily can improve metabolic health in sedentary overweight Hispanic adolescents. To our knowledge, this is the first study to show that changes in MVPA over 16 wks significantly decreases hepatic fat and improves insulin action. Given this finding, more interventions focused on improving habitual PA are warranted, particularly in this high-risk pediatric population.
50

ACKNOWLEDGMENTSThis work was supported by the USC Transdisciplinary Research on Energetics and Cancer (U54 CA 116848), the National Institute of Diabetes and Digestive and Kidney Diseases K01 (1K01Dk078858), the National Center for Research Resources/National Institutes of Health (M01 RR 00043), the California Breast Cancer Research Program (CBCRP), the NCI Cancer Education and Career Development Program (UT School of Public Health, R25CA57712) and the Dr. Robert C. and Veronica Atkins Foundation. We would like to thank the SANO LA (Strength and Nutrition Outcomes for Latino Adolescents) and ACT-LA (Adolescent Circuit Training-Los Angeles) team as well as the nursing staff at the Clinical Trials Unit. Additionally, we would like to thank our study participants and their families for their involvement.
None of the authors have any financial or personal conflict of interest. Results of the present study do not constitute endorsement by the American College of Sports Medicine (ACSM). No conflicts of interest existed for any of the authors.
Address for correspondence: Jaimie N. Davis, PhD, RD 1400 Barbara Jordan Blvd, University of Texas at Austin, Austin, Texas, USA, 78732. Phone (512) 495-4705; FAX: (512) 495-4948; Email. [email protected].
REFERENCES
1. Boden G. Effect of fasting on serum leptin in normal human subjects. J Clin Endocrinol Metab. 1996;81(9):3419-3423.
2. Butte NF, Cai G, Cole SA, Wilson TA, Fisher JO, Zakeri IF, Ellis KJ, Comuzzie AG. Metabolic and behavioral predictors of weight gain in Hispanic children: the Viva la Familia Study. Am J Clin Nutr. 2007;85(6):1478-1485.
3. Butte NF, Puyau MR, Adolph AL, Vohra FA, Zakeri I. Physical activity in nonoverweight and overweight Hispanic children and adolescents. Med Sci Sports Exerc. 2007;39(8):1257–1266.
4. Byrd-Williams CE, Belcher BR, Spruijt-Metz D, Davis JN, Ventura EE, Kelly L, Berhane K, Azen S, Goran MI. Increased physical activity and reduced adiposity in overweight Hispanic adolescents. Med Sci Sports Exerc. 2010;42(3):478-484.
5. Christiansen T, Paulsen S, Bruun J. Comparable reduction of the visceral adipose tissue depot after a diet-induced weight loss with or without aerobic exercise in obese subjects: a 12-week randomized intervention study. Eur J Endocrinol. 2009;160(5):759-767.
6. Corder K, Brage S, Ramachandran A, Snehalatha C, Wareham N, Ekelund U. Comparison of two Actigraph models for assessing free-living physical activity in Indian adolescents. J Sports Sci. 2007;25(14):1607-1611.
7. Davis JN, Gyllenhammer LE, Vanni AA, Meija M, Tung A, Schroeder ET, Spruijt-Metz D, Goran MI. Start-Up Circuit Training Program Reduces Metabolic Risk in Latino Adolescents. Med Sci Sports Exerc. 2011;43(11):2195-2203.
8. Davis JN, Kelly LA, Lane CJ, Ventura EE, Byrd-Williams CE, Alexandar KA, Azen SP, Chou C-P, Spruijt-Metz D, Weigensberg MJ, Berhane K, Goran MI. Randomized control trial to improve adiposity and insulin resistance in overweight Latino adolescents. Obesity (Silver Spring).
51

2009;17(8):1542-1548.
9. Esliger DW, Tremblay MS. Technical reliability assessment of three accelerometer models in a mechanical setup. Med Sci Sports Exerc. 2006;38(12):2173-2181.
10.Falorni A, Bini V, Molinari D, Papi F, Celi F. Leptin serum levels in normal weight and obese children and adolescents: relationship with age, sex, pubertal development, body mass index and insulin. Int J Obes Relat Metab Disord. 1997;21(10):881-890.
11.Gillum R. Association of serum C-reactive protein and indices of body fat distribution and overweight in Mexican American children. J Natl Med Assoc. 2003;95(7):545-552.
12.Glover G, Schneider E. Three‐point dixon technique for true water/fat decomposition with B0 inhomogeneity correction. Magn Reson Med. 1991;18(2):371-383.
13.Gortmaker S, Peterson K, Wiecha J. Reducing obesity via a school-based interdisciplinary intervention among youth: Planet Health. Arch Pediatr. 1999;153(4):409-418.
14.Gutin B, Barbeau P, Owens S, Lemmon C, Bauman M, Allison J, Kang H-S, Litaker M. Effects of exercise intensity on cardiovascular fitness, total body composition, and visceral adiposity of obese adolescents. Am J Nutr. 2002;75(5):818-826.
15.Gutin B, Ramsey L, Barbeau P, Cannady W, Ferguson M, Litaker M, Owens S. Plasma leptin concentrations in obese children: changes during 4-mo periods with and without physical training. Am J Clin Nutr. 1999;69(3):388-394.
16.Hasson RE, Adam TC, Davis JN, Kelly LA, Ventura EE, Byrd-Williams CE, Toledo-Corral CM, Roberts CK, Lane CJ, Azen SP, Chou C-P, Spruijt-Metz D, Weigensberg MJ, Berhane K, Goran MI. Randomized Controlled Trial to Improve Adiposity, Inflammation, and Insulin Resistance in Obese African-American and Latino Youth. Obesity (Silver Spring) 2011 [ Epub ahead of print]. doi: 10.1038/oby.2010.343.
17.Holl MG, Jaser SS, Womack JA, Jefferson VL, Grey M. Metabolic Risk and Health Behaviors in Minority Youth at Risk for Type 2 Diabetes. Diabetes Care. 2010;34(1):193-197.
18.Hsu Y-W, Belcher BR, Ventura EE, Byrd-Williams CE, Weigensberg MJ, Davis JN, McClain AD, Goran MI, Spruijt-Metz D. Physical Activity, Sedentary Behavior, and the Metabolic Syndrome in Minority Youth. Med Sci Sports Exerc 2011 [Epub adheal of print]. doi: 10.1249/MSS.0b013e318222020f.
19.Lin C-Y, Chen P-C, Kuo H-K, Lin L-Y, Lin J-W, Hwang J-J. Effects of obesity, physical activity, and cardiorespiratory fitness on blood pressure, inflammation, and insulin resistance in the National Health and Nutrition Survey 1999-2002. Nutr Metab Cardiovasc Dis. 2010;20(10):713-719.
20.Loomba R, Sirlin CB, Schwimmer JB, Lavine JE. Advances in pediatric nonalcoholic fatty liver disease. Hepatology. 2009;50(4):1282-1293.
21.Matthews CE, Chen KY, Freedson PS, Buchowski MS, Beech BM, Pate RR, Troiano RP. Amount of time spent in sedentary behaviors in the United States, 2003-2004. Am J Epidemiol. 2008;167(7):875-881.
52

22.Metcalf BS, Jeffery AN, Hosking J, Voss LD, Sattar N, Wilkin TJ. Objectively Measured Physical Activity and Its Association With Adiponectin and Other Novel Metabolic Markers: A longitudinal study in children. Diabetes Care. 2009;32(3):468-473.
23.Nobili V, Marcellini M, DeVito R, Ciampalini P, Piemonte F, Comparcola D, Sartorelli MR, Angulo P. NAFLD in children: a prospective clinical-pathological study and effect of lifestyle advice. Hepatology. 2006;44(2):458-465.
24.Ogden CL, Carroll MD, Curtin LR, Lamb MM, Flegal KM. Prevalence of high body mass index in US children and adolescents, 2007-2008. JAMA. 2010;303(3):242-249.
25.Pescud M, Pettigrew S, McGuigan M, Newton R. Factors influencing overweight children's commencement of and continuation in a resistance training program. BMC Public Health. 2010;10(709):1-9.
26.Pikholz C, Swinburn B, Metcalf P. Under-reporting of energy intake in the 1997 National Nutrition Survey. N Z Med. J. 2004;117(1202):U1079.
27.Ruiz JR, Ortega FB, Warnberg J, Sjöström M. Associations of low-grade inflammation with physical activity, fitness and fatness in prepubertal children; the European Youth Heart Study. Int J Obes Relat Metab Disord. 2007;31(10):1545-51.
28.Sabiston CM, Castonguay A, Low NCP, Barnett T, Mathieu M-E, O'Loughlin J, Lambert M. Vigorous physical activity and low-grade systemic inflammation in adolescent boys and girls. Int J Pediatr Obes. 2010;5(6):509-515.
29.Shaibi GQ, Cruz ML, Ball GDC, Weigensberg MJ, Salem GJ, Crespo NC, Goran MI. Effects of resistance training on insulin sensitivity in overweight Latino adolescent males. Med Sci Sports Exerc 2006; 38(7): 1208-1215.
30.Stein CJ, Colditz GA. The epidemic of obesity. J Clin Endocrinol Metab 2004; 89(12): 2522-2525.
31.Strong WB, Malina RM, Blimkie CJR, Daniels SR, Dishman RK, Gutin B, Hergenroeder AC, Must A, Nixon PA, Pivarnik JM, Rowland T, Trost S, Trudeau F. Evidence based physical activity for school-age youth. J Pediatr. 2005;146(6):732-737.
32.Szczepaniak LS, Nurenberg P, Leonard D, Browning J, Reingold J, Grundy S, Hobbs H. Magnetic resonance spectroscopy to measure hepatic triglyceride content: prevalence of hepatic steatosis in the general population. Am J Physiol. 2005;288(2):E462-468.
33.Treuth MS, Hunter GR, Figueroa-Colon R, Goran MI. Effects of strength training on intra-abdominal adipose tissue in obese prepubertal girls. Med Sci Sports Exerc. 1998;30(12):1738-1743.
34.Troiano RP, Berrigan D, Dedd KW, Masse LC, Tilert T, McDowell M. Physical Activity in the United States Measured by Accelerometer. Med Sci Sports Exerc. 2007;40(1):181-188.
35.Trost SG, Pate RR, Freedson PS, Sallis JF, Taylor WC. Using objective physical activity measures with youth: how many days of monitoring are needed? Med Sci Sports Exerc. 2000;32(2):426-431.
53

36.van der Heijden G-J, Wang ZJ, Chu ZD, Sauer PJJ, Haymond MW, Rodriguez LM, Sunehag AL. A 12-week aerobic exercise program reduces hepatic fat accumulation and insulin resistance in obese, Hispanic adolescents. Obesity. 2009;18(2):384-390.
37.Visser M, Bouter LM, McQuillan GM, Wener MH, Harris TB. Low-grade systemic inflammation in overweight children. Pediatrics. 2001;107(1):E13–e13.
38.Whitt-Glover MC, Taylor WC, Floyd MF, Yore MM, Yancey AK, Matthews CE. Disparities in physical activity and sedentary behaviors among US children and adolescents: prevalence, correlates, and intervention implications. J Public Health Policy. 2009;30 Suppl 1:S309-334.
39.Wilkin TJ. Can we modulate physical activity in children? No. Int J Obes. 2011 [Epub ahead of print]. doi: 10.1038/ijo.2011.163.
DisclaimerThe opinions expressed in JEPonline are those of the authors and are not attributable to JEPonline, the editorial staff or the ASEP organization.
54