Embed Size (px)
Citation preview
CRANFIELD UNIVERSITY
__________________________________________________________ BIRGITTA BEDFORD
LEGIONELLA CONTROL IN WATER SYSTEMS USING COPPER
AND SILVER ION GENERATION SYSTEMS
INSTITUTE OF BIOSCIENCE AND TECHNOLOGY
PhD. THESIS
___________________________________________________________
CRANFIELD UNIVERSITY
INSTITUTE OF BIOSCIENCE AND TECHNOLOGY
BIRGITTA BEDFORD
LEGIONELLA CONTROL IN WATER SYSTEMS USING COPPER
AND SILVER ION GENERATION SYSTEMS
PhD THESIS
2012
SUPERVISORS:
Dr. D. Aldred
Prof. N. Magan
31st January 2012
This thesis is submitted in partial fulfilment of the requirements for the Degree of
Doctor of Philosophy
© Cranfield University, 2012. All rights reserved. No part of this publication may be reproduced
without the written permission of the copyright holder.

ABSTRACT
Legionella can cause human disease which can be fatal. Routine monitoring for
Legionella in water systems is not recommended by UK authorities. Evidence of the
efficacy of control modalities against Legionella in these water systems is, therefore,
not available.
Although studies have been conducted with copper and silver ionization on its
efficacy against Legionella and on its value in reducing hospital-acquired
legionellosis, little evidence of its efficacy is available from routine monitoring data.
This study demonstrates the efficacy of copper and silver ionization against
Legionella in water systems of 10 hospitals from data obtained from routine
monitoring for Legionella, copper and silver. The inefficiencies of maintaining
temperatures above 50ºC at hot outlets and below 20ºC at cold outlets, as
recommended by UK authorities for controlling Legionella in water systems, is also
demonstrated from the data obtained from routine monitoring for Legionella and
temperatures. The futility of maintaining hot temperatures above 50ºC and then to
reduce them to temperatures that do not present a risk of scalding is also demonstrated
from the data obtained.
This efficacy of copper and silver ionization and inefficiency of maintaining
temperatures at 50ºC against Legionella was demonstrated as well in novel model
rigs, built to simulate a typical water system of a small hospital, by data obtained from
Legionella, copper, and silver analysis, and temperature recordings.
The differences in biofilm formation and Legionella growth on the surfaces of copper,
polyethylene, and synthetic rubber, which are commonly used plumbing materials,
were also examined in the model rigs as well as with a Robbins device. These studies
indicated that copper is not as biocidal as previously reported in other studies, and
gave similar results to polyethylene, which previously been shown to promote biofilm
development. Synthetic rubber, however, showed to promote biofilm production and
should not be used as a plumbing material.
ACKNOWLEDGEMENTS
I would like to thank the following people without whom this thesis would not have been possible.
Dave Aldred and Naresh Magan, of Cranfield University, for their encouragement, ideas, supervision and patience.
Melany and Alwyn Jones, for their support whilst working on this thesis in Wales.
My children Jamie and Byron, for their support throughout my studies even though they were both busy developing careers.
My husband, Nick, for his support, for his belief in me, and for simply being a great husband and father.
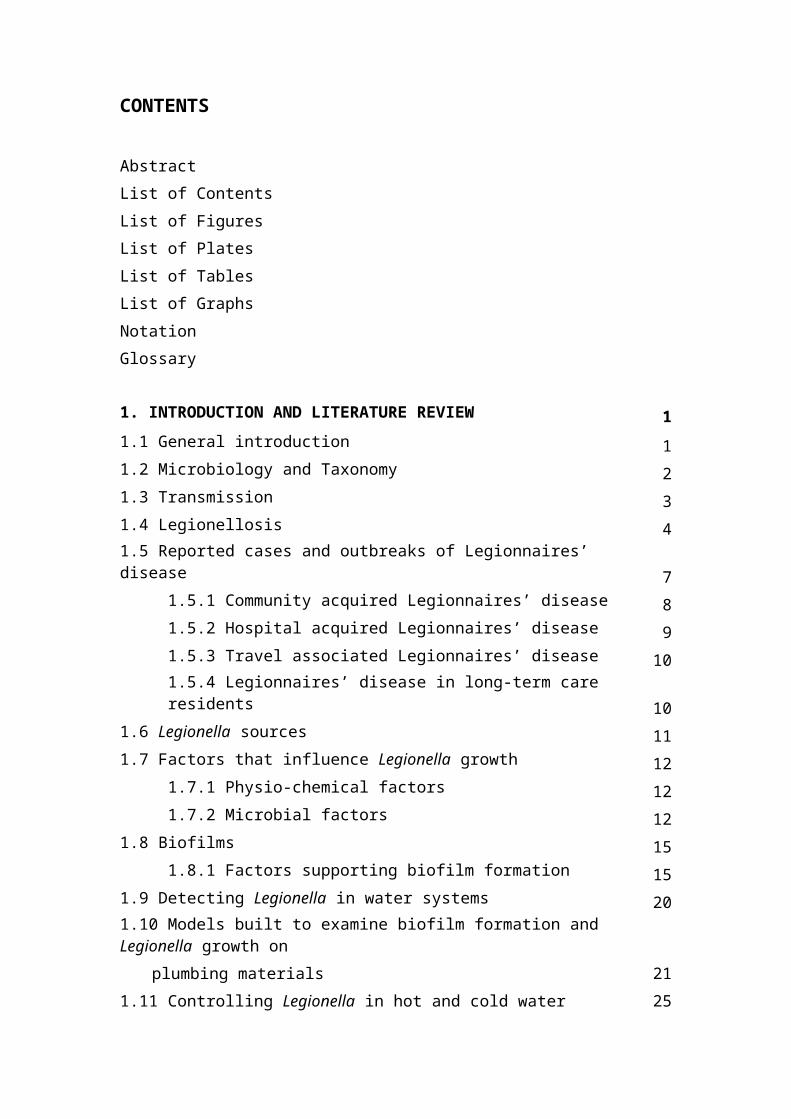
CONTENTS
Abstract
List of Contents
List of Figures
List of Plates
List of Tables
List of Graphs
Notation
Glossary
1. INTRODUCTION AND LITERATURE REVIEW 11.1 General introduction 11.2 Microbiology and Taxonomy 21.3 Transmission 31.4 Legionellosis 41.5 Reported cases and outbreaks of Legionnaires’ disease 7
1.5.1 Community acquired Legionnaires’ disease 81.5.2 Hospital acquired Legionnaires’ disease 91.5.3 Travel associated Legionnaires’ disease 101.5.4 Legionnaires’ disease in long-term care residents 10
1.6 Legionella sources 111.7 Factors that influence Legionella growth 12
1.7.1 Physio-chemical factors 121.7.2 Microbial factors 12
1.8 Biofilms 151.8.1 Factors supporting biofilm formation 15
1.9 Detecting Legionella in water systems 201.10 Models built to examine biofilm formation and Legionella growth on
plumbing materials 21
1.11 Controlling Legionella in hot and cold water distribution systems 251.12 UK guidance for controlling Legionella 26
1.12.1 Temperature control 26

1.12.2 Chlorine Dioxide 271.12.3 Copper and silver ionization 28
1.12.4 Ozone (O3) and Ultraviolet Light (UV) 341.12.5 Intermittent disinfection 351.12.6 Point-of-use filtration 36
2. AIMS AND OBJECTIVES 38
3. MATERIALS AND METHODS 403.1 Evaluation studies in UK hospitals 40
3.1.1 The Orca copper and silver ionization system 413.1.2 Sampling and system maintenance procedures 423.1.3 Study hospital 1 443.1.4 Study hospital 2 463.1.5 Study hospital 3 483.1.6 Study hospital 4 503.1.7 Study hospital 5 523.1.8 Study hospital 6 543.1.9 Study hospital 7 573.1.10 Study hospital 8 603.1.11 Study hospital 9 623.1.12 Study hospital 10 65
3.2 The copper and polyethylene rigs 683.2.1 Initial experimental procedures – Rigs A 723.2.2 Additional experimental procedures – Rigs B and C 78
3.3 Analytical methods 833.3.1 Water analysis 833.3.2 Statistical analysis 863.4 The Robbins device 87
4. RESULTS 894.1 Study hospital 1 894.2 Study hospital 2. 96
4.3 Study hospital 3 1034.4 Study hospital 4 1094.5 Study hospital 5 1134.6 Study hospital 6 1214.7 Study hospital 7 1284.8 Study hospital 8 1344.9 Study hospital 9 1414.10 Study hospital 10 1494.11 Summary of results of study hospitals 1564.12 Initial experiment – Rigs 159
4.12.1 Rigs A 1594.12.2 Rigs B and C 166
4.13 Comparison experiment – Rigs 1694.13.1 Rigs A 1694.13.2 Rigs B 1724.13.3 Rigs C 175
4.14 The Robbins device 178
5. DISCUSSION 1815.1 Evaluation of 10 hospitals 1815.2 Initial experiment with rigs 1955.3 Comparison experiment with rigs 2025.4 Experiment with the Robbins device 205
REFERENCES 207
GLOSSARY 223
LIST OF FIGURES
Fig. 1.1 Diagram of model hot water system (Schofield and Locci, 1985) 21
Fig. 1.2 Continuous culture biofilm model (Keevil et a., 1993, Rogers et al., 1994) 22
Fig. 1.3 Schematic of the BSRIA test facility (BSRIA TN6/96) 23
Fig. 1.4 Diagram of model warm water system (van der Kooij et al., 2005) 24
Fig. 3.1 Study hospital 2 – drawing of copper and silver ionization installation 47
Fig. 3.2 Study hospital 3 – drawing of copper and silver ionization installation 48
Fig. 3.3 Study hospital 4 – drawing of copper and silver ionization installation 50
Fig. 3.4 Study hospital 5 – drawing of copper and silver ionization installation 53
Fig. 3.5 Study hospital 6 – drawing of copper and silver ionization installation - 1 55
Fig. 3.6 Study hospital 6 – drawing of copper and silver ionization installation – 2 55
Fig. 3.7 Study hospital 6 – drawing of copper and silver ionization installation – 3 56
Fig. 3.8 Study hospital 7 – drawing of copper and silver ionization installation – 1 58
Fig. 3.9 Study hospital 7 – drawing of copper and silver ionization installation – 2 58
Fig. 3.10 Study hospital 8 – drawing of copper and silver ionization installation 61
Fig. 3.11 Study hospital 9 – drawing of copper and silver ionization installation 63
Fig. 3.12 Study hospital 10 – drawing of copper and silver ionization installation - 1 66
Fig. 3.13 Study hospital 10 – drawing of copper and silver ionization installation – 2 66
Fig. 3.14 Drawing of rig plus 24 sections 71
Fig. 3.15 Drawing of ‘Speedfit’ connector 71
Fig. 3.16 Drawing of polyethylene rig A – sections left and removed 79
Fig. 3.17 Drawing of polyethylene rig B – sections replaced with polyethylene rig A sections 79
Fig. 3.18 Drawing of polyethylene rig C – sections replaced with polyethylene rig A sections 80
Fig. 3.19 Drawing of copper rig A – sections left and removed 80
Fig. 3.20 Drawing of copper rig B – sections replaced with copper rig A sections 81
Fig. 3.21 Drawing of copper rig C – sections replaced with copper rig A sections 81
Fig. 4.1 Drawing of copper rig A, including Legionella results of sections 1 to 16 162
LIST OF PLATES
Plate 1.1 Legionella bacteria (www.bbc.co.uk) 2
Plate 1.2 Hartmannella vermiformis amoeba filled with L. pneumophila (Robert Koch Institute) 13
Plate 1.3 Biofilm formation (Center for Biofilm Engineering Montana State University 15
Plate 1.4 Inner surfaces of an eroded galvanized pipe 18
Plate 1.5 Outlet with point of use filter attached (Sheffer et al., 2005) 37
Plate 3.1 The Orca copper and silver ionization system 41
Plate 3.2 Study hospital 1 – photo of copper and silver ionization installation 45
Plate 3.3 Study Hospital 9 – photo of construction work 64
Plate 3.4 Photo of copper rig 69
Plate 3.5 Photo of polyethylene rig 70
Plate 3.6 Photo of two Legionella pneumophila colonies on BCYE+ 84
Plate 3.7 The Robbins device including drawing of press-fit plug 87
LIST OF TABLES
Table 1.1 Number of reported cases of Legionnaires’ disease 1993-2006 (EWGLI data) 8
Table 3.1 Study hospitals – size, number of sample outlets and sampling frequencies 40
Table 3.2 Initial experiment with rigs – inoculation 73
Table 3.3 Initial experiment with rigs – frequency of TVC analysis 74
Table 3.4 Initial experiment with rigs – frequency of Legionella analysis 75
Table 3.5 Initial experiment with rigs – pattern and procedures of biofilm harvesting 76
Table 3.6 Initial experiment with rigs – pattern of sampling for Legionella analysis of biofilm 77
Table 3.7 Treatment of rigs A, B, and C 78
Table 4.1 Study hospital 1 – results before commissioning copper and silver ionization 90
Table 4.2 Study hospital 1 – results 1 month after commissioning copper and silver ionization 92
Table 4.3 Study hospital 2 – results before commissioning copper and silver ionization 96
Table 4.4 Study hospital 2 – results 1 month after commissioning copper and silver ionization 97
Table 4.5 Study hospital 2 –56.030.1 hot outlet - results from 04/02/08 to 27/07/11 101
Table 4.6 Study hospital 3 – results before commissioning copper and silver ionization 103
Table 4.7 Study hospital 3 – results 1 month after commissioning copper and silver ionization 104
Table 4.8 Study hospital 3 – APN49 mixer tap – results from 04/02/08 to 19/07/11 107
Table 4.9 Study hospital 4 – results before commissioning copper and silver ionization 109
Table 4.10 Study hospital 4 – results 1 month after commissioning copper and silver ionization 110
Table 4.11 Study hospital 5 – results before commissioning copper and silver ionization 114
Table 4.12 Study hospital 5 – results 1 month after commissioning copper and silver ionization 116
Table 4.13 Study hospital 5–results single pure hot and pure cold taps 2 months after 117commissioning
Table 4.14 Study hospital 6 – results before commissioning copper and silver ionization 122
Table 4.15 Study hospital 6 – results 1½ months after commissioning copper and silver ionization 124
Table 4.16 Study hospital 7 – results before commissioning copper and silver ionization 128
Table 4.17 Study hospital 7 – results 1 month after commissioning copper and silver ionization 130
Table 4.18 Study hospital 8 – results before commissioning copper and silver ionization 135
Table 4.19 Study hospital 8 – results 1 month after commissioning copper and silver ionization 137
Table 4.20 Study hospital 9 – results before commissioning copper and silver ionization 141
Table 4.21 Study hospital 9 – results 1 month after commissioning copper and silver ionization 143
Table 4.22 Study hospital 9 – results before construction work was started 144
Table 4.23 Study hospital 9 – results 1 month after construction work started 146
Table 4.24 Study hospital 9 – results 5 months after construction work started 146
Table 4.25 Study hospital 9 – results 14 months after construction work started 147
Table 4.26 Study hospital 10 – results before commissioning copper and silver ionization 150
Table 4.27 Study hospital 10 – results 1 month after commissioning copper and silver ionization 151
Table 4.28 Study hospitals–number of Legionella contaminated taps before and after 156commissioning
Table 4.29 Study hospitals-average Legionella counts before and after commissioning 157
Table 4.30 Study hospitals –copper, silver, chloride, phosphorus, pH and temperature values 158
Table 4.31 Initial experiment with rigs – biofilm analysis results – copper rig A 161
Table 4.32 Initial experiment with rigs – biofilm analysis results – polyethylene rig A 161
Table 4.33 Initial experiment – Legionella results rigs A 162
Table 4.34 The Robbins device – rubber discs results 178
Table 4.35 The Robbins device – copper discs results 178
Table 4.36 The Robbins device – polyethylene discs results 179
Table 4.37 The Robbins device – brushed rubber, copper, and polyethylene discs results 179

LIST OF GRAPHS
Graph 4.1 Study hospital 1 – average Legionella counts from 05/10/07 to 11/07/11 93
Graph 4.2 Study hospital 1 – average copper levels from 05/10/07 to 11/07/11 94
Graph 4.3 Study hospital 1 – average silver levels from 05/10/07 to 11/07/11 94
Graph 4.4 Study hospital 2 – average Legionella counts from 04/02/08 to 27/07/11 98
Graph 4.5 Study hospital 2 – average copper levels from 04/02/08 to 27/07/11 99
Graph 4.6 Study hospital 2 – average silver levels from04/02/08 to 27/07/11 99
Graph 4.7 Study hospital 3 – average Legionella counts from 06/03/08 to 19/07/11 105
Graph 4.8 Study hospital 3 – average copper levels from 06/03/08 to 19/07/11 106
Graph 4.9 Study hospital 3 – average silver levels from 06/03/08 to 19/07/11 106
Graph 4.10 Study hospital 4 – average Legionella counts from 07/05/08 to 28/06/11 111
Graph 4.11 Study hospital 4 – average copper levels from 07/05/08 to 28/06/11 111
Graph 4.12 Study hospital 4 – average silver levels from 07/05/08 to 28/06/11 112
Graph 4.13 Study hospital 5 – average Legionella counts from 18/08/08 to 04/07/11 118
Graph 4.14 Study hospital 5 – average copper levels from 15/09/08 to 04/07/11 119
Graph 4.15 Study hospital 5 – average silver levels from 15/09/08 to 04/07/11 119
Graph 4.16 Study hospital 6 – average Legionella counts from 25/03/09 to 08/07/11 126
Graph 4.17 Study hospital 6 – average copper levels from 25/03/09 to 08/07/11 126
Graph 4.18 Study hospital 6 – average silver levels from 25/03/09 to 08/07/11 127
Graph 4.19 Study hospital 7 – average Legionella counts from 04/02/09 to 26/07/11 131
Graph 4.20 Study hospital 7 – average copper levels from 04/02/09 to 26/07/11 132
Graph 4.21 Study hospital 7 – average silver levels from 04/02/09 to 26/07/11 132
Graph 4.22 Study hospital 8 – average Legionella counts from 27/05/09 to 25/07/11 138
Graph 4.23 Study hospital 8 – average copper levels from 27/05/09 to 25/07/11 139
Graph 4.24 Study hospital 8 – average silver levels from 27/05/09 to 25/07/11 139
Graph 4.25 Study hospital 9 – average Legionella counts from 02/09/09 to 15/07/11 145
Graph 4.26 Study hospital 9 – average copper levels from 02/09/09 to 15/07/11 147
Graph 4.27 Study hospital 9 – average silver levels from 02/09/09 to 15/07/11 148
Graph 4.28 Study hospital 10 – average Legionella counts from 13/01/10 to 13/07/11 152
Graph 4.29 Study hospital 10– average copper levels from 13/01/10 to 13/07/11 154
Graph 4.30 Study hospital 10 - average silver levels from 13/01/10 to 13/07/11 154
Graph 4.31 Initial experiment with rigs – Legionella results polyethylene rig A 159

Graph 4.32 Initial experiment with rigs – Legionella results copper rig A 160
Graph 4.33 Initial experiment with rigs – Legionella results rig A after inoculation of rigs B and C 164
Graph 4.34 Initial experiment with rigs – Legionella results rigs B after inoculation 166
Graph 4.35 Initial experiment with rigs – Legionella results polyethylene rig C after inoculation 167
Graph 4.36 Initial experiment with rigs – Legionella results copper rig C after inoculation 168
Graph 4.37 Treatment experiment with rigs – Legionella results polyethylene rig A 169
Graph 4.38 Treatment experiment with rigs – Legionella results copper rig A 170
Graph 4.39 Treatment experiment with rigs – Legionella results polyethylene rig B 172
Graph 4.40 Treatment experiment with rigs – Legionella results copper rig B 173
Graph 4.41 Treatment experiment with rigs – Legionella results and temperatures polyethylene rig C 175
Graph 4.42 Treatment experiment with rigs - Legionella results and temperatures copper rig C 176
NOTATION
~ = Around
< = Smaller than
> = Greater than
± = Plus or minus ºC = Degrees CelsiusЛd = Circumference per diameter
µg/l = microgrammes per litre
µm = micro metre
µS/cm2= Micro Siemens per square centimetre
µWs/cm2 = Microwatt seconds per square centimetre ACoP = Approved Code of Practice Ag = Silver atom
Ag+ = Silver atom that has lost one electron or silver + ion BCYE = Buffered charcoal yeast extract
BYCE+ = Buffered charcoal yeast extract with cysteine
BSRIA = Building Services Research Information Association Limited
CFU/l = Colony forming units per litre CFU/ml = Colony forming
units per millilitre
Cu = Copper atom+
Cu = (Cuprous) Copper atom that has lost one electron or copper + ion2+
Cu = (Cupric) Copper atom that has lost two electrons or copper +2 ion
DNA = Deoxyribonucleic acid
EC = European Council
GVPV = Glycine Vancomycin Polymyxin and Cyclohexamide selective agent
HSE = Health and Safety Executive
HTM = Health Technical Memorandum
ICPMS = Inductively coupled plasma mass spectrometry
ICPOES = Inductively coupled plasma optical emission spectroscopy M2 = Square metre
Mg/l = Milligrams per litre
Ml = Millilitre
Mm2 = square millimetre
NOAEL = No observed adverse effect level
Nm = Nanometre
O3 = Ozone
pH = Potential hydrogen
RNA = Ribonucleic acid
TMV = Thermostatically controlled mixing
valve TVC = Total viable count of bacteria UK =
United Kingdom
UKAS = United Kingdom accreditation
service US = United States of America UV =
Ultraviolet
WHO = World Health Organisation
GLOSSARY
Alveolar macrophage = A white blood cell that is specialized for the uptake of particulate material by phagocytosis which is found in the lung.
Amoeba = Free-living, single-celled eukaryote that crawls by changing its shape. A particular genus of protozoa that move in this way.
Analyte = A substance or chemical constituent that is determined in an analytical procedure.
Antibody = Protein produced in response to a foreign molecule or invading
oragnsism. Often binds to the foreign molecule or cell extremely tightly, thereby
inactivating it or marking it for destruction by phagocytosis or lysis. Antigen =
Molecule that provokes an immune response.
Aspiration = The entry of secretions or foreign material into the trachea and lungs.
Atomization = separating something into fine particles.
ATP = Adenosine triphosphate = The principal carrier of chemical energy in cells.
Bioaccumulation = Accumulation of substances, such as pesticides, or other organic
chemicals in an organism.
Biodispersant = A liquid or gas used to disperse organic material in a medium.
Biomagnification = Also known as bioamplification or biological magnification, is
the increase in concentration of a substance that occurs in a food chain.
Carbon footprint = The amount of carbon dioxide emitted due to the consumption of fossil fuels.
Catabolism = The breakdown of complex molecules in living organisms to form
simpler ones, together with the release of energy; destructive metabolism. Cell lysis =
refers to the breaking down of a cell.
Cellulitis = Inflammation of subcutaneous connective tissue.
Cerebellar ataxia = Failure of muscular coordination; irregularity of muscular action caused by a region in the brain that has suffered damage.
Chemostat = A bioreactor to which fresh medium is continuously added, while culture
liquid is continuously removed to keep the culture volume constant
Cyanobacteria = A division of micro-organisms (class Cyanophyceae, kingdom
Eubacteria) that are related to the bacteria but are capable of photosynthesis. They are
prokaryotic and represent the earliest known form of life on the earth. Also called
blue-green algae.

Cysteine = A sulfur-containing amino acid, HSCH2CH(NH2)COOH, that occurs in
proteins and is a constituent of many enzymes. Deadend = A capped off end of a pipe.
Deadleg = A length of pipe ending at a fitting through which water flows only when the fitting is opened.
Desolvation = The removal of solvent from a material in solution.
Diabetes mellitus = The commonest form of diabetes, caused by a deficiency of the pancreatic hormone insulin.
Dissolved Oxygen = The amount of oxygen dissolved in water. Important to aquatic
ecology, often determines the number and types of organisms living in the water.
DNA = Deoxyribonucleic acid. Polynucleotide formed from covalently linked
deoxyribonucleotide units; serves as the carrier of genetic information.
DNA degradation = The random catabolism of DNA accompanying the irreversible damage to tissue which leads to the pathological death of one or more cells.
Endemic = A disease (or condition) regularly found among particular people or in a certain area.
Endocarditis = Inflamation of the the inner lining of the heart muscle, which also covers the heart valves.
Etiologic agent = A viable microorganism, or its toxin, which causes or may cause human disease.
Eukaryote = Living organism composed of one or more cells with a distinct nucleus
and cytoplasm. Includes all forms of life except viruses and bacteria (procaryotes).
Exopolymer = A biopolymer that is secreted by an organism into the environment (i.e.
external to the organism). These exopolymers include the biofilms produced by
bacteria to anchor them and protect them from environmental conditions.
Fatty acid = Compound used as a major source of energy during the metabolism of
cells and as a starting point for the synthesis of phospholipids, which are molecules
used to construct biological membranes.
Febrile illness = A nonspecific term for an illness of sudden onset accompanied by fever.
Flagella = tail-like projection that protrudes from the cell body of certain bacteria and
plays the dual role of locomotion and sense organ, being sensitive to chemicals and
temperatures outside the cell.
Genetically homologous = sharing a common ancestor.
Genus = A well deifined group of one or more species that is clearly separate from other genera.
Gram–negative bacteria = Bacteria that do not retain crystal violet dye in the Gram staining protocol.
Gram-staining = A differential staining procedure that divides bacteria into Gram-
positive and Gram-negative groups based on their ability to retain crystal violet when
decolorized with an organic solvent such as ethanol.
Hemoptysis = The expectoration of blood or of blood-streaked sputum from the larynx, trachea, bronchi, or lungs.
Heterotrophicorganism = An organism that cannot synthesize its own food and is dependent on complex organic substances for nutrition.
Heterotrophic plate count = The reference procedure for estimating the number of live, heterotrophic bacteria in water.
Hydrophillic = Having a tendency to mix with, dissolve in, or be wetted by water.
Hydrophobic = Tending to repel or fail to mix with water.
Inductively Coupled Plasma = (ICP) A type of plasma source in which the energy is
supplied by electric currents which are produced by electromagnetic induction.
Plasma temperatures are comparable to the surface of the sun. ICP discharges are of
relatively high electron density. As a result, the discharges are used to measure the
emmission spectrum of chemical elements or chemical compounds.
Inhalation = (also known as inspiration) The movement of air from the external environment, through the air ways, and into the lungs.
In-vitro = Taking place in a test tube, culture dish, or elsewhere outside a living
organism.
In-vivo = Taking place in real life.
Isotonic = Having the same concentration of solutes as the blood.
Lymphadenopathy = A disease affecting the lymph nodes.
Malaise = A general feeling of discomfort, illness, or uneasiness.
Macrophage = A white blood cell that is specialized for the uptake of particulate material by phagocytosis.
Membrane-bound enzyme = Enzyme/catalytic protein that is embeded in the membrane of the enclosed organelle of the cell it belongs to.
Metabolism = The sum total of the chemical processes that take place in living cells.
Morphology = The form and structure of an organism or one of its parts.
Mutagenic = Refers to a physical or chemical agent that changes the genetic material,
usually DNA, of an organism and thus increases the frequency of mutations above the
natural background level.
Myalgia = Pain in a muscle or group of muscles.
Myocarditis = Infection of the heart, with an inflammatory infiltrate, and damage to the heart muscle.
Nosocomial = Originating in a hospital.
Phagocytosis = Process by which particulate material is ‘eaten’ by a cell.
Pericarditis = An inflammation of the two layers of the thin, sac-like membrane that surrounds the heart.
Peritonitis = Inflammation of the membrane which lines the inside of the abdomen and all of the internal organs.
pH = Measure of the acidity of a solution. ‘p’ refers to power of 10, ‘H’ to hydrogen
Phagosome = A vacuole formed around a particle absorbed by phagocytosis.
Pili = Short, filamentous projections on a bacterial cell, used not for motility but for adhering to other bacterial cell (especially for mating) or to animal cells.
Planktonic organisms = The collection of small or microscopic organisms float or drift.
Postcardiotomy syndrome = Illnes believed to be caused by an autoimmune response against damaged cardiac tissue.
Protozoa = Free-living, single-celled, motile eukaryotic organisms, especially those, such as Amoeba, that live by feeding on other organisms.
Purulent sputum = Mucus that is coughed up from the lower airways, which is off-
white, yellow or green, and opaque. It indicates the presence of large numbers of
white blood cells.
Organelle = A specialized subunit within a cell that has a specific function.
Prokaryotic cells = Cells that lack a membrane-bound nucleus (from the Greek
meaning before nuclei). These cells have few internal structures that are
distinguishable under a microscope. Cells in the monera kingdom such as bacteria and
cyanobacteria (also known as blue-green algae) are prokaryotes.
Pyelonephritis = Inflammation of the substance of the kidney as a result of bacterial infection.
Quorum sensing = a type of decision-making process used by decentralized groups to
coordinate behavior. Many species of bacteria use quorum sensing to coordinate their
gene expression according to the local density of their population.
Respiratory epithelial cell = Cells arranged in one or more layers, forming part of a covering or lining of a body surface that take up O2 and make CO2.
Respiratory chain = couples electron transfer between an electron donor (such as
NADH) and an electron acceptor (such as O2) with the transfer of H+ ions (protons) across a membrane.
Respiratory metabolism = Generating energy by enzyme-mediated electron transport from an electron donor to an external electron acceptor
Ribosome = Particle composed of ribosomal RNAs and ribosomal proteins that associated with messenger RNA and catalyzes the synthesis of protein.
Ringers solution = An aqueous solution of the chlorides of sodium, potassium, and calcium that is isotonic to animal tissue.
RNA = Ribonucleic acid. Polymer formed from covalently linked ribonucleotide monomers.
Septicaemia = Blood poisoning: Invasion of the bloodstream by virulent microorganisms from a focus of infection.
Serogroup = refers to distinct variations within a subspecies of bacteria, classified together based on their cell surface antigens.
Sessile organisms = Organisms that are fixed in one place.
Silastic = Polymeric silicone substances that have the properties of rubber but are
biologically inert; used in surgical prostheses. Sinusitis = Inflammation of a nasal
sinus.
Species = Bacterial species are collections of strains that have many stable properties
in common and differ significantly from other groups of strains. Stupor = State of
near-unconsciousness or insensibility.
Taxonomy = The practice and science of classification or the result of it.
Teratogenicity = Relating to, or causing malformations of an embryo or foetus.
Thiol group = (sulfhydryl) = Chemical group containing sulphur and hydrogen found in the amino acid cysteine and other molecules.
Total Viable Count = (TVC) gives a quantitative idea about the presence of microorganisms such as bacteria, yeast and mold in a sample. To be specific, the
count actually represents the number of colony forming units (cfu) per ml of the sample.

1. INTRODUCTION AND LITERATURE REVIEW
1.1 General introduction
Legionnaires’ disease was first described in the 1970s. Aerobic Gram-negative
bacteria, isolated from infected post mortem lung tissue of victims of the unexplained
pneumonia outbreak at the 1976 American Legion Convention in Philadelphia were
identified as the causative agent. 221 of those attending the Convention became ill
with pneumonia. 34 of those affected died (Brenner, 1987). The bacterium was named
Legionella pneumophila, receiving the name Legionella to honour the stricken
American legionnaires and pneumophila from the Greek word meaning ‘lung loving’.
The pneumonia contracted was named Legionnaires’ disease (Fang et al., 1989).
Since this outbreak, Legionella pneumophila have been identified as the causative
agents of more outbreaks and cases of disease in humans. Some of these cases have
been fatal, especially, in immuno-compromised people, such as patients in hospitals.
Most national laws enforce preventing contamination by Legionella of anthropogenic
water systems (UK Health and Safety at Work Act, UK Control of Substances
Hazardous to Health Regulations). Infestation by Legionella of water systems in
hospitals is, however, common due to complex system layout, poor water use and
application of ineffective control methods. Controlling Legionella can be difficult
because the bacteria survive extreme ranges of conditions and grow and are protected
in biofilms and in protozoan cells.
Results of in-vitro and in-vivo studies demonstrated that Legionella was inactivated
and that cases of Legionnaires’ disease were reduced by the implementation of copper
and silver ionization systems (Landeen et al., 1989, Liu et al., 1994, Lin et al., 1996,
BSRIA TN6/96, Miuetzner et al., 1997, Liu et al., 1998, Stout et al., 1998, Biurrun et
al., 1999, Kusnetsov et al., 2001, Stout and Yu, 2003, Chen et al., 2008). These
studies were mainly conducted in hospitals in the US. Little data is, however,
available on its efficacy in hospitals in the UK, and little is known on its influence on
biofilms and on the inactivation of Legionella multiplying in biofilms.
This study, therefore, examines the effectiveness of copper and silver ionization
against Legionella in the water systems of hospitals in the UK. The efficacy of
1

controlling Legionella by applying elevated temperatures, which is generally
employed in the UK, compared to copper and silver ionization is also assessed, and
the growth of biofilms on plumbing materials, commonly found in UK water
distribution systems, is also looked at.
2
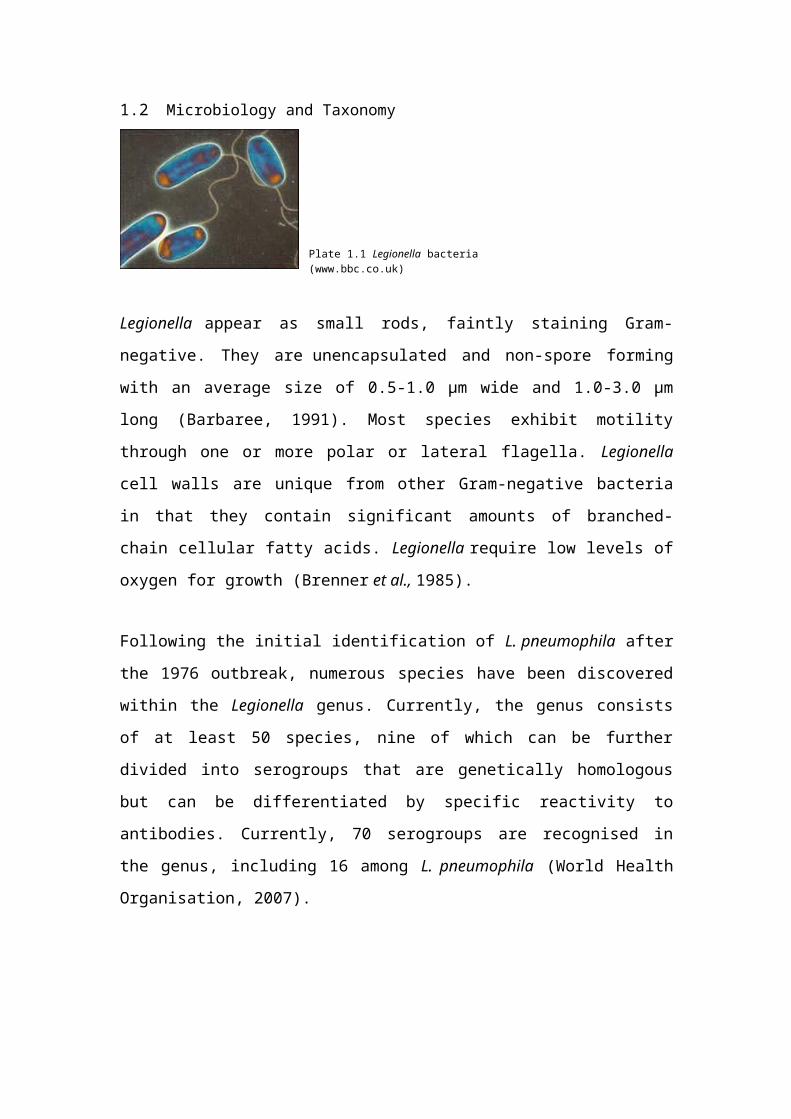
1.2 Microbiology and Taxonomy
Plate 1.1 Legionella bacteria(www.bbc.co.uk)
Legionella appear as small rods, faintly staining Gram-negative. They are
unencapsulated and non-spore forming with an average size of 0.5-1.0 µm wide and
1.0-3.0 µm long (Barbaree, 1991). Most species exhibit motility through one or more
polar or lateral flagella. Legionella cell walls are unique from other Gram-negative
bacteria in that they contain significant amounts of branched-chain cellular fatty acids.
Legionella require low levels of oxygen for growth (Brenner et al., 1985).
Following the initial identification of L. pneumophila after the 1976 outbreak,
numerous species have been discovered within the Legionella genus. Currently, the
genus consists of at least 50 species, nine of which can be further divided into
serogroups that are genetically homologous but can be differentiated by specific
reactivity to antibodies. Currently, 70 serogroups are recognised in the genus,
including 16 among L. pneumophila (World Health Organisation, 2007).
3
1.3 Transmission
Legionella exist naturally in water and moist soil. Transmission to humans normally
occurs via inhalation or aspiration of droplets of water containing Legionella
(aerosols). Person-to person transmission does not occur (Dennis and Lee, 1988,
Fitzgeorge et al., 1993, Fields, 1996, Stout and Yu 1997, Belyi, 1999). Wound
infection may be caused by direct entry of Legionella into damaged skin, and has been
observed after immersion of a wound in contaminated water (Brabender et al., 1983,
Lowry et al., 1991).
Transmission hazards have been associated with water distribution systems, cooling
towers, humidifiers, whirlpool spas, car wash systems, vegetable water sprayers, and
windscreen wiper water. As reviewed by Rathore and Alvarez, (2009), transmission
hazards have also been associated with respiratory therapy equipment, nasogastro
tubes, dental unit water lines and potting compost (Breiman et al., 1990, Kool et al.,
1998, Seenivasan et al., 2005, Kumar et al., 2010, Pravinkumar et al., 2010,
www.hcinfo.com, www.nhs.uk).
Disease is mainly caused by the transmitted Legionella residing within phagosomes of
alveolar macrophages, where they multiply intracellularly until the cell ruptures.
Liberated Legionella then infect other macrophages (Microbiology Third Edition,
1996). Immuno-compromised people are at increased risk of contracting disease from
Legionella because their cell-mediated immunity against Legionella is impaired
(Greenberg et al., 2006).
4

1.4 Legionellosis
The disease caused by Legionella is called legionellosis. The severity of legionellosis
ranges from typical Legionnaires’ disease, an acute form of fulminating pneumonia
with low attack rate and relatively high fatality rate (a low attack rate means that a
small proportion, less than 5%, of those exposed to the bacteria develop the disease),
to Pontiac fever, a mild infection with a high attack rate (a high proportion, usually
over 80%, of those exposed to the bacteria develop the disease) (Newsome, 2001).
The majority of legionelloses (70-90%) have been caused by L. pneumophila.
Virulence varies between strains of L. pneumophila, for instance some strains could
adhere to the respiratory epithelial cells via pili, whereas strains with a mutated gene
that encodes for the pili showed reduced adherence in-vitro (Stone and Kwaik, 1998).
Legionella pneumophila serogroups 1 (predominant), 6 and 13 are currently
considered to be the main causative agent of legionellosis. (Lo Presti et al., 1997,
Fields et al., 2002, Yu et al., 2002, Faris et al., 2005).
A minority of legionelloses are due to other Legionella species, most commonly L.
bozemanii, L. cincinnatiensis, L. dumoffii, L. longbaechae and L. micadadei (Stout
and Yu, 1997, Spieker et al., 1998, Diederen et al., 2005). L. micadadei and L.
dumoffii are the second and third most common species to cause Legionnaires’ disease
in children, respectively (Greenberg et al., 2006).
Recognized risk factors for contracting legionellosis include, cigarette smoking, lung
disease, immuno-suppression, end-stage renal disease, diabetes mellitus, and
advanced and very young age (Rathore and Alvarez, 2009).
Pneumonia is the predominant clinical manifestation of Legionnaires’ disease. After
an incubation period of 2 to 10 days, patients typically develop fever, weakness,
fatigue, malaise, myalgia, chills. Respiratory symptoms may not be present initially
but develop as the disease progresses. Almost all patients develop a cough, which is
initially dry and non-productive, but may become productive, with purulent sputum
and, in rare cases, haemoptysis. Patients may experience chest pain. Neurologic
complaints may include headache, lethargy, confusion, cerebellar ataxia, agitation,
stupor. Other symptoms include diarrhoea, nausea, vomiting, and abdominal pain
5
Legionnaires’ disease can manifest as septicaemia which is often diagnosed at
autopsy. Extra pulmonary legionellosis is rare. The most common site of extra
pulmonary infection in adults is the heart. Manifestations of extra pulmonary
legionellosis may also include sinusitis, cellulitis, peritonitis, pyelonephritis,
pancreatitis, wound infection, lymphadenopathy, prosthetic valve endocarditis,
myocarditis, pericarditis, postcardiotomy syndrome (Sopena et al., 1998, and Rathore
and Alvarez, 2009).
Middle-aged and older adults have a higher risk of developing Legionnaires’ disease
than do young adults and children. Among children, more than one third of reported
cases have occurred in infants younger than 1 year (Rathore and Alvarez, 2009).
The mortality rate in patients with Legionnaires’ disease is 5-80%, depending on
certain risk factors. These factors associated with high mortality rates include age
(especially those younger than 1 year and elderly patients), predisposing underlying
conditions such as chronic lung disease, immunodeficiency, malignancies, end-stage
renal disease, diabetes mellitus, nosocomial acquisition, and delayed initiation of
specific antimicrobial therapy.
Previous to the Legionnaires’ disease outbreak in 1976, in July 1968 an explosive
epidemic of acute febrile illness occurred at a county health department facility in
Pontiac, Michigan. Illness characterized principally by fever, headache, myalgia, and
malaise affected at least 144 persons, including 95 of 100 persons employed in the
health department building. The mean incubation period was 36 hours. Illness was
self-limited, generally lasting from two to five days. Secondary cases did not occur in
family contacts. A defective air-conditioning system was implicated as the source and
mechanism of spread of the causative factor. However, extensive laboratory and
environmental investigations failed to identify the etiologic agent. Since these
investigations a bacterium identical to the bacterium responsible for Legionnaires’
disease was isolated from guinea pigs exposed to the Pontiac health department
building in 1968 as well as from guinea pigs exposed to water from the evaporative
condenser (Glick et al., 1977). The illness, named after the town ‘Pontiac’, is an
influenza-like illness, typically with an abrupt onset. The incubation period is 24 to 48
hours. Prominent symptoms include fever, malaise, myalgia, cough, and headache.
Pontiac fever tends to occur in outbreaks and the infection rate is greater than 90%.
6
The disease is self-limiting, persisting for approximately 1 week (Rathore and
Alvarez, 2009).
Legionellosis is a growing problem not only because Legionella are ubiquitous and
are present in natural and anthropogenic water systems (Borella et al., 2004), but also
because the number of reported infections is on the increase (Montagne et al., 2006).
7
1.5 Reported cases and outbreaks of Legionnaires’ disease
Legionnaires’ disease requires to be reported to most national health protection
authorities.
Clinical presentation of Legionnaires’ disease is however non-specific and many
Legionnaires’ disease cases are not diagnosed. Many are also not reported. The
frequency of Legionnaires’ disease is, therefore, underestimated. For instance,
although approximately 1000 cases are reported annually to the Center for Disease
Control and Prevention (CDC), Atlanta, USA, it has been estimated that over 25000
cases of the illness actually occur (Stout et al., 1982, Marston et al., 1994, World
Health Organization 2007, Newsome, 2001).
Between 1995 and 2005 over 32,000 cases of Legionnaires' disease and more than 600
outbreaks were reported to the European Working Group for Legionella Infections
(EWGLI). 35 Countries participating in EWGLI reported in the period of 2005 to
2006 a total of 11980 cases, showing a continued increase in reported cases compared
with earlier years, see Table 1.5 below. 377 cases of these 11980 reported cases were
fatal, giving a case fatality of 6.6%. (EWGLI data – Legionnaires’ disease in Europe).
8
Year Cases No. of countries Population Incidence rate percontributing data (millions) million population
1993 1242 19 300 4.1
1994 1161 20 346 3.4
1995 1255 24 339 3.7
1996 1563 24 350 4.5
1997 1360 24 351 3.9
1998 1442 28 333 4.3
1999 2136 28 398 5.4
2000 2156 28 400 5.4
2001 3470 29 455 7.6
2002 4696 32 467 10.1
2003 4578 34 468 9.8
2004 4588 35 550 8.3
2005 5700 35 551 10.3
2006 6280 35 563 11.2
Table 1.1 - Total number of reported cases of Legionnaires’ disease and incidence rate per
million population 1993 -2006 (EWGLI data – Legionnaires’ disease in Europe).
The total confirmed cases of Legionnaires’ disease in England and Wales reported to
the UK Health Protection Agency (HPA) from 1980 to 2009 was 6750 of which 837
were fatal, giving a fatality rate of 12.4% (www.hpa.org.uk).
Reported Legionnaires’ disease cases are categorized as either acquired from sources
in the community or from sources in healthcare facilities, hospital-acquired, or cases
that are associated with travel.
1.5.1 Community acquired Legionnaires’ disease
The largest outbreak of community acquired Legionnaires’ disease in the world
reported to date was in 2001 in Murcia, Spain. More than 800 suspected cases were
reported; 449 of these cases were confirmed. Fatality of the reported cases was 1%.
(Garcia-Fulgueiras et al., 2003).
9
An outbreak of legionellosis among visitors and participants at a flower show in the
Netherlands in 1999 caused 31 deaths and more than 200 cases of the disease (Den
Boer et al., 2002).
The total confirmed community acquired cases of Legionnaires’ disease in England
and Wales reported to the HPA from 1980 to 2009 was 3418 (www.hpa.org.uk).
Britain’s worst outbreak of community acquired Legionnaires’ disease was in July
2002 when 131 cases were confirmed in Barrow-in-Furness, Cumbria, 4 of these
patients died. A further 330 people received hospital treatment for Legionnaires’
disease-like symptoms (www.hcinfo.com).
1.5.2 Hospital-acquired Legionnaires’ disease
It is envisaged that hospital-acquired Legionnaires’ disease cases account for a
substantial proportion of cases. Mortality of hospital cases is also higher than that of
community acquired Legionnaires’ disease cases due to increased mortality risk
factors in hospitals (Marston et al., 1994).
The death rate for patients who develop Legionnaires’ disease while in the hospital is
close to 50%, especially when antibiotics are started late (U.S. National Institute of
Health and National Library of Medicine Services).
In hospitals with Legionella colonization of the water systems, hospital-acquired
legionellosis is frequently endemic, accounting for 10% to 40% of hospital-acquired
pneumonias (Muder et al., 1983, Marrie et al., 1991).
The total reported hospital-acquired cases of Legionnaires’ disease in England and
Wales from 1980 to 2009 was however only 239, with 99 cases of these as suspected
cases of Legionnaires’ disease (www.hpa.org.uk). This suggests that many of the
hospital-acquired cases are either not diagnosed or not reported.
In Britain the first reported outbreak of Legionnaires’ disease was hospital-acquired at
the Stafford District General Hospital in 1984 and 1985. A total of 68 confirmed cases
were treated in hospital and 22 of these patients died. A further 35 patients, 14 of
10
whom were treated at home, were suspected cases of Legionnaires’ disease
(O’Mahony et al., 1990).
1.5.3 Travel associated Legionnaires’ disease
In 2008, the European Surveillance Scheme for Travel Associated Legionnaires’
disease (EWGLINET) received reports of 866 cases of travel-associated Legionnaires’
disease, which was slightly below the number of cases reported in 2007. 42 of these
cases were fatal. Prior to 2007 there had been a steady increase in the number of cases
reported to the scheme since its inception in 1987. This was due in part to improved
national surveillance and to an increasing number of countries joining the scheme.
There is, however, significant under-ascertainment of Legionnaires’ disease within
Europe. Especially among the newer Member States of the European Union which
include countries where surveillance for Legionnaires’ disease is less well developed.
Therefore, there is potential for case numbers to increase (Ricketts et al., 2010).
The total reported travel-associated cases of Legionnaires’ disease in England and
Wales from 1980 to 2009 was 3343. 2880 of these cases were associated with travel
outside the UK and 463 cases were associated with travel within the UK
(www.hpa.org.uk).
1.5.4 Legionnaires’ disease in long-term care residents
Pneumonia is the leading cause of death and an important cause of transfer to acute
care facilities in long-term care residents (Muder, 1998).
There are a number of epidemiological factors that suggest that long-term care
residents might be at particular risk for legionellosis should it be present in the
environment. Long-term care residents often have swallowing difficulties, and many
receive nasogastric tube feedings, predisposing factors to aspiration which is the
primary mode of transmission (Seenivasan et al., 2005).
11
1.6 Legionella sources
Ubiquitously found in nature, Legionella exist primarily in environmental waters,
although some have been isolated from potting soils and moist soil samples (Fields
1996).
Subsequent to the 1976 outbreak, Legionella species were discovered and isolated in
lakes, rivers, and naturally warm water such as hot springs in North America (Tison et
al., 1983, Campbell et al., 1984) and in Europe (Bornstein et al., 1989). It was noted
that significantly more were isolated from waters whose temperatures lay between
36C and 70C. In Europe, they have also been isolated from both surface and ground
waters (Newsome, 2001).
Legionella are present in all phases of sewage treatment, and population numbers do
not decline significantly through the treatment process (Palmer et al., 1993). States et
al., 1989 showed the potential for Legionella growth within municipal systems, which
supports the hypothesis that public water supplies may contaminate the plumbing
systems of hospitals and other large buildings (States et al., 1989).
Legionella species have been found in these water systems as well as in drinking
water at temperatures below 15ºC (Wullings and van der Kooij, 2006). Rusin et al.,
(1997) suggested that drinking water could be a significant source of infection with
Legionella (Rusin et al., 1997). Restrictive values for Legionella in drinking water
supplies are however not set as Legionella are considered pathogenic only when
inhaled and not when consumed (UK Water Supply (Water Quality) Regulations
2000).
12
1.7 Factors that influence Legionella growth
Various factors that influence and promote Legionella growth have been identified
since its initial identification back in 1976.
1.7.1 Physio-chemical factors
Legionella can survive extreme ranges of environmental conditions. It can survive
temperatures of 0ºC to 63ºC and has been found in waters at temperatures between
5ºC and 63ºC but significantly more Legionella has been isolated from warm waters at
temperatures of 30ºC and above. Legionella can also survive a wide pH range of 5.0-
8.5 and a dissolved oxygen concentration in water of 0.2 to 15 mg/l. L. pneumophila
grows best at a pH of 5.5 to 6.2 with an oxygen concentration of 6.0 to 6.2 mg/l.
However, Legionella species were found in an extremely acidic, predominantly
eukaryotic algal biofilm community in Yellowstone National Park, US, at a pH as low
as 2.7. Small concentrations of salt (NaCl 0.1 to 0.5%) may also enhance the survival
of Legionella and it has been found in cooling systems using seawater (Fliermans et
al., 1981, Nguyen et al.,. 1991, Lee and West, 1991, Newsome, 2001, Sheenan et al.,
2005).
Metal plumbing components and associated corrosion products are also important
factors as these can provide iron and other metals that support the survival and growth
of Legionella in plumbing systems (States et al., 1985).
1.7.2 Microbial factors
The growth and survival of Legionella is affected by the presence of other organisms.
Studies have demonstrated that Legionella were incapable of growing in sterile water
because it required nutrients supplied by other micro-organisms, including bacteria
(Wadowsky and Yee, 1983), protozoa (Rowbottom, 1980), and cyanobacteria (Tison
et al., 1980).
Protozoa play an important role in the increase and spread of Legionella in
anthropogenic water systems and therefore in the occurrence of Legionnaires’ disease
(DeClerck et al., 2009). Legionella can infect and grow, similar as with macrophages,
13

inside protozoa to such an extent that the protozoan bursts releasing live Legionella
into water systems (Wadowsky et al., 1991, Nahapetian et al., 1991, Cirillo et al.,
1994, Kuiper et al., 2004, Berk et al., 2005).
Plate 1.2 Hartmannella vermiformis amoeba filled with L.pneumophila. (Holland/Özel, Robert Koch Institut)
Kuiper et al., (2004) demonstrated the intracellular growth of L. pneumophila in
amoebae, with 25.9% (± 10.5%) of the amoeba, Hartmannella vermiformis,
containing L. pneumophila on day 10 and more than 90% containing L. pneumophila
on day 14.
Hartmannella vermiformis containing Legionella were also isolated from hospital hot
water systems. The amoeba entered these systems through the mains water
distribution, open tanks and during maintenance (Rowbottom, 1986, Kilvington and
Price, 1990, Barker et al., 1992, Abu Kwaik et al., 1997, Rohr et al., 1998). The
protozoan Tetrahymena pyriformis containing L. pneumophila was found in tap water
at 35ºC (Fields et al., 1984), and Legionella were also observed multiplying within
Acanthamoeba species isolated from drinking water (Michel et al, 1998).
Tetrahymena pyriformis was also found to be a habitat for L. longbeachae found in
potting soil mixes (Steele and McLennan, 1996).
Protozoa provide not only nutrients for Legionella to grow but also protect Legionella
against adverse extracellular or environmental conditions such as high temperatures,
drying, chlorine and other biocides. With 1mg/l of chlorine, various bacteria including
Legionella, when contained within Tetrahymena and Acanthamoeba, required 60 to
200 times more contact time to kill 99% of the bacterial cells than if they were freely
suspended in water (Newsome, 2001), and L. pneumophila was recovered from
Acanthamoeba after exposure to 50mg/l of free chlorine for 19 hours (Kilvington and
Price, 1990).
14

Cirillo et al., (1994) showed that growth in protozoa also enhanced the ability of L.
pneumophila to enter human cells, and Brieland et al., (1997) found that parasitic L.
pneumophila were more pathogenic than free living L. pneumophila.
Micro-organisms, including Legionella, become attached to surfaces submerged in
water and form layers of microbial cells, called biofilms. Biofilms play an important
role in the spread of Legionella as they also provide nutrients for their growth and a
protective environment enabling them to survive water treatment processes (Kuchta et
al., 1993, Lin et al., 1998, Barbeau et al., 1998, Atlas, 1999, Kuiper et al., 2004,
Newsome, 2001).
A study carried out in 1994 showed that Legionella were more easily detected from
swab samples of biofilm than from flowing water, which suggested that the majority
of Legionella were essentially biofilm associated (Rogers et al., 1994).
Legionella cells persisting in biofilms (sessile Legionella) are also much more
resistant to disinfectants than the planktonic, free-living, cells (Cargill et al., 1992,
Stewart and Costerton, 2001, Tachikawa et al., 2005).
15
1.8 Biofilms
Biofilms are widespread in nature and can be found on the surfaces of pipes in any
anthropogenic water system. As well as through attachment to surfaces, biofilms may
also form suspended in water, also referred to as ‘floating biofilms’ (Declerck et al.,
2007a).
Biofilm formation occurs as a result of the following events:
Plate1.3 Biofilm formation. Graphic by Peg Dirckxand David Davies. 2003 Center for BiofilmEngineering Montana State University.
1. Microbial surface attachment.
2. Irreversible attachment
3. Maturation stage I
4. Maturation stage II
5. Dispersion
Microbial attachment is the first step in the colonization of surfaces (1) and precedes
the process of consolidation, during which the initially weak adhesive forces are
strengthened by exopolymer formation (2). When irreversibly attached, the micro-
organisms continue to multiply forming micro-colonies or stacks (3 and 4). Portions
of these stacks can shear off and colonize other parts of the system (5) (Denyer et al.,
1993).
1.8.1 Factors supporting biofilm formation
Water flowing around biofilms carries nutrients, supporting growth and re-growth,
and aiding colonization downstream (Le Chevalier et al., 1988, Morton et al., 1998,
Newsome, 2001, Murga et al., 2001).
16

Biofilms are more likely to form where there are areas of low water flow and where
water is allowed to stagnate. Biofilms are, therefore, found in anthropogenic water
systems in dead-end pipes, which are closed at one end through which no water
passes, and dead-leg pipes, through which water only passes when there is draw-off
from the fitting (Donlan, 2002).
Liu et al., (2006), found, however, the lowest biofilm-associated Legionella counts
with a stagnant flow and the highest counts with a turbulent flow. This could be
explained by the fact that turbulent flow results in a higher overall mass transfer rate
compared with laminar flow. Mass transfer can be described as the efficiency of
suspended solids (nutrient) delivery from the bulk phase (flowing water) to the
attached phase (biofilm). A higher mass transfer rate would result in greater particle
deposition onto the pipe surface. It could be possible that turbulent flow increases
oxygen and nutrient availability at the attachment surface, which in turn may lead to
an increase in Legionella under turbulent conditions. The lowest concentration of
Legionella recovered from stagnant flow pipes could be explained by the limited
availability of oxygen and nutrients under these conditions (Lui et al., 2006).
Temperature also is an important factor in the formation of biofilms. Villanueva et al.,
(2010) found that although biofilms developed at temperatures as low as 11ºC,
formation was faster when the temperatures were higher (Villanueva et al., 2010).
A study by Else et al., (2003) found that when the temperature was held at 30°C there
was an increase in values of heterotrophic plate counts per coupon of the materials
tested, which were stainless steel, nickel and titanium, but that when the temperature
was held at 60°C and 70°C, the counts decreased for all three coupon types to
undetectable levels (Else et al., 2003).
Materials such as synthetic rubber (ethylene-propylene rubber), polyethylene and
copper are commonly used in water distribution systems. These materials can
encourage or resist biofilm formation.
Studies have demonstrated that synthetic rubber encourages biofilm formation
(Schofield and Locci, 1985, Keevil et al., 1993, Rogers et al., 1994, BSRIA Technical
Note TN 9/96). The persistence of L. pneumophila in water systems was also
attributed to their survival within biofilms on rubber materials in taps and showers17

(Colburne et al., 1984b, Schofield and Locci 1985, Memish et al., 1992). Rubber
grommets within a cooling tower probably provided a nidus of infection which caused
Legionnaires’ disease in 16 patients of the Glasgow Royal Infirmary. (Timbury et al.,
1986). Shock absorbers, installed within water lines to absorb pipe vibration, usually
consist of an inflatable balloon that is made of synthetic rubber and that is in constant
contact with water (Timbury et al., 1986). Memish et al., (1992) found that these
absorbers were a reservoir for Legionella in one hospital, due to Legionella sloughing
off from biofims that had formed on the rubber surfaces of the absorbers (Memish et
al., 1992).
Biofilms have been found on the surfaces of synthetic rubber lined flexible hoses,
which are often used in water systems to connect pipes to taps. Investigations into the
occurrence of Legionella in hospitals have shown that some rubber lined flexible
hoses were heavily infected with biofilm which included Legionella (Water
Regulations Advisory Scheme, January 2006, EPDM (Ethylene Propylene Diene
Monomer (M-class) Rubber Flexible Hoses). A 2010 alert by the UK Department of
Health highlighted the removal of rubber lined flexible hoses due to the risk of
colonization that they present (Estates and Facilities Alert Department of Health Ref.
DH (2010) 03. 05/05/10).
Polyethylene also seems to encourage biofilm formation. Biofilm formation was
found to be higher on polyethylene pipes than on copper pipes by Van der Kooij, et
al., (2005).
Copper seems to resist biofilm formation because copper is naturally biocidal
(Schofield and Locci, 1985, Keevil et al., 1993, Rogers et al., 1994, BSRIA Technical
Note TN 9/96).
Iron pipes coated with a protective coating of zinc, called galvanized pipes, are also
used in water distribution systems. The corrosion rate of the protective zinc layer
increases at temperatures in the range of 55ºC to 95ºC, exposing the underlying iron.
Iron pipes facilitate the development of tubercles due to the iron hydroxide or loose
porous rust slowly transforming into a crystallized form. If other ions like calcium or
carbonate are present they make a variety of precipitates that mix in with the iron
hydroxide producing a crusty twisted coating which can grow into convoluted shapes
(tubercles), see plate 1.4 below. These tubercles can affect the flow of water and
18
because they also absorb organic material they can provide nutrients and a habitat for
micro-organisms including Legionella (Haas et al.,1983, BSRIA Application Guide
Ag 2/93, Camper, 1996, Geldreich and Le Chevalier, 1999, www.corrosion-
doctors.org).
Plate 1.4. Inner surfaces of an eroded galvanized pipe. (ProEconomy Ltd, 2006)
Biofilm formation can be higher on rough surfaces because the ‘valleys’ present can
allow microbes to reside in a protected area with reduced shear forces and the surface
roughness can provide a surface with increased surface area for bacterial attachment
(Donlan, 2002).
Micro-organisms have also been found to attach more rapidly to hydrophobic than
hydrophilic surfaces (Donlan, 2002, Flemming and Wingender, 2001a), and corrosion
of pipes and scale formation on pipes attracts nutrients which also aids bacterial
attachment and biofilm formation (Research meeting, University of Plymouth, 2009).
Biofilm formation can vary depending upon the characteristics of the micro-organisms
forming the biofilms, and is influenced by an interbacterial communication
mechanism, called quorum sensing (Sauer et al., 2002).
Bacteria can oppose or promote Legionella attachment. For instance, Schofield and
Locci, (1985), found that Flavobacteria aided the attachment of Legionella, and
Mampel et al., (2006), observed attachment of L. pneumophila to biofilms formed by
Empedobacter breve, Microbacterium sp. and Acinetobacter baumanii but not to
Pseudomonas species, Corynebacterium glutamicum or Klebsiella pneumoniae
biofilms.
19

Biofilm formation is also aided by protozoa grazing the surfaces of biofilms which
causes the loss or ‘sloughing’ of parts of biofilms which then colonize other parts of
the system (Keevil et al., 1993, Abu Kwaik et al., 1997).
Jass et al., (1995) used a chemostat coupled modified Robbins device to monitor the
colonization of soil isolates, P. fluorescens and P. putida, on silastic rubber surfaces.
The authors found that P. fluorescens formed confluent dense biofilms in less than 24
hours, whereas P. putida adhered as single cells or microcolonies after the same
period (Jass et al., 1995).
20
1.9 Detecting Legionella in water systems
The association of Legionella with protozoa and its occurrence within biofilms, in
which they hide, complicates its detection.
The current standard and validated technique for detecting Legionella in water is
based on culturing for Legionella (ISO 11731:1998). This technique is however
lengthy and complex, and detects only planktonic, free-living, and extracellular
Legionella.
Rapid molecular tests for the detection of Legionella Deoxyribonucleic Acid (DNA)
have been developed (Mahbubani et al., 1990). Although these tests detect planktonic,
sessile, extracellular and intracellular Legionella, nonviable Legionella cells are also
detected. Since it is likely that water samples contains nonviable Legionella cells,
which were killed by disinfection measures, false-positive readings of Legionella
samples are possible which could lead to unnecessary and expensive emergency
decontamination procedures (Shih and Lin, 2006).
21

1.10 Models built to examine biofilm formation and Legionella growth on plumbing
materials
Schofield and Loci (1985), built a model hot water system to examine the survival of
L. pneumophila and the formation of biofilms on different materials, see Figure 1.1.
The model consisted of a 1 litre conical flask, which acted as a reservoir and was
connected via a flow meter and peristaltic pump to three glass chambers; one chamber
contained twisted strips of copper; one contained twisted strips of stainless steel and;
one contained glass beads interspersed with aluminium discs. The outflow silicone
tubes from the top of the chambers were connected and returned, via a sample port, to
the conical flask. The temperature of the reservoir was controlled by placing it in a
water bath. When fluid was actively circulating the temperature was kept at 45ºC.
During static phases the temperature was allowed to drop to ambient. The water was
circulated. Ten weeks after the start of the experiment the apparatus was dismantled
and samples were taken for examination. The materials sampled included the rubber
plugs on top and bottom of each chamber, the connecting silicone tubing, the glass
beads and the copper and stainless steel twisted strips.
Figure 1.1 Diagram of the model hot water system. A, water bath; B, flow meter; C, peristaltic
pump; D, rubber-stoppered glass tube containing copper turnings; E, rubber stoppered glass
tube containing stainless steel turnings; F, rubber-stoppered glass tube containing glass beads
and aluminium discs; G, sample port; H, air pump; I, return flask. All tubing was a silicone
(Schofield and Loci 1985).
The authors observed that mats of cells and slime-like debris were heaviest on natural
rubber and least on copper materials. Abundant growth of L. pneumophila on rubber
22
was also observed. L. pneumophila also appeared to be able to colonize silicone
tubing and adhere to stainless steel (Schofield and Loci, 1985).
Keevil et al. (1993) and Rogers et al. (1994) used a model water distribution system,
which consisted of two glass vessels linked in series to analyse biofilm formation on
plumbing materials, see Figure 1.2. The first (seed) vessel simulated a storage tank,
and the second (biofilm) vessel (which was constantly fed by the seed vessel)
modelled the distribution system. Biofilms were generated in the second vessel by
inserting 1cm2 coupons of sterile plumbing materials, commonly used in the
construction of water systems, into the culture suspended on titanium wire. The model
system was run continuously for the duration of the work. Each experiment had
plumbing materials of only one type. The coupons were removed and tested after 1, 4,
7, 14, 21 and 28 days from the onset of each experiment.
Figure 1.2 Continuous-culture biofilm model. A, pH monitoring; B, oxygen/stirrer control; C,
temperature control; D, plumbing material coupon (Keevil et al., 1993, Rogers et al., 1994).
The pH was monitored but not controlled. The temperatures of the vessels were
maintained between 20ºC and 60ºC. The temperature was corrected with an external
heater pad beneath the fermenters. Dissolved oxygen tension was maintained at 20%
of air saturation via feedback control of the stirrer speed.
23
Keevil et al., (1993) found that copper supported sparse microbial growth and
Legionella comprised a very low proportion of the population. The low colonization
of copper surfaces was presumed to be due to the inhibitory effect of copper ions,
either by selectively inhibiting Legionella or by inhibiting the organisms that support
their growth. The most prolific biofilms were those that developed on the surface of
elastomeric materials. The biofilm covered the entire elastomer surfaces after only 24
hours and contained more than 8.9x10⁶cfu/cm2 on latex and 2.7x10⁶cfu/cm2 on
ethylene propylene rubber. The highest populations of L. pneumophila were found on
latex as well (Keevil et al., 1993).
Rogers et al., (1994) found that the lowest concentration of flora was on the stainless
steel surface and that the latex and ethylene-propylene rubber were most heavily
colonised. Of the plastic materials used, polyethylene appeared to be most heavily
colonised (Rogers et al., 1994).
Three full size hot and cold water services rigs were constructed by the Building
Services Research and Information Association (BSRIA) in 1996 to evaluate the
efficacy of temperature and copper and silver ionization techniques to control
Legionella, see Figure 1.3. Each rig replicated the water system of a small home for
the elderly. Two of the rigs were fitted with ionization water treatment from
silver/copper alloy electrodes and were operating at reduced hot water temperatures;
one was filled with hard water and one with soft water. The third rig relied solely
upon temperature as disinfection and was filled only with hard water. The cold water
system in each rig consisted of a glass reinforced plastic cistern, which served a cold
water copper pipework circuit of 30m in length, which included two cold taps and one
shower. The hot water system consisted of a vertical hot water storage calorifier of
copper construction, which served a hot water copper pipework circuit of 40m length,
which included two hot taps and one shower. Copper and glass reinforced plastic
coupons were inserted at various locations in each rig. These coupons were regularly
removed for biofilm and Legionella analysis.
24
Figure 1.3 Schematic of the BSRIA test facility (BSRIA Technical Note TN6/96).
Legionella and heterotrophic bacteria were recovered from the biofilms that had
formed on the copper and glass reinforced plastic coupons before copper and silver
ionisation was applied but numbers were only significant on the glass reinforced
plastic coupons and not on the copper pipework because this appeared to be naturally
biocidal (BSRIA Technical Note TN 9/96).
The effects of stainless steel, polyethylene and copper pipe materials on the promotion
of biofilm formation and growth of Legionella were investigated using a model
system that simulated domestic consumption of hot tap water at a water temperature
of around 37ºC by Van der Kooij et al. (2005), see Figure 1.4. The system included 3
separate identical electric water heaters fed with cold tap water. The water was not
25
stored and the heated water was re-circulated. Each heater fed either two duplicate
stainless steel, or copper or polyethylene pipes. These pipes were 5.9m long and
included four pipe segments, each with a length of 15cm, for biofilm analysis. The
pipe segments were frequently removed for biofilm and Legionella analysis (Van der
Kooij et al., 2005).
Figure 1.4 Diagram of the model warm water system. P1 and P2, pipes of the test material.
P3, PVC-C pipe for the supply of warm water. P4, PVC-C pipe for recirculation. Tap 1 and
Tap 2, sampling for collecting water from the pipes, Tap 3, heater outlet and sampling point
for collecting water from the heater (van der Kooij et al., 2005).
The results suggested that biofilm formation on the polyethylene surfaces was higher
than that on the copper and stainless steel surfaces and that Legionella concentrations
in water from the polyethylene pipes were more than 10 times higher than those from
the copper pipes. After about 2 years of operating the system the Legionella
concentrations from the copper pipes and surfaces were similar to those observed with
the stainless steel pipes (Van der Kooij et al., 2005).
26

1.11 Controlling Legionella in hot and cold water distribution systems
The risk from exposure to Legionella can be controlled by not allowing Legionella to
proliferate in water systems. However, Legionella contaminate anthropogenic water
supplies from the environment, and when these systems are contaminated, preventing
proliferation and gaining control of Legionella is difficult because Legionella survive
extreme ranges of conditions and grow and are protected in biofilms and in protozoan
cells.
Evidence suggested that, once, colonized, anthropogenic water systems, particularly
those in large complex buildings and hospitals, retain a relatively constant population
of Legionella for many years (Rangel-Frausto et al., 1999, Garcia et al., 2003, Perola
et al., 2005).
National legislation in most countries, however, enforces preventing or controlling the
risk of legionellosis. The Health and Safety at Work Act (HSWA) and the Control of
Substances Hazardous to Health Regulation (COSHH) make this obligatory in the
UK.
To comply with the UK legal duties, employers and those with responsibilities for the
control of Legionella in water systems of premises should identify and assess sources
of risk, prepare a scheme for preventing or controlling the risk, implement, manage
and monitor precautions, keep records of the precautions, and appoint a person to be
managerially responsible.
27

1.12 UK guidance for controlling Legionella
Practical advice on how to prevent or control Legionella in water systems is given in
the Health and Safety Executive’s Approved Code of Practice (L8) (ACoP, (L8),
2000). Specific guidance for National Health Trusts is given in the Department of
Health’s Technical Memorandum 04-01 (HTM 04-01, 2006).
Both documents recommend that hot and cold water distribution systems should be
designed to aid safe operation by preventing or controlling conditions which permit
the growth of Legionella and to allow easy cleaning and disinfection. Water supply
quality should always be of equivalent quality as mains water and the materials used
should avoid biofilm formation and Legionella growth. Water should flow
consistently and stagnation should be avoided.
The documents also recommend that prevention or control of the risk from exposure
to Legionella should include the use of water treatment techniques. The techniques
recommended for continuous control are:
1.12.1 Temperature control
Temperature control involves storing hot water at 60ºC and distributing it so that it
reaches a temperature of above 50ºC within one minute at outlets. Cold water
temperatures should be below 20ºC after running outlets for up to two minutes.
Whilst Dennis et al., (1984) reported that L. pneumophila serogroup 1 had a decimal
reduction time at 50ºC in-vitro, there is a lack of in-vivo controlled evaluation tests on
the efficacy of controlling Legionella at these temperatures.
Controlling Legionella by temperature may also not always be possible or practical.
The ACoP (L8), therefore, advises that alternative techniques instead of temperature
control can be used as long as proliferation of Legionella is prevented. The HTM 04-
01 document also recommends the use of alternative techniques but only together
with and not instead of temperature control.
28
The alternative techniques for continuous control described in the ACoP (L8) and
HTM 04-01 documents are:
1.12.2 Chlorine Dioxide
According to the ACoP (L8) levels of 0.5mg/l of chlorine dioxide can, if properly
managed, be effective against Legionella in hot water systems.
Chlorine dioxide is an oxidizing biocide with an extremely high oxidation potential,
which probably accounts for its potent bactericidal powers through inactivation of
critical cell enzyme systems or disruption of cell protein synthesis (Metcalf and Eddy,
1991).
It is a gas in solution that is typically generated on site at the facility. Methods for
producing chlorine dioxide include controlled mixing of chemical precursors or
electrochemical generation. Although only a limited number of controlled evaluations
have been published, chlorine dioxide has been used for water treatment in Europe
since the 1940s, and numerous systems have been installed in the US for Legionella
disinfection (Lin et al., 2011).
Compared to chlorine, chlorine dioxide has superior penetration into biofilms, it does
not produce carcinogenic by-products, and it is less corrosive, (Lin et al., 2011).
Studies have demonstrated that a chlorine dioxide residual at outlets of 0.3mg/l to
0.5mg/l controlled Legionella (Hamilton et al., 1996, Pavey and Roper, 1998, Hill et
al., 2000, Hood et al., 2000). It is, however, difficult to maintain such levels,
especially, in hot water systems. Sidari et al., (2004) reported that chlorine dioxide
residuals decreased with increasing distance from the application point and with raised
temperature (Sidari et al., 2004). Higher doses may, therefore, be necessary (Walker
et al., 1995, Makin, 1998, Harris and Rendell, 1999) although the Drinking Water
Inspectorate only allows a maximum of 0.5mg/l in drinking water
(www.dwi.defra.gov.uk). A prolonged time may also be necessary to demonstrate
significant reductions in the Legionella positivity rate (Lin et al., 2011).
29

1.12.3 Copper and silver ionization
Copper and silver ionization involves the continuous release of copper and silver ions
in water. The ions can be generated either by passing a low electrical current between
two pure copper and two pure silver electrodes or by passing a current between
copper and silver alloys, usually consisting of 70% copper and 30% silver.
The biocidal efficacy of copper and silver is well documented. The copper ion is
thought to be responsible for the cascading effect of copper toxicity in bacterial cells.
Suggested mechanisms involve an initial cell membrane compromise, followed by
rapid accumulation of copper ions in the bacterial cells, and subsequent protein
damage resulting in cell death and DNA degradation (Grass et al., 2011). It was
suggested that the silver ion primarily affected the function of membrane-bound
enzymes, such as those in the respiratory chain, through binding to thiol groups
(Bragg and Rainnie, 1974, McDonnell and Russell, 1999, Uchida et al., 2003).
Yamanaka et al., (2005) found, however, that the silver ion also readily infiltrated in
the interior of Escherichia coli, rather than residing in the cell membrane area, and
that one of the major bactericidal actions of the silver ion was caused by its interaction
with the ribosome and subsequent suppression in the expression of enzymes and
proteins essential to ATP production (Yamanaka et al., 2005).
Studies carried out in-vitro demonstrated that copper and silver ionization inactivated
L. pneumophila with 0.4mg/l copper and 0.04mg/l silver (Landeen et al., 1989, Lin et
al., 1996, BSRIA TN6/96). In-vitro studies also demonstrated that biofilm formation
was controlled with copper and silver ionization when levels of 0.4mg/l copper and
0.04mg/l silver were maintained (BSRIA TN6/96, Walker et al, 1997, Shih and Lin,
2010).
Evaluation tests of copper and silver ionization installed treating hot and cold water
distribution systems of hospitals mainly in the US showed that L. pneumophila was
controlled (Liu et al., 1994, Miuetzner et al, 1997, Liu et al, 1998, Stout et al., 1998,
Biurrun et al., 1999, Kusnetsov et al, 2001, Stout and Yu, 2003, Chen et al., 2008). A
residual effect of copper and silver throughout the treated systems was also observed.
(Lui et al., 1994, Lui et al., 1998).
30
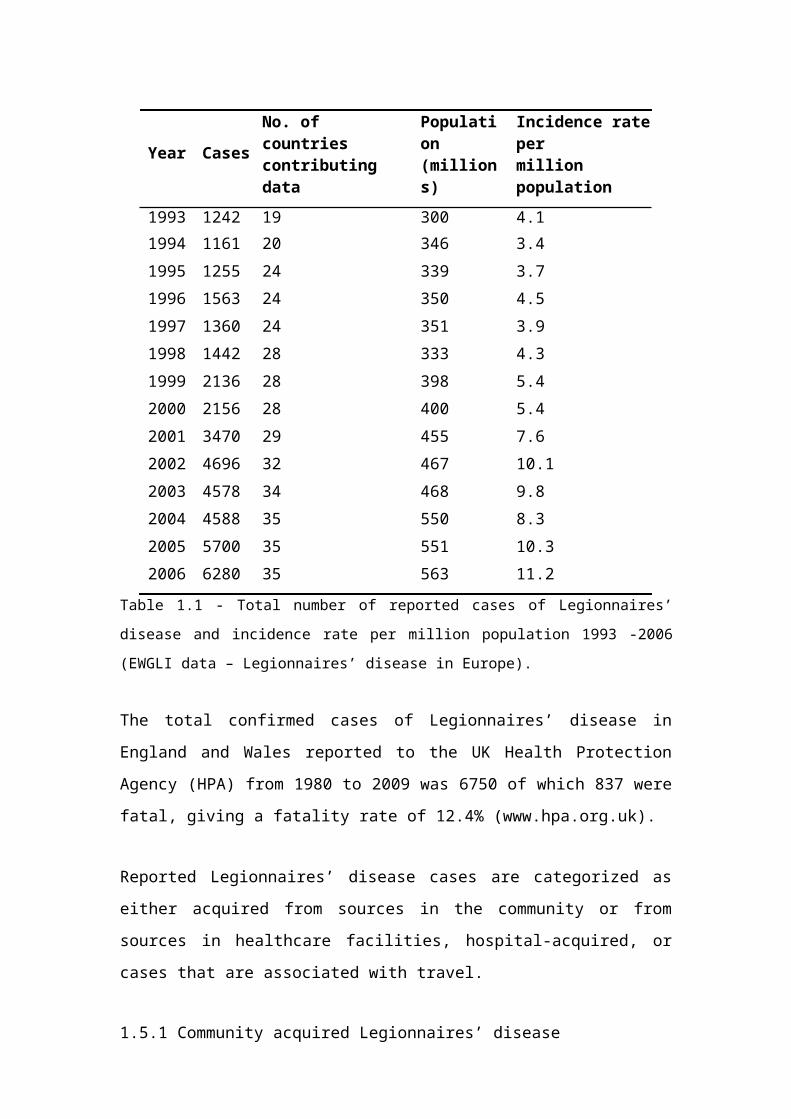
The ACoP (L8) and HTM 04-01 documents recommend concentrations for Legionella
control of 0.4mg/l copper and 0.04mg/l silver in hot water systems, and 0.4mg/l
copper and 0.02mg/l silver in soft water systems. Both documents advise, however,
that it can be difficult to maintain silver ion concentrations in hard water systems due
to build–up of scale on the electrodes and that the ionization process is pH sensitive,
which may need extra water treatments. The documents also suggest that it is difficult
to maintain silver ion concentrations above a pH of 7.6.
Although Lin et al., (2002), showed that there was no impact by hardness ions,
calcium and magnesium, on the biocidal efficacy of copper and silver ions, calcium
and magnesium ions can convert in water with a high pH into insoluble particles,
which can precipitate and cause rapid scale formation on the copper-silver electrodes,
potentially obstructing copper and silver ions release and reducing the presence of
copper and silver ions in the water (Lin et al., 2002).
Lin et al., (2002) demonstrated that a high pH had little effect on the Legionella
inactivation action of the silver ions and that at a pH as high as 9 only the copper ions,
at 0.4mg/l, failed to kill L. pneumophila, achieving only a 10-fold reduction in 72
hours. There is, however, a lack of studies on the influence of a pH above 7.6 on the
efficacy of copper and silver ionization in controlling Legionella in hot and cold water
distribution systems (Lin et al., 2002).
Copper and silver ions are positively charged ions (cations) and are attracted to
negatively charged ions (anions) in water, which can result in the formation of
insoluble chemical compounds, potentially resulting in less biocidal efficacy. A
chloride ion is an anion that enters water distribution systems via treatment processes
in which chlorine or chloride is used. It also enters water systems from run-off
containing road de-icing salts, the use of inorganic fertilizers, landfill leachates, septic
tank effluents, animal feeds, industrial effluents, irrigation drainage, and seawater
intrusion in coastal areas (www.who.int).
Lin et al., (2002) also demonstrated that as the chloride concentration in solution
increases, silver complexation reduces the available silver cations by 56% at 15mg/l
31
chloride to 26% at 50mg/l chloride. The authors suggested that it was possible that
chloride concentrations in water may decrease the availability of silver cations and
reduce its biocidal potential (Lin et al., 2002). Studies evaluating the affect of chloride
on the efficacy of copper and silver ionization in controlling Legionella in hot and
cold water distribution systems are, however, lacking.
One French hospital reported failure of copper and silver ionization (Blanc et al.,
2005). According to Lin et al., (2005) this could have been due to a phosphate
compound that was added to the water system to control corrosion, which may have
interfered with the efficacy of ionization (Lin et al., 2005). Although a reduction of
the biocidal effect of copper and silver has been reported when copper and silver were
complexed by phosphates in-vitro (Wuhrmann and Zobrist, 1958, Zevenhuizen et al.,
1979, Landeen et al., 1989), there is a lack of studies on the influence of phosphates
on the efficacy of copper and silver ionization in controlling Legionella in hot and
cold water distribution systems.
In two German hospitals copper and silver ionization systems were unable to control
Legionella. Possible resistance of Legionella against the metal ions was suggested as
the reason for the lack of control (Rohr et al., 1999, Mathys et al., 1999). According
to Lin et al., (2011), the lack of control in the hospitals was more likely due to the
concentration of the silver ions being below the recommended levels at 0.01mg/l (Lin
et al., 2011).
Long term treatment with copper and silver ions could, however, theoretically result
in the development of resistance to these ions, although Chopra, (2007), suggested
that copper and silver resistance is metabolically expensive for bacteria (Chopra,
2007), which could make resistance less likely. Although studies have demonstrated
development of resistance in Salmonella, Pseudomonas, Enterococcus, Klebsiella,
and E. coli (McHugh et al., 1975, Bridges et al., 1979, Haefeli et al., 1984, Kaur and
Vadehra 1986, Solioz and Odermatt 1995, Silver, 1996, Gaillard and Webb, 1997,
Gupta et al., 1999, Gupta, et al., 2001), resistance has not yet been demonstrated in
Legionella. Studies on Legionella resistance affecting the efficacy of copper and silver
ionization in controlling Legionella in hot and cold water distribution systems are,
however, lacking.
32
Kuchta et al., (1995) showed that copper and silver ions inhibit the amoeba H. vermiformis. Rohr et al., (2000) reported that the amoebas T. pyriformis and H. vermiformis were inactivated by 0.1mg/l of silver and 1mg/l of copper. Cassells et al.,
(1995), reported a T99 value of 3.9 minutes (exposure time required to achieve a 99%
reduction) of the amoeba Naegleria fowleri by 0.8mg/l copper and 0.08mg/l silver with 1mg/l of free chlorine (Cassells et al., 1995).
At present, each country in Europe specifies individual maximum permitted copper
and silver levels for water intended for human consumption. These levels apply until
maximum concentration values for copper and silver are given in the European
Council Biocidal Products Directive (98/8/EC).
The UK Water Supply (Water Quality) Regulations 2000 and the European Council
Directive 98/83/EC, which currently govern the maximum permitted levels of a range
of substances in water intended for human consumption in the UK, revealed a
surprising situation in the case of silver as the regulations and the directive do not
specify a maximum concentration value for silver. Theoretically, this state of affair
allows any level of silver to be used. It could also mean, however, that previous
permitted levels should be applied, which would be, if silver is used in a water
treatment process, 0.08mg/l (The UK Water Supply (Water Quality) Regulations
1989). Levels for copper are much more clearly defined, with a maximum permitted
level of 2mg/l being specified in the UK Water Supply (Water Quality) Regulations
2000.
The US Environmental Protection Agency (EPA) has set maximum concentration
levels for drinking water of 1.3mg/l for copper and 0.1mg/l for silver (Lin et al.,
2011).
The World Health Organisation (WHO) gives a guideline value for copper in drinking
water of 2mg/l. No specific guideline value for silver is given because there are no
adequate data with which to derive a health-based guideline value in drinking water.
The guidelines advise, however, that silver, up to 0.1mg/l, in drinking water gives a
total dose over 70 years of half the human no observable adverse effect level
33
(NOAEL) of 10g, and, therefore, could be tolerated without risk to health (WHO
Guidelines for Drinking Water Quality, 2011).
Being biocidal, copper and silver fall within the scope of the European Council
Biocidal Products Directive (98/8/EC) and evidence has to be presented to the Council
that they do not pose significant risk to humans, animals or the environment.
Task Forces were created to share the costs for the preparation and evaluation of
technical dossiers specifying copper and silver toxicity and assessing the risk of
exposure to copper and silver. Dossiers were submitted to the relevant authorities for
evaluation. These authorities are currently assessing the dossiers so that an acceptable
copper and silver value can be determined, which will be then be published in the
European Council Biocidal Products Directive (98/8/EC).
However, due to its extensive use in the photographic industry, considerable research
has already been carried out upon the effects of silver in the environment. Although
laboratory investigations have indicated that it is potentially very toxic with acute
toxicity values of 0.023mg/l to 0.357mg/l for saltwater invertebrates, it seems to have
little actual impact upon organisms in an ecosystem. This could be due to its readiness
to form complexes with a wide variety of substances, so reducing its availability for
absorption, which reduces toxicity and the biocidal effectiveness of silver in an
ecosystem. Bioaccumulation data also suggest that it is not concentrated in species to
any great extent. Copper shows a higher level of bioaccumulation, although again it
does not seem to be regarded as presenting any significant risk to the environment.
There is also no indication of substantive biomagnification occurring in the case of
either metal.
When assessing the level of toxicity of copper and silver to humans, instances of
fatalities caused by acute copper poisoning have been recorded, although doses
required were considerable. Instances of acute silver poisoning, however, are
unknown. Cases of chronic copper poisoning are rare, whilst for silver the only known
long term effect of ingesting quantities of the element is argyria, a condition in which
skin and hair are heavily discoloured by silver in the tissues. Silver in particular seems
to be readily excreted from the body, only a small percentage of silver is absorbed,
retention rates in humans and laboratory animals range between 0% and 10%. The34
evidence available indicates that neither copper nor silver is carcinogenic or
mutagenic, despite extensive exposure via water pipes in the former and therapeutic
and industrial use of the latter. With regard to teratogenicity, the few studies done for
silver suggest that it is not toxic in this respect. More studies have been done on
copper but results are conflicting (Bedford, 2003).
35
1.12.4 Ozone (O3) and Ultraviolet Light (UV)
According to the ACoP (L8) and HTM 04-01 documents Ozone (O3) and UV light are
not intended to be dispersive and are designed to have their effect only at or very close
to the point of application.
Ozone (O3) is a powerful oxidizing agent, far more powerful then oxygen (O2). It is
generally believed that bacterial kill through ozonation occurs directly because of cell
wall disintegration (cell lysis). Ozone is generated either from air or pure oxygen
when a high voltage is applied across the gap of narrowly spaced electrodes. It is,
however, chemically unstable and decomposes rapidly to oxygen after generation and
must be generated on-site. (Metcalf and Eddy, 1991).
The effect of ozonation of supply water for one wing of an unoccupied hospital
building which had positive cultures for L. pneumophila from multiple potable water
fixtures was studied by Edelstein et al., (1982). Although mean ozone residual
concentrations of 0.79 mg/l eradicated L. pneumophila from the fixtures, the authors
suggested that whether or not ozone could be considered to be an effective biocide to
use for the eradication and continuous suppression of L. pneumophila in a potable
water system was not answered because L. pneumophila was also eradicated from by
non-ozonated water in the control wing fixtures (Edelstein et al., 1982).
In-vitro studies developed on a 38 litres plumbing system using ozone, among other
biocides, was evaluated by Muraca et al., (1986). The studies showed effectively
control of L. pneumophila by a residual concentration of 1 to 2 mg/l of ozone and the
data suggested that ozone could potentially remove L. pneumophila in a large water
distribution system. However, the authors also suggested that because of the rapid
decomposition of the ozone residual in water, its main utility may be limited as a
supplemental disinfectant (Muraca et al., 1986).
Several authors have also noted that corrosion could also be a potential problem with
the application of ozone (Bird, 1987, Keenahan, 1990, Ford, 1991), and Newsome,
(2001) suggested that the major problem with ozone was poor penetration to all parts
of the water system (Newsome, 2001).
36
UV light of wavelength 254nm can destroy bacteria. Legionella pneumophila has
been reported to be sensitive to UV dosages of 2500-7000µW-s/cm2 at 254nm (Antopol and Ellner, 1979).
Muraca et al., (1986) showed that UV irradiation at 30000µW-s/cm2 at 254 nm
produced a 5 log decrease in the concentration of L. pneumophila within 20 minutes.
(Muraca et al., 1986). Makin and Hart, (1992) found that during an 8-month period of
254 nm UV lamps being lit, no Legionella or amoebae were found in the water tested
at one shower (Makin and Hart, 1992).
Franzin et al., 2002 demonstrated that UV irradiation was useful to protect a water
system but only in a small area. UV irradiation was found to be effective only at the
point immediately after the UV light lamps but Legionella persisted especially at the
furthest point from the UV light. Because of the lack of residual activity, the authors
recommended combining UV irradiation with other methods of disinfection (Franzin
et al., 2002).
1.12.5 Intermittent disinfection of hot and cold water distribution systems
The ACoP (L8) and HTM 04-01 documents recommend that hot and cold water
distribution systems are cleaned and disinfected thermally or chemically when
inspections consider it to be necessary, if the system or part of it has been
substantially altered or entered for maintenance purposes in a manner which may lead
to contamination, and during or following an outbreak or suspected outbreak of
legionellosis.
Thermal disinfection is recommended to be carried out by ensuring that the
temperature at a calorifier is high enough so that the temperatures at the outlets do not
fall below 60°C. Each outlet should also be run sequentially for at least five minutes at
above 60ºC. The risk of scalding should be considered and particular care should be
taken to ensure that water services are not used, other than by authorised personnel,
until water temperatures have dropped to their normal operating levels.
As well as disinfecting water systems thermally, the ACoP (L8) and HTM 04-01
documents recommend that disinfection may also be carried out using oxidizing
37
chemicals such as chlorine dioxide, chlorine, and bromine. It is recommended that all
parts of the system are disinfected and not just those which are readily accessible.
When chlorine is used the free residual level in the cold water storage tank should be
between 20 and 50mg/l, which should be allowed to flow to all parts of the system by
successively opening the outlets in the system until there is a smell of chlorine. The
outlets should then be closed for an appropriate period, which depends on the chlorine
concentration – from at least one hour at 50mg/l to at least two hours at 20mg/l. The
chlorine concentration needs to be monitored throughout the disinfection process and
after disinfection the system should be thoroughly flushed.
The ACoP (L8) and HTM 04-01 documents point out that because chemical
disinfection is hazardous it may only be carried out by trained personnel and should
be closely supervised. All building occupants should also be warned.
The ACoP (L8) also advises that biodispersants may be needed to remove organic
fouling from pipework and that chemical descaling may also be necessary.
The HTM 04-01 document recommends that after disinfection, when water is run to
waste into a natural watercourse, or a drain leading to it, it should be de-chlorinated
using either sulphite or bisulphite or meta-bisulphite to avoid contamination.
1.12.6 Point-of-use filtration
The HTM 04-01 document briefly discusses using point-of-use filters in the
operational considerations part of the document.
The risk of exposure to Legionella in water systems can be controlled by attaching
0.2µm filters to outlets (Salvatorelli et al., 2005).
38
Plate 1.5 Outlet with point-of-use water filter attached (Sheffer et al., 2005)
Results of a study conducted on a water system of a hospital building in the US,
colonized with L. pneumophila, suggested that point of use filters can prevent
exposure of high risk patients to waterborne bacteria (Sheffer et al., 2005).
The HTM 04-01 document highlights that it is feasible for bacteria to colonize the
filter material. It is, therefore, recommended to replace the filters at appropriate
intervals in accordance with the manufacturer’s recommendations, typically at least
once a month.
39
2. AIMS AND OBJECTIVES
Hospital-acquired Legionnaires’ disease is linked to the presence of Legionella in
hospital water systems.
Results of studies suggest that cases of hospital-acquired Legionnaires’ disease are
reduced by the implementation of copper and silver ionization systems.
Measures to control Legionella in hospital water systems in the UK are recommended
in the HTM 04-01 documents. Little data is however available on the efficacy of these
measures.
Although the HTM 04-01 document recommend using copper and silver ionization as
an alternative measure, it is recommended to only be used together with and not
instead of temperature control. Temperature control is, therefore, seen by UK National
Health Trusts as the main control method.
The overall aim of this project is, therefore, to investigate the efficacy of controlling
Legionella by applying copper and silver ionization in UK hospital water systems and
to examine efficacy by applying the HTM 04-01 recommended temperatures, taking
into consideration the formation of biofilms on plumbing materials that are commonly
used.
The objectives of this project are:
(a) To study the efficacy of copper and silver ionization systems in controlling
Legionella in water systems of 10 hospitals in the UK.
(b) To study the efficacy of maintaining hot water temperatures above 50ºC after
running hot outlets for 1 minute in controlling Legionella in water systems in
the UK.
(c) To study the efficacy of maintaining cold water temperatures below 20ºC after
running cold outlets for 2 minutes in controlling Legionella in water systems
in the UK.
(d) To design and build small scale rigs to simulate circulating water flow systems
in copper and polyethylene piping to compare:
i. The growth of Legionella.
40
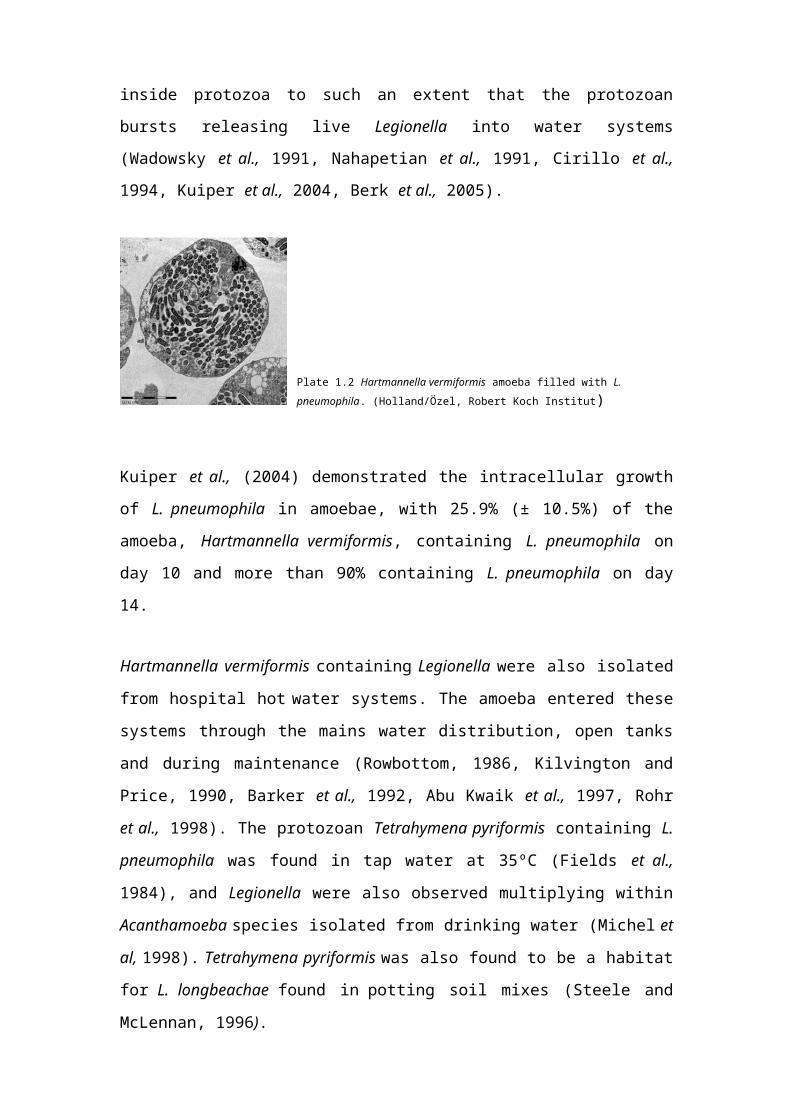
ii. The efficacy of controlling Legionella with elevated
temperatures.
iii. The efficacy of controlling Legionella with copper and silver
ionization.
(e) To evaluate the impact of chloride and phosphate on the efficacy of copper and
silver ionization in controlling Legionella in 10 hospital water systems in the
UK.
(f) To assess the growth of biofilms on plumbing materials commonly found in
hospital water systems in the UK using a Robbins device.
41
3. MATERIALS AND METHODS
3.1 Evaluation studies in UK hospitals
Studies on the efficacy of copper and silver ionization in controlling Legionella in
water distribution systems of hospitals in the UK were carried out. These studies were
conducted by contractual arrangement with these hospitals for control of Legionella.
Results of Legionella analyses that may have been carried out outside the contractual
arrangement with these hospitals before the copper and silver ionization systems were
activated were not available.
One set of samples was taken before activation of the systems from each hospital,
which were analysed for Legionella. Temperatures at the outlets were recorded
whenever samples were taken. The outlets selected were outlets that were identified as
being at risk of Legionella contamination and outlets that were known to be
contaminated. At least double the number of outlets was tested before activation of the
copper and silver ionization systems than after activation.
The probability of contamination at outlets at which Legionella were found before the
copper and silver ionization systems were activated would be higher than at outlets at
which no Legionella were found. Also due to financial limitations in the number of
samples to be analysed, the Legionella contamination at outlets at which Legionella
were found before activation was, therefore, primarily monitored after activation.
The water system near to outlets at which Legionella persisted after activation was
also investigated by taking samples for Legionella analysis from outlets close to the
Legionella contaminated outlets.
Table 3.1 below shows the approximate number of beds that accommodated these
hospitals, the date the copper and silver ionization systems were activated, the number
42
of outlets that were sampled before the systems were activated, and the number of
outlets that were sampled on a monthly basis after these systems were activated.
StudyApproximate
Date systemNumber of outlets Number of outlets
Frequency ofnumber of sampled before sampled after
hospital commissioned samplingbeds commissioning commissioning
1 800 11/09/2007 46 21 Monthly (21 outlets)
2 350 10/01/2008 30 15 Monthly (15 outlets)
3 70 04/02/2008 20 10 Monthly (10 outlets)
4 100 08/04/2008 12 6 Monthly (6 outlets)
5 550 25/07/2008 51 25 Monthly (20 outlets)
6 550 06/10/2008 60 25 Monthly (13 outlets)
7 150 25/11/2008 26 20 Monthly (13 outlets)
8 200 27/04/2009 45 22 Monthly (21 outlets)
9 100 03/08/2009 30 15 Monthly (15 outlets)*
10 850 21/12/2009 60 30 Monthly (30 outlets)
*- From September 2010 onwards samples were taken once every two months from 15 outlets
and once a month from 6 outlets.
Table 3.1 – Study hospitals - Size, number of sample outlets and sampling frequencies.
The copper and silver ionization systems installed in these hospitals were designed
and manufactured by ProEconomy Limited, Bedfordshire, UK.
43

3.1.1 The Orca copper and silver ionization system
With the Orca copper and silver ionization system, see Plate 3.1, water flows through
the turbine of a flow sensor, which sends a signal to a control unit. The control unit
then passes a low direct current between two 99.9% copper and two 99.9% silver
electrodes, housed in electrode chambers, called ‘Orca pods’. This causes the release
of copper and silver ions into the flowing water. To ensure that the necessary levels of
copper and silver are released by the system, the system has been designed to deliver
automatic adjustment taking into account variable flow rates and water qualities.
Copper and silver levels, electric current settings, and flow rates can be interrogated
remotely. The system is commonly installed on the mains water pipe.
Flow sensorControl unit
Electrode chambers
Draw off point
Plate 3.1 The Orca copper and silver ionization system (ProEconomy Ltd)
Potential formation of scale on the electrodes, which can obstruct the release of
copper and silver ions in hard water, is prevented with the Orca system by using pure
copper and pure silver electrodes instead of copper/silver alloys. This provides
controlled release of the copper and silver ions by being able to separately increase or
reduce the electrical current output, which is not possible when copper/silver alloys
are used. Also, the polarity of the electrodes is automatically switched from anode to
cathode and visa versa, which results in cations, such as calcium and magnesium ions,
that may have become stuck on the on the surface of the cathode, desorbing from its
surface when the polarity switches to anode.
44

3.1.2 Sampling and system maintenance procedures
Samples were taken before the copper and silver ionization systems were activated
and once a month after activation of the systems from pre-selected outlets of the water
distributions systems of the hospitals studied. These samples were analyzed by a
UKAS accredited laboratory for Legionella, copper and silver.
The outlets from which the samples were taken were either identified, through risk
assessments conducted by the hospitals, as being at risk of Legionella contamination
or were known to be contaminated with Legionella, therefore, potentially presenting a
risk of legionellosis in patients. Outlets identified through risk assessment as being at
risk of Legionella contamination were mostly outlets that were not or infrequently
used, cold outlets at which temperatures were not maintained below 20ºC, and hot
outlets at which temperatures were not maintained above 50ºC.
When samples were taken, the type of outlet that was sampled from was recorded,
showing if it was a single hot or cold, a mixer, a shower, or an assisted bath outlet.
When rubber lined flexible hoses and mixing valves were attached to the outlets, this
was also recorded.
The sample for Legionella analysis was taken after running the outlets for 1 to 2
minutes in a sterilized one litre plastic bottle which also contained 1ml of sodium
thiosulfate to de-chlorinate the sample. After the sample for Legionella analysis was
taken, the sample for copper and silver analysis was collected in a 125ml plastic bottle
containing 1ml of nitric acid to ensure that the metal content stayed in solution, free
from particulate matter. After the sample for copper and silver analysis was taken, the
temperature was recorded using a non-contact TN1 infrared thermometer, positioned
as close to the running water as possible.
The creation of aerosols was avoided when known Legionella contaminated outlets
were sampled by attaching a clean hose between the outlet and its drain, and, where
this was not possible, by running the outlet slowly, avoiding splashing. Samples from
showers that were known to be contaminated with Legionella were taken either by
dismantling the showerhead and attaching a clean hose between the outlet and its
drain, or, when this was not possible, by cutting a corner of a food grade plastic bag,
45
inserting the shower head into the plastic bag, securing the bag closed around the
shower head with an elastic band, and then running the water slowly into the sample
bottle, avoiding splashing.
The Legionella, copper and silver samples were placed in a carton box, away from
UV light. All samples were then transported to a UKAS accredited laboratory for
analysis.
When Legionella were found, the hospitals were advised to flush the contaminated
outlet, avoiding the creation of aerosols, to encourage the copper and silver levels and
to avoid water stagnation. Re-samples were also taken for copper, silver and
Legionella analysis immediately after opening the contaminated outlet and also after
running it for ten minutes. This was in-line with the recommendations given in the
ACoP (L8) and the HTM 04-01 documents, and the British standard 7592:1992.
The copper and silver ionization systems were checked monthly. Where necessary,
the electrodes were cleaned and re-gapped, worn electrodes were replaced with new
ones, and the control unit settings were adjusted.
Samples to determine the pH, chloride, and phosphorus levels in the water supply of
the hospitals were taken. These samples were taken where the water entered the
hospitals, and were also analyzed by a UKAS accredited laboratory.
The pH samples were taken in a clean and empty plastic 150ml bottle. The samples
for chloride analysis were taken in a clean and empty plastic 1 litre bottle and the
samples for phosphorus analysis were taken in a plastic 125ml bottle containing 1ml
of nitric acid to ensure that the phosphorus content stayed in solution, free from
particulate matter.
46
3.1.3 Study hospital 1
Study hospital 1 was a large site consisting of many buildings, built in the 1960s and
modernized over the years. The hospital accommodated approximately 800 beds.
The hospital’s water distribution system was complex and extensive. The temperature
regime, as recommended in the ACoP(L8) and HTM 04-01 documents, was applied as
the sole Legionella control measure but it proved to be difficult to maintain hot water
temperatures above 50ºC and cold water temperatures below 20ºC in some parts of the
hospital due to cross heating and poor insulation.
Approximately 1000 mixing valves had to be fitted to hot outlets to reduce the hot
water temperatures to non-scalding temperatures, below 45ºC. Water below 45ºC and
the debris that built up in the mixing valves was, however, considered ideal for
Legionella proliferation. Rubber lined flexible hoses and rubber fittings were also
attached to several outlets and water stagnation was possible due to poor use of outlets
and ward closures, which was also considered ideal for Legionella proliferation.
The water was supplied to the site via a mains pipe and was passed to two large
concrete tanks from which water was provided to the whole site. The storage capacity
of these tanks was approximately 600000 litres. The water was not softened.
One copper and silver ionization system with nine copper electrode chambers and
nine silver electrode chambers was installed treating the incoming mains supply
water, see Plate 3.2.
The system was installed on the incoming mains pipe before the two storage tanks.
The systems were commissioned on the 11th September 2007.
47
Flow sensors
Control unit
Electrode chambers
Plate 3.2. Photograph of the copper and silver ionization system installed in study hospital 1
The copper and silver ionization system installed was a digital system. The system
was activated when the storage tanks were filling up with water. The system,
therefore, released copper and silver ions into the storage tanks. The electrical currents
adjusted automatically to the different flow rates and could also be manually adjusted
to either increase or reduce the silver and copper ions output. The polarity of the
electrodes reversed automatically, from anode to cathode, every fifty seconds to
prevent scale build-up on the surfaces of the electrodes.
On the 05th September 2007, before the system was activated, samples were taken from 46 outlets.
On the 05th October 2007, after the system was commissioned, samples were taken from 21 outlets at which Legionella were found in the samples taken before the system was commissioned.
Samples were taken monthly from the 05th October 2007 onwards from 21 outlets.
48
3.1.4 Study hospital 2
Study hospital 2 was a smaller site with newer buildings than study hospital 1. The
hospital accommodated approximately 350 beds.
As well as with study hospital 1, the temperature regime was applied as the sole
Legionella control measure, which also proved to be difficult to maintain. Mixing
valves had to be fitted and rubber lined flexible hoses and rubber fittings were
attached to several outlets. Water stagnation was also possible due to poor use of
outlets and ward closures. This was considered ideal for Legionella proliferation.
The water was supplied to the site via a mains pipe and was passed to two small break
tanks, which prevented contamination of the mains water supply by incorporating an
air gap which stopped water from flowing backwards into the mains. From these
break tanks the water was passed to four underground concrete tanks, which supplied
approximately 26 roof tanks scattered around the site. The water was again not
softened.
One copper and silver ionization system, with eight copper electrode chambers and
four silver electrode chambers, was installed to treat the incoming mains supply. The
system was installed on the incoming mains pipe before the ‘break’ tanks, see Figure
3.1. The system was also digital, similar to the system installed in study hospitals 1,
and consisted of two control units controlling two flow sensors. The system was
commissioned on the 10th January 2008.
49
Figure 3.1 Schematic drawing of the copper and silver ionization installation in study hospital 2
Before the system was activated samples were taken from 30 outlets.
On the 04th February 2008, 3 weeks after the system was commissioned, samples were taken from 15 outlets. Six of these outlets were outlets at which Legionella were found in the samples taken before the system was commissioned.
Samples were taken monthly from the 04th February 2008 onwards from 15 outlets.
50

3.1.5 Study hospital 3
Study hospital 3 was a new hospital commissioned in 2007. The hospital
accommodated 70 beds over two floors. The temperature regime was the sole method
used to control Legionella in the water system.
The water system was less complex compared to study hospitals 1 and 2 but it was
again difficult to maintain temperatures, particularly, in the cold water system and
mixing valves had to be fitted to reduce hot water temperatures to non-scalding
temperatures. Rubber lined flexible hoses and rubber fittings were again attached to
several outlets. This was considered ideal for Legionella proliferation.
As with study hospital 1, the water was supplied to the site via a mains pipe and was
passed to two tanks from which water was provided to the whole site. The capacity of
these tanks was 20000 litres each. The water was again not softened.
One copper and silver ionization system, with two copper electrode chambers and two
silver electrode chambers, was installed to treat the incoming mains supply. The
system was installed on the incoming mains pipe before the two tanks, see Figure 3.2.
The system was digital, similar to the systems installed in study hospitals 1 and 2. The
system was commissioned on the 04th February 2008.
Figure 3.2 Schematic drawing of the copper and silver ionization installation in study hospital 3.
51
On the 04th February 2008, before the system was activated, samples were taken from 20 outlets.
On the 06th March 2008, after the system was commissioned, samples were taken from 10 outlets. Three of these outlets were outlets at which Legionella were found in the samples taken before the system was commissioned.
Samples were taken monthly from the 06th March 2008 onwards from 10 outlets. The outlet points were rotated from June 2010.
52
3.1.6 Study hospital 4
Study hospital 4 was built in the 1980s and accommodated approximately 100 beds.
The temperature regime was again the sole method used to control Legionella and the
advocated temperatures were being maintained. Mixing valves had to be, however,
fitted to reduce hot water temperatures to non-scalding temperatures and rubber lined
flexible hoses and rubber fittings were attached to several outlets, which were
considered ideal for Legionella proliferation.
The water was supplied to the site via a mains pipe and was passed to two tanks from
which water was provided to the whole site. The capacity of each tank was
approximately 20000 litres. The hot water was de-scaled by electronic de-scaling
devices.
One copper and silver ionization system, with three copper electrode chambers and
one silver electrode chamber, was installed to treat the incoming mains supply. The
system was installed on the incoming mains pipe before the two tanks, see Figure 3.3.
The system was digital, similar to the systems installed in study hospitals 1, 2, and 3.
The system was commissioned on the 08th April 2008.
Figure 3.3 Schematic drawing of the copper and silver ionization installation in study hospital 4.
On the 08th April 2008, before the system was activated, samples were taken from 12 outlets.
53

On the 24th April and the 07th May 2008 re-samples were taken from the outlets at
which Legionella were found in the samples taken on the 08th April.
Samples were taken monthly from the 07th May 2008 onwards from 6 outlets.
54
3.1.7 Study hospital 5
Study hospital 5 was a three storey building, built in the 1970s, which accommodated
approximately 550 beds.
The temperature regime was applied as the sole Legionella control measure but it
proved to be difficult to maintain cold water temperatures below 20ºC in some parts of
the hospital due to cross heating and poor insulation. Approximately 600 mixing
valves had to also be fitted to hot outlets to reduce the hot water temperatures to non-
scalding temperatures, rubber lined flexible hoses and rubber fittings were also
attached to several outlets, and water stagnation was possible due to poor use of
outlets and ward closures. This was considered ideal for Legionella proliferation.
The water was supplied to the site by a mains pipe, which was divided in two, one
side delivering water via two softening systems to a softened water storage tank, and
the other side delivering water to a raw water storage tank.
One copper and silver ionization system with four copper electrode chambers and two
silver electrode chambers was installed to treat the softened water and one copper and
silver ionization system with eight copper electrode chambers and four silver
electrode chambers was installed to treat the raw water. These systems were installed
on the incoming mains pipe before the storage tanks, see Figure 3.4. Because water
softening with salt reduces the concentration of positively charged ions (cations) in
the water, such as calcium and magnesium, it also reduces the concentrations of
copper and silver, which is why the system that treated the softened water was
installed after the softening systems.
55

Figure 3.4 Schematic drawing of the copper and silver ionization installation in study hospital 5
The copper and silver ionization systems installed were digital systems, similar to the systems installed in the other study hospitals. The systems were commissioned on the
25th July 2008.
Before the systems were activated samples were taken from 51 outlets. Samples were
taken from pure cold and pure hot outlets but in order to obtain a wider view of the
potential contamination of the cold and hot water system, samples were also taken by
filling the sample bottles half with hot water and half with cold water from 17 outlets.
Less than one month after the systems were commissioned, samples were taken, on
the 18th August 2008, from 25 outlets at which Legionella were found in the samples
taken before the systems were commissioned.
From the 18th August 2008 onwards, samples were taken once every month from 20 outlets.
56
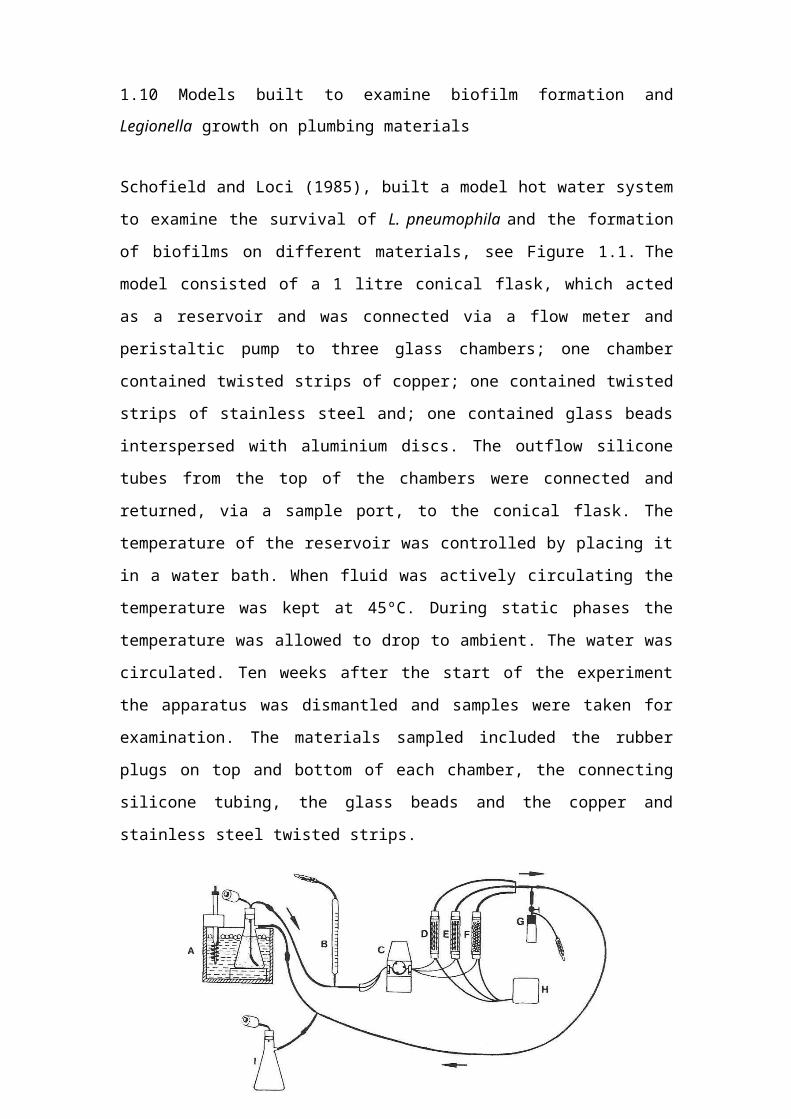
3.1.8 Study hospital 6
Study hospital 6 consisted of a combination of old and new buildings, dating from the
1950’s to 2005, spread over a large site. The hospital accommodated approximately
550 beds.
The temperature regime was applied as the sole Legionella control measure but it
proved to be difficult to maintain cold water temperatures below 20ºC in some parts of
the hospital due to cross heating and poor insulation. Approximately 600 mixing
valves had to also be fitted to hot outlets to reduce the hot water temperatures to non-
scalding temperatures, rubber lined flexible hoses and rubber fittings were also
attached to several outlets, and water stagnation was possible due to poor use of
outlets and ward closures. This was considered ideal for Legionella proliferation.
The water was supplied to the site via two mains pipes and also from a borehole. The
borehole water was used for the hot water supply. The water from the two mains was
used for drinking and the cold water supply. The water was passed to numerous tanks
around the site, all with varied capacities. The borehole water was softened. The water
from the two mains was not softened.
One copper and silver ionization system, with four copper electrode chambers and
four silver electrode chambers, was installed to treat the borehole water. As with study
hospital 5, because water softening with salt reduces the concentrations of copper and
silver, this system was installed after the softening systems and before the storage
tanks, see Figure 3.5.
One copper and silver ionization system, with four copper electrode chambers and two
silver electrode chambers, treated one of the two mains supplies, and one copper and
silver ionization system, also with four copper electrode chambers and two silver
electrode chambers, treated the other mains supply. These systems were installed
before the storage tanks, see Figures 3.6 and 3.7.
The systems were digital, similar to the systems installed in the other study hospitals.
The systems were commissioned on the 06th October 2008.
57
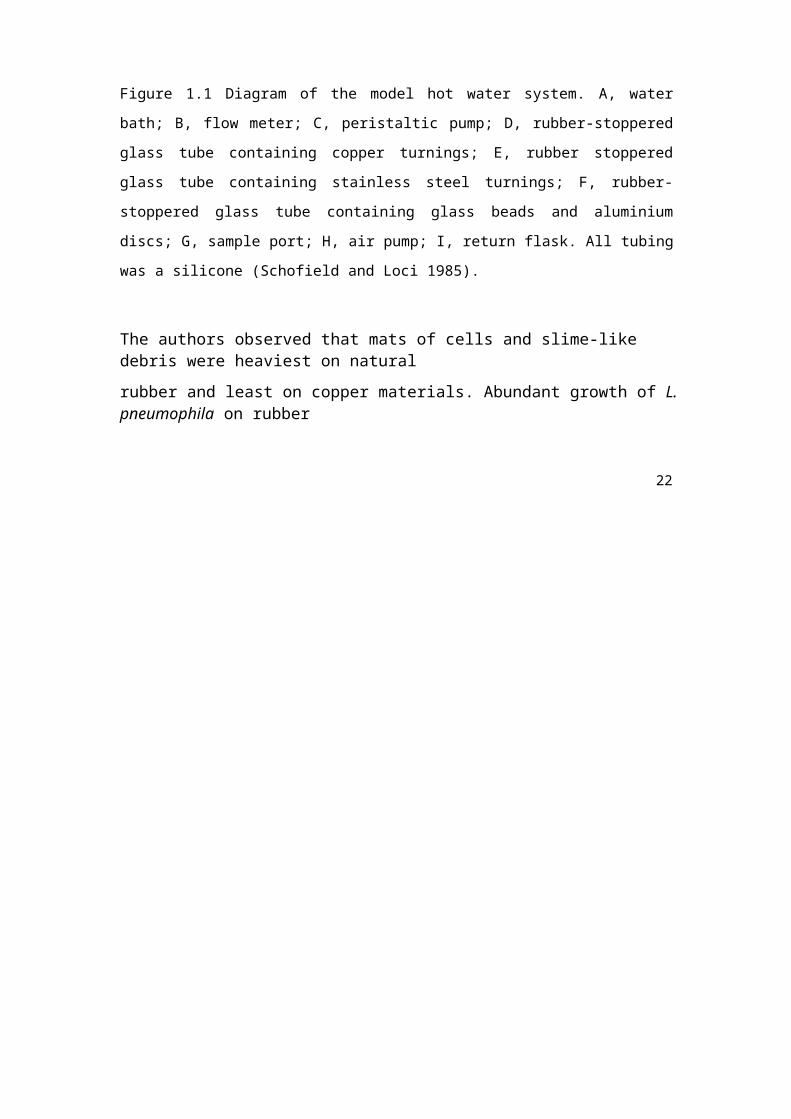
Figure 3.5 Schematic drawing of the copper and silver ionization installation in study hospital 6 –
Borehole
Figure 3.6 Schematic drawing of the copper and silver ionization installation in study hospital 6 –
Incoming mains 1.
58
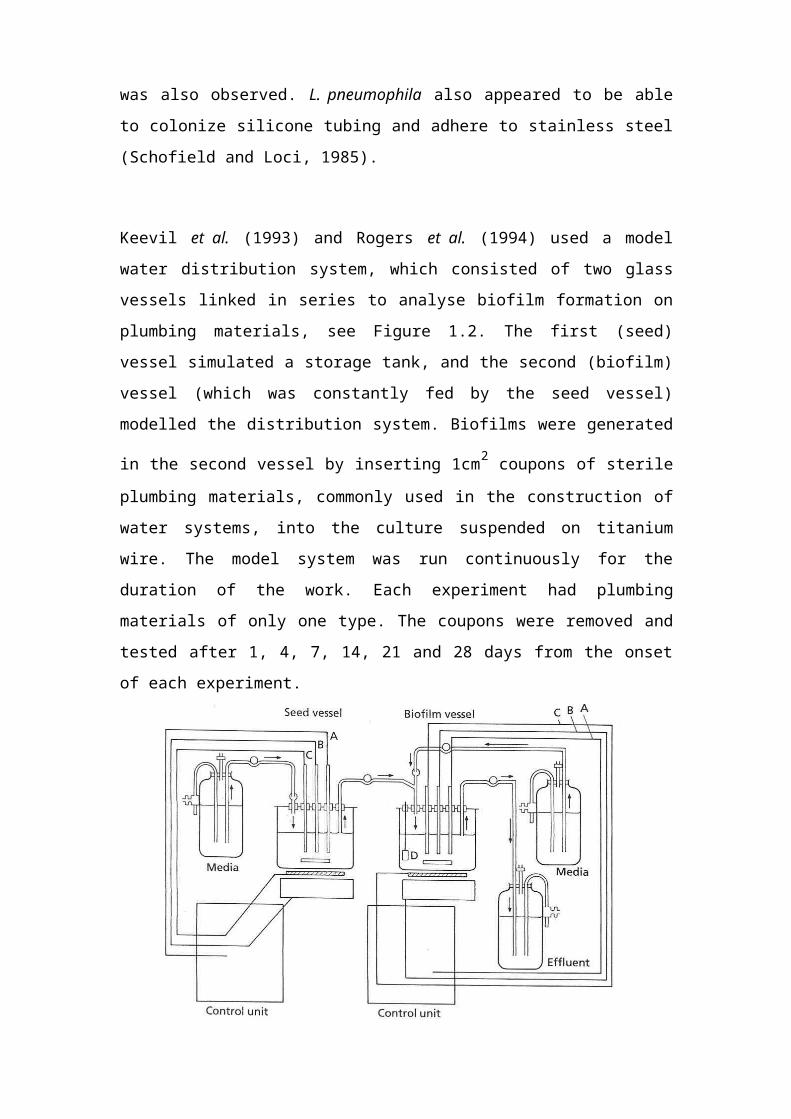
Figure 3.7 Schematic drawing of the copper and silver ionization installation in study hospital 6 –
Incoming mains 2
On the 02nd October 2008, before the systems were activated, samples were taken from 60 outlets.
On the 27th November 2008, after the systems were activated, samples were taken from 25 outlets. Eleven of these outlets were outlets at which Legionella were found in the samples taken before the systems were commissioned.
Samples were taken monthly from the 27th November onwards from 25 outlets.
59
3.1.9 Study hospital 7
Study hospital 7 was a combination of old and new buildings, dating back to the
1930s, that spread over a large site. These buildings accommodated approximately
150 beds in total.
The temperature regime was applied as the sole Legionella control measure but it
proved to be difficult to maintain cold water temperatures below 20ºC in some parts of
the hospital due to cross heating and poor insulation. Mixing valves had to also be
fitted to hot outlets to reduce the hot water temperatures to non-scalding temperatures,
and rubber lined flexible hoses and rubber fittings were also attached to several
outlets. This was considered ideal for Legionella proliferation.
The water was supplied to the site via two mains pipes and was passed to many tanks
with various capacities. The water was not softened.
One copper and silver ionization system, with two copper electrode chambers and two
silver electrode chambers, was installed to treat one of the incoming mains supplies,
and one system, with one copper electrode chamber and one silver electrode chamber,
was installed to treat the other incoming mains supply. Both systems were installed on
the incoming mains pipes before the storage tanks, see Figures 3.8 and 3.9.
The systems were digital, similar to the systems installed in the other study hospitals.
The systems were commissioned on the 25th November 2008.
60
Figure 3.8 Schematic drawing of the copper and silver ionization installation in study hospital 7 –
incoming mains 1.
Figure 3.9 Schematic drawing of the copper and silver ionization installation in study hospital 7 –
incoming mains 2
61
Before the systems were activated samples were taken from 26 outlets.
Six weeks after the systems were commissioned samples were taken, on the 05 th
January 2009, from 20 outlets at which Legionella were found in the samples taken
before the systems were commissioned. Samples were again taken on the 04th
February 2009 from 11 outlets at which Legionella were found in the samples taken
on the 05th January 2009.
Samples were taken monthly from the 04th February 2009 onwards from 13 outlets.
62
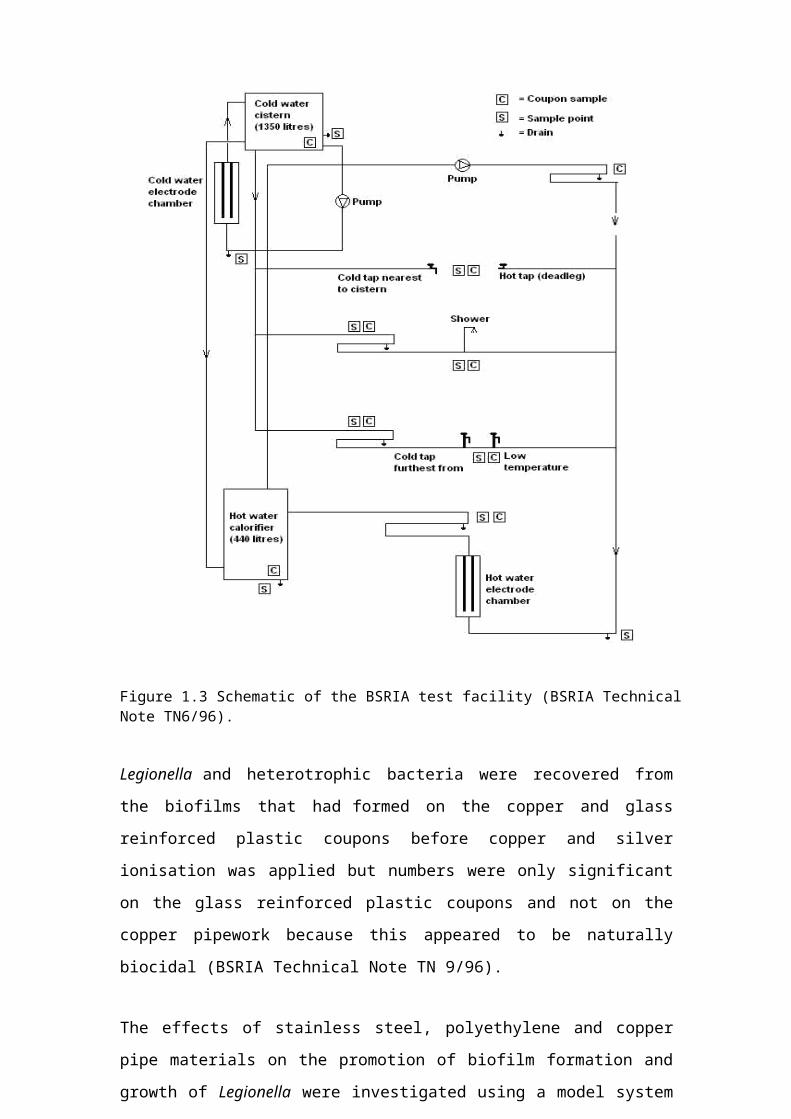
3.1.10 Study hospital 8
Study hospital 8 consisted of buildings going back to the Victorian times. The hospital
was, however, re-piped in 2000. The hospital accommodated approximately 200 beds.
The temperature regime was applied as the sole Legionella control measure but it
proved to be difficult to maintain the advocated temperatures in some parts of the
hospital. More than 600 mixing valves had to also be fitted to hot outlets to reduce the
hot water temperatures to non-scalding temperatures, and rubber lined flexible hoses
and rubber fittings were also attached to several outlets. This was considered ideal for
Legionella proliferation.
The water was supplied to the site via a mains pipe and was passed to two tanks both
with a storage capacity of 44000 litres, which supplied water to smaller tanks
throughout the buildings. The water was not softened.
One copper and silver ionization system, with eight copper electrode chambers and
four silver electrode chambers, was installed to treat the incoming mains supply. The
system was installed on the incoming mains pipe before the two large tanks, see
Figure 3.10. The system was digital, similar to the systems installed in the other study
hospitals. The system was commissioned on the 27th April 2009.
63
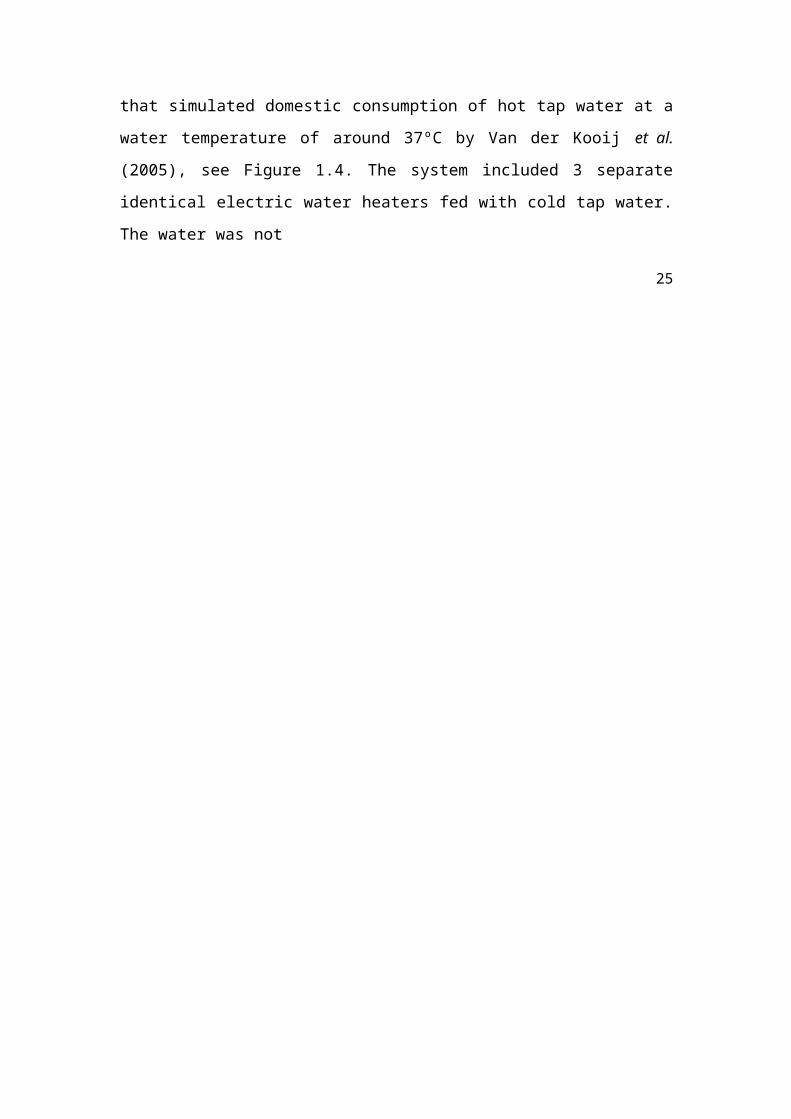
Figure 3.10 Schematic drawing of the copper and silver ionization installation in study hospital 8.
On the 27th April 2009, before the system was activated, samples were taken from 45 outlets.
One month later, on the 27th May 2009, samples were taken from 22 outlets. Eight of these outlets were outlets at which Legionella were found in the samples taken before the system was commissioned.
Samples were taken monthly from the 27th May onwards from 21 outlets.
64
3.1.11 Study hospital 9
Study hospital 9 was an orthopaedic hospital and consisted of a combination of new
and old buildings dating from the 1940s to 2003. The hospital accommodated
approximately 100 beds.
The temperature regime was applied as the sole Legionella control measure but it
proved to be difficult to maintain cold water temperatures below 20ºC in some parts of
the hospital due to cross heating and poor insulation. More than 100 mixing valves
had to also be fitted to hot outlets to reduce the hot water temperatures to non-scalding
temperatures, and rubber lined flexible hoses and rubber fittings were also attached to
several outlets. This was considered ideal for Legionella proliferation.
The water was passed around the site directly from the incoming mains. No storage
tanks were on site. However, from 2010 onwards extensive modifications to the water
distribution system included the installation of two storage tanks. The water was not
softened.
One copper and silver ionization system, with four copper electrode chambers and two
silver electrode chambers, was installed in an enclosure outside the hospital. The
system treated initially the mains water only. After the two tanks were installed the
system also treated the water before it entered the two tanks. The system was installed
on the incoming mains pipe, see Figure 3.11. The system was digital, similar to the
systems installed in the other study hospitals, and was commissioned on the 03rd
August 2009.
65
Figure 3.11 Schematic drawing of the copper and silver ionization installation in study hospital 9.
On the 29th July 2009, before the system was activated, samples were taken from 30 outlets.
On the 02nd September 2009, after the system was commissioned, samples were taken from 15 outlets, which included 13 outlets at which Legionella were found in the samples taken before the system was commissioned.
Samples were taken monthly from the 02nd September 2009 onwards from 15 outlets. From September 2010 onwards samples were taken once every two months from 15 outlets and once a month from 6 outlets.
Extensive construction work, including major modifications to the water system, see
Plate 3.3 below, were started in May 2010. This work was not completed at the time
of writing.
66
Plate 3.3 Study hospital 9 – photograph of construction work started in May 2010.
67

3.1.12 Study Hospital 10
Study hospital 10 is a nine-storey building, originally constructed in the 1960s and
added to since then. The hospital accommodated approximately 850 beds.
The temperature regime was applied as a Legionella control measure but it proved to
be difficult to maintain the advocated temperatures. The water system was, therefore,
also treated with chlorine dioxide. Legionella was, however, not controlled by both
measures and 3 patients contracted Legionnaires’ disease from Legionella that was
present in the water system.
The water was supplied to the site via one mains pipe and was passed to two large tanks. The hot water was softened. The softened water was stored in one of the tanks,
holding 320m3, and the raw water was stored in the other tank, holding 800m3.
One copper and silver ionization system with four copper electrode chambers and four
silver electrode chambers was installed to treat the softened water and water softening
with salt reduces the concentrations of copper and silver, this system was installed
after the softening systems and before the storage tank, see Figure 3.12.
One copper and silver ionization system with eight copper electrode chambers and
four silver electrode chambers was installed to treat the raw water. This system was
installed on the incoming mains pipe before the storage tank, see Figure 3.13. Both
systems were digital, similar to the systems installed in the other study hospitals. The
systems were commissioned on the 21st December 2009.
68
Figure 3.12 Schematic drawing of the copper and silver ionization installation in study hospital 10 –
Soft water.
Figure 3.13 Schematic drawing of the copper and silver ionization installation in study hospital 10 –
Raw water.
69
On the 15th December 2009, before the systems were activated, samples were taken
from 60 outlets.
One month later, on the 13th January 2010, samples were taken from 30 outlets, which included 15 outlets at which Legionella were found in the samples taken before the systems were commissioned.
Samples were taken monthly from the 13th January 2010 onwards from 30 outlets. From April 2011 onwards samples were taken monthly immediately after opening 30 outlets and also after running them for 2 minutes.
70
3.2 The copper and polyethylene rigs
Pneumonia is the leading cause of death in care residents and the risk of contracting
Legionnaires’ disease is, particularly, higher in the elderly. Legionella also tends to
proliferate more in blended water systems than in pure hot and pure cold water
systems.
Managing risk factors, such as a water temperature between 30ºC and 45ºC and the
presence of biofilms, can limit the growth of Legionella in these systems but these
factors can be difficult to manage, especially, in systems in which water is blended to
avoid scalding and in systems in which materials are used that can promote biofilm
formation.
Copper and polyethylene are plumbing materials that are commonly used in UK water
systems and experiments with model systems have indicated that polyethylene can
promote growth more than copper (Keevil et al., 1993, van der Kooij et al., 2005).
Although the model systems constructed for these experiments endeavoured to
replicate small hot water systems, they did not simulate a copper and a polyethylene
piped hot water system of a typical small hospital in the UK, in which water is stored,
blended and circulated. Biofilm formation and Legionella growth were also only
examined in these model systems and Legionella control measures were not tested.
For this project, copper and polyethylene piped rigs were, therefore, constructed to not
only examine the differences in biofilm and Legionella growth in copper and
polyethylene piped water systems that simulate a typical blended water system of a
small UK hospital but also to examine the effect of hot water temperatures of 50ºC
and the effect of copper and silver ionization at temperatures below 45ºC in
controlling Legionella in the rigs.
Initially two small scale rigs, simulating circulating hot water flow systems in copper
and polyethylene piping, were designed and built. Four more identical rigs were built
later on.
71
Each of these rigs consisted of 15mm diameter ‘push fitted’ pipe. For one rig copper
material was used, and for the other rig polyethylene pipe (PE-X) BS 7291 material
was used.
4 gallon PVC tank
Immersion heater
Pump
Sample/Draw off tap
Speedfit connector
Plate 3.4 Rig with copper push fitted piping.
72
4 gallon PVC tank
Immersion heater
PumpSample/Draw off tap
Speedfit connector
Plate 3.5 Rig with polyethylene push fitted piping.
In order to be able to collect samples to determine biofilm formation, the presence of
total viable counts and Legionella in biofilm, 24 removable sections were introduced
in each rig.
73
Figure 3.14 Rig plus 24 sections
These sections were connected by 15mm diameter ‘Speedfit’ pipe connectors on each
end, which were commonly used in water systems to connect pipes. A ‘Speedfit’
connector contained a collet which had stainless steel teeth that gripped the pipe. It
also contained two rubber ‘O’ rings, which provided a leak-proof seal, and a valve to
enable isolation.
Figure 3..15 Speedfit connector (www.speedfit.co.uk)
The pipe sections were each 15mm diameter, 15.24cm long, and were made of either
copper or polyethylene. The sections could be easily removed using a special tool and
when removed were replaced with new sections.
The height of each rig was 1.22m, the width was 1.22m. All rigs were mounted, back
to back, on a movable board. The total length of the pipes of each rig was 538cm
each.
The PVC tank of each rig held approximately 15 litres of water. The water was
circulated through each rig using a brass circulating pump. The water was heated
74
using an 11 inch long stainless steel immersion heater (immersed in each tank). The
flow-rate of the water going through each rig was approximately 2 litres per minute.
The flow could be reduced, if necessary, by changing the settings of the valve nearest
to the tank input.
3.2.1 Initial experimental procedures – Rigs A
The experiment with the first built rigs (Rigs A) was designed to develop and monitor
a microbial population for comparison between the copper piped rig and the
polyethylene piped rig.
Both rigs were run at a temperature of ~ 42ºC.
Mains water was introduced into the rigs and, to simulate hot water use whilst not
loosing the introduced micro-organisms, three litres of water were manually drawn
from the rigs every day. The rigs were also manually re-filled with three litres of
mains water every day. This represented storage of ~5 days. In reality, it is, however,
advised not to store water for longer than 24 hours.
To introduce bacteria into the rigs and to encourage biofilm formation, both rigs were
deliberately filled with one litre of water with pre-established counts of viable bacteria
(Total Viable Counts or TVCs) as shown in Table 3.2 below.
75
TVC @ 37º TVC @ 22º Legionella L. pneumophilaDay introduced
Day introduced
2 days 3 days Species Serogroup 1 to Polyethyleneto Copper rig
CFU/ml CFU/ml CFU/l CFU/l rig
770 330 Not found Not found None 102
3470 2260 Not found Not found 102 None
330 440 Not found Not found None 123
605 550 Not found Not found 123 None
5450 7430 Not found Not found None 179
3960 9410 Not found Not found 179 None
14 2 Not found 1800 260 2603 16 900 Not found 285 285
Table 3.2 Initial experiment - Total viable bacteria and Legionella bacteria added to rigs A
Analysis for viable bacteria present in the rigs was carried out following the standard
culture method (BS EN ISO 6222:1999). Table 3.3 below shows the pattern of water
sampling for this analysis.
76
Day Day
0 4177 42414 43119 43827 44533 45370 45980 46690 47397 478
110 480119 487128 494137 501155 508162 515193 522211 529239 536246 543268 550284 557302 564324 569333 570344 571355 572372 575383 576387 577395 578404 579409 582410
Table 3.3 Initial experiment Rigs – Frequency of TVC analysis.
Sixty seven samples were taken from each rig. The last samples were taken on day
582.
On day 260 the rigs were seeded with one litres of water that contained 1800CFU/l of
L. pneumophila serogroup 1, and on day 285 the rigs were seeded with one litre of
water that contained 900CFU/l of Legionella non-pneumophila as shown in Table 3.2.
One litre samples were, therefore, taken from both rigs for Legionella analysis from
day 324 onwards as shown in Table 3.4 below.
77
Day Day
324 473333 480344 487355 494372 501383 508387 515395 522404 529409 536410 543417 550424 557431 564438 571445 578453 585459466
Table 3.4 Initial experiment Rigs - Frequency of Legionella analysis.
Thirty seven samples were taken from each rig. The last samples were taken on day
585.
The pattern of biofilm development was followed by periodic removal of sections.
Pipe sections of each rig were isolated by closing the valves of the ‘Speedfit’
connectors. The pipe sections were then removed by using a special tool to separate
the connectors from the pipe. The pipe sections were then aseptically released in a
sterilized, plastic bottle containing 500ml of distilled water.
In order to investigate the best way to remove and to quantify any biofilm from the
inner surfaces of the pipe sections a number of different techniques were attempted as
shown in Table 3.5 below.
78
SectionTime in rigs
ProcedureDays
1 19 Shaken/biomass/TVC
2 27 Shaken/biomass/TVC
3 70 Shaken/biomass/TVC
4 80 Shaken/biomass/TVC
5 89 Shaken/biomass/TVC
6 128 Shaken/biomass/TVC7 128 Sonicated/biomass/TVC
8 211 Control section
9 211 Sonicated/biomass/TVC
10 211 Shaken/biomass/TVC
11 211 Brushed/biomass/TVC
12 284 Brushed/biomass/TVC
13 and 14 387 Brushed/biomass/TVC
15 409 Brushed/biomass/TVC
16 478 Brushed/biomass/TVCTable 3.5 Initial experiment Rigs - Pattern and procedures of biofilm harvesting and time of
sections in rigs A.
The first method involved placing removed sections together with 500ml distilled
water in a sonification bath for 1 hour after which the suspended solids were collected
and weighed. This was done by recording the weight of a filter, placing it on a
filtration manifold, filtering the sample through the filter, placing the filter in an oven
at 40ºC, drying it, then weighing the filter again, and deducting the initial weight
result from that of the dried filter. An analytical balance was used for the weighing.
The second method involved shaking removed sections in 500ml distilled water on a
rotary shaker for one hour after which the suspended solids obtained were dried and
weighed. In the third method, removed sections were brushed through 5 times with a
sterilized 50cm long bottle brush holding the section half way into the bottle filled
with 500ml of distilled water, after which the sample was also dried and weighed. The
third method was introduced as it was felt that strongly adherent biofilms could
withstand the first 2 treatments and not be fully removed by them.
79
The highest weight was found in the brushed samples. All sections were from then on,
therefore, brushed through to remove biofilm.
Initially, viable biological material within the brushed samples was also analyzed by the standard culture method (BS EN ISO 6222:1999), shown also in Tables 3.6 and 3.7. The result, expressed in colony forming units per ml, was then multiplied by 500,
because the sample was 500ml, which was then divided by 7000mm2, approximately the inner surface area of the pipe section (surface area = circumference (πd = 3.14 x
15mm = 47.1mm) x length (15.24cm or 152.4mm) ≈ 7000mm2), which gave the
approximate colony forming units per mm2. A result of >1000/mm2 was considered a substantial biolayer.
The presence of Legionella in biofilms on the inner surfaces of pipe sections of the
rigs was monitored by analyzing brushed through pipe section samples by the culture
method (ISO 11731:1998). Table 3.6 below shows the pattern of the sampling for
Legionella analysis of biofilm in the sections.
SectionTime in rigs
Days
1 19
13 and 14 387
15 409
16 478
1, 2, 3, 4, 5, 6, 7, 8, 547, 539, 496, 486, 477, 436,
9, 10, 11, 12, 13, 436, 353, 353, 353, 353, 220,
14, 15, and 16 177, 177, 155, 86
Table 3.6 Initial experiment Rigs - Pattern of sampling for Legionella analysis of biofilm of
rigs A.
Legionella sampling of the biofilm in the pipe sections commenced after a population
of Legionella organisms was detected in the rigs’ water. Sections representing
residence times of between 86 and 547 days were all analyzed at one time point, on
day 564, to investigate whether a pattern of biolayer development could be shown.
80
3.2.2 Additional experimental procedures – Rigs B and C
Two more copper and two more polyethylene rigs (Rigs B and C), identical to rigs A,
were built to compare the efficacy of controlling Legionella by elevated temperatures
with copper piping and polyethylene piping, and to compare the efficacy of
controlling Legionella by copper and silver ionization with copper piping and
polyethylene piping, see Table 3.7 below.
Rigs Treatment Temp. ºC
A Copper and silver ionization < 45
B None < 45
C Temperature ~ 50
Table 3.7 Treatment of rigs A, B and C.
To obtain a similar microbial load as in rigs A, water from rigs A was introduced into
rigs B and C. The copper rigs B and C were each filled with one third of the water
from the copper rig A and the polyethylene rigs B and C were each filled with also
one third of the water from the polyethylene rig A.
To obtain similar biofilm layers and to encourage biofilm formation in rigs B and C,
sections of rigs A were placed in rigs B and C.
Figures 3.16, 3.17, and 3.18 below show the sections removed from and left in the
polyethylene rig A and the sections replaced in the polyethylene rigs B and C.
Sections 18, 17, 16, 15, 14, 13, 12, and 11 of the polyethylene rig B were replaced
with sections 18, 17, 16, 15, 14, 13, 12, and 11 of the polyethylene rig A. Sections 11,
10, 9, 8, 7, 6, 5, and 4 of the polyethylene rig C were replaced with sections 10, 9, 8,
7, 6, 5, 4, and 3 of the polyethylene rig A.
Figures 3.19, 3.20, and 3.21 below show the sections removed from and left in the
copper rig A and the sections replaced in the copper rigs B and C.
Sections 23, 22, 21, 20, 19, 18, 17, and 16 of the copper rig B were replaced with
sections 23, 22, 21, 20, 19, 18, 17, and 16 of the copper rig A. Sections 23, 22, 21, 20,
81
19, 18, 17, and 16 of the copper rig C were replaced with sections 15, 14, 13, 12, 11,
10, 9, and 8 of the copper rig A.
Figure 3.16 Polyethylene rig A sections left and removed.
Figure 3.17 Polyethylene rig B sections replaced with polyethylene rig A sections.
82
Figure 3.18 Polyethylene rig C sections replaced with polyethylene rig A sections.
Figure 3.19 Copper rig A sections left and removed.
83

Figure 3.20 Copper rig B sections replaced with copper rig A sections.
Figure 3.21 Copper rig C sections replaced with copper rig A sections
Three litres of water were manually drawn from all six rigs every day to simulate hot
water use. Rigs B and C were automatically re-filled with three litres of mains water
by a ball valve mechanism inserted in each tank and rigs A were re-filled manually
every day.
84
Once Legionella populations were found in all rigs, treatment was started. Three litres
of water from rigs A were manually replenished every day with water containing
copper and silver ions. The temperatures in rigs A were kept below 45ºC.
The Orca copper and silver ionization system produced the copper and silver ions that
were introduced into rigs A. This system was not attached directly to the rigs, as it
was unsuitable for the small size of the experimental rigs. The system produced
approximately 0.1mg/l of silver and 3.6mg/l of copper and three litres of this water
were introduced into the rigs daily in a separate operation.
No treatment was added to the B rigs. The temperatures in these rigs were maintained
below 45ºC, simulating a typical hot water circulating system in which mixing valves
are used to blend water to a temperature below 45ºC to avoid scalding.
The temperatures in rigs C were maintained above 50ºC, simulating a pure hot water
circulating system to which the temperature control regime as recommended in the
ACoP (L8) and the HTM 04-01 documents is applied.
The temperatures in the six rigs tanks were recorded in ºC using an infrared non-
contact thermometer. Recordings were done daily when the water was being drawn
from the rigs.
125ml samples for analysis for copper and silver by Inductively Coupled Plasma
Optical Emission Spectroscopy (ICPOES) and Inductively Coupled Plasma Mass
Spectrometry (ICPMS) were collected from the draw off points of all six rigs, also
daily.
One litre of sample for Legionella analysis was collected once a week from the draw
off points of all six rigs. The analysis for Legionella was carried out by the culture
method (ISO 11731:1998).
The presence of Legionella in biofilms was monitored once a month by analyzing
samples of pipe sections, brushed through in 500ml distilled water, by the culture
method (ISO 11731:1998).
85
3.3 Analytical methods
3.3.1 Water analysis
Water analysis was carried out by a UKAS accredited laboratory.
(a) Total Viable Count (TVC) (BS EN ISO 6222:1999)
The standard culture method for analysis for total viable bacteria was applied. 1ml of
the sample was plated, within 12 hours, onto prepared Petri dishes. The sample was
incubated at 37ºC for 48 hours and at 22ºC for 72 hours, after which the number of
colony forming units that had formed in the medium were calculated using a standard
plate counter. The results were expressed in colony forming units per 1ml (CFU/ml).
A colony forming unit represents a number of bacterial cells that has the ability to
form a colony on the media.
(b) Legionella (ISO 11731:1998)
The standard culture method for analysis for Legionella bacteria was applied. The
sample was filtered through a 0.2µm membrane filter. The filter was placed in a
stomaching bag containing 10ml of ‘Ringer’s solution’ and rubbed between thumb
and finger to ‘wash’ the bacteria from the filter into the solution.
10ml of the solution produced was then split into 3 portions, one was tested without
further treatment, one was heat treated at 50ºC (± 1ºC) for 30 minutes (± 2 minutes),
and one was treated with acid (pH 2.2) left for 5 minutes (± 30 seconds). Legionella
are resistant to these treatments whereas other bacteria may be killed, therefore,
reducing the total amount of bacteria in the test solutions without (ideally) losing any
Legionella.
0.1ml of each of the 3 solutions was then spread onto agar containing the selective
agents: Glycine, vancomycin, polymyxin and cyclohexamide (GVPC) and incubated
at 36ºC for 10 days. The plates were inspected 4 times during the 10 day incubation,
on days 3, 5, 7 and 10. If colonies grew on any of the 3 plates during the 10 day period
with the correct morphology, these were scored as ‘presumptive’ Legionella
86
positive. The number of ‘presumptive’ colony forming units present on the medium
was then calculated. The ‘presumptive’ colonies from these plates were then sub-
cultured onto two further plates. One with and one without supplements to determine
the presence of Legionella species, which grow only on the plate with supplements:
Buffered charcoal yeast extract agar with cysteine (BCYE+), and fail to grow on the
plate without supplements, BCYE- (without cysteine).
To identify L. pneumophila serogroup 1 and serogroup 2-14 coloured latex beads
coated in antibodies were used. These antibodies agglutinate if those species are
present. The results were expressed in colony forming units per litre (CFU/l).
Plate 3.6 Two Legionella pneumophila colonies on BCYE+
(c) Phosphorus, copper and silver (Inductively Coupled Plasma Optical Emission
Spectroscopy/Mass Spectrometry - ICPOES/ICPMS)
The sample was released into inductively coupled plasma, which was created from
highly ionized argon gas. The sample was released into it as an aerosol suspended in
argon gas formed by a nebulizer. When the sample aerosol stream passed through the
plasma, desolvation and atomization occurred, this resulted in the constituent elements
achieving an excited state.
In the case of optical emission spectroscopy (ICPOES), after excitation, the
phosphorus and metal ions in the sample emitted light of characteristic wavelengths,
87
which were converted to an electrical current which was proportional to the
concentration of the specific ions in the sample.
In the case of mass spectrometry (ICPMS), after excitation, the specific mass to
charge ratio of the ions was measured and an electrical current was generated, which
was proportional to the concentration of the specific ions in the sample. ICPOES was
used to obtain phosphorus and copper concentrations, whereby, ICPMS was used to
obtain the lower silver concentrations.
(d) Chloride (AQUA-800 Analyzer)
Analysis for chloride was carried out by the AQUA-800 Analyzer. The sample was
placed on a sample wheel. Aliquots of the sample and reagents were dispensed into
reaction vials and the reaction and colour development were allowed to proceed. After
an appropriate delay the reaction mixture passed through a read head, which measured
the intensity of the colour formed. By comparison to the readings obtained from
previously analyzed standards of known strength the concentration of each analyte
was determined.
(e) pH
Analysis for pH was carried out by measuring the electromotive force (EMF) of a cell
comprising of an indicator electrode (which was responsive to hydrogen ions, such as
a glass electrode) and a reference electrode, both immersed in a test solution. The
EMF of this cell was measured with a pH meter, which was a high-impedance
electrometer calibrated in terms of pH.
88

3.3.2 Statistical analysis
The results of all analyses and the temperature recordings were entered and interpreted using Microsoft Excel software.
The variability of the values was measured by taking the root mean square deviation
of the values from their mean.
Where:Σ = Sum of
X = Individual score
M = Mean of all scores
N = Sample size (Number of scores)
89
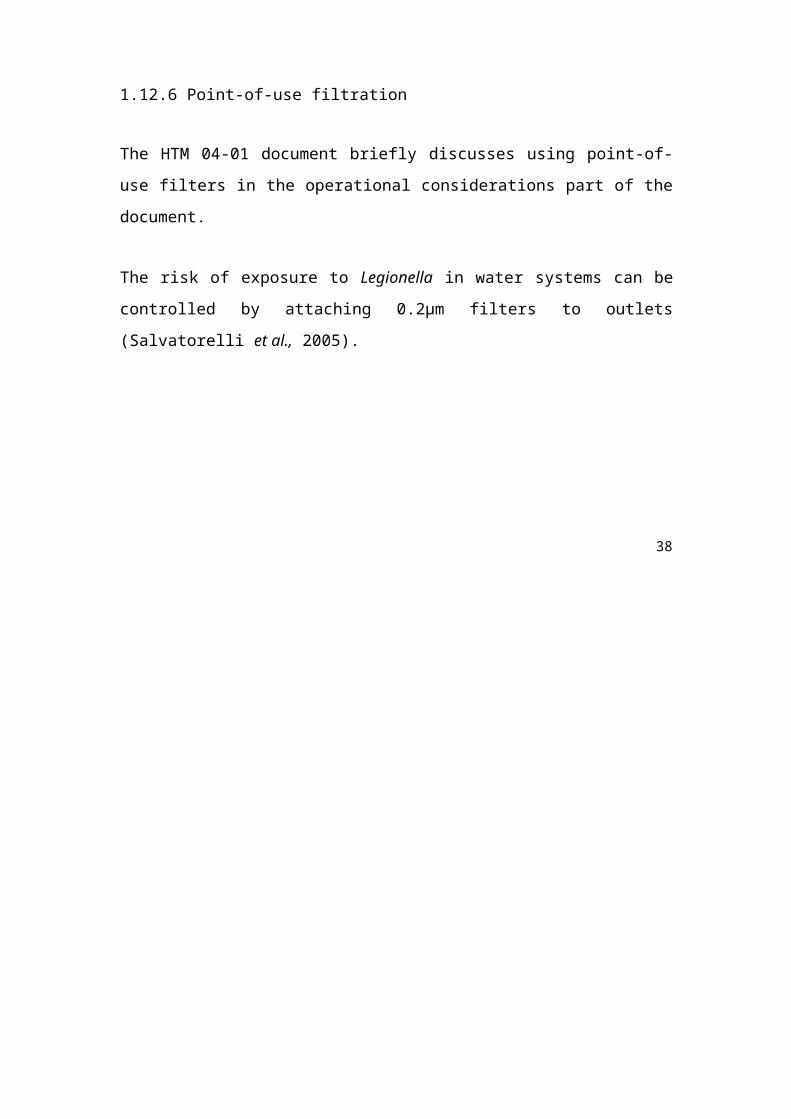
3.4 Experiments using the Robbins device
The Tyler Research Corporation (Edmonton, Alberta, US) manufactures a range of
devices for the analysis of biofilms on surfaces, which includes the modified Robbins
device.
Synthetic rubber, as well as copper and polyethylene, is also commonly used in UK
water systems and it was suggested that synthetic rubber encouraged biofilm growth
(Schofield and Locci, 1985, Keevil et al., 1993, Rogers et al., 1994, BSRIA Technical
Note TN 9/96).
The Robbins device was, therefore, used to compare biofilm formation on rubber,
copper and polyethylene discs. The device used consisted of 12 sampling ports in a
linear array, see Plate 3.7 below. These ports accepted press-fit plugs that held 1
sample disc each with a surface area of 50mm2. These discs were made of rubber,
copper, and polyethylene. The design of the press-fit plugs was such that the surfaces
of the rubber, copper and polyethylene sample discs became part of the channel wall.
The sample discs were, therefore, exposed to the water that was circulated through the
channel of the device.
Water out
Water inPress-fit plug
Plate 3.7 The Robbins device including drawing ofpress-fit plug (www.tylerresearch.com).
90
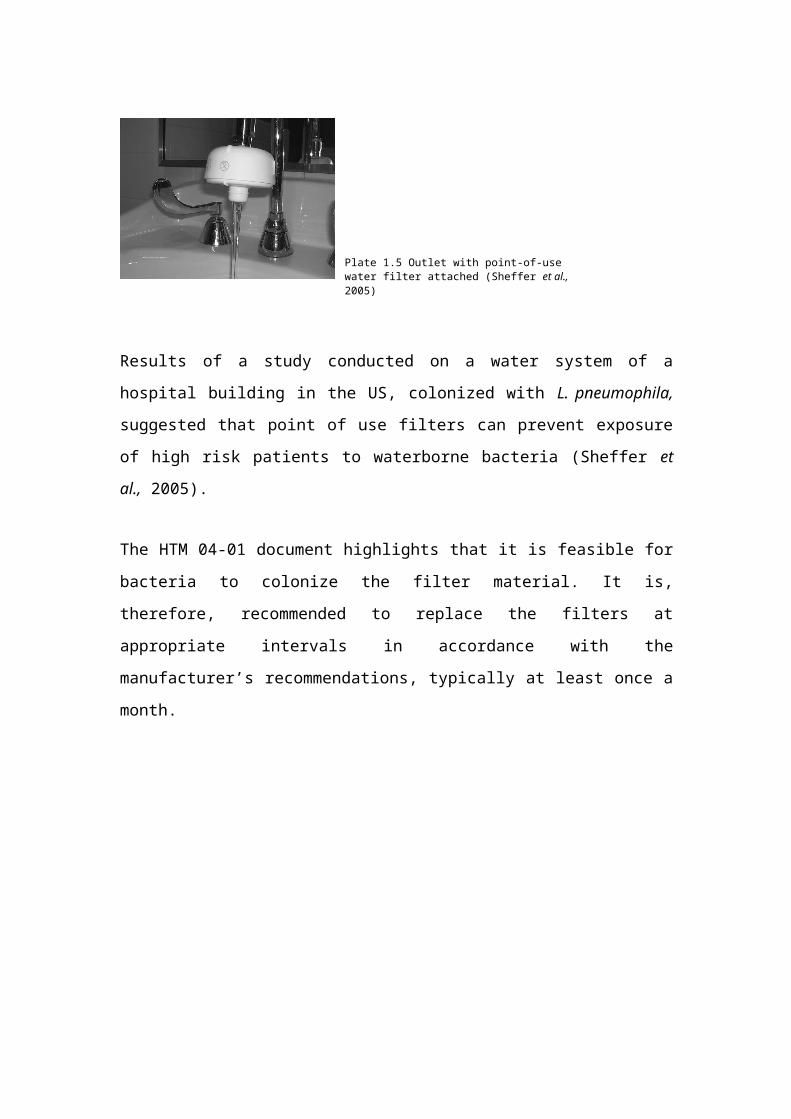
Before the experiments, the Robbins device was disinfected by pumping 20ml of
methanol through the device, using a peristaltic pump (Watson Marlow Limited,
Falmouth, Cornwall) set at 12 reps per minute, followed by 50ml of distilled water.
Six copper discs were first placed on the surface of six press-fit plugs. These plugs
were fitted in the first six ports of the Robbins device.
The water that was circulated through the channel of the device as an inoculum source
was inoculated by leaving unbrushed sections 20 and 21 from the polyethylene rig A
in 500ml distilled water for 1 week. 500ml of this water was circulated through the
device for 24 hours, using the peristaltic pump again set at 12 reps per minute. The
temperature of the water was ~ 20ºC.
The sample discs were aseptically removed from the plugs after 24 hours. The discs were released in 10ml distilled water, and shaken for 30 seconds. 1ml of this sample was serial
diluted from neat to 10-1, 10-2, and 10-3. 0.1ml of the 10-2 and 10-3 dilutions were then
spread onto trypto soya agar plates. The 10-1 dilutions were too overgrown and were
therefore not used. Two plates were not spread and were used as controls. The plates were then incubated at 20ºC (± 2ºC), and checked after twenty-four hours.
In total three individual tests, as described above, were conducted with the copper
discs, three individual tests with the polyethylene discs, and three individual test were
done with the rubber discs (Tests 1, 2, and 3).
It was felt that strongly adherent biofilms would not be totally removed by shaking the
discs in 10ml distilled water for 30 seconds. The surfaces of 4 copper, 4 polyethylene
and 4 rubber discs that were exposed to the inoculated water for 48 hours, were,
therefore, brushed using interdental brushes (Tests 4).
91

4. RESULTS
4.1 Study hospital 1
The results of samples taken on the 05th September 2007, before the copper and silver ionization system was activated, are shown in Table 4.1 below.
92
Sample Point Temp. Silver Copper LegionellaºC Mg/l Mg/l CFU/l
71 142 HT 25 0.0003 0.116 2100 s171 142 CT 24 0.0003 0.142 200 s10.2.0016 HT 43 0.0003 0.049 100 s10.2.0016 CT 20 0.0003 0.029 100 s158-00-87 HT 40 0.0003 0.031 1700 s158-00-87 CT 21 0.0003 0.014 <LOD58-03-112 HT 39 0.0003 0.043 100 s158-03-112 CT 22 0.0003 0.027 100 s167-0-008 HT 57 0.0003 0.041 <LOD67-0-008 CT 28 0.0003 0.068 <LOD68-01-045 HT 43 0.0003 0.043 <LOD68-01-045 CT 21 0.0003 0.023 <LOD68-01-05 HT 42 0.0003 0.037 9800 s168-01-05 CT 21 0.0003 0.019 <LOD69-010-70 HT 38 0.0003 1.050 7500 s138-0-029 HT 34 0.0003 0.057 1600 s138-0-029 CT 27 0.0003 0.026 1200 s114-01-023 HT 47 0.0003 0.059 200 s2-1414-01-023 CT 20 0.0003 0.021 <LOD35-0-028 HT 28 0.0003 0.043 4200 s1 + 100 np35-0-028 CT 20 0.0003 0.019 200 s162-02-067 shower 26 0.0003 0.068 <LOD62-02-067 CT 19 0.0003 0.014 200 s139-01-86 HT 51 0.0003 0.081 <LOD39-91-86 CT 20 0.0003 0.183 <LOD39-00-65 HT 57 0.0003 0.053 <LOD39-00-65 CT 22 0.0003 0.02 3500 s125-00-31 shower 26 0.0003 0.273 <LOD25-00-31 HT 39 0.0003 0.067 200 s1 + 1200 np25-00-31 CT 19 0.0003 0.04 <LOD22-086 shower 40 0.0003 0.037 <LOD22-086 HT 37 0.0003 0.029 <LOD22-086 CT 20 0.0003 0.013 <LOD21-1-137 shower 40 0.0003 0.118 <LOD21-1-137 HT 42 0.0003 0.038 <LOD21-1-137 CT 19 0.0003 0.013 <LOD23-01-78 shower 43 0.0003 0.132 1100 np23-01-78 HT 40 0.0003 0.083 1100 np23-01-78 CT 19 0.0003 0.03 <LOD29-00-07 HT 56 0.0003 0.062 <LOD29-00-07 CT 34 0.0003 0.035 8200 s141-0-072 shower 40 0.0003 0.064 500 s141-0-052 HT 43 0.0003 0.073 <LOD41-0-052 CT 19 0.0003 0.067 <LOD681-08-22 HT 43 0.0003 0.065 <LOD71-01-30 HT 39 NA NA <LOD
CT = Cold Tap, HT = Hot Tap, np = Legionella non-pneumophila, s1 = Legionella
pneumophila serogroup 1, s2-14 = Legionella pneumophila serogroup 2 to 14, <LOD =
Below Limit of Detection (100CFU/L).
Table 4.1 Study hospital 1 - Results from samples taken on the 05th September 2007, before
commissioning of copper and silver ionization system.
93
Legionella were found at 21 out of the 46 outlets tested, around 46% of the outlets
tested were, therefore, contaminated.
The Legionella colony forming unit counts found ranged from 100CFU/l to
9800CFU/l. The average Legionella count of the 46 outlets sampled was 983CFU/l (±
331CFU/l). Hot and cold outlets were contaminated.
The highest Legionella counts were found in samples taken from hot outlets at which
low hot water temperatures, below 50ºC, were recorded and in cold outlets at which
elevated temperatures, above 20ºC, were recorded. Although not visible,
thermostatically controlled mixing valves (TMVs) may have been blending the water
at the hot outlets at which low hot water temperatures were recorded.
The copper found in the samples was due to copper leaching from copper pipes. The
average was 0.08mg/l (± 0.023mg/l), which included the highest level of 1.050mg/l.
Excluding the highest copper level the average copper found was 0.058mg/l (±
0.007mg/l).
The copper and silver ionization system was activated on the 11th September 2007.
Table 4.2 below shows the results of samples taken on the 05th October 2007 from the 21 outlets that were contaminated before the system was activated.
94
Sample Point Temp. Silver Copper LegionellaºC Mg/l Mg/l CFU/l
71 142 HT 24 0.011 0.217 <LOD71 142 CT 23 0.006 0.245 2000 s102.0016 HT 41 0.027 0.132 <LOD02.0016 CT 18 0.041 0.186 <LOD58-00-87 HT 40 0.031 0.131 700 s158-03-112 HT 39 0.026 0.104 <LOD58-03-112 CT 18 0.047 0.181 <LOD68-01-05 HT 41 0.021 0.116 <LOD69-010-70 HT 55 0.014 0.111 <LOD38-0-029 HT 33 0.038 0.173 400 s138-0-029 CT 25 0.048 0.17 <LOD14-01-023 HT 50 0.009 0.065 <LOD35-0-028 HT 27 0.04 0.183 100 s135-0-028 CT 17 0.048 0.179 <LOD62-02-067 CT 19 0.059 0.176 <LOD39-00-65 CT 21 0.004 0.157 <LOD25-00-31 HT 39 0.027 0.147 <LOD23-01-78 shower 41 0.029 0.579 <LOD23-01-78 HT 39 0.03 0.173 200 np29-00-07 CT 30 0.021 0.126 <LOD41-0-072 shower 37 0.013 0.193 <LOD
CT = Cold Tap, HT = Hot Tap, np = Legionella non-pneumophila, s1 = Legionella
pneumophila serogroup 1, <LOD = Below Limit of Detection (100CFU/l).
Table 4.2 Study hospital 1 - Results from samples taken on the 05th October 2007, one month after commissioning of copper and silver ionization system.
No Legionella were found in samples taken from 16 outlets that were previously
contaminated. The Legionella colony forming unit counts also reduced. The average
Legionella count was 161CFU/l (± 99CFU/l). The highest Legionella count was
2000CFU/l, found in a sample taken from a cold outlet. The temperature recorded at
this outlet was 23ºC.
The cold temperatures remained above 20ºC at 4 out of the 8 cold water outlets tested
and the hot water temperatures were again predominantly below 50ºC. A TMV was
blending the water at the 38-0-029 hot outlet at which a L. pneumophila serogroup 1
count of 400CFU/l was found. TMVs were, however, not visible at the other hot
outlets tested at which also L. pneumophila serogroup 1 organisms were found. The
average hot water temperature was 39ºC (± 2ºC).
95

The silver found in the 21 outlets tested ranged from 0.004mg/l to 0.059mg/l. The
average silver level was 0.028mg/l (± 0.003mg/l). The copper ranged from 0.104mg/l
to 0.579mg/l. The average copper level was 0.178mg/l (± 0.022mg/l).
From the 05th October 2007 onwards, the Legionella contamination continued to decline in the blended and cold water system, see Graph 4.1 below. This graph shows
the average Legionella counts in samples taken monthly from 21 outlets from the 05th
October 2007 up to the 11th July 2011.
300
250
CFU
/l 200
Legi
onel
la 150
100
50
0
.008 008
8 9009 010 010
0 17
0 0 1 100/2 /2 /2 /2 /2 /2 /22 /20
/06/20
/20
/05/200/ 6 0 5 8
/1 /0 /1 /0 /0
05 09/01 01/04
0
06 08/01/200926/03/2009 26/10 18/01 06/04
5
16
6
3 2 15/11/201025/02/2011
Graph 4.1 Study hospital 1 – Average Legionella results from the 05th October 2007 to
the 11th July 2011.
Graphs 4.2 and 4.3 below show the average copper and silver levels found in samples
taken monthly from the 21 outlets tested from the 05th October 2007 to the 11th July 2011.
96
Graph 4.2 Study hospital 1 – Average copper levels from the 05th October 2007 to the 11th July 2011 (the red line is the target level for copper of 0.2mg/l).
The average copper level from the 05th October 2007 to the 11th July 2011 was 0.201mg/l (± 0.012mg/l).
Graph 4.3 Study hospital 1 – Average silver levels from the 05th October 2007 to the 11th July 2011 (the red line is the target level for silver of 0.02mg/l).
97
The average silver level from the 05th October 2007 to the 11th July 2011 was 0.04mg/l (± 0.002mg/l).
Legionella persisted, albeit at reduced counts, in samples taken from outlets at which
either less than the copper target level or less than the silver target level was found,
and at outlets at which less than both the copper and the silver target levels were
found. No Legionella were found in samples taken from cold water outlets at which
water temperatures above 20ºC were recorded when the copper and silver target levels
were being maintained. No Legionella were also found in samples taken from hot
water outlets at which water temperatures below 50ºC were recorded when the copper
and silver target levels were being maintained.
The average cold water temperature recorded monthly at the outlets samples were
taken from, from the 05th October 2007 to the 11th July 2011, was 17ºC (± 0.3ºC). The average hot water temperature recorded was 41ºC (± 0.4ºC).
The chloride level found in a sample taken on the 05th April 2011 from the incoming mains was 15.1mg/l, the phosphorus was 455µg/l, and the pH was 8.5.
98

4.2 Study hospital 2
The results of samples taken on the 10th January 2008, before the copper and silver ionization system was activated, are shown in Table 4.3 below.
Sample Point Temp. Silver Copper LegionellaºC Mg/l Mg/l CFU/l
43.32.1 MT hot 28 0.0003 0.088 <LOD49-023-1 HT 57 0.0003 0.070 <LOD49-023-1 CT 13 0.0003 0.018 100 np56-030-1 MT hot 14 0.0003 0.156 2200 np19-069-01 MT hot 45 0.0003 0.039 100 np17-029-01 HT 55 0.0003 0.064 <LOD17-029-01 HT 15 0.0003 0.063 <LOD23-024-01 MT hot 18 0.0003 0.036 100 s118-054-01 HT 41 0.0003 0.059 <LOD18-054-01 CT 13 0.0003 0.026 <LOD16-027-01 HT 57 0.0003 0.053 <LOD16-027-01 CT 12 0.0003 0.013 <LOD13-027-01 HT 53 0.0003 0.044 <LOD13-027-01 CT 11 0.0003 0.026 <LOD14-040.2 HT 54 0.0003 0.039 <LOD14-040.2 CT 12 0.0003 0.018 <LOD12-049-01 MT hot 39 0.0003 0.035 <LOD10-0-014 MT hot 36 0.0003 0.071 <LOD10-131-1 MT hot 44 0.0003 0.047 <LOD12-107-1 HT 56 0.0003 0.043 <LOD12-107-1 CT 14 0.0003 0.014 <LOD14-137.1 MT hot 38 0.0003 0.030 <LOD13-128-1 HT 55 0.0003 0.042 <LOD13-128-01 CT 12 0.0003 0.015 <LOD16-128-1 MT hot 32 0.0003 0.057 5900 np17-103-1 MT hot 41 0.0003 0.042 100 np19-156 1 HT 59 0.0003 0.034 <LOD19-156-1 CT 12 0.0003 0.009 200 np20-136-1 HT 57 0.0003 0.387 <LOD20-136-1 CT 11 0.0003 0.047 <LOD
MT = Mixer Tap, CT = Cold Tap, HT = Hot Tap, np = Legionella non-pneumophila, s1 =
Legionella pneumophila serogroup 1, <LOD = Below Limit of Detection (100CFU/l).
Table 4.3 Study hospital 2 - Results from samples taken on the 10th January 2008, before
commissioning of copper and silver ionization system.
Legionella were found at 7 out of the 30 outlets tested, around 23% of the outlets
tested were, therefore, contaminated.
99

The Legionella colony forming unit counts found ranged from 100CFU/l to
5900CFU/l. The average Legionella count of the 30 outlets sampled was 290CFU/l (±
207CFU/l). Cold and blended outlets were contaminated.
The average temperature recorded at the cold water outlets was 12ºC (± 0.3ºC). The
temperatures recorded at the two contaminated cold water outlets were 12ºC and 13ºC.
The average temperature at the hot water outlets was 43ºC (± 3ºC).
The temperatures recorded at the 5 contaminated hot outlets were all below 50ºC
mainly because the hot water was blended. The highest Legionella count, of
5900CFU/l, was found in a sample taken from a blended outlet (a shower). The
temperature recorded here was 32ºC.
The average copper level found due to copper leaching from copper pipes was
0.056mg/l (± 0.013mg/l).
The copper and silver ionization system was activated on the 10th January 2008.
Table 4.4 below shows the results of samples taken on the 04th February 2008 from the 7 outlets that were contaminated before the system was activated and from 8 outlets that were identified as being at risk of Legionella contamination.
100
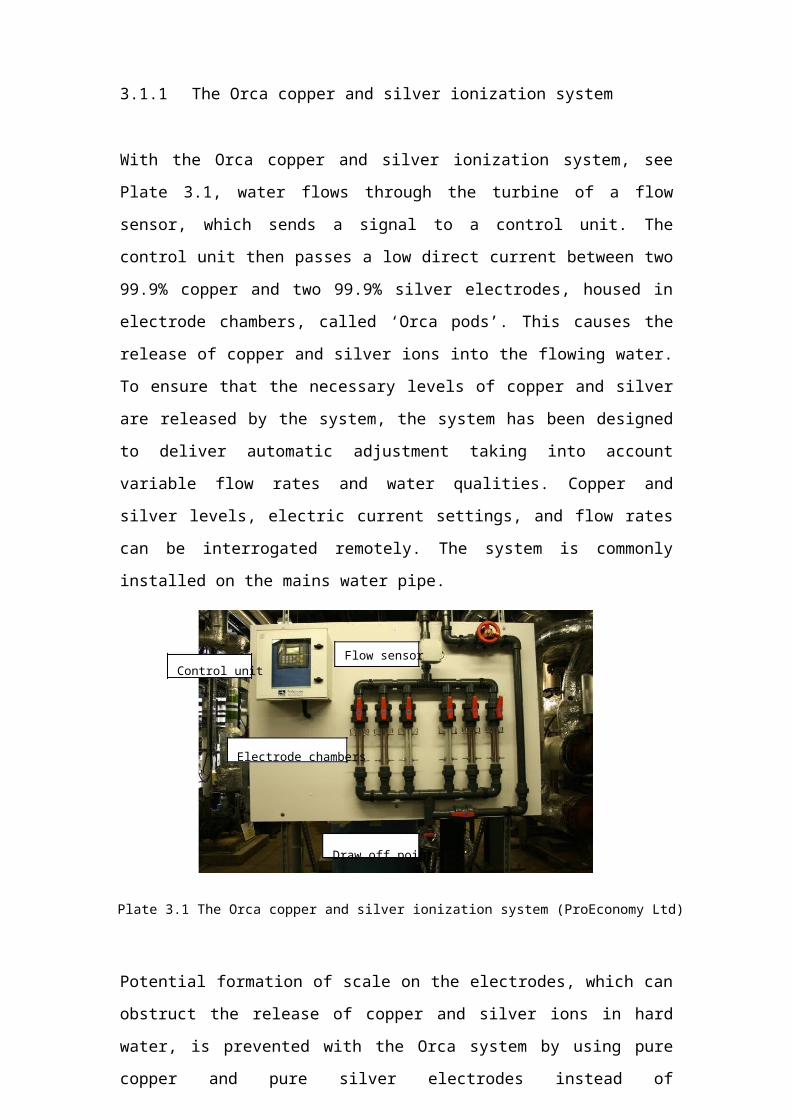
Sample Point Temp. Silver Copper LegionellaºC Mg/l Mg/l CFU/l
49-023-1 CT 12 0.052 0.341 <LOD56-030-1 MT hot 42 0.009 0.179 200 np19-069-01 MT hot 45 0.031 0.224 <LOD23-024-01 MT hot 18 0.05 0.364 <LOD16-128-1 MT hot 34 0.028 0.225 <LOD17-103-1 MT hot 42 0.029 0.193 <LOD19-156-1 CT 45 0.031 0.224 <LOD10.0-014 MT hot 33 0.033 0.231 <LOD14.0-0391 HT 51 0.033 0.209 <LOD14.0-0391 CT 12 0.052 0.347 <LOD13.128-1 HT 54 0.019 0.109 <LOD13.128-1 CT 11 0.054 0.346 <LOD20.136-1 CT 11 0.055 0.345 <LOD20-136-1 HT 56 0.02 0.167 <LOD43.32-1 CT 11 0.049 0.338 <LOD
MT = Mixer Tap, CT = Cold Tap, HT = Hot Tap, np = Legionella non-pneumophila, <LOD =
Below Limit of Detection (100CFU/l).
Table 4.4 Study hospital 2 - Results from samples taken on the 04th February 2008, one month
after commissioning of copper and silver ionization system.
No Legionella were found in samples taken from 6 of the 7 outlets that were
previously contaminated. Legionella persisted at one outlet but the Legionella colony
forming unit count had dropped from 2200CFU/l to 200CFU/l. The temperature
recorded at the contaminated outlet was 42ºC because the hot water was blended with
the cold water.
The silver found in the 15 outlets tested ranged from 0.009mg/l to 0.057mg/l. The
average silver level was 0.038mg/l (± 0.004mg/l). The silver found in the sample
taken from the outlet in which Legionella were found was 0.009mg/l, which was
below the target level of 0.02mg/l.
The copper found in the 15 outlets tested ranged from 0.109mg/l to 0.364mg/l. The
average copper level was 0.263mg/l (± 0.022mg/l). The copper found in the sample
taken from the outlet in which Legionella were found was 0.179mg/l, which was
below the target level of 0.2mg/l.
From the 04th February 2008 onwards, the Legionella contamination around the site
continued to decline except for in samples taken from one blended outlet, the 56.030.1
101
hot tap. Graph 4.4 below shows the average Legionella counts in samples taken
monthly from 15 outlets from the 04th February 2008 up to the 27th July 2011.
Graph 4.4 Study hospital 2 – Average Legionella results from the 04th February 2008 to
the 27th July 2011.
Graphs 4.5 and 4.6 below show the average copper and silver levels found in samples
taken monthly from the 15 outlets from the 04th February 2008 to the 27th July 2011.
Graph 4.5 Study hospital 2 – Average copper levels from the 04th February 2008 to the 27th
July 2011 (the red line is the target level for copper - 0.2mg/l).
102
Graph 4.6 Study hospital 2. Average silver levels from the 04th February 2008 to the 27th July 2011 (the red line is the target level for silver - 0.02mg/l).
The average copper level from the 04th February 2008 to the 27th July 2011 was 0.235mg/l (±0.014mg/l).The average silver level was 0.037mg/l (± 0.002mg/l).
Table 4.5 below shows that the copper and silver target levels at the blended outlet at
which Legionella persisted were not consistently maintained. Forty nine samples were
taken from this outlet from the 04th February 2008 to the 27th July 2011. Legionella
were found in 29 of these. The average silver level found in the contaminated samples
was below the target level of more than 0.02mg/l at 0.013mg/l (± 0.002mg/l), the
average copper level found was just above the target of 0.2mg/l at 0.213mg/l (±
0.012mg/l).
No Legionella were found in 20 of the 49 samples taken from the outlet. The average
silver level in these samples was above the target level of more than 0.02mg/l at
0.021mg/l (± 0.005mg/l). More copper was also found than in the contaminated
samples at an average level of 0.228mg/l (± 0.016mg/l).
These results suggested that both the copper and silver target levels needed to be
consistently maintained at the outlet to control the Legionella, and that, especially,
more silver was needed.
103
Date Copper Silver Legionellamg/l mg/l CFU/l
04/02/2008 0.179 0.009 200 np04/03/2008 0.175 0.018 1500 np07/04/2008 0.164 0.01 600 np06/05/2008 0.129 0.006 1200 np02/06/2008 0.255 0.008 1000 np01/07/2008 0.156 0.008 5000 np05/08/2008 0.129 0.033 700 np02/09/2008 0.139 0.006 5600 np02/09/2008 0.121 0.033 800 np29/09/2008 0.291 0.03 2200 np27/10/2008 0.294 0.003 2600 np24/11/2008 0.293 0.003 300 np06/01/2009 0.195 0.009 1100 np30/01/2009 0.331 0.008 200 np02/03/2009 0.26 0.002 <LOD24/03/2009 0.203 0.008 200 np28/04/2009 0.188 0.015 300 np29/05/2009 0.264 0.002 <LOD24/06/2009 0.356 0.002 200 np24/07/2009 0.231 0.004 200 np17/08/2009 0.281 0.002 200 np24/09/2009 0.143 0.037 <LOD23/10/2009 0.158 0.009 400 np19/11/2009 0.145 0.013 4200 np19/11/2009 0.225 0.036 300 np11/12/2009 0.21 0.014 100 np08/01/2010 0.217 0.014 <LOD08/01/2010 0.215 0.015 <LOD02/02/2010 0.294 0.028 <LOD02/03/2010 0.326 0.017 <LOD01/04/2010 0.142 0.017 15300 np27/05/2010 0.405 0.018 <LOD25/06/2010 0.252 0.005 100 np26/07/2010 0.179 0.003 <LOD26/07/2010 0.216 0.034 <LOD25/08/2010 0.119 0.022 <LOD27/09/2010 0.121 0.002 <LOD26/10/2010 0.209 0.002 <LOD21/11/2010 0.186 0.019 <LOD09/12/2010 0.294 0.018 300 np06/01/2011 0.216 0.02 100 np10/02/2011 0.199 0.024 200 np07/03/2011 0.216 0.001 100 np07/03/2011 0.265 0.011 <LOD04/04/2011 0.279 0.033 <LOD05/05/2011 0.238 0.086 <LOD01/06/2011 0.28 0.062 <LOD27/06/2011 0.216 0.006 <LOD27/07/2011 0.131 0.009 <LODnp = Legionella non-pneumophila, <LOD = Below Limit of Detection (100CFU/l).
Table 4.5 Copper, silver and Legionella results from the 04th February 2008 to the 27th July
2011 of samples taken from the 56.030.1 hot tap (highlighted in bold are copper and silver
levels that were below the target levels).104
The average copper found in the samples taken from the 56.030.1 hot tap from the
04th February 2008 to the 27th July 2011 was 0.219mg/l (± 0.01mg/l). The average silver level found was 0.016mg/l (± 0.002mg/l).
The average cold water temperature recorded at the cold outlets sampled from the 10th
January to the 27th July 2011 was 15ºC (± 0.2ºC). The average hot water temperature recorded at the hot and blended outlets samples was 44ºC (± 0.5ºC).
The chloride level found in a sample taken from the incoming mains on the 06th
October 2009 was 17mg/l, the phosphorus was 390µg/l, and the pH was 8.45.
105
4.3 Study hospital 3
The results of samples taken on the 04th February 2008, before the copper and silver ionization system was activated, are shown in Table 4.6 below.
Sample Point Temp. Silver Copper LegionellaºC Mg/l Mg/l Cfu/l
APN 58 MT 35 0.004 0.034 <LODAPN 49 CT 16 <0.003 0.043 100 npAPN 49 MT 39 <0.003 0.056 1100 npNE 12 CT 17 <0.003 0.035 <LODNE 46 MT 34 <0.003 0.047 <LODPE 30 CT 16 <0.003 0.069 <LODDS 82 Shower Hot 34 <0.003 0.042 <LODDS 99 HT 57 <0.003 0.063 <LODDS 55 CT 20 <0.003 0.029 <LODDS 50 MT 39 <0.003 0.044 <LODANC 18 CT 15 <0.003 0.037 <LODANC 18 MT 41 <0.003 0.054 <LODANC 28 MT Not Taken Not Taken Not Taken 1200 s1ANC 28 CT 14 <0.003 0.109 <LODToilet Near 9 CT 12 0.014 0.033 <LODGW 1 MT 38 <0.003 0.057 <LODGW 25 Shower Hot 41 <0.003 0.059 <LODGW 50 MT 38 <0.003 0.058 500 npGW 85 MT 38 0.021 0.051 <LODSO 37 Shower Cold 13 0.015 0.034 <LODSO 37 Shower Hot 42 0.006 0.073 <LOD
MT = Mixer Tap, CT = Cold Tap, HT = Hot Tap, np = Legionella non-pneumophila, s1 =
Legionella pneumophila serogroup 1, <LOD = Below Limit of Detection (100CFU/l).
Table 4.6 Study hospital 3 - Results from samples taken on the 04th February 2008, before
commissioning of copper and silver ionization system.
Legionella were found at one cold outlet, at 100 cfu/l, and at three blended outlets, at
1200 cfu/l, 1100 cfu/l, and 500 cfu/l. Twenty one outlets were tested, around 20%
were, therefore, contaminated.
The Legionella colony forming unit counts found ranged from 100CFU/l to
1200CFU/l. The average Legionella count of the 21 outlets sampled was 138CFU/l (±
77CFU/l).
The average temperature recorded at the cold water outlets was 16ºC (± 1ºC). The
temperature recorded at the contaminated cold water outlet was 16ºC. The average
temperature at the hot water outlets was 38ºC (± 2.5ºC). The temperatures recorded at
106
the 3 contaminated hot outlets were all below 50ºC mainly because the hot water was
blended.
The average copper level found due to copper leaching from copper pipes was
0.051mg/l (± 0.004mg/l).
The copper and silver ionization system was activated on the 04th February 2008.
Table 4.7 below shows the results of samples taken on the 06th March 2008. Samples were taken from the 4 outlets that were contaminated before the system was activated and from 6 outlets that were identified as being at risk of Legionella contamination.
Sample Point Temp. Silver Copper LegionellaºC Mg/l Mg/l CFU/l
APN 49 CT 10 0.092 0.199 <LODAPN 49 MT 40 0.045 0.162 <LODANC 28 MT 40 0.049 0.188 <LODGW 50 MT 41 0.041 0.158 <LODDS 82 Shower Hot 41 0.039 0.155 <LODDS 50 MT 42 0.043 0.156 <LODDS 50 CT 10 0.083 0.183 <LODS0 37 Shower Cold 11 0.115 0.287 <LODSO 37 Shower Hot 42 0.044 0.150 <LODGW 25 Shower Hot 41 0.046 0.157 <LOD
MT = Mixer Tap, CT = Cold Tap, <LOD = Below Limit of Detection (100CFU/l).
Table 4.7 Study hospital 3 - Results from samples taken on the 06 th March 2008, one month after commissioning of copper and silver ionization system..
No Legionella were found in these samples with silver levels of between 0.039mg/l
and 0.115mg/l, the average silver level was 0.060mg/l (± 0.008mg/l), and copper
levels of between 0.150mg/l and 0.287mg/l, the average copper level was 0.180mg/l
(± 0.013mg/l).
The hot water temperatures recorded were all below 50ºC because it was blended
water. The average hot water temperature recorded was 41ºC (± 0.3ºC). The average
cold water temperature recorded was 10ºC (± 0.3ºC).
Legionella persisted at 1 blended outlet, APN 49 mixer tap (set on hot), until June
2009, after which no Legionella were detected in samples taken to May 2011, see
107
Graph 4.7 below. This graph shows the average Legionella count of all 10 outlets
sampled monthly from the 06th March 2008 to the 19th July 2011.Le
gion
ella
CFU
/l
1400
1200
1000
800
600
400
200
0
00. 8 8 8 9 9 0 0 0 1
01106 04 00 2 08/06/200927 00 26 01 01 24/11/20101 22/06/22 0 0 26/11 28 2
/08 0 0
08 /0 /05 /01
/0 /0 /12/20 /0 /03/20
3/4
6 94
3 2 890 6
Graph 4.7 Study hospital 3 – Average Legionella results from the 06th March 2008 to the 19th July 2011.
Graph 4.8 shows the average copper levels found in samples taken monthly from 10
outlets from the 06th March 2008 to the 19th July 2011.
The treated water started to discolour in 2009, which may have been due to high
phosphate levels in the mains water supply potentially forming precipitates with the
higher levels of copper, and the copper side of the ionization system was turned off
from the 08th June 2009 onwards.
The average copper levels in samples taken on the 08th June, the 09th July and the 04th
August 2009 remained, however, above 0.2mg/l, at 0.26mg/l, 0.241mg/l and 0.35mg/l respectively, which was most likely residual copper from the ionization treatment as well as copper leaching from the copper pipes in the water system, but the levels
reduced from the 27th August 2009 onwards. The average copper level from the 27th
August to the 19th July 2011 was 0.093mg/l (± 0.025mg/l), which was solely the copper that had leached from the copper pipes.
108
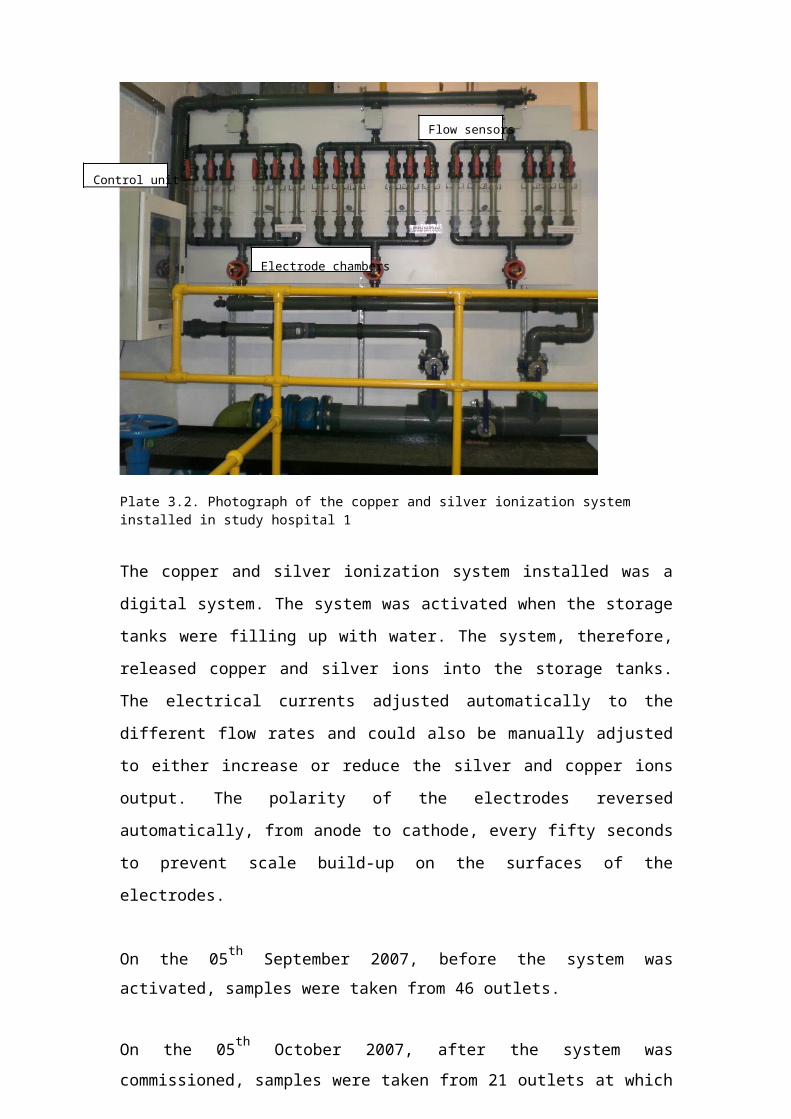
Graph 4.8 Study hospital 3 – Average copper levels from the 06th March 2008 to the 19th July 2011 (the red line is the target level for copper - 0.2mg/l).
Graph 4.9 shows the average silver level found in samples taken monthly from 10
outlets from the 06th March 2008 to the 19th July 2011.
Graph 4.9 Study hospital 3 – Average silver levels from the 06th March 2008 to the 19th July 2011 (the red line is the target level for silver - 0.02mg/l).
The average silver level from the 06th March 2008 to the 19th July 2011 was 0.033mg/l (± 0.003mg/l).
109

The copper target level at the blended outlet at which Legionella persisted, the APN
49 mixer tap (set on hot), was not maintained. The silver target level was also often
not maintained, see Table 4.8 below.
Date Copper Silver Legionellamg/l mg/l CFU/l
04/02/08 0.043 <0.0003 1100 np06/03/08 0.162 0.045 <LOD03/04/08 0.199 0.074 700 np16/05/08 0.172 0.038 <LOD03/07/08 0.243 0.079 <LOD01/08/08 0.202 0.051 200 np04/09/08 0.246 0.048 <LOD10/10/08 0.201 0.034 <LOD10/11/08 0.171 0.033 <LOD04/12/08 0.181 0.036 <LOD23/01/09 0.145 0.022 100 np26/02/09 0.155 0.033 100 np20/03/09 0.152 0.017 100 np15/04/09 0.183 0.044 200 np14/05/09 0.221 0.017 1000 np08/06/09 0.2 0.016 2400 np22/06/09 0.115 0.008 <LOD09/07/09 0.148 0.029 <LOD04/08/09 0.580 0.0012 <LOD27/08/09 0.086 0.017 <LOD05/10/09 0.074 0.02 <LOD22/10/09 0.075 0.017 <LOD26/11/09 0.071 0.001 <LOD17/12/09 0.098 0.009 <LOD28/01/10 0.056 0.0161 <LOD26/02/10 0.062 0.019 <LOD26/03/10 0.056 0.02 <LOD30/04/10 0.08 0.003 <LOD28/05/10 0.888 0.027 <LOD26/08/10 0.103 0.036 <LOD23/09/10 0.064 0.011 <LOD25/10/10 0.081 0.005 <LOD24/11/10 1.18 0.004 <LOD14/01/11 0.05 0.005 <LOD09/03/11 0.056 0.019 <LOD05/04/11 0.092 0.005 <LOD24/05/11 0.074 0.012 600 np07/06/11 0.146 0.003 400 np19/07/11 0.100 0.009 <LODnp = Legionella non-pneumophila, <LOD = Below Limit of Detection (100CFU/l).
Table 4.8 Copper, silver and Legionella results from the 04th February 2008 to the 19th July
2011 of samples taken from the APN 49 mixer tap (set on hot) (highlighted in bold are copper
and silver levels that were below the target levels).
No Legionella were found from June 2009 to May 2011 at this outlet, after the rubber
lined flexible hoses were replaced with copper pipes in June 2009, although the110
copper and silver target levels were not consistently met. Legionella were found in a
sample taken from the outlet on the 24th May 2011 but no Legionella were found in
the samples taken from the outlet on the 22nd June and the 19th July 2011, after the mixing valve attached to the outlet was cleaned.
The average copper found in the samples taken from the outlet was 0.185mg/l (±
0.04mg/l). The average silver level found was 0.023mg/l (± 0.003mg/l).
The average cold water temperature recorded at the cold outlets sampled from the 04th
February 2008 to the 19th July 2011 was 17ºC (± 0.3ºC). The average hot water temperature recorded at the hot and blended outlets sampled was 41ºC (± 0.3ºC).
The chloride level found in the sample taken from the incoming mains on the 05th
October 2009 was 24.5mg/l, the phosphorus was 1000µg/l, and the pH was 7.9.
111
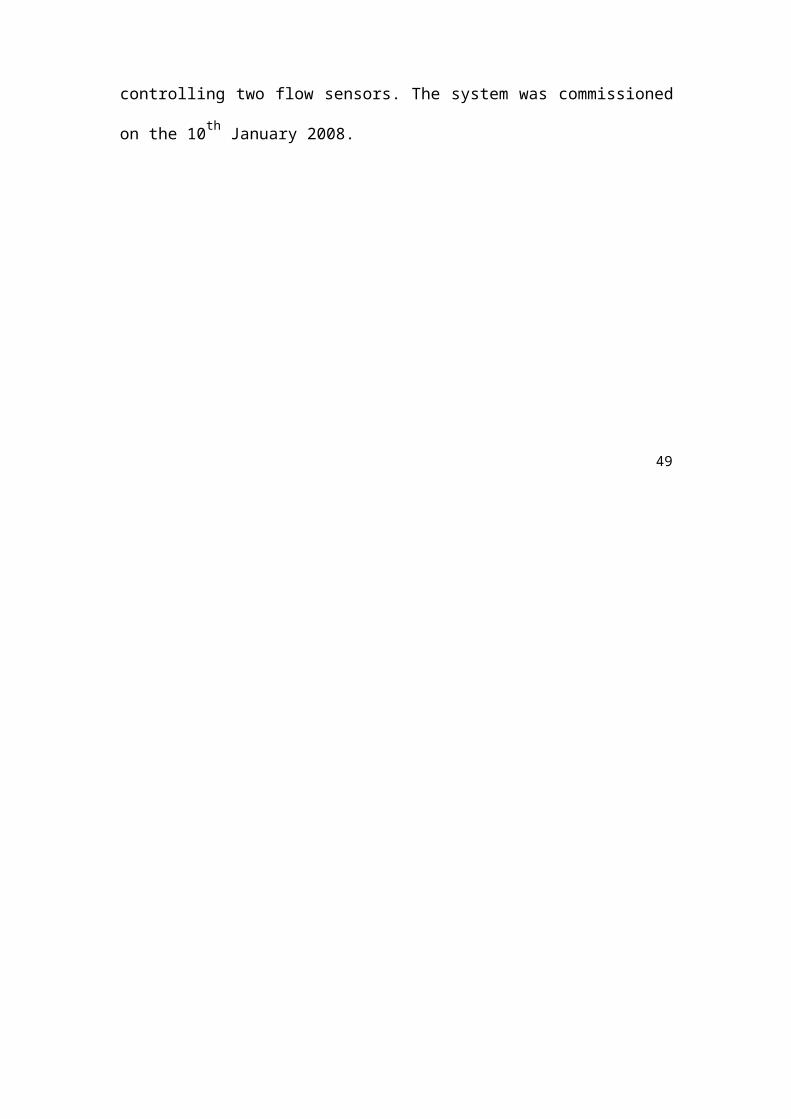
4.4 Study hospital 4
The results of samples taken on the 08th April 2008, before the copper and silver ionization system was activated, are shown in Table 4.9 below.
Sample Point Temp. Silver Copper LegionellaºC Mg/l Mg/l Cfu/l
S. Ward Male Bed HT 36 <0.003 0.135 <LODS11 shower hot 34 <0.003 0.169 <LODS. Ward Kitchen CT 13 <0.003 0.088 <LODB19 HT 36 <0.003 0.146 <LODB30 bath shower cold 13 <0.003 0.085 <LODB5 shower hot 41 <0.003 0.147 100 npO30 CT 15 <0.003 0.094 <LODO15 shower hot 38 <0.003 0.177 <LODO32 CT 13 <0.003 0.074 <LODL13 CT 14 <0.003 0.109 <LODL37 MT hot 40 <0.003 0.227 4100 npL29 CT 19 <0.003 0.291 <LOD
HT = hot tap, CT = cold tap, MT = Mixer tap, np = Legionella non-pneumophila, <LOD =
Below Limit of Detection (100CFU/l).
Table 4.9 Study hospital 4 - Results from samples taken on the 08 th April 2008, before commissioning of copper and silver ionization system.
Legionella were found in samples taken from 1 shower, at 100 CFU/L, and at 1 mixer
tap (set on hot), at 4100CFU/l. Twelve outlets were tested, around 17% were,
therefore, contaminated.
The average temperature at the hot water outlets was 37.5ºC (± 1ºC). Mixing valves
were blending the hot water with cold water at both contaminated outlets. The
temperatures recorded at the outlets were, therefore, 41ºC and 40ºC. The average
temperature recorded at the cold water outlets samples were taken from was 14.5ºC (±
0.9ºC).
The average copper level found due to copper leaching from copper pipes, was
0.145mg/l (± 0.019mg/l).
The copper and silver ionization system was activated on the 08th April 2008.
112
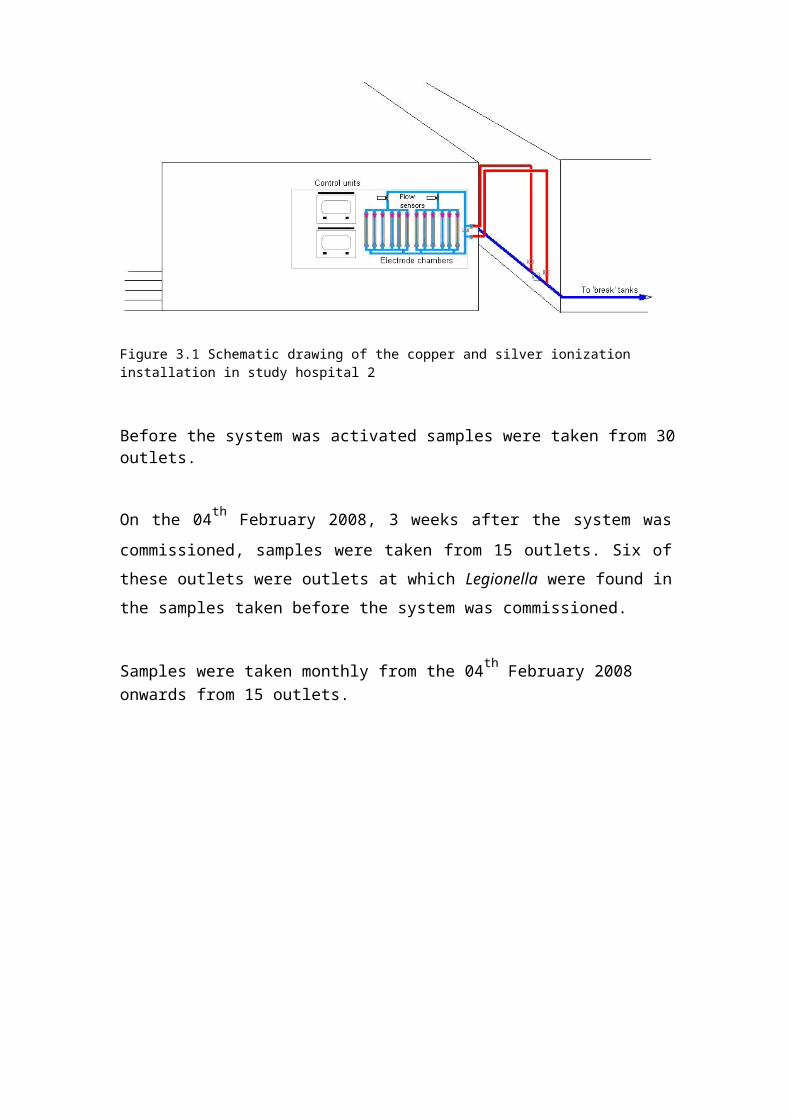
Table 4.10 below shows the results of samples taken on the 07th May 2008. Samples
were taken from the 2 outlets that were contaminated before the system was activated and from 3 more blended outlets that were identified as being at risk of Legionella contamination.
Sample Point Temp. Silver Copper LegionellaºC Mg/l Mg/l Cfu/l
L37 MT hot 43 0.034 0.327 2300 npB5 shower hot t 32 0.081 0.392 <LODS11 shower hot 32 0.096 0.398 <LODO15 shower hot 34 0.092 0.417 <LODB32 HT 42 0.091 0.383 <LOD
MT = Mixer tap, HT = Hot tap, np = Legionella non-pneumophila, <LOD = Below Limit of
Detection (100CFU/l).
Table 4.10 Study hospital 4 - Results from samples taken on the 07th May 2008.
No Legionella were found in the samples taken from 4 of the 5 outlets tested.
Legionella were found in 1 outlet that was previously contaminated but the Legionella
colony forming unit count had dropped from 4100CFU/l to 2300CFU/l. The
temperature recorded at the contaminated outlet was 43ºC, and the copper and silver
levels found were 0.327mg/l copper and 0.034mg/l silver.
The average copper level of the 5 outlets tested was 0.383mg/l (± 0.015mg/l), and the
average silver level was 0.079mg/l (± 0.011mg/l). The average hot water temperature
recorded was 37ºC (± 2ºC) because hot water was blended with cold water.
No Legionella were found in samples taken monthly from 6 outlets from the 30th May
2008 to the 28th June 2011, see Graph 4.10 below. Except for a high count of Legionella non-pneumophila, of 22400CFU/l, which was found in a sample taken
from a blended outlet (a shower, set on hot) on the 24th November 2008. No
Legionella were found at this outlet, however, since rubber lined flexible hoses were replaced with copper pipes in December 2008. The average copper level found in samples taken from the outlet from January 2009 to July 2010 was 0.451mg/l (± 0.012mg/l) and the average silver level was 0.04mg/l (± 0.003mg/l).
113

8000
7000
6000
CU
F/l
5000
Legi
onel
la 4000
3000
2000
1000
0
. 8
/2008
8 9 9
/2009
9 0 0010
0 0 1 1
/20118 0
000 0
011 1
011
00 /20 /2 /2 /2 /2 /2 /22
/05/20 /03/207
/05/205/7 0
/029 1 1
03/0 /1 /0 /0 /0 /1
07
/0 1
03/09 27 05/01/200927
1
06/07
0
05/11/200914
2
14/05
6
10/09/2010 12/01/201103
3
28/060 0 1 1 0 0
Graph 4.10 Study hospital 4 - Average Legionella results of all 6 outlets sampled monthly
from the 07th May 2008 to the 28th June 2011.
Graphs 4.11 and 4.12 show the averages of the copper and silver levels found in
samples taken monthly from 6 outlets from the 07th May 2008 to the 28th June 2011. The average copper level was 0.419mg/l (± 0.008mg/l). The average silver level was 0.043mg/l (± 0.003mg/l).
Graph 4.11 Study hospital 4 – Average copper levels from the 07th May 2008 to the 28th June 2011 (the red line is the target level for copper - 0.2mg/l).
114
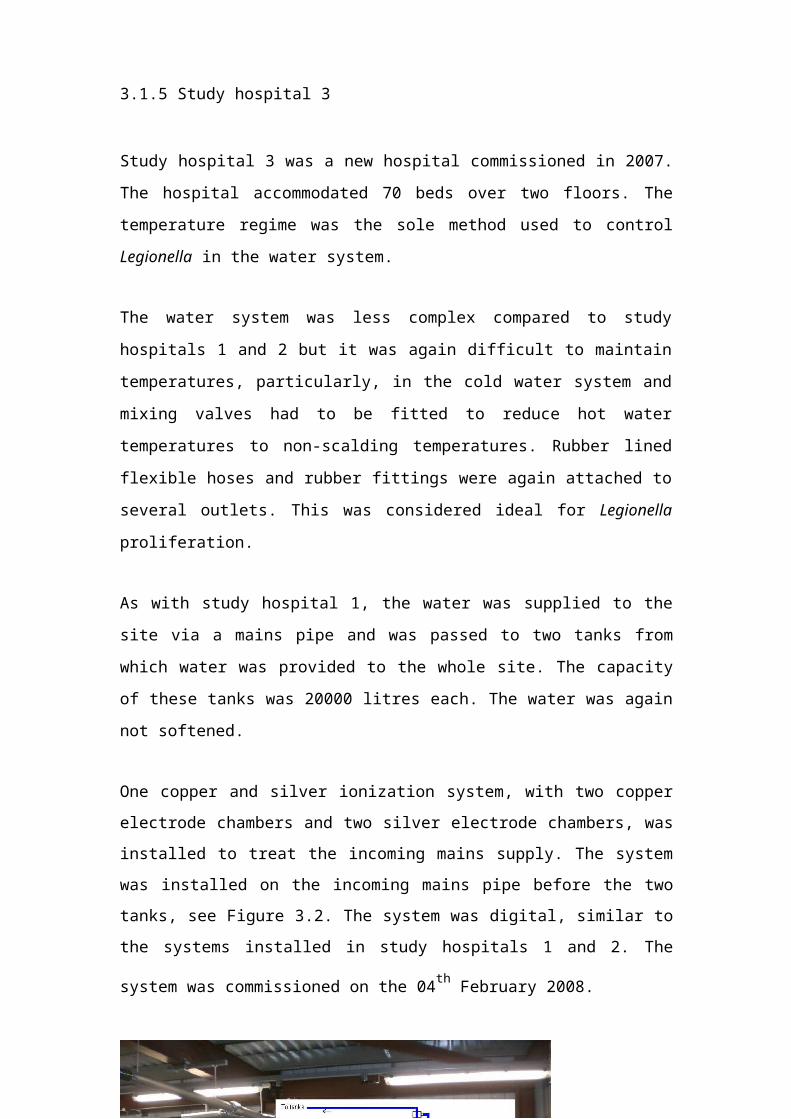
Graph 4.12. Study hospital 4 – Average silver levels from the 07th May 2008 to the 28th June 2011 (the red line is the target level for silver - 0.02mg/l).
The average hot water temperature recorded at the blended outlets sampled from the
07th May 2008 to the 28th June 2011 was 38ºC (± 0.3ºC).
The chloride level found in the sample taken from the incoming mains on the 08th October 2009 was 30.2mg/l, the phosphorus was 577µg/l, and the pH was 7.47.
115
4.5 Study hospital 5
The results of samples taken on the 25th July 2008, before the copper and silver
ionization systems were activated, are shown in Table 4.11 below.
The samples were taken from pure cold and pure hot outlets but in order to obtain a
wider view of the potential contamination of the cold and hot water system and to
reduce analysis costs, samples were also taken by filling sample bottles half with hot
water and half with cold water from 17 mixer taps, these outlets are abbreviated as
H&C on Table 4.11 below.
116
Sample Point Temp. Silver Copper LegionellaºC Mg/l Mg/l CFU/l
3.2.118 HT 60 <0.0003 0.214 <LOD3.2.118 CT 17 <0.0003 0.067 <LODS1 nurse station HT 42 <0.0003 0.160 <LODS1.nurse station CT 17 <0.0003 0.085 <LOD3.2.036 HT 43 <0.0003 0.176 100 np3.2.036 CT 17 <0.0003 0.176 400 npS2 nurse station CT 17 <0.0003 0.097 100 npS2 nurse station HT 42 <0.0003 0.174 100 np3.2.068 HT 40 <0.0003 0.314 100 np3.2.068 CT 20 <0.0003 0.212 200 npS3 nurse station HT 59 <0.0003 0.210 <LODS3 nurse station CT 20 <0.0003 0.272 <LOD3.2.089.3 HT 58 <0.0003 0.209 <LOD3.2.089.3 CT 21 <0.0003 0.251 100 npS4 nurse station HT 58 <0.0003 0.200 <LODS4 nurse station CT 21 <0.0003 0.087 <LODS4 sluice H&C 39 <0.0003 0.155 <LOD3.3.118 HT 60 <0.0003 0.205 <LOD3.3.118 CT 18 <0.0003 0.074 200 npH4 nurse station HT 60 <0.0003 0.202 <LODH4 nurse station CT 28 <0.0003 0.640 600 np3.3.106 H&C 33 <0.0003 0.159 <LODH3 nurse station HT 42 <0.0003 0.232 300 s1H3 nurse station CT 20 <0.0003 0.190 100 npH3 cleaners H&C 34 <0.0003 0.182 300 npH2 nurse station HT 54 <0.0003 0.213 <LODH2 nurse station CT 23 <0.0003 0.433 200 npRoom 68 H&C 37 <0.0003 0.450 400 np3.3.032/2 H&C 30 <0.0003 0.151 100 np3.3.019 H&C 28 <0.0003 0.202 500 npM kitchen HT 59 <0.0003 0.050 <LODM kitchen CT 17 <0.0003 0.127 <LODM shower H&C 28 <0.0003 0.147 <LODM sluice HT 55 <0.0003 0.208 <LODM sluice CT 22 <0.0003 0.202 2400 npA kitchen CT 25 <0.0003 17.9 <LOD4.3.39 H&C 27 <0.0003 0.174 1100 npF S1 H&C 31 <0.0003 4.92 100 npC2094 H&C 35 <0.0003 0.187 <LODC2027 CT 20 <0.0003 0.100 100 s1Theatres H&C 34 <0.0003 0.127 100 s1Endoscopy H&C 31 <0.0003 0.208 100 npMaternity sluice H&C 35 <0.0003 0.204 <LODD.1.12 H&C 43 <0.0003 0.178 300 np6.2.142 H&C 36 <0.0003 0.448 2600 s1C3152 H&C 35 <0.0003 0.168 300 s1C3100 shower HT 37 <0.0003 0.149 <LODC3060 H&C 33 <0.0003 0.213 <LODC3057 HT 57 <0.0003 0.207 <LODC3057 CT 19 <0.0003 0.161 <LODC3100 after filter HT 33 <0.0003 0.136 <LOD
HT = Hot tap, CT = Cold tap, H&C = sample filled with half hot and half cold water, np =
Legionella non-pneumophila, s1 = Legionella pneumophila serogroup 1, <LOD = Below
Limit of Detection (100CFU/l).
Table 4.11 Study hospital 5 - Results from samples taken on the 25th July 2008, before
commissioning of copper and silver ionization systems.
117

Legionella were found in samples taken from 25 outlets. Fifty one outlets were
sampled, therefore, around 49% of the outlets were contaminated.
The Legionella colony forming unit counts found ranged from 100CFU/l to
2600CFU/l. The average Legionella count of the 51 outlets sampled was 214CFU/l (±
10CFU/l). Blended and cold outlets were contaminated and Legionella were found in
11 of the 17 H&C samples taken.
The water temperatures recorded at 6 of the 17 cold water outlets sampled were above
20ºC. The average at the 17 cold water outlets tested was 20ºC (± 0.8ºC).
The average hot water temperature at the 17 hot water outlets tested was 51ºC (± 2ºC).
Although mixing valves were hidden and could not be seen, the hot water was, most
likely, blended with cold water at 7 of the 17 hot water outlets tested because the
temperatures recorded at these were ranging from 33ºC to 43ºC.
The average temperature recorded in the 17 H&C samples was 33ºC (± 1ºC).
The average copper level found at the 51 outlets, due to copper leaching from copper
pipes, was 0.323mg/l (± 0.014mg/l).
The copper and silver ionization systems were activated on the 25th July 2008.
Table 4.12 below shows the results of samples taken on the 18th August 2008 from the 25 outlets that were contaminated before the systems were activated.
118
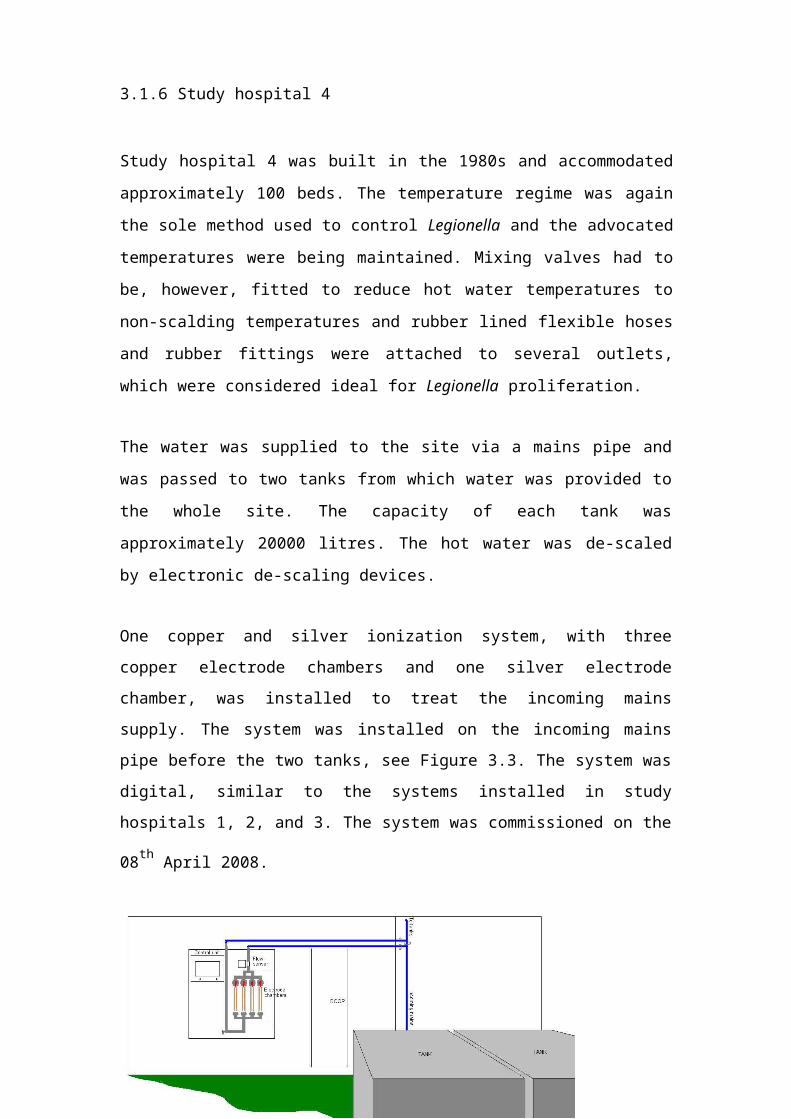
Sample Point Temp. Silver Copper LegionellaºC Mg/l Mg/l CFU/l
3.2.036 HT 22 0.074 0.434 <LOD3.2.036 CT 20 0.06 0.378 <LODS2 nurse station CT 43 0.080 0.428 <LODS2 nurse station HT 22 0.086 0.390 <LOD3.2.068 HT 43 0.066 0.473 <LOD3.2.068 CT 22 0.081 0.451 <LOD3.2.089.3 CT 20 0.099 0.404 <LOD3.3.118 CT 18 0.1 0.380 <LODH4 nurse station CT 22 0.089 0.424 <LODH3 nurse station HT 45 0.074 0.462 <LODH3 nurse station CT 18 0.094 0.444 <LODH3 cleaners H&C 28 0.063 0.469 <LODH2 nurse station CT 19 0.056 0.749 <LODRoom 68 H&C 35 0.039 0.612 200 np3.3.032/2 H&C 29 0.091 0.427 400 np3.3.019 H&C 27 0.086 0.428 800 npM sluice CT 18 0.089 0.472 <LOD4.3.39 H&C 32 0.084 0.540 <LODF S1 H&C 34 0.076 0.565 <LODTheatres H&C 32 0.094 0.428 <LODEndoscopy H&C 29 0.1 0.410 <LODD.1.12 H&C 34 0.083 0.434 <LOD6.2.142 H&C 32 0.019 0.746 100 s1 + 200 npC2027 CT 22 0.09 0.421 <LODC3152 H&C 30 0.097 0.438 <LOD
HT = Hot tap, CT = Cold tap, H&C = sample filled with half hot and half cold water, np =
Legionella non-pneumophila, s1 = Legionella pneumophila serogroup 1, <LOD = Below
Limit of Detection (100CFU/l).
Table 4.12 Study hospital 5 - Results from samples taken on the 18th August 2008.
No Legionella were found in samples taken from 21 outlets that were previously
contaminated. Only H&C samples were contaminated. The highest Legionella count
was 800CFU/l. The temperature recorded in this sample was 27ºC.
The cold temperatures remained above 20ºC at 4 out of the 10 cold water outlets
tested. The hot water temperatures were predominantly below 50ºC because it was,
most likely, blended water. The hot water temperature was particularly low at 22ºC at
the 3.2.036 hot tap.
119
The silver found in the 25 outlets tested ranged from 0.019mg/l to 0.1mg/l. The
average silver level was 0.079mg/l (± 0.004mg/l). The copper ranged from 0.378mg/l
to 0.749mg/l. The average copper level was 0.472mg/l (± 0.02mg/l).
Because the Legionella contaminated H&C samples that were taken on the 18th
August 2008 were half filled with hot water and topped up with cold water, samples
were taken on the 15th September 2008 from the hot and the cold sides of the 4 mixer taps. The results are shown in Table 4.13 below.
Temp. Silver Copper LegionellaSample Point CFU/lºC Mg/l Mg/l
Room 68 HT 42 0.038 0.553 2500 npRoom 68 CT 18 0.05 0.601 500 np3.3.032/2 HT 39 0.06 0.513 <LOD3.3.032/2 CT 14 0.066 0.582 <LOD3.3.019 HT 40 0.067 0.503 <LOD3.3.019 CT 14 0.055 0.580 100 np6.2.142 HT 38 0.02 0.498 100 np6.2.142 CT 20 0.021 0.869 100 np
HT = Hot tap, CT = Cold tap, np = Legionella non-pneumophila, <LOD = Below Limit of
Detection (100CFU/l).
Table 4.13 - Study hospital 5 - Results from samples taken on the 15th September 2008 from single hot and cold taps of the previously Legionella contaminated outlets.
Both the hot and cold water was contaminated at 2 of the 4 outlets tested. The cold
water only was contaminated at 1 of the 4 outlets tested. The highest Legionella count,
of 2500CFU/l, was found at a hot outlet that was, most likely, blended because the
temperature recorded was 42ºC.
From the 15th September 2008, the Legionella contamination declined in the blended
and cold water system, except for at 1 hot outlet at which a Legionella count of 2800CFU/l was found, and at 1 cold outlet at which a count of 3700CFU/l was found
in samples taken on the 13th November 2008. The samples were taken from the hot
and cold outlets of the same sink. The cold water was, most likely, contaminating the hot water because the water was, probably, blended as the temperature recorded was 35ºC. Although a higher count, of 1300CFU/l, was found in a sample taken on the
14th January 2009 after running the cold outlet for 10 minutes, after the rubber lined
flexible hoses were replaced in November 2008, the Legionella counts declined. No
120

Legionella were found at both outlets from February 2009 onwards. The average
silver level found in the samples taken from the hot outlet from the 15th September
2008 to March 2010 was 0.026mg/l (± 0.003mg/l), and the average copper level was
0.463mg/l (± 0.02mg/l). The average silver level found in the samples taken from the
cold outlet was 0.020mg/l (± 0.005mg/l), and the average copper level was 0.464mg/l
(± 0.03mg/l). The average hot temperature was 39ºC (± 1ºC). The average cold
temperature was 22ºC (± 1ºC).
Legionella counts were found in samples taken on the 18th November 2010 from a
cold outlet, at 3100CFU/l, from the hot outlet of the same sink, at 5800CFU/l, and
from another cold outlet, at 1500CFU/l. The temperatures recorded at the 2 cold
outlets were both 16ºC. The temperature recorded at the hot outlet was 40ºC, most
likely, because it was blended water. The copper and silver targets were met in these
samples but the copper and silver had been below the targets previously. The outlets
were flushed regularly after the Legionella were found, and the copper and silver
levels were kept above 0.3mg/l copper and 0.08mg/l silver in samples taken in
January, February and March 2011. In samples taken on the 04th May 2011 the copper
and silver levels dropped to 0.189mg/l copper and to 0.052mg/l silver in 1 of the cold
outlet samples and to 0.233mg/l copper and to 0.043mg/l silver in the hot outlet
sample, and Legionella returned, albeit at lower counts of 100CFU/l in the cold outlet
sample and 200CFU/l in the hot outlet sample. The average of the temperatures
recorded from January 2011 to the 04th May 2011 was 43ºC (± 2ºC) at the hot outlet
and 15ºC (± 0.5ºC), 14ºC (± 0.4ºC) at the cold outlets.
Graph 4.13 below shows the average Legionella counts in samples taken monthly
from 20 outlets from the 18th August 2008 to the 04th July 2011.
121

900
800
700
CFU/
l 600
500Le
gion
ella
400
300
200
100
0
. 808
9 909
0 010 011
11108 0 0
200 1
201 1
00/20 4/20 0/20
20 /20 2 /20/08/2 12/ 06/ 11/ /01/2010 05/ /07/2010
1/02/
61 0 1 1 0
1/
11/02/200906/
0/ /08/2009 0/ 0/
18 16/
5
05/
5 0
20/09/2018/
1
28/03/2006/1 1 0 3 2 22/03/201 2 0
Graph 4.13 Average Legionella counts in samples taken monthly from 20 outlets from the
18th August 2008 to the 04th July 2011.
Graphs 4.14 and 4.15 show the averages of the copper and silver levels found in
samples taken monthly from 20 outlets from the 15th September 2008 to the 04th July 2011. The average copper level was 0.366mg/l (± 0.02mg/l). The average silver level was 0.043mg/l (± 0.003mg/l).
Graph 4.14. Study hospital 5 – Average copper levels from 15 th September 2008 to the 04th
July 2011 (the red line is the target level for copper - 0.2mg/l).
122
Graph 4.15. Study hospital 5 – Average silver levels from the 15th September 2008 to the 04th
July 2011 (the red line is the target level for silver - 0.02mg/l).
The average hot water temperature recorded from the 15th September 2008 to the 04th
July 2011 was 46ºC (± 0.5ºC). The average cold water temperature was 16ºC (± 0.2ºC).
The chloride level found in the sample taken from the incoming mains on the 30th
November 2010 was 60.7mg/l, the phosphorus was 701µg/l, and the pH was 7.24.
123
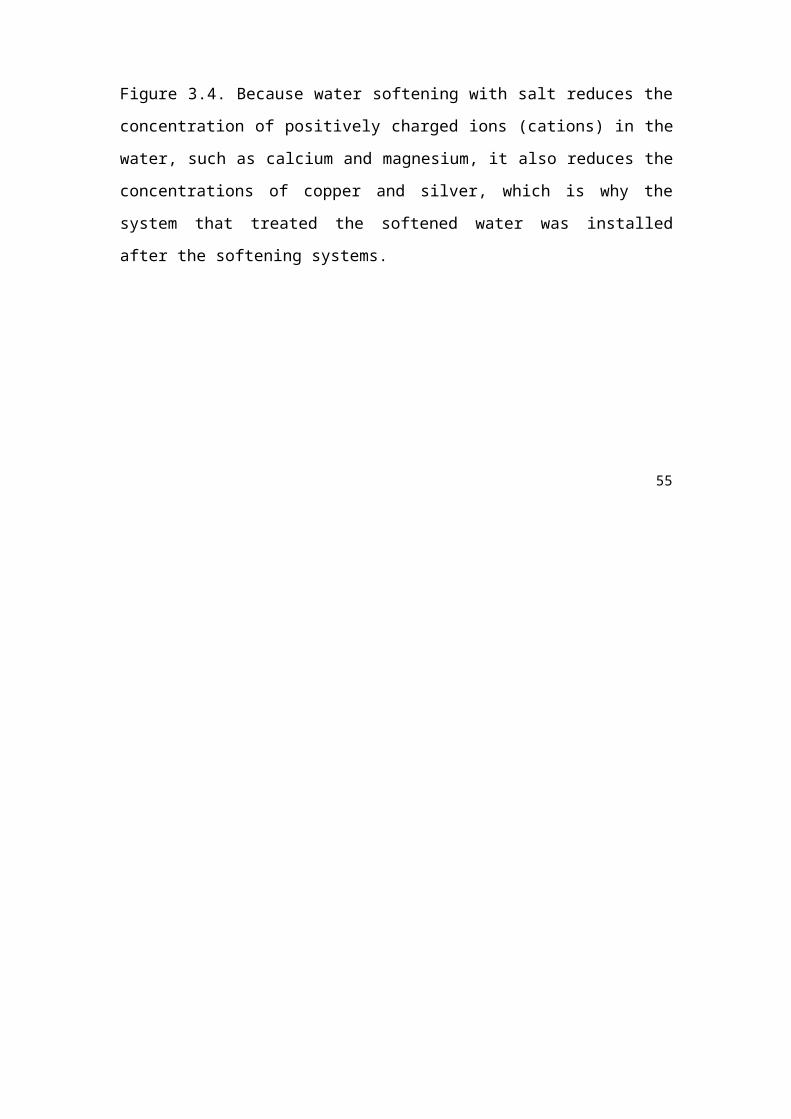
4.6 Study hospital 6
The results of samples taken on the 02nd October 2008, before the copper and silver ionization systems were activated, are shown in Table 4.14 below.
124
Sample Point Temp. Silver Copper LegionellaºC Mg/l Mg/l CFU/l
92-1-010 CT 16 <0.0003 0.058 <LOD31-01-019 CT 17 <0.0003 0.060 <LOD32-01-027 CT 21 <0.0003 0.473 <LOD32-01-007 HT 14 <0.0003 0.645 <LOD39-01-004 CT 16 <0.0003 0.043 <LOD39-01-004 HT 59 <0.0003 0.312 <LOD10-06-051 HT 36 <0.0003 0.428 <LOD10-01-040 HT 42 <0.0003 0.228 <LOD10-01-059 CT 23 <0.0003 0.185 <LOD047-2-002 CT 19 <0.0003 0.020 400 np047-2-002 HT 61 <0.0003 0.156 <LOD003-1-018 HT 55 <0.0003 0.285 <LOD003-1-018 CT 20 <0.0003 0.091 100 np075-2-006 HT 39 <0.0003 0.245 <LOD075-2-006 CT 17 <0.0003 0.093 <LOD074-06-041 CT 22 <0.0003 0.182 100 np074-06-057 HT 37 <0.0003 0.408 <LOD074-G-074 CT 21 <0.0003 0.203 <LOD011-G-075 CT 16 <0.0003 0.045 100 np011-06-042 HT 52 <0.0003 0.301 <LOD011-06-042 CT 20 <0.0003 0.096 100 np030-G-022 HT 31 <0.0003 0.568 600 np030-G-022 CT 18 <0.0003 0.139 300 np072-1-006 CT 17 <0.0003 0.057 <LOD072-1-006 HT 52 <0.0003 0.370 <LOD071-1-006 CT 17 <0.0003 0.047 <LOD071-1-006 HT 52 <0.0003 0.389 <LOD005-G-058 HT 37 <0.0003 0.399 <LOD007-1-025 CT 24 <0.0003 0.340 4000 s1067-G-001 CT 21 <0.0003 0.122 <LOD067-G-001 HT 36 <0.0003 0.412 100 s1004-G-037 CT 21 <0.0003 0.122 <LOD004-2-012 HT 54 <0.0003 0.213 <LOD004-2-012 CT 26 <0.0003 0.225 <LOD009-G-042 HT 41 <0.0003 0.422 <LOD009-G-042 CT 22 <0.0003 0.374 <LOD001-G-062 HT 42 <0.0003 0.522 <LOD001-G-062 CT 21 <0.0003 0.116 800 np095-G-B027 CT 18 <0.0003 0.086 <LOD095-G-B021 CT 25 <0.0003 1.28 <LOD095-G-B021 HT 40 <0.0003 1.14 <LOD095-1-H038 HT 39 <0.0003 0.784 <LOD095-1-H038 CT 21 <0.0003 0.658 <LOD095-G F21 CT 17 <0.0003 0.213 <LOD095-G-F21 HT 39 <0.0003 0.347 <LOD030-G-079 HT 40 <0.0003 0.414 <LOD030-G-079 CT 18 <0.0003 0.102 <LOD021-1-037 CT 20 <0.0003 0.159 200 np021-G-032 CT 21 <0.0003 0.241 <LOD021-B-014 CT 20 <0.0003 0.285 <LOD
HT = Hot tap, CT = Cold tap, np = Legionella non-pneumophila, s1 = Legionella
pneumophila serogroup 1, <LOD = Below Limit of Detection (100CFU/l).
Table 4.14 Study hospital 6 - Results from samples taken on the 02nd October 2008, before commissioning of copper and silver ionization systems.
125

Legionella were found in samples taken from 11 outlets. Fifty outlets were sampled,
therefore, 22% of the outlets were contaminated.
The Legionella colony forming unit counts found ranged from 100CFU/l to
4000CFU/l. The average Legionella count of the 50 outlets sampled was 136CFU/l (±
82CFU/l). Hot and cold outlets were contaminated.
The average hot water temperature at the 21 hot water outlets tested was 43ºC (± 2ºC).
Although mixing valves were hidden and could not be seen, the hot water could have
been blended with cold water at 13 of the 21 hot water outlets tested because the
temperatures recorded at these were ranging from 36ºC to 42ºC.
The water temperatures recorded at 13 of the 29 cold water outlets sampled were
above 20ºC. The average at the 29 cold water outlets tested was 20ºC (± 0.5ºC).
The average copper level found at the 50 outlets, due to copper leaching from copper
pipes, was 0.302mg/l (± 0.037mg/l).
The copper and silver ionization systems were activated on the 02nd October 2008.
Table 4.15 below shows the results of samples taken on the 27th November 2008 from the 11 outlets that were contaminated before the systems were activated and from 14 outlets that were identified as being at risk of Legionella contamination.
126
Sample Point Temp. Silver Copper LegionellaºC Mg/l Mg/l CFU/l
10-06-051 HT 40 0.0218 0.325 <LOD10-01-059 HT 40 0.0146 0.435 <LOD047-2-002 CT 10 < 0.0003 0.011 <LOD003-1-018 CT 13 0.0396 0.207 <LOD075-2-006 HT 41 0.0027 0.293 <LOD075-2-006 CT 10 0.0007 0.413 <LOD074-06-041 CT 15 0.0312 0.252 <LOD074-06-057 HT 40 0.0058 0.404 <LOD011-G-075 CT 10 0.0139 0.138 <LOD011-06-042 CT 14 0.0283 0.197 <LOD030-G-022 HT 46 0.0103 0.519 <LOD030-G-022 CT 14 0.0238 0.162 <LOD072-1-006 CT 13 0.0124 0.124 <LOD071-1-006 CT 11 0.0125 0.138 <LOD005-G-058 HT 32 0.0130 0.428 <LOD007-1-025 CT 18 0.0116 0.207 700 s1007-1-025 HT 47 0.0100 0.506 <LOD067-G-001 HT 40 0.0115 0.444 <LOD004-G-037 CT 13 0.0058 0.145 <LOD009-G-042 HT 44 0.0130 0.391 <LOD001-G-062 HT 41 0.0086 0.532 <LOD001-G-062 CT 14 0.0157 0.198 <LOD095-G-B021 HT 39 0.0047 1.48 <LOD095-1-H038 HT 40 0.0048 0.964 <LOD021-1-037 CT 16 0.0357 0.273 <LOD
HT = Hot tap, CT = Cold tap, s1 = Legionella pneumophila serogroup 1, <LOD = Below
Limit of Detection (100CFU/l).
Table 4.15 Study hospital 6 - Results from samples taken on the27th November 2008.
No Legionella were found in samples taken from 10 outlets that were previously
contaminated. The Legionella persisted only at 1 cold outlet, the 007-1-025 CT, but
the count had dropped from 4000CFU/l to 700CFU/L. The silver target, of 0.02mg/l,
was not met in the contaminated sample, only 0.012mg/l was found. The temperature
recorded at the contaminated outlet was 18ºC.
The cold temperatures recorded at the 13 cold outlets tested were below 20ºC. The hot
water temperatures at the 12 hot outlets tested were below 50ºC because it was, most
likely, blended water.
The silver found in the 25 outlets tested ranged from <0.0003mg/l to 0.036mg/l. The
average silver level was 0.014mg/l (± 0.002mg/l). The silver target level, of 0.02mg/l,
127
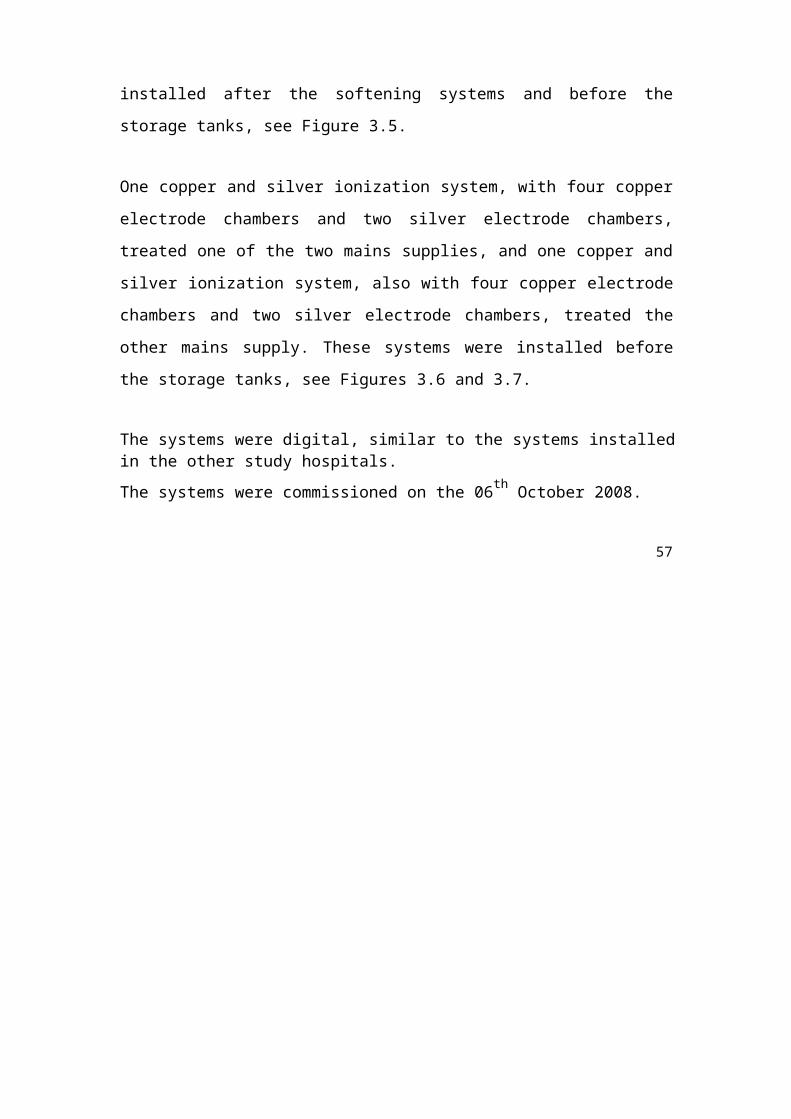
was not met at 19 of the 25 outlets tested. The copper ranged from 0.011mg/l to
1.480mg/l. The average copper level was 0.367mg/l (± 0.061mg/l. The copper target,
of 0.2mg/l, was not met at 8 of the 25 outlets tested.
Re-samples for Legionella, copper and silver analysis were taken from the 007-1-025
cold outlet on the 19th December 2008. 2700CFU/l were found in the sample taken
immediately after opening the outlet but the count dropped, to 300CFU/l, in the sample that was taken after running the outlet for 10 minutes. The silver target was not met in both samples and the copper target was also not met in the sample that was taken after running the outlet for 10 minutes.
It was difficult to maintain the copper and silver target levels at outlets because they
were not regularly used, and although the Legionella declined from the 07th January 2009 onwards, it persisted at outlets at which very low copper and silver levels were found.
A Legionella count of 4500CFU/l was found in the brushed through rubber lined hose
that was removed on the 25th March 2009 from the 007-1-025 outlet. After the hose was removed, the contamination dropped.
The copper and silver target levels were not consistently maintained at some outlets, and the contamination worsened. Legionella were found, albeit at low counts, in
samples taken from 8 outlets on the 22nd July 2009, from 10 outlets on the 02nd March
2010, from 5 outlets on the 11th January 2011 and from 5 outlets on the 31st May 2011. However, after the copper and silver levels increased and the targets were consistently met at the outlets, no Legionella were detected.
Graph 4.16 below shows the average Legionella counts in samples taken monthly
from 25 outlets from the 25th March 2009 to the 08th July 2011.
128
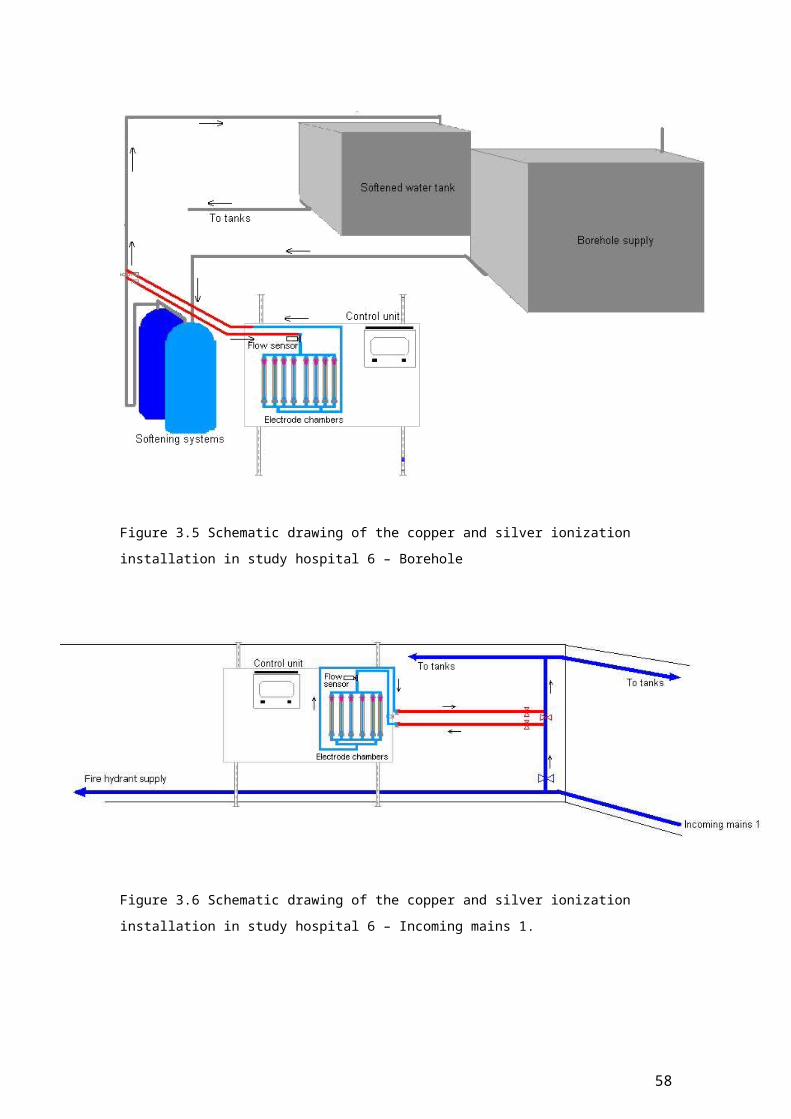
Graph 4.16 Study hospital 6 - Average Legionella counts in samples taken monthly from 25
outlets from the 25th March 2009 to the 08th July 2011.
Graphs 4.17 and 4.18 show the averages of the copper and silver levels found in
samples taken monthly from the 25 outlets from the 25th March 2009 to the 08th July 2011. The average copper level was 0.328mg/l (± 0.013mg/l). The average silver level was 0.021mg/l (± 0.001mg/l).
Graph 4.17 Study hospital 6 – Average copper levels from 25th March 2009 to the 08th July 2011 (the red line is the target level for copper - 0.2mg/l).
129
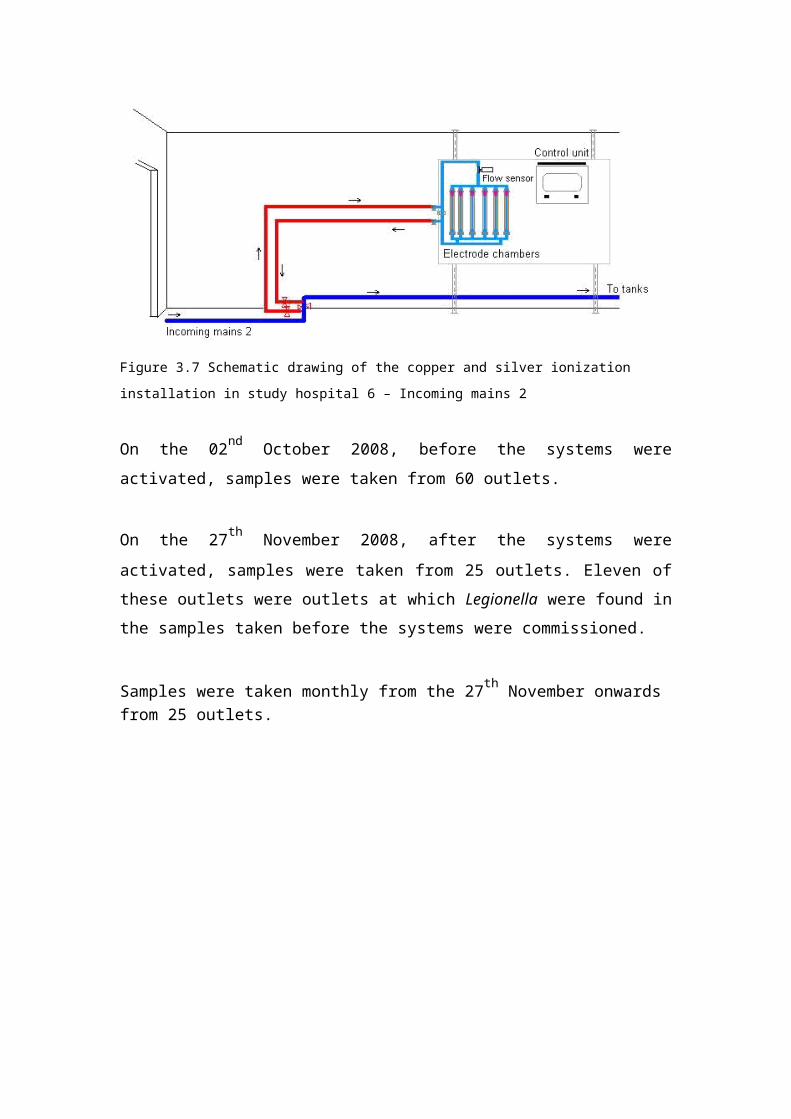
Graph 4.18 Study hospital 6 – Average silver levels from the 25th March 2009 to the 08th July
2011 (the red line is the target level for silver - 0.02mg/l).
The average hot water temperature recorded from the 02nd October 2008 to the 08th
July 2011 was 44ºC (± 0.4ºC). The average cold water temperature was 15ºC (± 0.1ºC).
The chloride level found in the sample taken from the incoming mains on the 26th
October 2009 was 46.7mg/l, the phosphorus was 1500µg/l, and the pH was 7.2.
The chloride level found in the sample taken from the borehole water on the 26 th
October 2009 was 32.9mg/l, the phosphorus was 2100µg/l, and the pH was 6.9.
130

4.7 Study hospital 7
The results of samples taken on the 25th November 2008, before the copper and silver ionization systems were activated, are shown in Table 4.16 below.
Sample Point Temp. Silver Copper LegionellaºC Mg/l Mg/l CFU/l
FB21 HT 35 < 0.0003 0.135 300 npFA91 HT 37 < 0.0003 0.387 1300 s1FA73 CT 15 < 0.0003 0.106 <LODGM24 HT 23 < 0.0003 0.602 44800 s1GG16 HT 51 < 0.0003 0.265 300 s1 + 200 npFA116 CT 17 < 0.0003 0.123 1400 npDE03 MT 34 < 0.0003 0.313 12100 npDE39 HT 36 < 0.0003 0.333 200 npDA43 MT 31 < 0.0003 0.346 7200 s1 + 6600 npCE101 CT 14 < 0.0003 0.101 <LODCE83 HT 42 < 0.0003 0.265 3600 s1 + 1200 npCE66 HT 61 < 0.0003 0.391 <LODFA2 CT 19 0.0020 11.8 10600 s1 + 76800 npAJ12 HT 28 < 0.0003 0.745 300 s1 + 100 npAE05 CT 14 < 0.0003 0.087 100 s1 + 3200 npAK 16 HT 39 0.0007 1.41 100 s2-14AX40 shower hot 33 < 0.0003 0.425 500 npAX12 CT 18 < 0.0003 0.201 3200 npAN04 HT 37 < 0.0003 0.527 100 npAN44 CT 23 < 0.0003 0.339 11000 npCY16 CT 13 < 0.0003 0.127 1100 npAWT Kitchen HT 64 < 0.0003 0.387 <LODCE118 CT 15 < 0.0003 0.299 200 s1D Nurse Station HT 60 < 0.0003 0.600 <LODBG11 MT 13 < 0.0003 0.160 100 s1 + 300 npBG23 HT 50 < 0.0003 0.488 <LOD
HT = Hot tap, CT = Cold tap, MT = Mixer tap, np = Legionella non-pneumophila, s1 =
Legionella pneumophila serogroup 1, s2-14 = Legionella pneumophila serogroup 2 to 14,
<LOD = Below Limit of Detection (100CFU/l).
Table 4.16 Study hospital 7. Results from samples taken on the 25th November 2008, before
commissioning of copper and silver ionization systems.
Legionella were found in samples taken from 20 outlets. Twenty six outlets were
sampled, therefore, around 77% of the outlets were contaminated.
The Legionella colony forming unit counts found ranged from 100CFU/l to
87400CFU/l. The average Legionella count of the 26 outlets sampled was 7188CFU/l
(± 3681CFU/l). Hot, blended and cold outlets were contaminated. The highest
131
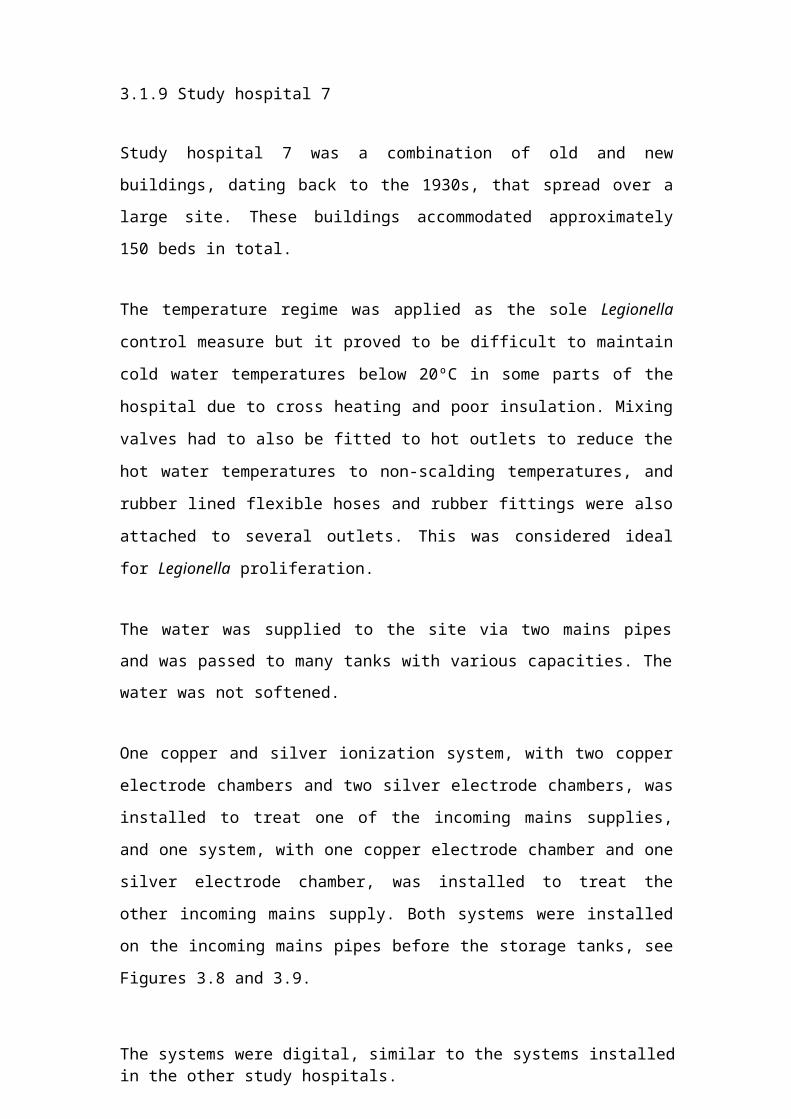
Legionella count, of 87400CFU/l, was found in a sample taken from a cold outlet.
The temperature recorded at this outlet was 19ºC.
The average hot water temperature at the 16 hot water outlets tested was 41ºC (± 3ºC).
Although mixing valves were hidden and could not be seen, the hot water could have
been blended with cold water at 11 of the 16 hot water outlets tested because the
temperatures recorded at these were ranging from 23ºC to 42ºC.
The water temperatures recorded at 9 cold water outlets were below 20ºC. The cold
water temperature was high at 1 outlet at 23ºC. The average at the 10 cold water
outlets tested was 16ºC (± 1ºC).
The average copper level found at the 26 outlets, due to copper leaching from copper
pipes, was 0.398mg/l (± 0.062mg/l). Copper levels exceeded 1mg/l in samples taken
from 2 outlets.
The copper and silver ionization systems were activated on the 25th November 2008.
Table 4.17 below shows the results of samples taken on the 05 th January 2009 from the 20 outlets that were contaminated before the systems were activated.
132
Sample Point Temp. Silver Copper LegionellaºC Mg/l Mg/l CFU/l
FB21 HT 33 0.0168 0.323 <LODFA91 HT 33 0.0434 0.644 100 npGM24 HT 17 0.0173 3.23 33600 s1 + 11600 npGG16 HT 58 0.0184 0.308 <LODFA116 CT 19 0.146 0.360 <LODDE03 MT 34 0.0983 0.509 700 npDE39 HT 33 0.0963 0.515 <LODDA43 MT 32 0.0635 0.609 600 s1CE83 HT 33 0.0771 0.343 1500 s1+ 1600 npFA2 CT 17 0.0467 0.395 100 s1 + 10800 npAJ12 HT 17 0.0236 2.16 100 s1 + 400 npAE05 CT 11 0.115 0.250 <LODAK 16 HT 37 0.0243 1.13 100 s1AX40 shower hot 31 0.0903 0.625 <LODAX12 CT 16 0.126 0.481 <LODAN04 HT 34 0.0350 0.581 300 npAN44 CT 23 0.0861 0.439 400 npCY16 CT 17 0.123 0.427 <LODCE118 CT 15 0.141 0.397 100 npBG11 MT 11 0.113 0.402 <LOD
HT = Hot tap, CT = Cold tap, MT = Mixer tap, np = Legionella non-pneumophila, s1 =
Legionella pneumophila serogroup 1, <LOD = Below Limit of Detection (100CFU/l).
Table 4.17 Study hospital 7. Results from samples taken on the 05th January 2009.
No Legionella were found in samples taken from 9 outlets that were previously
contaminated. The Legionella persisted at 11 outlets.
The Legionella colony forming unit counts had dropped in places. The average
Legionella count of the 20 outlets sampled was 3085CFU/l (± 2284CFU/l). Hot,
blended and cold outlets were again contaminated. The silver target level was not met
in the sample taken from a hot outlet in which 45200CFU/l was found, only 0.017mg/l
silver was found. The temperature recorded at this outlet was very low at 17ºC.
The cold temperatures recorded at the 8 cold outlets tested were below 20ºC, except
for at 1 cold outlet at which the temperature was 23ºC. The copper found in this
sample was 0.439mg/l, the silver was 0.086mg/l, and the Legionella count had
dropped from 11000CFU/l to 400CFU/l.
133
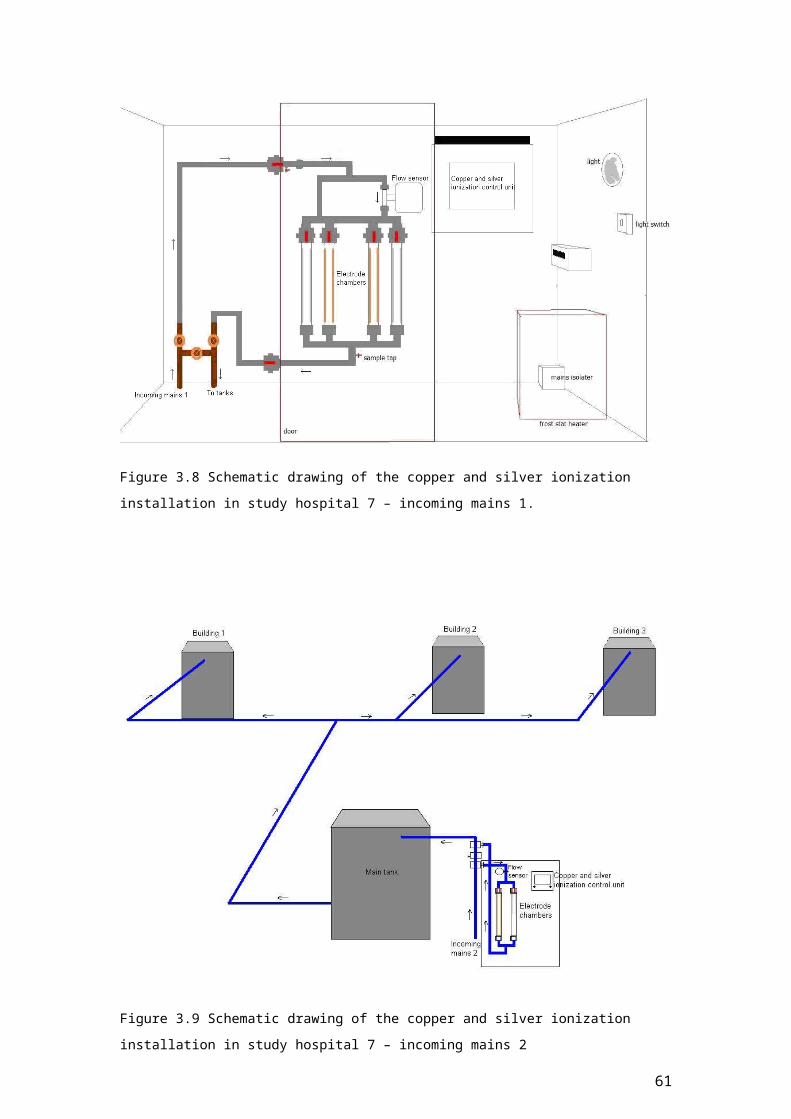
The hot water temperatures at the 12 hot outlets tested were below 50ºC, except for at
1 hot outlet at which the temperature was 58ºC.
The silver found at the 20 outlets tested ranged from 0.017mg/l to 0.146 mg/l. The
average silver level was 0.075mg/l (± 0.01mg/l). The silver target level, of 0.02mg/l,
was not met at 3 of the 20 outlets tested. The copper ranged from 0.25mg/l to
3.23mg/l. The average copper level was 0.706mg/l (± 0.16mg/l). The copper target, of
0.2mg/l, was met at all outlets tested.
From the 05th January 2009 the Legionella contamination declined. Legionella counts of 100CFU/l and 200 CFU/l only persisted at some outlets tested.
Graph 4.19 below shows the average Legionella counts in samples taken monthly
from 13 outlets from the 04th February 2009 to the 26th July 2011.
Graph 4.19. Study hospital 7 - Average Legionella counts in samples taken monthly from 13
outlets from the 04th February 2009 to the 26th July 2011.
A Legionella count of 7800CFU/l was found in a sample taken from a hot outlet on
the 20th August 2009, which increased the average level. The copper found in this
sample was above the target at 0.654mg/l, however, the silver target was not met as only 0.008mg/l silver was found. The temperature recorded was 35ºC, indicating that the hot water may have been blended with cold water.
134
Graphs 4.20 and 4.21 show the averages of the copper and silver levels found in
samples taken monthly from the 13 outlets from the 04th February 2009 to the 26th
July 2011. The average copper level was 0.539mg/l (± 0.02mg/l). The average silver level was 0.031mg/l (± 0.003mg/l).
Graph 4.20 Study hospital 7 – Average copper levels from the 04 th February 2009 to the 26th
July 2011 (the red line is the target level for copper - 0.2mg/l).
Graph 4.21 Study hospital 7 – Average silver levels from the 04 th February 2009 to the 26th
July 2011 (the red line is the target level for silver - 0.02mg/l).
135

The average hot water temperature recorded from the 25th November 2008 to the 26th
July 2011 was 40ºC (± 0.5ºC). The average cold water temperature was 18ºC (± 0.4ºC).
The chloride level found in the sample taken from the incoming mains on the 20th
October 2009 was 58.5mg/l, the phosphorus was 237µg/l, and the pH was 7.6.
136
4.8 Study hospital 8
The results of samples taken on the 27th April 2009, before the copper and silver ionization system was activated, are shown in Table 4.18 below.
137

Sample Point Temp. Silver Copper LegionellaºC Mg/l Mg/l CFU/l
RO PR2 CT 13.0 < 0.0003 0.005 <LODRO 002 HT 59.0 < 0.0003 0.067 <LODR1 018 CT 12.0 < 0.0003 0.019 500 npR1 149 HT 43.0 < 0.0003 0.060 100 s1 + 400 npR2 204 CT 12.0 < 0.0003 0.015 <LODR2 017 HT 54.0 < 0.0003 0.049 300 s1R3 122 CT 12.0 < 0.0003 0.010 100 npR3 022 MT 31.0 < 0.0003 0.061 100 npP3 012 HT 61.0 < 0.0003 0.066 <LODG3 021 MT 32.0 < 0.0003 0.033 <LODN3 015 CT 16.0 < 0.0003 0.014 <LODM3.023 HT 58.0 < 0.0003 0.063 <LODL3.001CT 15.0 < 0.0003 0.033 <LODD3.012 HT 59.0 < 0.0003 0.067 <LODE3 019 MT 27.0 < 0.0003 0.025 <LODF3 010 HT 58.0 < 0.0003 0.041 <LODN5 010 CT 16.0 < 0.0003 0.026 <LODF5.006 MT 25.0 < 0.0003 0.025 <LODG4.023 HT 63.0 < 0.0003 0.061 <LODP4.012 CT 14.0 < 0.0003 0.019 <LODN4.010 MT 42.0 < 0.0003 0.070 <LODM4.017 CT 13.0 < 0.0003 0.015 <LODN2.002 HT 45.0 < 0.0003 0.046 <LODN1.012 CT 12.0 < 0.0003 0.007 <LODE4.022 HT 61.0 < 0.0003 0.045 <LODD4.034 CT 12.0 < 0.0003 0.043 <LODL4.011 HT 57.0 < 0.0003 0.091 <LODK2.001 CT 12.0 < 0.0003 0.011 <LODD221 MT 42.0 < 0.0003 0.095 <LODE2.023 HT 61.0 < 0.0003 0.055 <LODM2.013 CT 14.0 < 0.0003 0.022 <LODF2.050 HT 45.0 < 0.0003 0.033 <LODG2.001 CT 12.0 < 0.0003 0.024 <LODP1.031 HT 49.0 < 0.0003 0.043 <LODP2.056 HT 58.0 < 0.0003 0.135 <LODF1.034 CT 12.0 < 0.0003 0.010 <LODF1.019 HT 60.0 < 0.0003 0.098 <LODG1.017 CT 12.0 < 0.0003 0.004 <LODGX HT 42.0 < 0.0003 0.149 <LODX1.005 CT 12.0 < 0.0003 0.014 <LODJ3.006 CT 12.0 < 0.0003 0.010 <LODAX002 HT 59.0 < 0.0003 0.042 <LODA2.024 HT 42.0 < 0.0003 0.073 300 s1A2.005 CT 15.0 < 0.0003 0.138 100 s1 + 200 npA2.011 MT 44.0 < 0.0003 0.391 100 s1 + 500 np
HT = Hot tap, CT = Cold tap, MT = Mixer tap, np = Legionella non-pneumophila, s1 =
Legionella pneumophila serogroup 1, <LOD = Below Limit of Detection (100CFU/l).
Table 4.18 Study hospital 8. Results from samples taken on the 27th April 2009, before
commissioning of copper and silver ionization system.
138
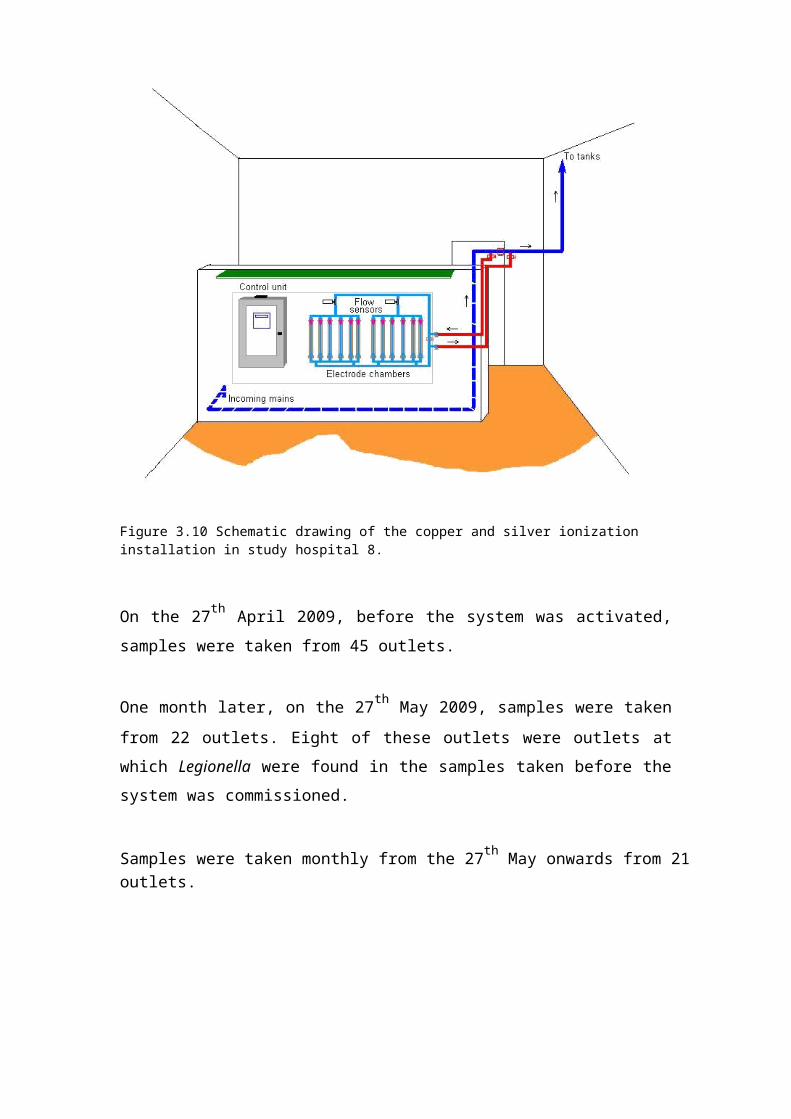
Legionella were found in samples taken from 8 outlets. Forty five outlets were
sampled, therefore, around 18% of the outlets were contaminated.
The Legionella colony forming unit counts found ranged from 100CFU/l to
600CFU/l. The average Legionella count of the 45 outlets sampled was 60CFU/l (±
23CFU/l). Hot, blended and cold outlets were contaminated. The highest Legionella
count, of 600CFU/l, was found in a sample taken from a blended outlet. The
temperature recorded at this outlet was 44ºC.
The average hot water temperature at the 26 hot water outlets tested was 49ºC (± 2ºC).
Although mixing valves were hidden and could not be seen, the hot water could have
been blended with cold water at 12 of the 26 hot water outlets tested because the
temperatures recorded at these were ranging from 25ºC to 45ºC.
The water temperatures recorded at the 19 cold water outlets were below 20ºC. The
average temperature at the 19 cold water outlets tested was 13ºC (± 0.3ºC). Three of
the 8 outlets that were contaminated with Legionella were cold outlets.
The average copper level found at the 45 outlets, due to copper leaching from copper
pipes, was 0.054mg/l (± 0.009mg/l).
The copper and silver ionization system was activated on the 27th April 2009.
Table 4.19 below shows the results of samples taken on the 27th May 2009 from the 8 outlets that were contaminated before the system was activated and from 14 outlets that had been identified as being at risk of Legionella contamination.
139

Sample Point Temp. Silver Copper LegionellaºC Mg/l Mg/l CFU/l
R1 018 CT 14.0 0.0306 0.191 100 npR1 149 HT 43.0 0.0194 0.152 <LODR2 017 HT 58.0 0.0115 0.094 <LODR3 122 CT 15.0 0.0325 0.209 100 npR3 022 MT 19.0 0.0299 0.342 2000 npG3 021 MT 32.0 0.0229 0.184 <LODN4.010 MT 37.0 0.0211 0.187 <LODA2.024 HT 40.0 0.0110 0.141 <LODA2.005 CT 15.0 0.0323 0.387 100 s1 + 200 npA2.011 MT 32.0 0.0190 0.176 <LODN5 010 CT 16.0 0.0314 0.233 <LODM4.017 CT 14.0 0.0156 0.230 <LODE4.022 HT 59.0 0.0096 0.104 <LODK2.001 CT 14.0 0.0187 0.187 <LODP4.012 CT 15.0 0.0317 0.230 <LODD3.012 HT 58.0 0.0052 0.098 <LODM3.023 HT 57.0 0.0095 0.125 <LODRO.002 HT 55.0 0.0155 0.143 <LODX1.005 CT 14.0 0.0297 0.193 <LODP1.031 HT 43.0 0.0182 0.142 <LODG2.001 CT 14.0 0.0318 0.910 <LODD221 MT 38.0 0.0114 0.153 <LOD
HT = Hot tap, CT = Cold tap, MT = Mixer tap, np = Legionella non-pneumophila, s1 =
Legionella pneumophila serogroup 1, <LOD = Below Limit of Detection (CFU/l).
Table 4.19 Study hospital 8. Results from samples taken on the 27th May 2009.
No Legionella were found in samples taken from 4 outlets that were previously
contaminated. The average Legionella count of the 22 outlets sampled was 114CFU/l
(± 91CFU/l). Three cold outlets and 1 blended outlet were contaminated. The copper
and silver targets were met in the contaminated samples.
The Legionella colony forming unit count had increased at 1 blended outlet from 100 CFU/l to 2000CFU/l. However, no Legionella were found in the sample taken from
this outlet on the 21st July 2009, only 100CFU/l were found in the sample taken on
the 17th September 2009, and from the 17th September 2009 onwards no Legionella were found.
The cold temperatures recorded at the 9 cold outlets tested were below 20ºC. The hot
water temperatures at 8 of the 13 hot outlets tested were below 50ºC.
140
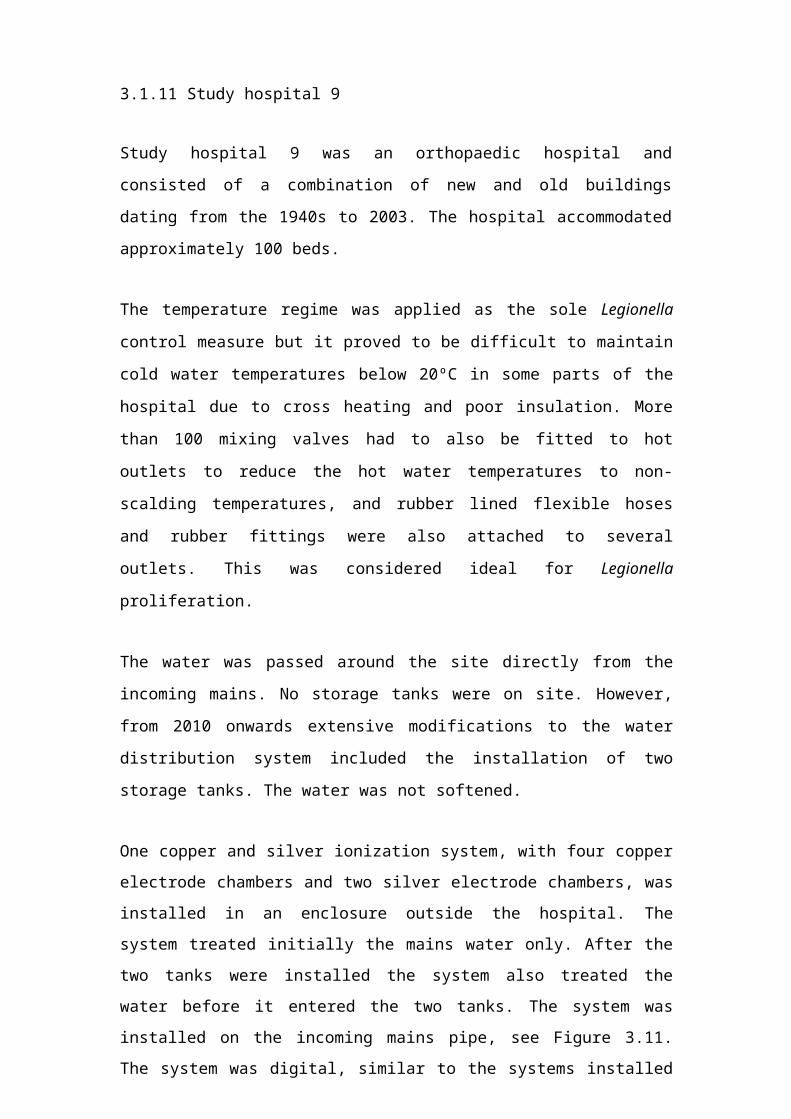
The silver found at the 22 outlets tested ranged from 0.005mg/l to 0.032mg/l. The
average silver level was 0.021mg/l (± 0.002mg/l). The copper ranged from 0.094mg/l
to 0.91mg/l. The average copper level was 0.219mg/l (± 0.036mg/l). The copper
target, of 0.2mg/l, was not met at 15 outlets.
Graph 4.22 below shows the average Legionella counts in samples taken monthly
from 22 outlets from the 27th May 2009 to the 25th July 2011.
Graph 4.22 Study hospital 8 - Average Legionella counts in samples taken monthly from 22
outlets from the 27th May 2009 to the 25th July 2011.
The Legionella contamination declined from the 27th May 2009 onwards but it
persisted at 1 cold outlet that was first tested on the 17th September 2009. The copper
and silver targets were met in the sample taken on the 17th September 2009, which indicated that a potentially large source, too large for the available copper and silver to completely control, could be seeding the bacteria into the water. Hospital estates personnel were, therefore, advised to trace the pipework upstream the outlet with the view to isolate and remove any potential Legionella sources. This was not done and the Legionella contamination persisted even though the copper and silver targets were met. High Legionella colony forming unit counts were found in samples taken from
the outlet on the 14th December 2009 – 7200CFU/l – and on the 21st October 2010 - 3500CFU/l in the sample taken immediately after opening outlet and 500CFU/l in the
141
sample taken after running outlet for 10 minutes. These counts increased the average
Legionella levels.
Graphs 4.23 and 4.24 show the averages of the copper and silver levels found in
samples taken monthly from the 22 outlets from the 27th May 2010 to the 25th July 2011. The average copper level was 0.187mg/l (± 0.01mg/l). The average silver level was 0.036mg/l (± 0.003mg/l).
Graph 4.23 Study hospital 8 – Average copper levels from the 27th May 2009 to the 25th July 2011 (the red line is the target level for copper - 0.2mg/l).
Graph 4.24 Study hospital 8 – Average silver levels from the 27 th May 2009 to the 25th July
2011 (the red line is the target level for silver - 0.02mg/l).
142
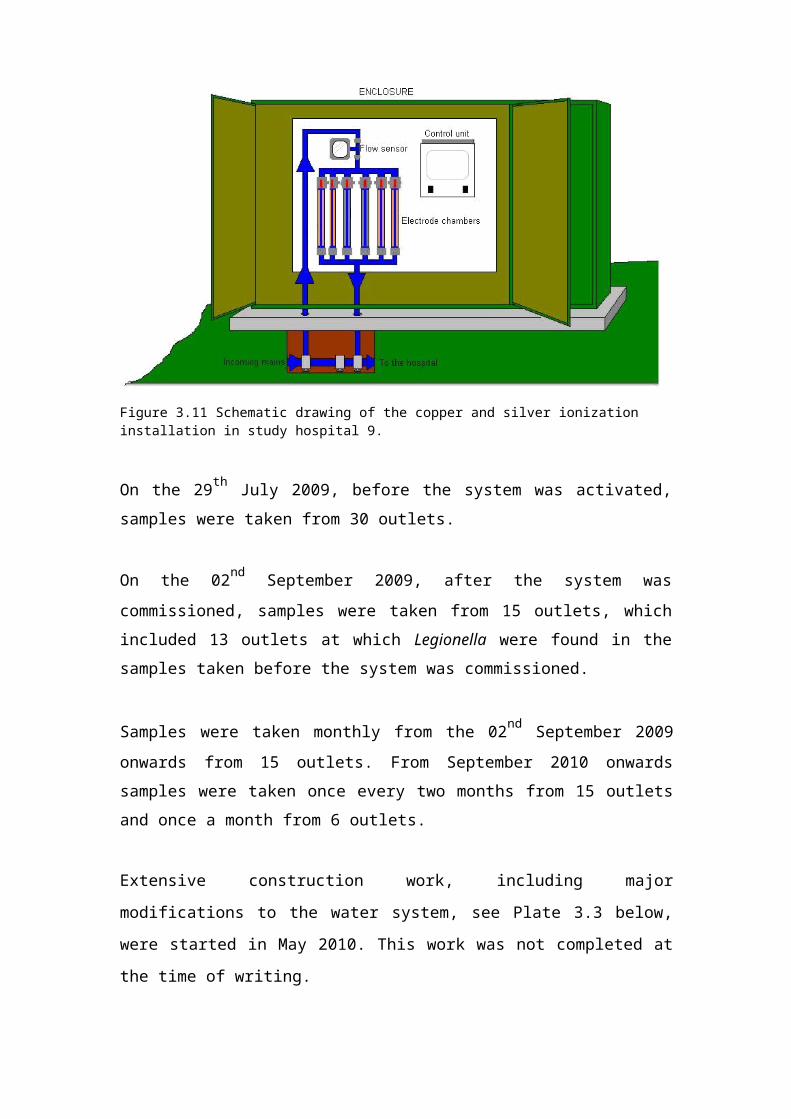
The copper release by the copper and silver ionization system was too low, which
resulted in less copper being available at the outlets. Legionella was, however,
controlled, which suggested that the higher silver levels at the outlets compensated for
the lower copper levels.
There was a substantial drop in silver found in the samples taken on the 24 th April 2010. This was explained by the samples not being pre-treated properly by another UKAS accredited laboratory that had to be used to analyze the samples.
The average hot water temperature recorded from the 27th April 2009 to the 25th July 2011 was 45ºC (± 0.4ºC). The average cold water temperature was 15ºC (± 0.2ºC).
The chloride level found in the sample taken from the incoming mains on the 15th
November 2010 was 8.4mg/l, the phosphorus was 452µg/l, and the pH was 8.5.
143

4.9 Study hospital 9
The results of samples taken on the 29th July 2009, before the copper and silver ionization system was activated, are shown in Table 4.20 below.
Sample Point Temp. Silver Copper LegionellaºC Mg/l Mg/l CFU/l
1F HT 47 < 0.0003 0.153 500 s11F CT 18 < 0.0003 0.022 <LOD1F WC MT 39 < 0.0003 0.129 1500 s2-14D6 HT 34 < 0.0003 0.115 <LODD3 shower set on hot 39 < 0.0003 0.122 300 s2-14Staff WC HT 46 < 0.0003 0.2 6400 s2-14Staff WC CT 23 < 0.0003 0.118 <LODD10 shower set on hot 37 < 0.0003 0.124 600 s1D11 CT 20 < 0.0003 0.053 <LODB1 HT 40 < 0.0003 0.179 100 s1Day room CT 19 < 0.0003 0.168 <LODB5 HT 49 < 0.0003 0.205 <LODPhysio CT 22 < 0.0003 0.15 <LODPhysio HT 53 < 0.0003 1.3 200 s2-14Red CT 17 < 0.0003 0.029 <LODTreatment room CT 18 < 0.0003 0.053 <LODTheatre shower set on hot 40 < 0.0003 0.173 <LODTSSU CT 18 < 0.0003 0.053 <LODAnaesthetic room 1 HT 51 < 0.0003 0.181 <LODRecovery room CT 22 < 0.0003 0.159 <LODT3 HT 46 0.0003 0.357 <LODT3 CT 20 < 0.0003 0.04 <LODJoyce shower set on hot 33 < 0.0003 0.126 100 npCillia shower set on cold 19 < 0.0003 0.068 <LODSurgical HT 51 < 0.0003 0.138 600 s2-14C16 shower set on hot 34 < 0.0003 0.125 700 s2-14X-Ray CT 32 < 0.0003 0.221 300 s2-14OP HT 49 < 0.0003 0.16 700 s2-14Disabled WC CT 24 < 0.0003 0.052 600 s2-14Hydro WC HT 47 < 0.0003 0.144 1000 s2-14
HT = Hot tap, CT = Cold tap, MT = Mixer tap, np = Legionella non-pneumophila, s1 =
Legionella pneumophila serogroup 1, s2-14 = Legionella pneumophila serogroup 2 to 14,
<LOD = Below Limit of Detection (100CFU/l).
Table 4.20 Study hospital 9. Results from samples taken on the 29th July 2009, before commissioning of copper and silver ionization system.
Legionella were found in samples taken from 14 outlets. Thirty outlets were sampled,
therefore, around 47% of the outlets were contaminated.
144
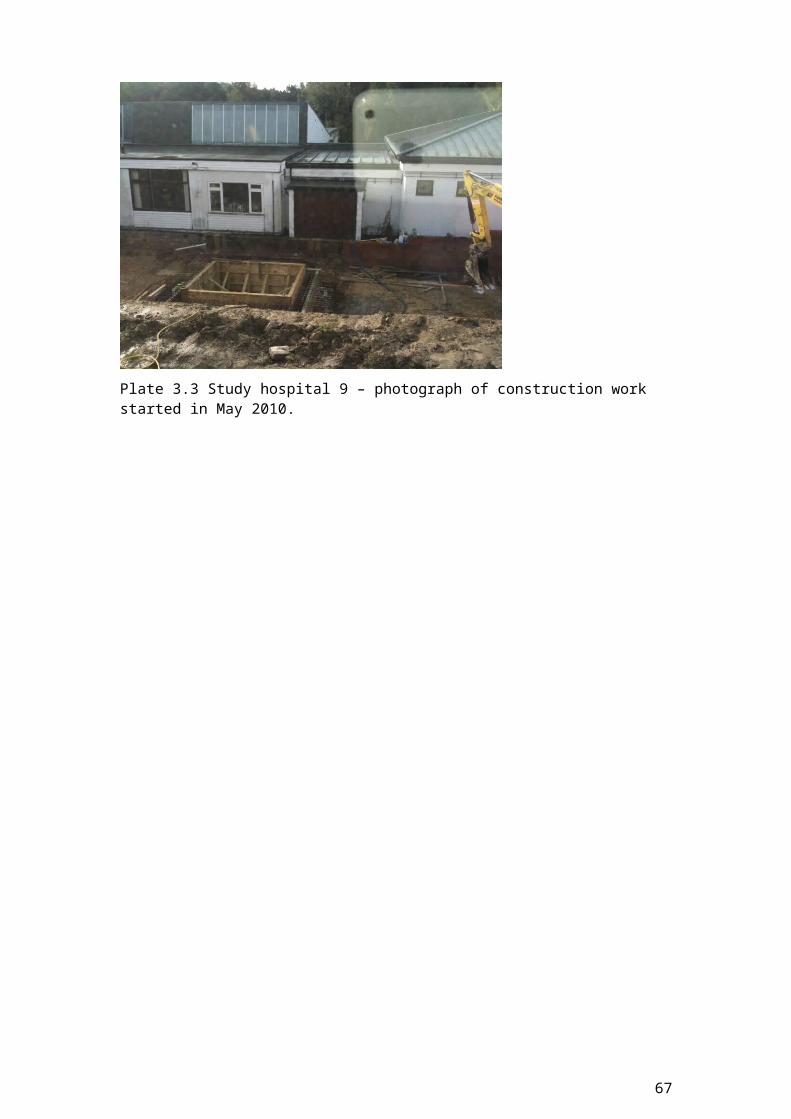
The Legionella colony forming unit counts found ranged from 100CFU/l to
6400CFU/l. The average Legionella count of the 30 outlets sampled was 453CFU/l (±
216CFU/l). Hot, blended and cold outlets were contaminated. The highest Legionella
count, of 6400CFU/l, was found in a sample taken from a blended outlet. The
temperature recorded at this outlet was 46ºC.
The average hot water temperature at the 17 hot water outlets tested was 43ºC (±
1.6ºC). Although mixing valves were hidden and could not be seen, the hot water
could have been blended with cold water at 12 of the 17 hot water outlets tested
because the temperatures recorded at these were ranging from 33ºC to 47ºC. Nine of
these outlets were contaminated with Legionella. The temperatures recorded at 3 of
the contaminated pure hot outlets were 53ºC, 51ºC, and 49ºC.
The average water temperature at the 13 cold water outlets tested was 21ºC (± 1.1ºC).
The temperatures recorded at the 2 contaminated cold outlets were high at 32ºC and
24ºC.
The average copper level found at the 30 outlets, due to copper leaching from copper
pipes, was 0.171mg/l (± 0.04mg/l). This figure included a high copper level of 1.3
mg/l found in a sample taken from a pure hot outlet. Excluding this level the average
copper level found was 0.132mg/l (± 0.01mg/l).
The copper and silver ionization system was activated on the 03rd August 2009.
Table 4.21 below shows the results of samples taken on the 02nd and 04th September 2009 from the 14 outlets that were contaminated before the system was activated and from 2 outlets that had been identified as being at risk of Legionella contamination.
145

Sample Point Temp. Silver Copper LegionellaºC Mg/l Mg/l CFU/l
1F HT 51 0.0382 0.318 <LOD1F WC MT 37 0.0322 0.385 500 npD3 shower set on hot 39 0.0958 0.367 400 npStaff WC HT 49 0.0369 0.316 <LODD10 shower set on hot 37 0.0946 0.292 300 s1B1 CT 24 0.0060 0.380 <LODB1 HT 47 0.031 0.31 <LODPhysio HT 52 0.0309 0.279 <LODTSSU CT 20 0.0363 0.142 <LODJoyce shower set on hot 39 0.0757 0.359 200 s1 + 100 npSurgical HT 53 0.0283 0.323 <LODC16 shower set on hot 38 0.0407 0.466 <LODX-Ray CT 28 0.0075 0.428 <LODOP HT 50 0.0269 0.323 <LODDisabled WC CT 24 0.0618 0.431 3300 npHydro WC HT 54 0.0389 0.327 <LOD
HT = Hot tap, CT = Cold tap, MT = Mixer tap, np = Legionella non-pneumophila, s1 =
Legionella pneumophila serogroup 1, <LOD = Below Limit of Detection (100CFU/l).
Table 4.21 Study hospital 9. Results from samples taken on the 02nd September 2009.
No Legionella were found in samples taken from 9 outlets that were previously
contaminated. The water temperatures recorded at 4 hot outlets, at which 500CFU/l,
400CFU/l, 300CFU/l and 300CFU/l Legionella were found, were below 40ºC, which
indicated that these outlets may have been blended.
The cold temperatures recorded at the 4 cold outlets tested were above 20ºC. The
temperature of the cold outlet, the disabled WC cold tap, at which Legionella
persisted, was 24ºC. The Legionella colony forming unit count increased at this outlet
from 300CFU/l found in the sample taken on the 29th July to 3300CFU/l. The
Legionella non-pneumophila species that were found instead of the Legionella
pneumophila serogroup 2 to 14 found previously must be an evidence of a new
contamination source.
The average Legionella count of the 16 outlets sampled was 300CFU/l (± 205CFU/l).
The silver found at the 16 outlets ranged from 0.006mg/l to 0.096mg/l. The average
silver level was 0.043mg/l (± 0.007mg/l). The silver target, of 0.02mg/l, was met at 14
of the 16 outlets tested. The copper ranged from 0.142mg/l to 0.477mg/l. The average
146
copper level was 0.34mg/l (± 0.018mg/l). The copper target, of 0.2mg/l, was met at 15
of the 16 outlets tested.
No Legionella were found in the samples taken from 15 outlets, including the
previously contaminated 5 outlets, on the 01st October 2009.
Legionella persisted at the cold outlet of the disabled WC, albeit at lower counts, from
the 29th October 2009 onwards.
Legionella were found in samples and re-samples taken from 15 outlets on the 27th
November 2009, see Table 4.22 below. The copper and silver targets were met in
these samples.
Sample Point Temp. Silver Copper LegionellaºC Mg/l Mg/l CFU/l
1F HT 57 0.0289 0.295 <LOD1F WC MT 41 0.0475 0.29 <LODD3 shower set on hot 41 0.0398 0.312 2600 npStaff WC HT 42 0.0344 0.339 4500 npD10 shower set on hot 43 0.0574 0.28 200 s1B1 HT 43 0.0565 0.32 <LODTherapy HT 41 0.0551 0.297 <LODTSSU CT 14 0.0891 0.105 <LODJoyce shower set on hot 56 0.0059 0.256 <LODSurgical HT 50 0.0239 0.309 100 npC16 shower set on hot 42 0.0772 0.365 <LODX-Ray CT 19 0.0035 0.383 <LODOP HT 52 0.0309 0.552 <LODDisabled WC CT – pre-flush 15 0.0955 0.268 1800 npDisabled WC CT – post-flush 14 0.0917 0.265 1900 npHydro WC HT 42 0.0417 0.301 <LOD
HT = Hot tap, CT = Cold tap, MT = Mixer tap, np = Legionella non-pneumophila, s1 =
Legionella pneumophila serogroup 1, <LOD = Below Limit of Detection (100CFU/l).
Table 4.22 Study hospital 9. Results from samples and re-samples taken on the 27th
November 2009.
Graph 4.25 below shows the average Legionella counts in samples and re-samples
taken monthly from the 02nd September 2009 to the 15th July 2011.
147
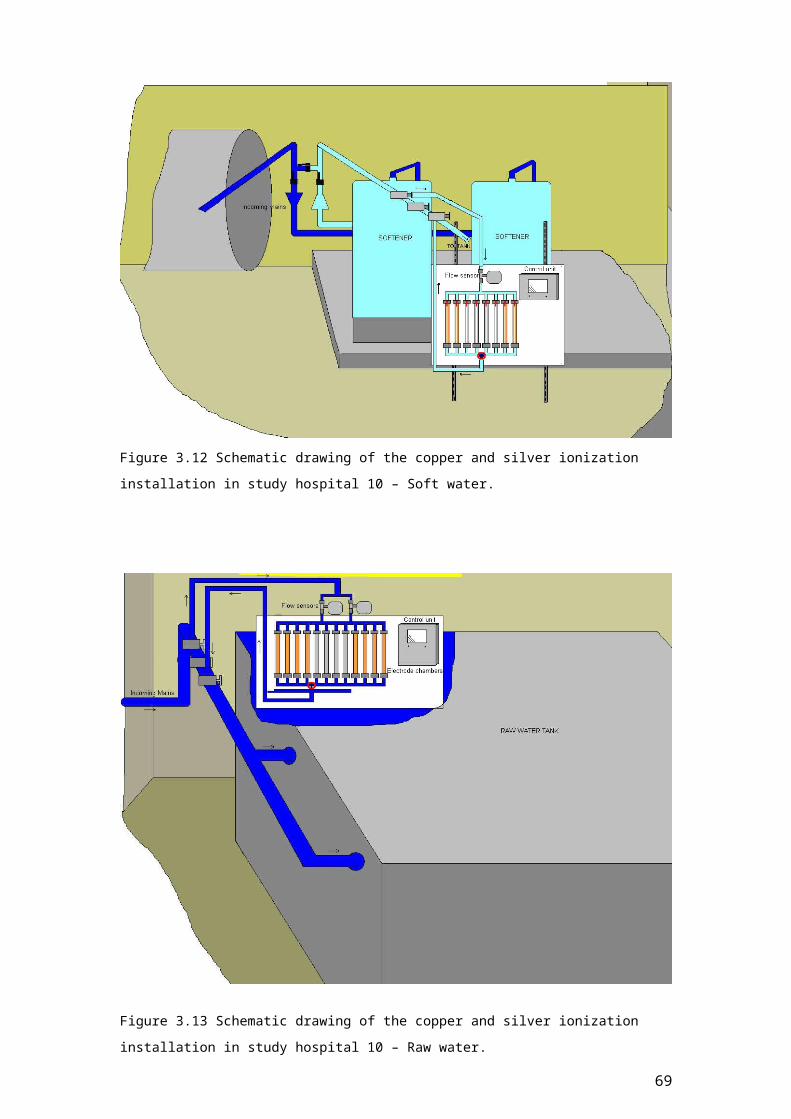
Graph 4.25 Study hospital 9 - Average Legionella counts in samples and re-samples taken
monthly from the 02nd September 2009 to the 15th July 2011.
After the construction work was started, higher Legionella colony forming unit counts
were found in re-samples taken on the 24th June 2010, in samples and re-samples
taken on the 29th October 2010, and in re-samples taken on the 15th July 2011, see Tables 4.23, 4.24, and 4.25 below.
148
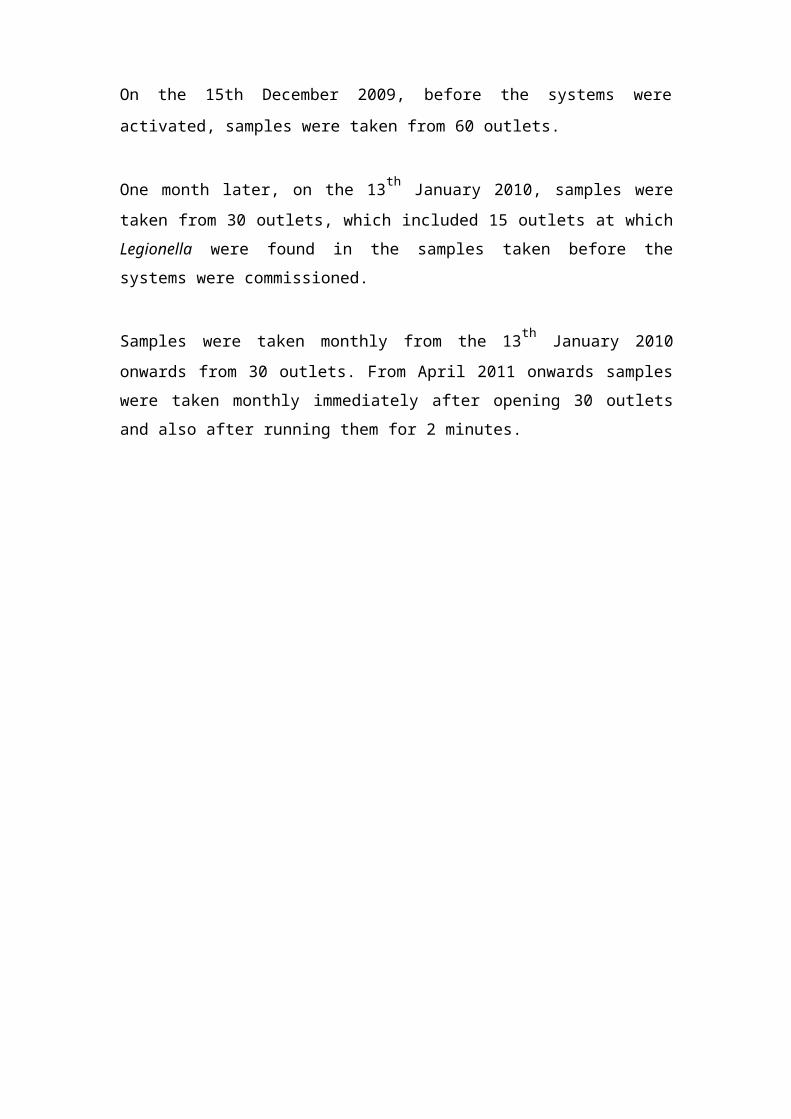
Sample Point Temp. Silver Copper LegionellaºC Mg/l Mg/l CFU/l
1F HT - pre-flush 44 0.0145 0.309 <LOD1F HT – post-flush 47 0.0171 0.295 <LOD1F WC MT – pre-flush 40 0.0215 0.359 1100 np1F WC MT – post-flush 40 0.0286 0.301 100 npStaff WC HT – pre-flush 40 0.0094 0.41 <LODStaff WC HT – post-flush 40 0.0254 0.308 <LODD3 shower set on hot – pre-flush 20 0.0037 0.563 <LODD3 shower set on hot – post-flush 49 0.0185 0.302 <LODB1 HT – pre-flush 32 0.0131 0.278 <LODB1 HT – post-flush 42 0.0211 0.285 <LODDisabled WC MT – pre-flush 41 0.0061 0.266 2600 npDisabled WC MT – post-flush 41 0.0153 0.282 400 npConsulting room 5 HT – pre-flush 48 0.0094 0.373 100 s2-14Consulting room 5 HT – post-flush 53 0.0131 0.351 <LODC16 shower set on hot 41 0.0172 0.378 <LODTSSU CT 17 0.0257 0.228 <LODHydro WC HT 56 0.0088 0.292 <LODOP HT 50 0.008 0.292 <LODX-Ray CT 19 0.02 0.337 <LODJoyce shower set on hot 45 0.0088 0.397 <LODD8 shower set on hot 40 0.0137 0.267 <LODD10 shower set on hot 50 0.0073 0.245 <LOD
HT = Hot tap, CT = Cold tap, MT = Mixer tap, np = Legionella non-pneumophila, s2-14 =
Legionella pneumophila serogroup 2 to 14, <LOD = Below Limit of Detection (100CFU/l).
Table 4.23 Study hospital 9. Results from re-samples taken on the 24th June 2010. The copper
target was met in all the samples taken from the contaminated outlets.
Sample Point Temp. Silver Copper LegionellaºC Mg/l Mg/l CFU/l
1F HT 48 0.0176 0.378 <LOD1F WC MT 35 0.0537 0.363 100 npDisabled WC MT – pre-flush 35 0.0581 0.367 5800 npDisabled WC MT – post-flush 38 0.0583 0.369 1000 npConsulting room 5 MT 50 0.0300 0.673 1300 s2-14TSSU CT 15 0.0462 0.187 <LODOP HT 39 0.0307 0.549 <LODX-Ray CT 22 0.0539 0.457 <LODJoyce shower set on hot 38 0.0527 0.510 <LODD7 shower set on hot – pre-flush 34 0.0314 0.340 <LODD7 shower set on hot – post-flush 39 0.0491 0.312 <LODD10 shower set on hot – pre-flush 30 0.0158 0.324 100 s1D10 shower set on hot – post-flush 52 0.0245 0.285 <LOD
HT = Hot tap, CT = Cold tap, MT = Mixer tap, np = Legionella non-pneumophila, s1 =
Legionella pneumophila serogroup 1, s2-14 = Legionella pneumophila serogroup 2 to 14,
<LOD = Below Limit of Detection (100CFU/l).
Table 4.24 Study hospital 9. Results from samples and re-samples taken on the 29th October
2010.
149

Sample Point Temp. Silver Copper LegionellaºC Mg/l Mg/l CFU/l
1F WC MT – pre-flush 36 0.037 0.399 <LOD1F WC MT – post-flush 38 0.0492 0.3237 <LODCilla shower set on hot – pre-flush 34 0.0158 0.3349 1600 s1Cilla shower set on hot – post-flush 36 0.0572 0.3101 <LODJoyce shower set on hot – pre-flush 41 0.0123 0.3293 1400 npJoyce shower set on hot – pre-flush 41 0.047 0.3096 <LOD
MT = Mixer tap, np = Legionella non-pneumophila, s1 = Legionella pneumophila serogroup
1, <LOD = Below Limit of Detection (100CFU/l).
Table 4.25 Study hospital 9. Results from re-samples taken on the 15th July 2011.
The silver target was not met in samples taken from 2 contaminated outlets on the 24th
June 2010, also not in a sample taken from 1 contaminated outlet on the 29 th October
2010, and also not in the samples taken from the 2 contaminated outlets on the 15th
July 2011.
Graphs 4.26 and 4.27 show the averages of the copper and silver levels found in
samples and re-samples taken monthly from the 02nd September 2009 to the 15th July 2011. The average copper level was 0.398mg/l (± 0.026mg/l). The average silver level was 0.037mg/l (± 0.004mg/l).
Graph 4.26 Study hospital 9 – Average copper levels from the 02nd September 2009 to the 15th July 2011 (the red line is the target level for copper - 0.2mg/l).
150
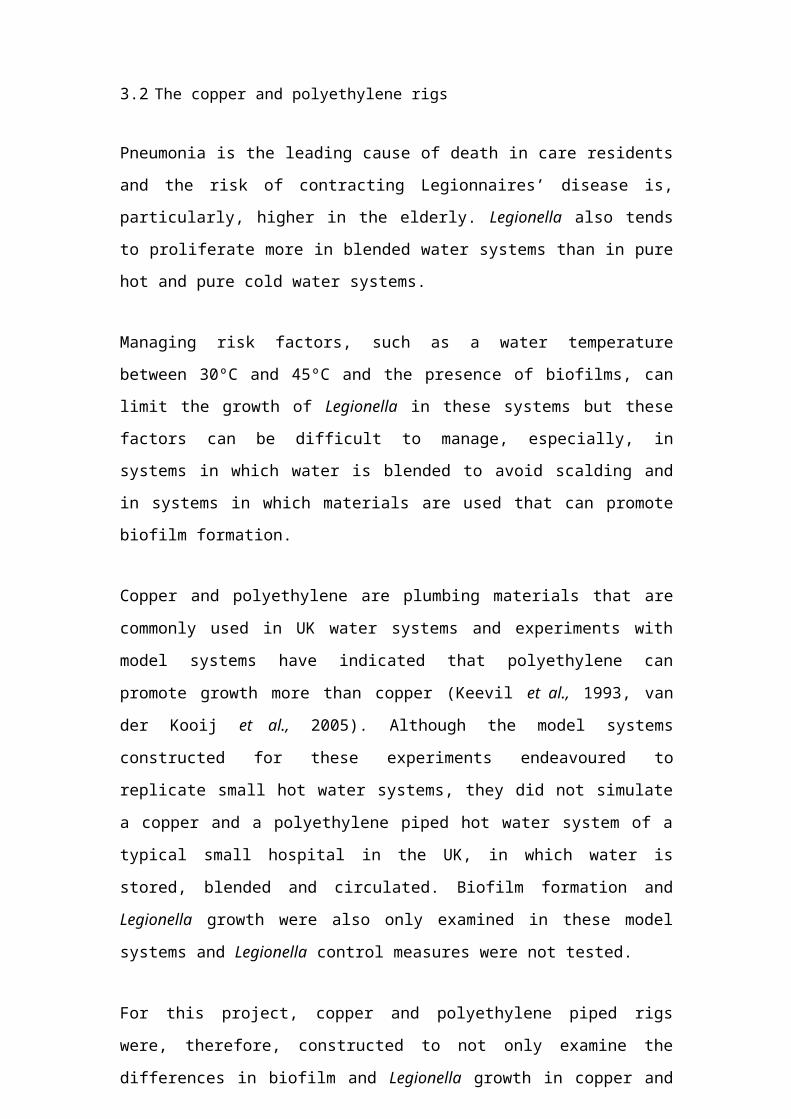
Graph 4.27 Study hospital 9 – Average silver levels from the 02nd September 2009 to the 15th
July 2011 (the red line is the target level for silver - 0.02mg/l).
The results suggested that interruptions to the water system, due to the extensive
construction work, had increased microbial growth and biofilm formation due to water
pipes being exposed to the environment and wards being temporarily unoccupied,
which may have resulted in an influx of organisms entering the water system from
outside and water stagnation. Modifications to the pipework may also have dislodged
biofilms and may have caused biofilms to disperse, colonizing other parts of the water
system. Although the copper and silver target levels to control Legionella, of more
than 0.2mg/l copper and more than 0.02mg/l silver, at outlets were mainly met, not
enough was available at the Legionella contaminated outlets to completely control the
microbial growth and Legionella contamination.
The average hot water temperature recorded from the 29th July 2009 to the 15th July 2011 was 43ºC (± 0.4ºC). The average cold water temperature was 17ºC (± 0.5ºC).
The chloride level found in the sample taken from the incoming mains on the 01st
October 2009 was 54.9mg/l, the phosphorus was 191µg/l, and the pH was 7.5.
151
4.10 Study hospital 10
The results of samples taken on the 15th December 2009, before the copper and silver ionization systems were activated, are shown in Table 4.26 below.
Sample Point Temp. Silver Copper LegionellaºC Mg/l Mg/l CFU/l
10th FR305 CT 15 < 0.0003 0.064 <LOD10th DRB Shower 39 < 0.0003 0.08 <LOD10th DRB HT 61 < 0.0003 0.159 <LODWard 9A Kitchen HT 42 < 0.0003 0.144 <LODWard 9A Sluice CT 13 < 0.0003 0.013 <LODWard 9A Room 6 HT 38 < 0.0003 0.17 100 npWard 9B Sluice HT 53 < 0.0003 0.124 <LODWard 9B Nurse Station CT 20 < 0.0003 0.038 <LODWard 9B Male WC Shower 40 < 0.0003 0.099 2000 s2-14 + 200 npWard 8A Female Shower 40 < 0.0003 0.079 <LODWard 8A Sluice HT 58 < 0.0003 0.118 <LODWard 8A Kitchen CT 15 < 0.0003 0.035 <LODWard 8A Kitchen HT 54 < 0.0003 0.12 <LODWard 8A Sluice CT 12 < 0.0003 0.01 <LODWard 8A Bay A MT 36 < 0.0003 0.187 1700 s1Ward 7 Kitchen HT 56 < 0.0003 0.117 <LODWard 7 Sluice CT 12 < 0.0003 0.01 <LODWard 7A Bay A MT 34 < 0.0003 0.123 1900 s1 + 100 npWard 7B Kitchen CT 11 < 0.0003 0.008 <LODWard 7B Female Shower 39 < 0.0003 0.08 <LODWard 7B Sluice HT 54 < 0.0003 0.115 <LODWard 6A Kitchen CT 24 < 0.0003 0.043 <LODWard 6A Sluice HT 53 < 0.0003 0.12 <LODWard 6A Shower Room MT 38 < 0.0003 0.089 <LODWard 6B Arjo MT 40 < 0.0003 0.215 2900 s2-14 + 1200 npWard 6B Sluice CT 33 < 0.0003 0.136 100 s1 + 1300 npWard 6B Bay A MT 40 < 0.0003 0.173 2100 s2-14 + 300 npWard 5A Arjo MT 38 < 0.0003 0.14 <LODWard 5A Sluice CT 13 < 0.0003 0.019 <LODWard 5A Bay A MT 38 < 0.0003 0.069 400 s1Ward 5B Sluice HT 57 < 0.0003 0.119 <LODWard 5B Shower 40 < 0.0003 0.129 100 s1 + 400 npWard 5B Kitchen CT 13 < 0.0003 0.008 <LODWard 5B Corridor CT 25 < 0.0003 0.096 <LODWard 4A Sluice HT 53 < 0.0003 0.114 <LODWard 4A Kitchen CT 15 < 0.0003 0.023 <LODWard 4A Shower 33 < 0.0003 0.126 <LODWard 4B Sluice HT 56 < 0.0003 0.119 <LODWard 4A Bay A MT 40 < 0.0003 0.085 2500 s1Ward 4B Kitchen CT 14 < 0.0003 0.025 <LODWard 3A Sluice HT 56 < 0.0003 0.116 <LODWard 3A Bay A MT 40 < 0.0003 0.091 400 s1 + 400 npWard 3A Kitchen CT 19 < 0.0003 0.052 <LOD
152
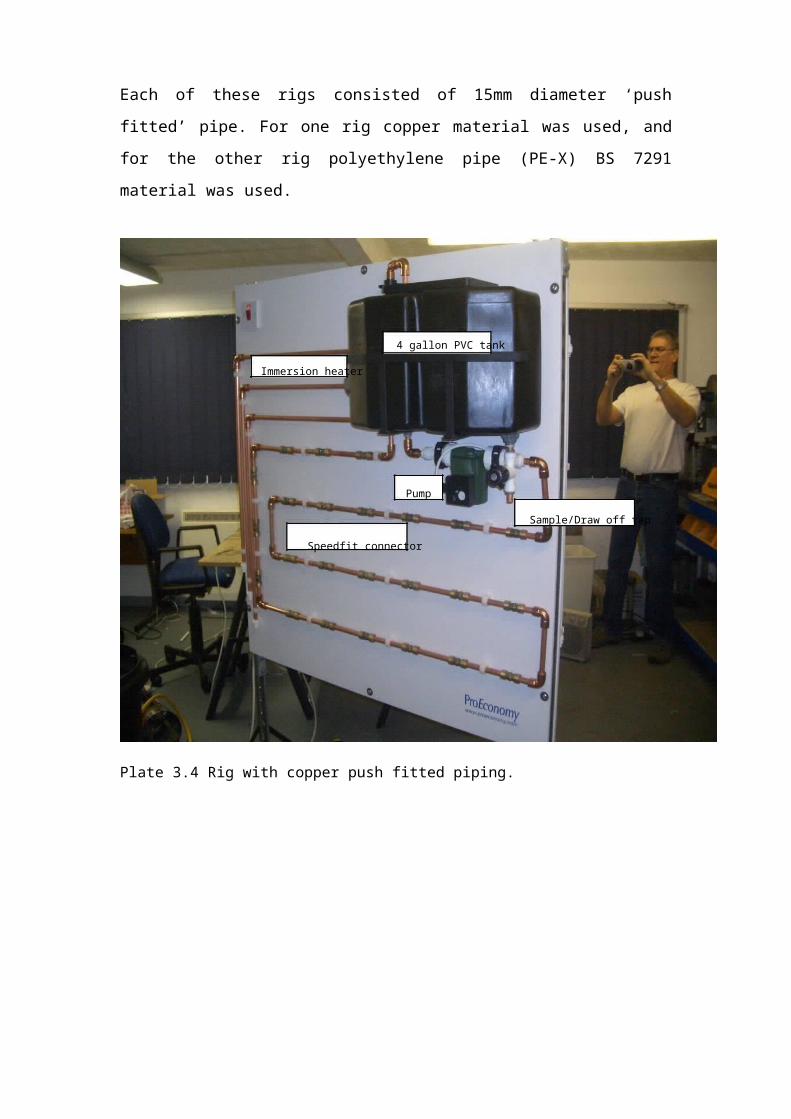
Ward 3B Shower MT 18 < 0.0003 0.039 <LODWard 3B Sluice CT 12 0.0133 0.021 <LODWard 3B Kitchen HT 59 < 0.0003 0.119 <LODWard 2A Bathroom HT 36 0.0025 0.077 <LODWard 2A Kitchen CT 11 < 0.0003 0.011 <LODWard 2A Bay C HT 40 < 0.0003 0.089 1600 s2-14Ward 2B Sluice HT 55 < 0.0003 0.147 <LODWard 2B Kitchen CT 14 0.0093 0.028 100 s1 + 100 npWard 2B Shower MT 41 0.0016 0.141 7200 s1Ward 1 Waiting Room HT 53 < 0.0003 0.155 <LODWard 1 Pantry CT 18 < 0.0003 0.191 <LODWard 1 Dirty Utility HT 59 0.0008 0.125 <LODWard 1 Clinical Area MT 42 0.0007 0.054 <LODPathology WC 46 MT 41 0.0006 0.081 <LODPath Lab 124 HT 51 0.0011 0.797 <LODPathology Pan Reception CT 20 < 0.0003 0.223 800 s2-14Pathology Sluice HT 44 0.0005 0.162 <LODHT = Hot tap, CT = Cold tap, MT = Mixer tap, np = Legionella non-pneumophila, s1 =
Legionella pneumophila serogroup 1, s2-14 = Legionella pneumophila serogroup 2 to 14,
<LOD = Below Limit of Detection (100CFU/l).
Table 4.26 Study hospital 10. Results from samples taken on the 15 th December 2009, before commissioning of copper and silver ionization systems.
Legionella were found in samples taken from 15 outlets. Sixty outlets were sampled,
therefore, 25% of the outlets were contaminated.
The Legionella colony forming unit counts found ranged from 100CFU/l to
7200CFU/l. The average Legionella count of the 60 outlets sampled was 465CFU/l (±
156CFU/l). Blended and cold outlets were contaminated. The highest Legionella
count, of 7200CFU/l, was found in a sample taken from a blended outlet. The
temperature recorded at this outlet was 41ºC.
The average hot water temperature at the 40 hot water outlets tested was 45ºC (±
1.5ºC). Although mixing valves were hidden and could not be seen, the hot water
could have been blended with cold water at 24 of the 40 hot water outlets tested
because the temperatures recorded at these were ranging from 18ºC to 44ºC. Thirteen
of these outlets were contaminated with Legionella.
The average water temperature at the 20 cold water outlets tested was 16ºC (± 1ºC).
The temperature recorded at 1 of the 3 contaminated cold outlets was high at 33ºC.
153

The average copper level found at the 60 outlets, due to copper leaching from copper
pipes, was 0.108mg/l (± 0.01mg/l).
The copper and silver ionization systems were activated on the 21st December 2009.
Table 4.27 below shows the results of samples taken on the 13th January 2010 fromthe 15 outlets that were contaminated before the systems were activated and from 15
outlets that had been identified as being at risk of Legionella contamination.
Sample Point Temp. Silver Copper LegionellaºC Mg/l Mg/l CFU/l
9A Room 6 HT 37 0.0357 0.234 <LOD9B Shower 39 0.0363 0.226 <LOD8A Bay A MT 39 0.0416 0.236 200 s18B Bay B MT 34 0.0284 0.243 12800 np7A Bay A MT 39 0.0384 0.233 <LOD7A Bay B MT 39 0.0396 0.227 <LOD7B WC CT 10 0.0677 0.237 <LOD7B Bay A MT 43 0.036 0.229 <LOD6A Bay B MT 39 0.0432 0.238 500 np6B Arjo MT 39 0.0442 0.288 <LOD6B Sluice CT 9 0.0661 0.234 <LOD6B Bay A MT 40 0.028 0.242 <LOD5A Bay A MT 40 0.043 0.243 <LOD5A Bay B MT 35 0.0524 0.511 200 s15B WC MT 42 0.0356 0.232 12800 np5B Shower 39 0.033 0.233 <LOD4A Bay D MT 39 0.0393 0.232 <LOD4A Bay A MT 38 0.0413 0.23 <LOD4B Bay B MT 40 0.0403 0.342 <LOD4B Bay A MT 40 0.0454 0.446 500 np3A Bay A MT 40 0.039 0.233 <LOD3A Bay B MT 44 0.0367 0.225 <LOD3B Shower 35 0.0348 0.234 <LOD3B WC CT 8 0.069 0.234 <LOD2A Bay B MT 39 0.0393 0.228 <LOD2A Bay C HT 38 0.0393 0.227 100 s2-142B Kitchen CT 52 0.0328 0.226 <LOD2B Shower 39 0.0376 0.229 4700 s1Path Pan Reception CT 19 0.0594 0.294 <LODPath Pan Reception HT 42 0.0337 0.247 <LOD
HT = Hot tap, CT = Cold tap, MT = Mixer tap, np = Legionella non-pneumophila, s1 =
Legionella pneumophila serogroup 1, s2-14 = Legionella pneumophila serogroup 2 to 14,
<LOD = Below Limit of Detection (100CFU/l).
Table 4.27 Study hospital 10. Results from samples taken on the 13th January 2010.
154
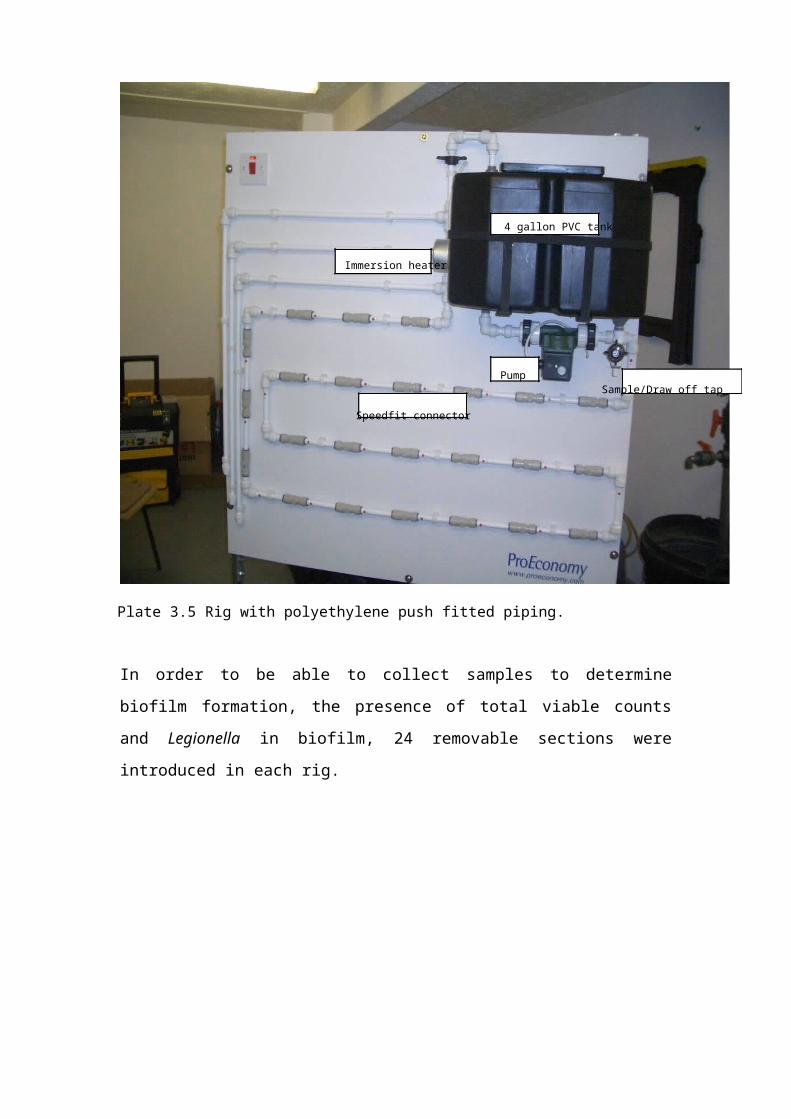
No Legionella were found in samples taken from 11 outlets that were previously
contaminated. The Legionella colony forming unit counts reduced in samples taken
from the 4 outlets that were previously contaminated; from 1700CFU/l to 200CFU/l,
from 2400CFU/l to 200CFU/l, from 1600CFU/l to 100CFU/l, and from 7200CFU/l to
4700CFU/l. Legionella were found at 4 outlets from which samples were not taken
before the copper and silver ionization systems were activated.
The hot water temperatures of the 8 outlets at which Legionella were found were all
below 50ºC, indicating that these were blended outlets.
The silver found at the 30 outlets ranged from 0.028mg/l to 0.069mg/l. The average
silver level was 0.042mg/l (± 0.002mg/l). The silver target, of 0.02mg/l, was met at all
the 30 outlets tested. The copper ranged from 0.225mg/l to 0.511mg/l. The average
copper level was 0.257mg/l (± 0.012mg/l). The copper target, of 0.2mg/l, was met at
all the 30 outlets tested.
Graph 4.28 below shows the average Legionella counts in samples taken monthly
from 30 outlets from the 13th January 2010 to the 13th July 2011.
155

Graph 4.28 Study hospital 10 - Average Legionella counts in samples taken monthly from the
13th January 2010 to the 13th July 2011.
Legionella were found at high colony forming unit counts in samples taken on the 11th
August 2010 from a blended outlet, 36200CFU/l, and from a cold outlet, 42000CFU/l,
which increased the average Legionella count. The copper target was met in both
contaminated samples but the silver found in the sample taken from the cold outlet
was low at 0.0003mg/l.
Legionella were found at high counts in samples taken on the 13th October 2010. The
copper had dropped substantially and its target was not met in samples taken from the
15 contaminated outlets. The average copper level found in the contaminated samples
was 0.158mg/l (± 0.005mg/l).The silver had also dropped and its target was not met at
10 of the 15 contaminated outlets. The average silver level found at the contaminated
outlets was 0.019mg/l (± 0.002mg/l).
Of the 15 contaminated outlets sampled on the 13th October, 7 were found to have no
Legionella when sampled on the 22nd October. At these outlets the copper and silver
levels had improved. At 3 outlets the copper and silver targets were not met and Legionella were still found. At 2 outlets the copper and silver levels had improved but Legionella were still found. A point of use filter was attached to 1 outlet and a mixing valve was attached to the other outlet. At 3 outlets the Legionella counts had increased in spite of improved copper and silver levels.
When the copper and silver targets were consistently maintained, the Legionella
contamination declined and the Legionella colony forming unit counts reduced.
Graphs 4.29 and 4.30 show the averages of the copper and silver levels found in
samples taken from 30 outlets from the 13th January 2010 to the 13th July 2011. The average copper level was 0.231mg/l (± 0.008mg/l). The average silver level was 0.031mg/l (± 0.001mg/l).
156
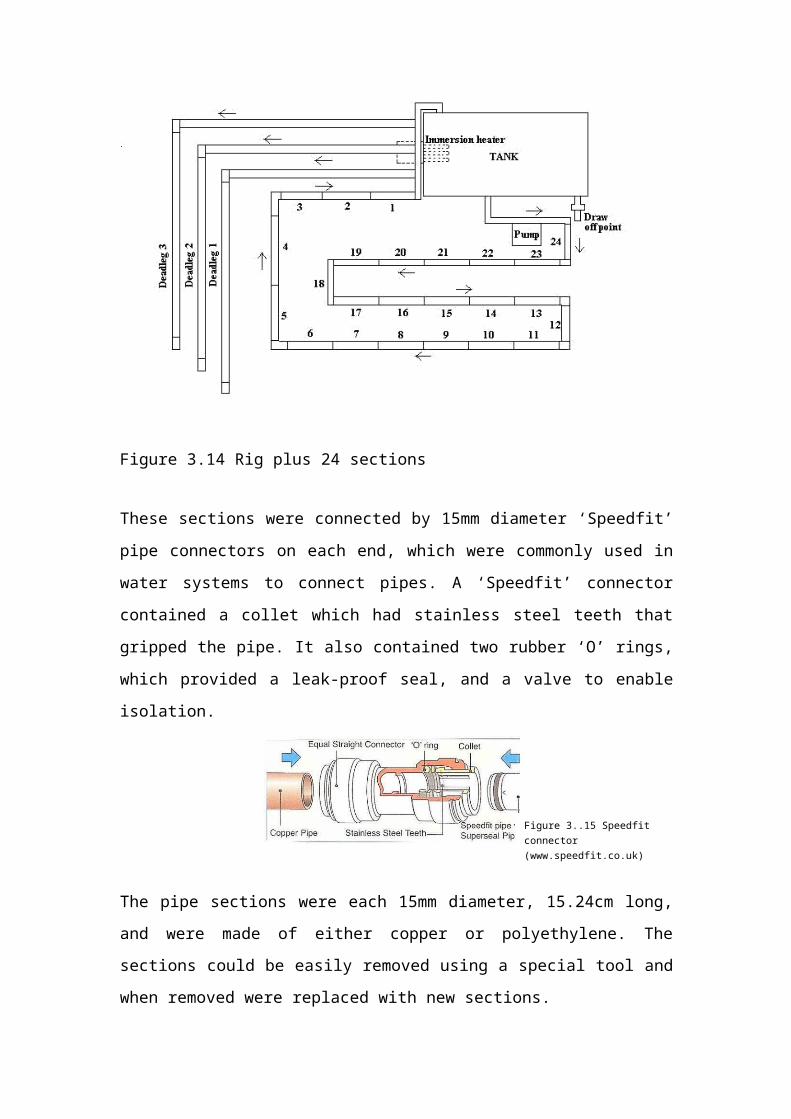
Graph 4.29 Study hospital 10 – Average copper levels from the 13th January 2010 to the 13th July 2011 (the red line is the target level for copper - 0.2mg/l).
Graph 4.30 Study hospital 10 – Average silver levels from the 13th January 2010 to the 13th July 2011 (the red line is the target level for silver - 0.02mg/l).
157
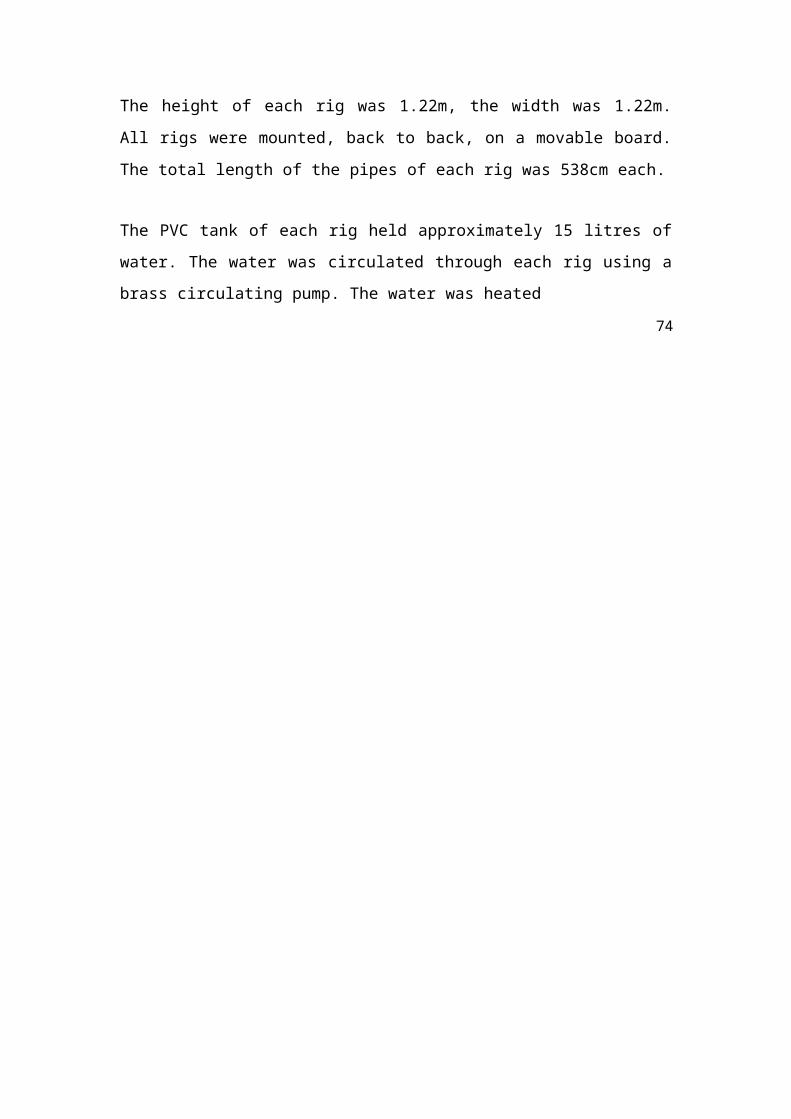
The average hot water temperature recorded from the 15th December 2009 to the 13th
July 2009 was 41ºC (± 0.3ºC). The average cold water temperature was 16ºC (± 0.4ºC).
The chloride level found in the sample taken from the incoming mains on the 05th July 2011 was 57.3mg/l, the phosphorus was 1030µg/l, and the pH was 7.5.
158
4.11 Summary of results of study hospitals
Table 4.28 below shows the number of outlets that were contaminated with Legionella
before the copper and silver ionization systems were activated in the 10 hospitals as
well as 3 months after activation of the systems and at the end of the studies.
Number of Number of Number of
Study hospital contaminated outlets contaminated outlets 3 contaminated outlets at
before activation months after activation end of study
1 21 out of 46 1 out of 21 0 out of 21
2 7 out of 30 2 out of 15 0 out of 15
3 4 out of 21 1 out of 10 0 out of 10
4 2 out of 12 0 out of 6 0 out of 6
5 25 out of 51 6 out of 20 2 out of 20
6 11 out of 50 2 out of 25 1 out of 25
7 20 out of 26 4 out of 13 1 out of 13
8 8 out of 45 0 out of 21 0 out of 21
9 14 out of 30 1 out of 15 1 out of 14
10 15 out of 60 13 out of 29 6 out of 30
Table 4.28 Study hospitals - Number of Legionella contaminated outlets before activation of
copper and silver ionization systems as well as 3 months after activation and at end of studies.
Table 4.29 below shows the average Legionella colony forming unit counts found
before the copper and silver ionization systems were activated in the 10 hospitals as
well as 3 months after activation of the systems and at the end of the studies.
159

Average Legionella Average LegionellaAverage Legionella
counts before counts 3 monthsStudy hospital counts at end of study
activation after activationCFU/l
CFU/l CFU/l
1 983 (± 331) 19 (± 19) 0
2 290 (± 20) 53 (± 41) 0
3 138 (± 77) 90 (± 90) 0
4 350 (± 356) 0 0
5 214 (± (10) 42 (± 16) 14(± 10)
6 136 (± 82) 16 (± 11) 13(± 13)
7 7188 (± 3681) 54 (± 24) 33(± 33)
8 60 (± 23) 0 0
9 453 (± 216) 20 (± 20) 7CFU/l (± 7CFU/l)
10 465 (± 156) 155 (± 66) 157(± 112)
Table 4.29 Study hospitals - Average Legionella colony forming unit counts before activation
of copper and silver ionization systems as well as 3 months after activation and at end of
studies.
Table 4.30 below shows the averages of the copper and silver levels of the samples
taken after the copper and silver ionization systems were activated in the 10 hospitals
as well as the averages of the cold and hot water temperatures, and the chloride,
phosphorus and pH values.
160
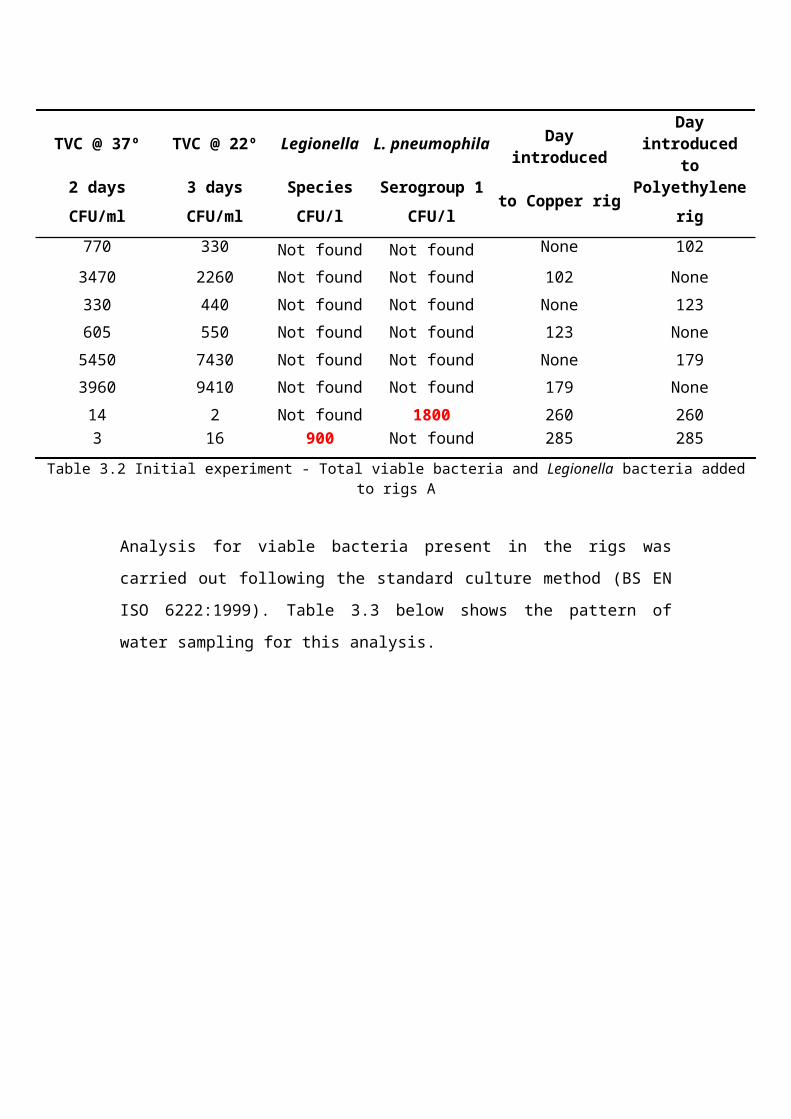
Study Copper Silver Chloride Phosphorus Hot Cold BoreholepH temp. temp. Chloride PHospital mg/l mg/l mg/l µg/l ºC ºC Mg/l
1 0.201 0.04 15.1 455 8.5 41 172 0.235 0.037 17 390 8.5 44 153 0.151 0.033 24.5 1000 7.9 41 174 0.419 0.043 30.2 577 7.5 38 *5 0.366 0.043 60.7 701 7.2 46 166 0.328 0.021 46.7 1500 7.2 44 15 32.97 0.539 0.031 58.5 237 7.6 40 188 0.187 0.036 8.4 452 8.5 45 159 0.398 0.037 54.9 191 7.5 43 1710 0.231 0.031 57.3 1030 7.5 41 16
Table 4.30 Study hospitals - Average copper and silver results. Chloride, phosphorus and pH values. A
* The cold water temperatures were not recorded at study hospital 4.

4.12 Initial experiment - Rigs
4.12.1 Rigs A
The TVC results of the 67 samples taken from each rig were variable.
The TVC results of the samples taken from the polyethylene rig, incubated at 37ºC for
2 days, ranged from 0CFU/ml to 11900CFU/ml. The average of the 67 results was
1892CFU/ml (± 361CFU/ml).
The TVC results of samples incubated at 22ºC for 3 days ranged from 7CFU/ml to
7430CFU/ml. The average of the 67 results was 1001CFU/ml (± 194CFU/ml). The
average temperature of the polyethylene’s rig tank water was 44ºC (± 0.3ºC).
The results of the samples taken from the copper rig, incubated at 37ºC for 2 days,
ranged from 0CFU/ml to 9410CFU/ml. The average of the 67 results was
1810CFU/ml (± 264CFU/ml). The results of samples incubated at 22ºC for 3 days
ranged from 0CFU/ml to 10400CFU/ml. The average of the 67 results was
1417CFU/ml (± 279CFU/ml). The average temperature of the copper rig’s tank water
was 42ºC (± 0.3ºC).
Graph 4.31 below shows the planktonic Legionella results of samples taken from the
polyethylene rig from first detection, at 324 days, to 585 days.
50000
45000
A
40000
rigPo
lyet
hyle
ne 35000
30000
25000-CF
U/l
20000
Legi
onel
la 15000
10000
5000
0
324
4
372 387 404 410 424 438
3
466 480 487 501 515 52943
557 571 5854 5
3 4 5
Graph 4.31 Initial experiment - Legionella results polyethylene A
Page 162 of 229
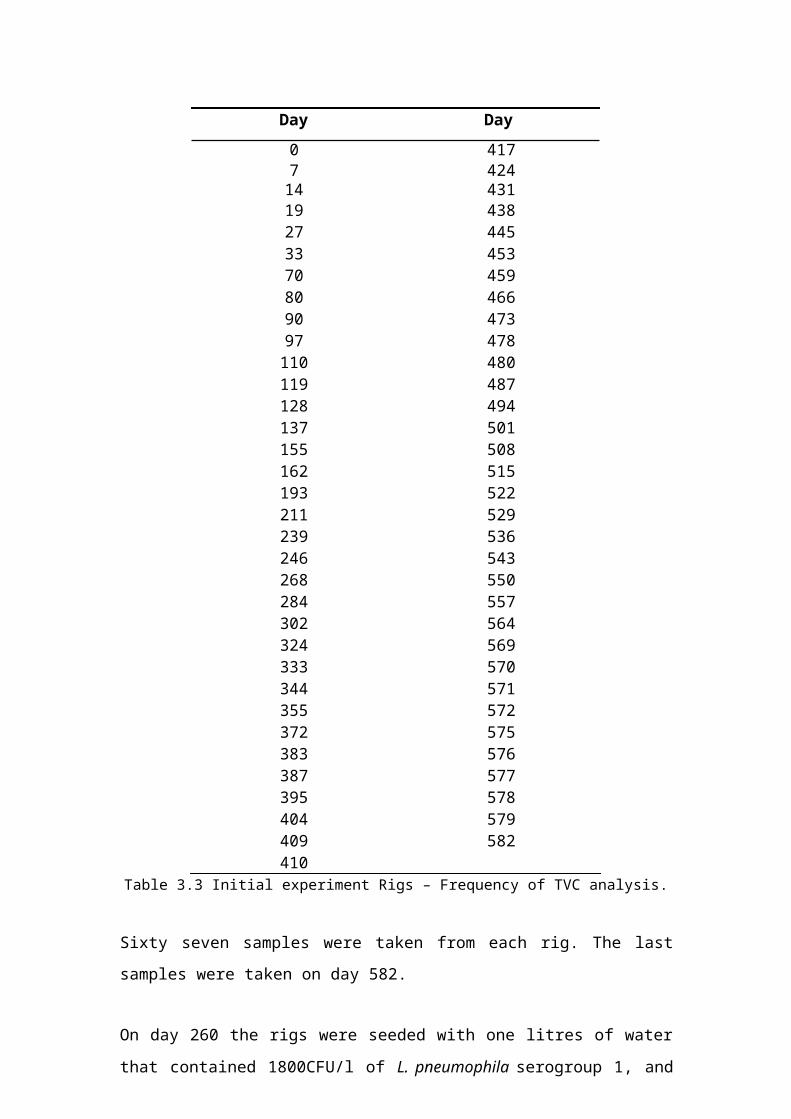
The Legionella results were variable and ranged from 0CFU/l to 46400CFU/l. The
average Legionella count found in the 37 samples was 16146CFU/l (± 1667CFU/l).
The average temperature was 44ºC (± 0.4ºC).
Graph 4.32 below also shows the planktonic Legionella results of samples taken from
the copper rig from first detection, at 324 days, to 585 days.
60000
50000
rig A
- Cop
per 40000
CFU/
l 30000
Legi
onel
la
20000
10000
0
4 4 2
387 404 410
4 8 3 6 0
487 501
5 9 3 7 1
58532 347
42 43 456 8
51 52 54 557
3 4 4 5
Graph 4.32 Initial experiment - Legionella results copper rig A.
The Legionella results were again variable and ranged from 0CFU/l to 56800CFU/l.
The average Legionella count found in the 37 samples taken was 20611CFU/l (±
2352CFU/l). The average temperature was 42ºC (± 0.4ºC).
The Legionella species found in the rigs, L. pneumophila serogroup 2 to 14, were
different from the species that were detectable in the original inoculum, L.
pneumophila serogroup 1 and Legionella non-pneumophila. This may have been
because the environment within the rigs supported the growth of Legionella
pneumophila serogroup 2 to 14 and the original inoculum may have contained a
mixture of species including serotypes that were not readily detectable.
Tables 4.31 and 4.32 below show the results of the methods applied to sections 1 to 16
of the rigs, as an initial experiment, to establish the best way to remove and quantify
biofilms. The highest weight was found in the samples from the brushed through
sections, although this was not necessarily reflected in some viable cell Page 163 of
229
results, for instance the TVC results obtained from section 11 of the copper rig at 211
days, where there appears to be a significant biolayer (in weight) but few viable cells.
This could indicate that much of the biolayer consisted of non-viable material.
Tables 4.31 and 4.32 also show the results of the analysis for viable biological
material within the sonified, shaken and brushed samples. The results were variable
and did not indicate a steady build-up of biofilm with the length of time that sections
were in place. The results also suggested that within 478 days a substantial biofilm did
not form as the TVC density was calculated to be below 70/mm2, which is generally
considered to be insignificant.
Days in TVC TVC Weight Biolayer @ Biolayer @Section Procedure @37ºC @22ºC 37ºC per 22ºC per
rig gramscfu/ml cfu/ml mm2 mm2
1 19 Shaken 0 0 0 0 02 27 Shaken 0 0 0 0 03 70 Shaken 10 6 0 0.7 0.44 80 Shaken 1 1 0.004 0.07 0.075 89 Shaken 0 1 0 0 0.076 128 Shaken 9 7 0 0.6 0.57 128 Sonicated 880 204 0 63 158 211 Dried 4 11 0.001 0.3 0.89 211 Sonicated 1 119 0.0008 0.07 910 211 Shaken 2 0 0.007 0.1 011 211 Brushed 2 1 0.02 0.1 0.0712 284 Brushed 640 126 0.016 46 913 387 Brushed 50 1 0 4 0.0714 387 Brushed 14 4 0 1 0.315 409 Brushed 60 3 0 4 0.216 478 Brushed 1 1 0 0.07 0.07
Table 4.31 Initial experiment - Biofilm results in weight and biolayer per mm2 from
TVC results at 37ºC and at 22ºC (TVC result x 500ml/7000mm2) - copper rig.
Days in TVC TVC Weight Biolayer @ Biolayer @Section Procedure @37ºC @22ºC 37ºC per 22ºC per
rig gramscfu/ml cfu/ml mm2 mm2
1 19 Shaken 605 0 0 43 02 27 Shaken 0 4 0 0 0.33 70 Shaken 0 0 0 0 04 80 Shaken 0 1 0.004 0 0.075 89 Shaken 0 3 0.0004 0 0.26 128 Shaken 5 5 0 0.4 0.47 128 Sonicated 80 5 0 6 0.48 211 Dried 1 165 0.001 0.07 129 211 Sonicated 1 2 0.001 0.07 0.110 211 Shaken 0 1 0.0006 0 0.0711 211 Brushed 3 91 0.006 0.2 712 284 Brushed 16 0 0.005 1 0.0713 387 Brushed 29 1 0 2 0.0714 387 Brushed 30 7 0 2 0.5
Page 164 of 229

15 409 Brushed 1 0 0 0.07 016 478 Brushed 330 4 0 24 0.3
Table 4.32 Initial experiment - Biofilm results in weight and biolayer per mm2 from TVCresults at 37ºC and at 22ºC (TVC result x 500ml/7000mm2) – polyethylene rig.
Analysis for sessile Legionella was carried out on the brushed samples of sections 13,
14, 15 and 16 removed from the rigs on days 387, 409 and 478. The results are shown
in Table 4.33 below. This table also shows the corresponding planktonic levels of
Legionella.
DaysLegionella Legionella Planktonic Planktonic
Section Copper Rig Polyethylene Legionella Legionellain Rigs
Sections Rig Sections Copper Rig Polyethylene Rig
13 387 4300 cfu/l 0 7200 cfu/l 0
14 387 15200 cfu/l 0 7200 cfu/l 0
15 409 21000 cfu/l 4800 cfu/l 21800 cfu/l 22400 cfu/l
16 478 70000 cfu/l 40800 cfu/l 21800 cfu/l* 20800 cfu/l*
* - Results from samples taken from rigs on day 480.
Table 4.33 Initial experiment - Sessile and planktonic Legionella results of copper and
polyethylene rigs.
More than 10000CFU/l were found in sections 14, 15 and 16 of the copper rig and in
section 16 of the polyethylene rig. Legionella pneumophila serogroup 2 to 14 were
only found.
Sections 13, 14, 15 and 16 were again simultaneously removed from each rig, as well
as sections 1 to 13, on day 564 for Legionella analysis, representing residence times
of between 86 and 547 days.
The results of the copper rig sections are shown in Figure 4.1 below.
Page 165 of 229

Figure 4.1 Legionella results of sections 1 to 16 of the copper rig – removed simultaneously
on day 564.
Legionella were found in sections 1 to 15 of the copper rig. No Legionella were found
in section 16, which had been in the copper rig for 86 days. The results indicated that
Legionella multiplied in biofilm in pipe sections that were in the copper rig for more
than 86 days and that multiplication peaked in pipe sections that had been in the rig
for 353 days after which multiplication dropped to only 300CFU found in the pipe
section that had been in the copper rig for 547 days.
Very surprisingly, no Legionella were found in the polyethylene rig sections 1 to 15
but a colony forming unit count of 1800CFU/500ml was found in section 16.
Legionella non-pneumophila and L. pneumophila serogroup 2 to 14 were found in the
copper rig sections. Only L. pneumophila serogroup 2 to 14 were found in the
polyethylene section samples.
Legionella results of samples taken from rigs A, after rigs B and C were inoculated
with water and sections from rigs A (day 0), and before treatment was started (day
120), are shown in Graph 4.33 below.
Page 166 of 229
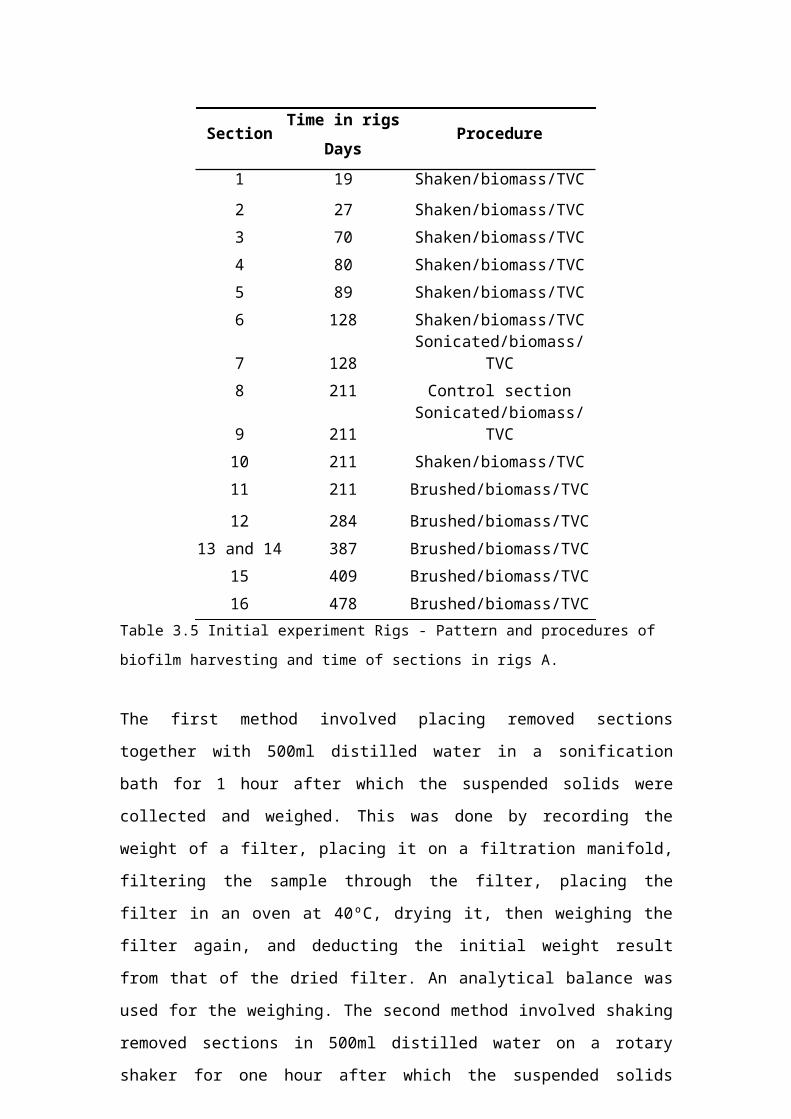
45000
40000
35000
A- r
igs 30000
CFU/
l 25000
Legi
onel
la 20000
15000
10000
5000
043 58 65 79 93 114 120
Days in rigs
Polyethylene rig
A Copper rig A
Graph 4.33 Legionella results of samples taken from rigs A after inoculation of rigs B and C
(day 0) and before treatment (day 120).
The Legionella results of the samples taken from the polyethylene rig were variable
and ranged from 12800CFU/l to 42000CFU/l. The average Legionella count found in
the 7 samples was 28329CFU/l (± 4384CFU/l).The temperature of the rigs was kept
below 45ºC.
The Legionella results of the samples taken from the copper rig were also variable and
ranged from 3500CFU/l to 40400CFU/l. The average Legionella count found in the 7
samples was 18129CFU/l (± 5920CFU/l).
The Legionella colony forming unit counts found in the samples of the polyethylene
rig A brushed through sections, which were removed after inoculation of rigs B and C
and before the comparison experiment, were:
Section 19, in place in rig since design stage, 5600CFU/l
Section 18, in place in rig for 79 days, 0CFU/l
Section 17, in place in rig for 114 days, 13600CFU/l.
The Legionella colony forming unit counts found in the samples of copper rig A
brushed through sections, which were removed after inoculation of rigs B and C and
before the comparison experiment, were:
Page 167 of 229
Section 19, in place in rig for 58 days, 6700CFU/l
Section 17, in place in rig for 79 days, 1500CFU/l
Section 16, in place in rig for 114 days, 800CFU/l.
Page 168 of 229
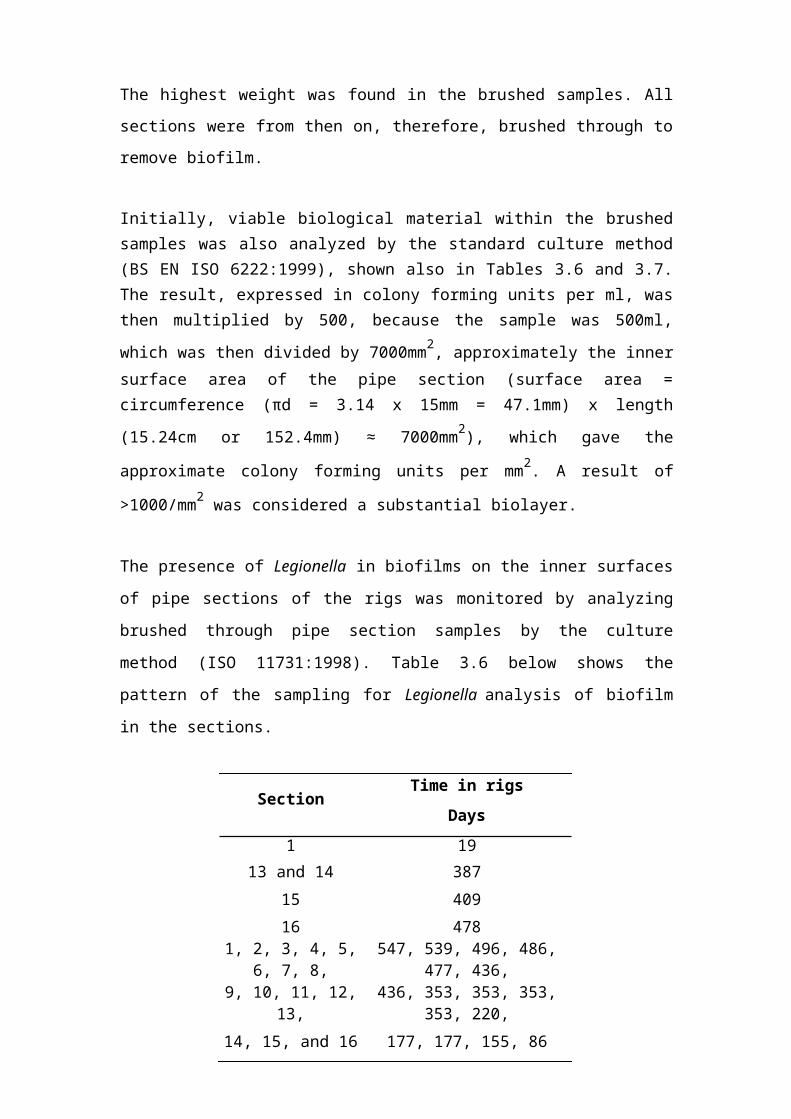
4.12.2 Rigs B and C
Graph 4.34 below shows the Legionella colony forming unit counts found in samples
taken from rigs B after inoculation (day 0) and before treatment was started (day 120).
350000
300000
B 250000
- rig
sC
FU/L 200000
Legi
onel
la 150000
100000
50000
043 58 65 79 93 114 120
Days in rigs
Polyethylene rig B
Copper rig B
Graph 4.34 Legionella results of samples taken from rigs B after inoculation and before
treatment.
The Legionella results of the samples taken from the polyethylene rig were variable
and ranged from 0CFU/l to 297000CFU/l. The average Legionella count found in the
7 samples was 86486CFU/l (± 40760CFU/l). The temperature of the rigs was kept
below 45ºC.
The Legionella results of the samples taken from the copper rig were also variable and
ranged from 0CFU/l to 40400CFU/l. The average Legionella count found in the 7
samples was 14986CFU/l (± 6006CFU/l).
The Legionella colony forming unit counts found in the samples of the polyethylene
rig B brushed through sections were:
Section 19, in place in rig for 58 days, 0CFU/l
Section 18, from rig A, in place in rig for 79 days, 594000CFU/l
Section 17, from rig A, in place in rig for 114 days, 89600CFU/l.
Page 169 of 229
The Legionella colony forming unit counts found in the samples of copper rig B
brushed through sections, before the comparison experiment was started, were:
Section 19, from rig A, in place in rig for 58 days, 4500CFU/l
Section 18, from rig A, in place in rig for 79 days, 300CFU/l
Section 17, from rig A, in place in rig for 114 days, 21600CFU/l.
Graph 4.35 below shows the Legionella colony forming unit counts found in samples
taken from the polyethylene rig C after inoculation (day 0) and before treatment (day
120).
500000
450000
Crig 400000
- Pol
yeth
ylen
e
350000
300000
250000
CFU/
L
200000
Legi
onel
la 150000
100000
50000
043 58 65 79 93 120
Days in rig
Graph 4.35 Legionella results of samples taken from the polyethylene rig C after inoculation
and before treatment.
The Legionella results in the samples taken from the polyethylene rig C ranged from
0CFU/l to a very high count of 18150000CFU/l, which was not included in Graph
4.35. The average Legionella count found including the high count was
2772471CFU/l (± 2563928CFU/l). The average Legionella count excluding the high
count was 209550CFU/l ((±78683CFU/l). The temperature of the rig was kept below
45ºC.
Page 170 of 229
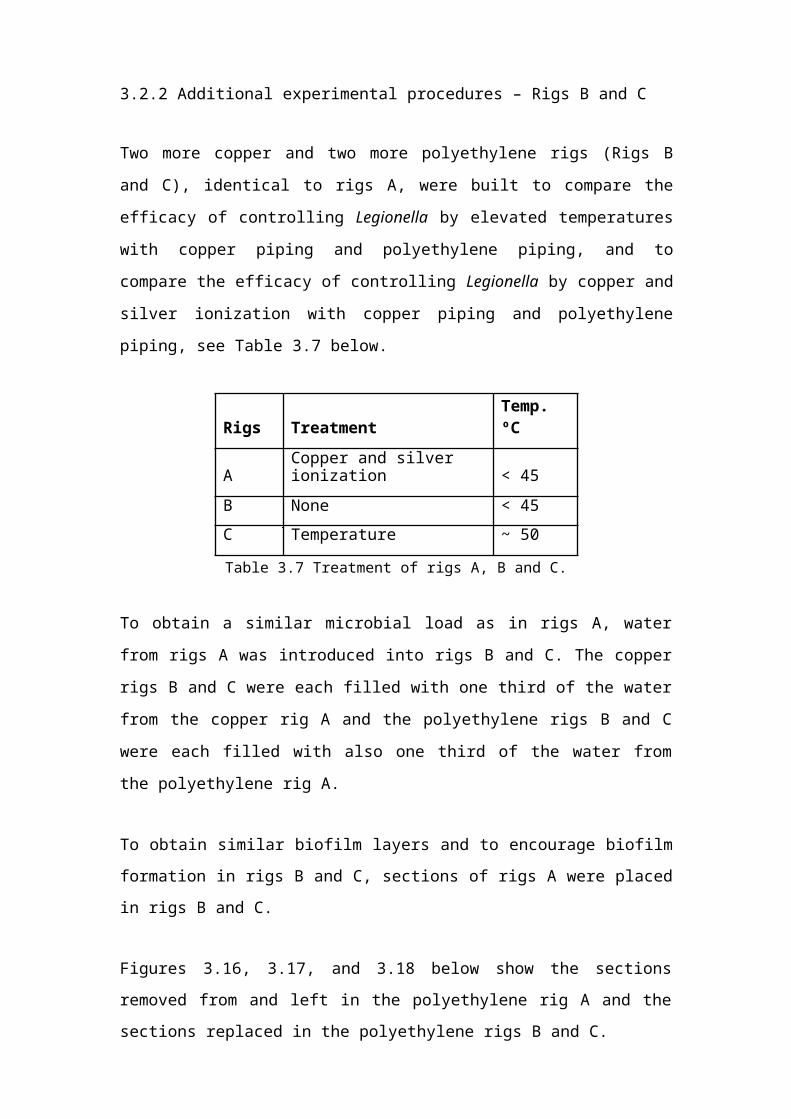
Graph 4.36 below shows the Legionella colony forming unit counts found in samples
taken from the copper rig C after inoculation (day 0) and before treatment (day 120).
70000
60000
rig C
50000
Copp
er
40000
-C
FU/L
30000
Legi
onel
la
20000
10000
043 58 65 79 93 114 120
Days in rig
Graph 4.36 Legionella results of samples taken from the copper rig C after inoculation and
before treatment.
The Legionella results of the samples taken from the copper rig ranged from
14000CFU/l to 63200CFU/l. The average Legionella count found in the samples was
35071CFU/l (±7573CFU/l). The temperature of the rig was also kept below 45ºC.
The Legionella colony forming unit counts found in the samples of the polyethylene
rig C brushed through sections were:
Section 19, in place in rig for 58 days, 0CFU/l
Section 18, in place in rig for 79 days, 0CFU/l
Section 6, from rig A, in place in rig for 114 days, 69600CFU/l.
The Legionella colony forming unit counts found in the samples of copper rig C
brushed through sections, before the comparison experiment was started, were:
Section 19, in place in rig for 58 days, 5100CFU/l Section 18, in place in rig for 79
days, 4300CFU/l
Section 8, from rig A, in place in rig for 114 days, 18800CFU/l.
Page 171 of 229
4.13 Comparison experiment - Rigs
4.13.1 Rigs A
Three litres of copper and silver ionized water produced by the copper and silver
ionization system was added to rigs A daily for 83 days in a separate operation.
The average silver level found in samples taken daily from the copper and silver
ionization system over the 83 days was 0.196mg/l. The average copper level was
3.31mg/l.
The average silver level found in samples taken daily from the draw off point of the
polyethylene rig was 0.042mg/l (± 0.011mg/l). The average copper level was
0.866mg/l (± 0.127mg/l).
Graph 4.37 shows the Legionella results of samples taken once a week from the
polyethylene rig draw off point from when treatment started to the end of treatment.
40000
rig A
35000
30000
poly
ethy
lene
25000
20000
CFU
/l -
15000
Legi
onel
la
10000
5000
00 13 20 27 34 41 48 55 62 69 76 83
Days of treatment
Graph 4.37 Legionella results of polyethylene rig A.
At day 0, before copper and silver ionized water was added, a Legionella colony
forming unit count of 36400CFU/l was found in the sample taken from the draw off
point of the polyethylene rig. The Legionella contamination declined to a Legionella
colony forming unit count of 200CFU/l found in the sample taken on day 83 (~ 99%
Page 172 of 229
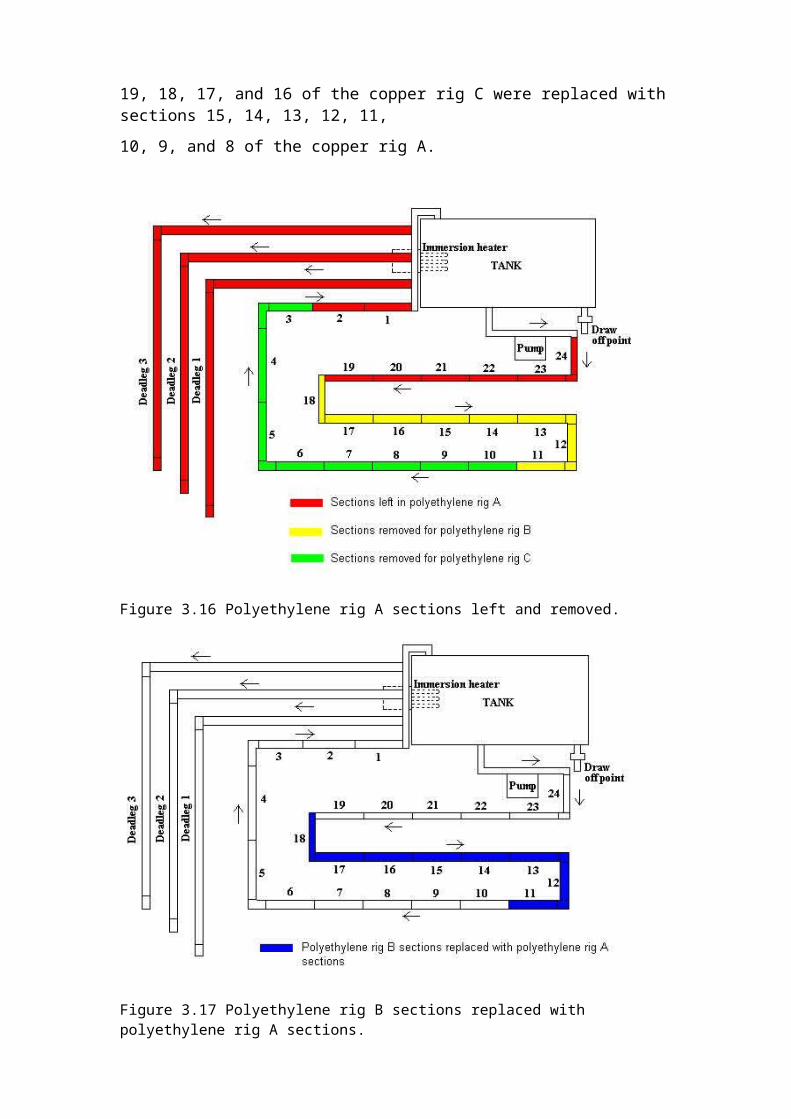
reduction). The average Legionella count of samples taken from day 13 to day 83 was
6900CFU/l (± 2668CFU/l).
The temperatures of the polyethylene rig tank recorded daily for 83 days ranged from
37ºC to 47ºC. The most common temperature recorded was 42ºC. The average
temperature recorded in the polyethylene rig A tank during treatment was 44ºC (±
0.4ºC).
The Legionella colony forming unit counts found in the samples of the polyethylene
rig brushed through sections during treatment were:
Section 16, in place in rig for 133 days, day 13 of trial, 2900CFU/l
Section 14, in place in rig for 175 days, day 55 of trial, 30400CFU/l
Section 13, in place in rig for 203 days, day 83 of trial, 0CFU/l.
All these sections had been in the rig for 120 days before treatment was started.
The average silver level found in samples taken daily from the draw off point of the
copper rig was 0.031mg/l (± 0.007mg/l). The copper level found, due to copper
leaching from the copper pipes, before copper and silver ionized water was added to
the rig was 0.325mg/l. The average copper level for the duration of treatment was
0.874 mg/l (± 0.116 mg/l).
Graph 4.38 shows the Legionella results of samples taken ones a week from the
copper rig draw off point from when treatment started to the end of treatment.
Graph 4.38 Legionella results of copper rig A.
Page 173 of 229

At day 0 a Legionella colony forming unit count of 10100CFU/l was found in the
sample taken from the draw off point of the copper rig. A high Legionella colony
forming unit count of 59200CFU/l was found in the sample taken from the copper rig
on day 55. The silver found was 0.062mg/l and the copper was 0.664mg/l. The count
reduced in a sample taken one week later, day 62, to 7400CFU/l, and the Legionella
contamination declined from day 62 onwards to a count of 200CFU/l found in a
sample taken on day 83 (~ 98% reduction). The average Legionella count of samples
taken from day 13 to day 83 was 9636CFU/l (± 5207CFU/l).
The temperatures of the copper rig tank recorded daily for 83 days ranged from 33ºC
to 50ºC. The most common temperature recorded was 44ºC. The average temperature
recorded in the copper rig A tank during treatment was 42ºC (± 0.3ºC).
The Legionella colony forming unit counts found in the samples of the copper rig
brushed through sections during treatment were:
Section 15, in place in rig for 133 days, day 13 of trial, 200CFU/l
Section 14, in place in rig for 175 days, day 55 of trial, 6600CFU/l
Section 13, in place in rig for 203 days, day 83 of trial, 900CFU/l.
All these sections had been in the rig for 120 days before treatment started.
Page 174 of 229
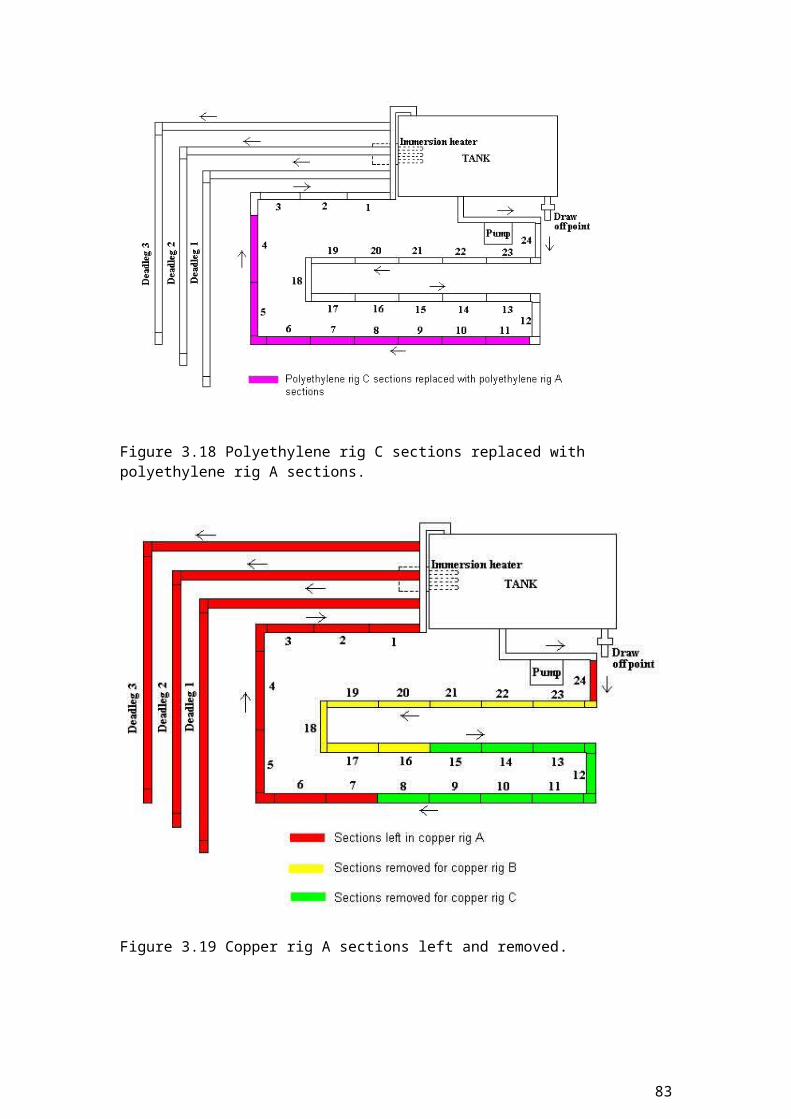
4.13.2 Rigs B
The temperatures in rigs B were maintained below 45ºC, simulating a typical hot
water circulating system in which mixing valves are used to blend water to a
temperature below 45ºC to avoid scalding. This was effectively the ‘control’ rig in this
set of experiments.
The temperatures of the polyethylene rig tank recorded daily for 83 days ranged from
36ºC to 49ºC. The most common temperature recorded was 45ºC. The average
temperature in the polyethylene rig tank recorded over the 83 days was 43ºC (±
0.4ºC).
Graph 4.39 shows the Legionella results of samples taken ones a week from the
polyethylene rig draw off point.
160000
rig B
140000
120000
poly
ethy
lene
100000
80000
CFU
/l -
60000
Legi
onel
la
40000
20000
00 13 20 27 34 41 48 55 62 69 76 83
Days in rig
Graph 4.39 Legionella results of polyethylene rig B.
At day 0 a Legionella colony forming unit count of 49500CFU/l was found in the
sample taken from the draw off point of the polyethylene rig. The Legionella
contamination was variable but increased to a Legionella colony forming unit count of
60800CFU/l found in the sample taken on day 83 (~ 23% increase).The average
Legionella count of samples taken from day 13 to day 83 was 64309CFU/l (±
10421CFU/l).
Page 175 of 229
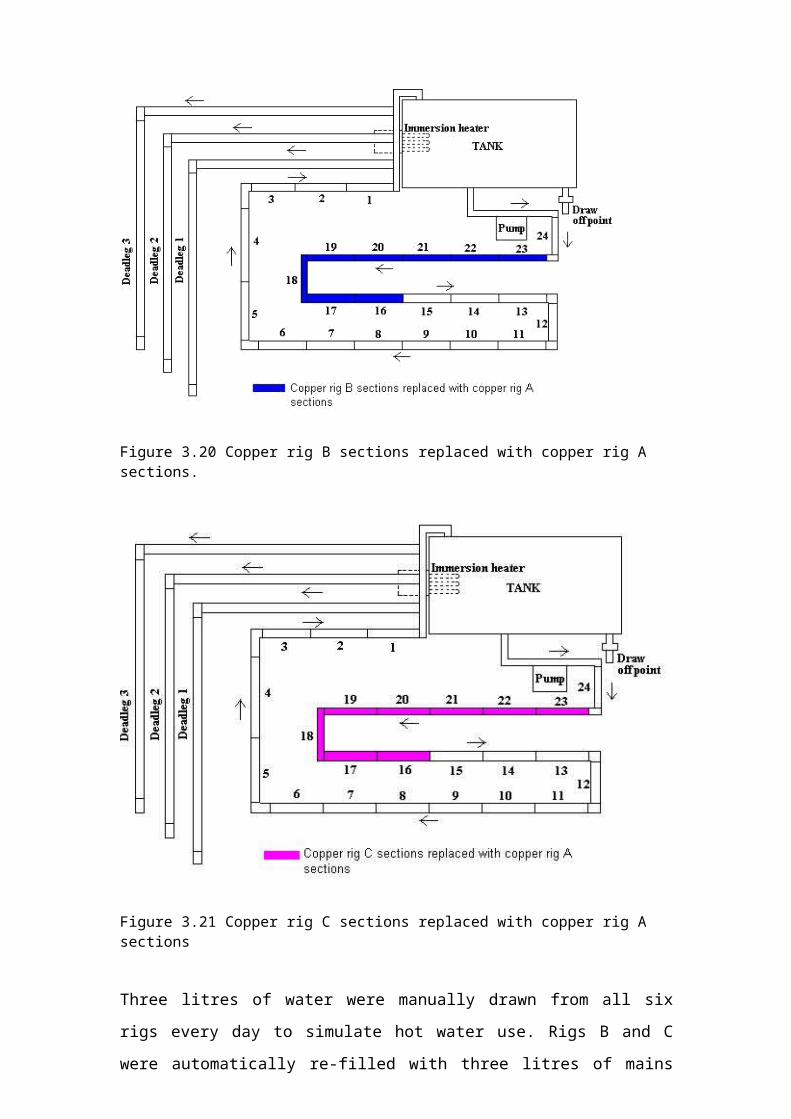
The Legionella colony forming unit counts found in the samples of the polyethylene
rig brushed through sections were:
Section 16, from rig A, in place in rig for 133 days, day 13 of trial, 8800CFU/l
Section 14, from rig A, in place in rig for 175 days, day 55 of trial, 96800CFU/l
Section 13, from rig A, in place in rig for 203 days, day 83 of trial, 32600CFU/l.
All these sections had been removed from the polyethylene rig A to inoculate rig B
and had been in rig B for 120 days at day 0.
The temperatures of the copper rig tank recorded daily for 83 days ranged from 37ºC
to 50ºC. The most common temperature recorded was 43ºC. The average temperature
recorded in the copper rig tank was 44ºC (± 0.3ºC).
Graph 4.40 shows the Legionella results of samples taken ones a week from the
copper rig draw off point.
80000
70000
Brig
60000
- cop
per
50000
CFU
/l 40000
Legi
onel
la 30000
20000
10000
00 13 20 27 34 41 48 55 62 69 76 83
Days in rig
Graph 4.40 Legionella results of copper rig B.
At day 0 a Legionella colony forming unit count of 40400CFU/l was found in a
sample taken from the draw off point of the copper rig. The Legionella contamination
increased to a Legionella colony forming unit count of 52800CFU/l found in the
sample taken on day 83 (~31% increase).The average Legionella count of samples
taken from day 13 to day 83 was 20873CFU/l (± 6294CFU/l).
The Legionella colony forming unit counts found in the samples of the copper rig
brushed through sections were:
Page 176 of 229

Section 15, in place in rig for 133 days, day 13 of trial, 200CFU/l
Section 14, in place in rig for 175 days, day 55 of trial, 25200CFU/l
Section 13, in place in rig for 203 days, day 83 of trial, 3400CFU/l.
All these sections had been in the rig for 120 days at day 0.
Page 177 of 229
4.13.3 Rigs C
The temperatures in rigs C were maintained ~50ºC, simulating a pure hot water
circulating system to which the temperature control regime, as recommended in the
ACoP (L8) and the HTM 04-01 documents, is applied.
The temperatures of the polyethylene rig tank recorded daily for 83 days ranged from
42ºC to 60ºC. The most common temperatures recorded were 45ºC, 46ºC, and 48ºC.
The average temperature recorded was 49ºC (±0.6ºC).
Graph 4.41 shows the Legionella results of samples taken once a week from the
polyethylene rig draw off point as well as the temperatures that were recorded on the
day the Legionella samples were taken.
Temperature and Legionella Polyethylene Rig
80000 60
7000050
60000
40 C
Legio
nella
CFU/
L 50000
Temp
eratur
edeg
rees40000 30
3000020
20000
1010000
0 00 10 20 30 40 50 60 70 80 90
Days of treatment
Legionella CFU/L
Temperature degrees C
Graph 4.41 Legionella results and temperature recordings of polyethylene rig C.
At day 0 a Legionella colony forming unit count of 69300CFU/l was found in the
sample taken from the draw off point of the polyethylene rig. The Legionella
contamination declined to a Legionella colony forming unit count of 36300CFU/l
found in the sample taken on day 83 (~48% reduction).The average Legionella count
of samples taken from day 13 to day 83 was 28318CFU/l (± 4035CFU/l).
Page 178 of 229
The Legionella colony forming unit counts found in the samples of the polyethylene
rig brushed through sections were:
Section 7, from rig A, in place in rig for 133 days, day 13 of trial, 700CFU/l
Section 17, in place in rig for 175 days, day 55 of trial, 26400CFU/l
Section 16, in place in rig for 203 days, day 83 of trial, 500CFU/l.
Sections 17 and 16 had been in the rig for 120 days at day 0. Section 7 was removed
from the polyethylene rig A to inoculate rig C and had been in rig C for 120 days at
day 0
The temperatures of the copper rig tank recorded daily for 83 days ranged from 40ºC
to 58ºC. The most common temperature recorded was 46ºC. .The average temperature
recorded in the copper rig tank was 48ºC (± 0.5ºC).
Graph 4.42 shows the Legionella results of samples taken ones a week from the
copper rig draw off point as well as the temperatures that were recorded on the day
the Legionella samples were taken..
Temperature and Legionella Copper Rig
60000 60
50000 50
40000 40 C
30000 30
Tem
pera
ture
deg
rees
L e g i o n e l
2020000
10000 10
0 00 10 20 30 40 50 60 70 80 90
Days of Treatment
Graph 4.42 Legionella results and temperature recordings of copper rig C.
Legionella CFU/L
Temperature degrees C
At day 0 a Legionella colony forming unit count of 56600CFU/l was found in the
sample taken from the draw off point of the copper rig. The Legionella contamination
declined to a Legionella colony forming unit count of 13600CFU/l found in the
Page 179 of 229
sample taken on day 83 (~76% reduction).The average Legionella count of samples
taken from day 13 to day 83 was 20000CFU/l (± 5072CFU/l).
The Legionella count dropped to below 10000CFU/l in samples taken on day 13, the
temperature was 51ºC, on day 20, the temperature was 43ºC, on day 27, the
temperature was 50ºC, on day 69, the temperature was 47ºC, and on day 76, the
temperature was 56ºC.
The Legionella colony forming unit counts found in the samples of the copper rig
brushed through sections were:
Section 9, in place in rig for 133 days, day 13 of trial, 0CFU/l
Section 16, from rig A, in place in rig for 175 days, day 55 of trial, 0CFU/l
Section 13, in place in rig for 203 days, day 83 of trial, 200CFU/l.
Sections 9 and 13 had been in the rig for 120 days at day 0. Section 16 was removed
from the copper rig A to inoculate rig C.
Page 180 of 229
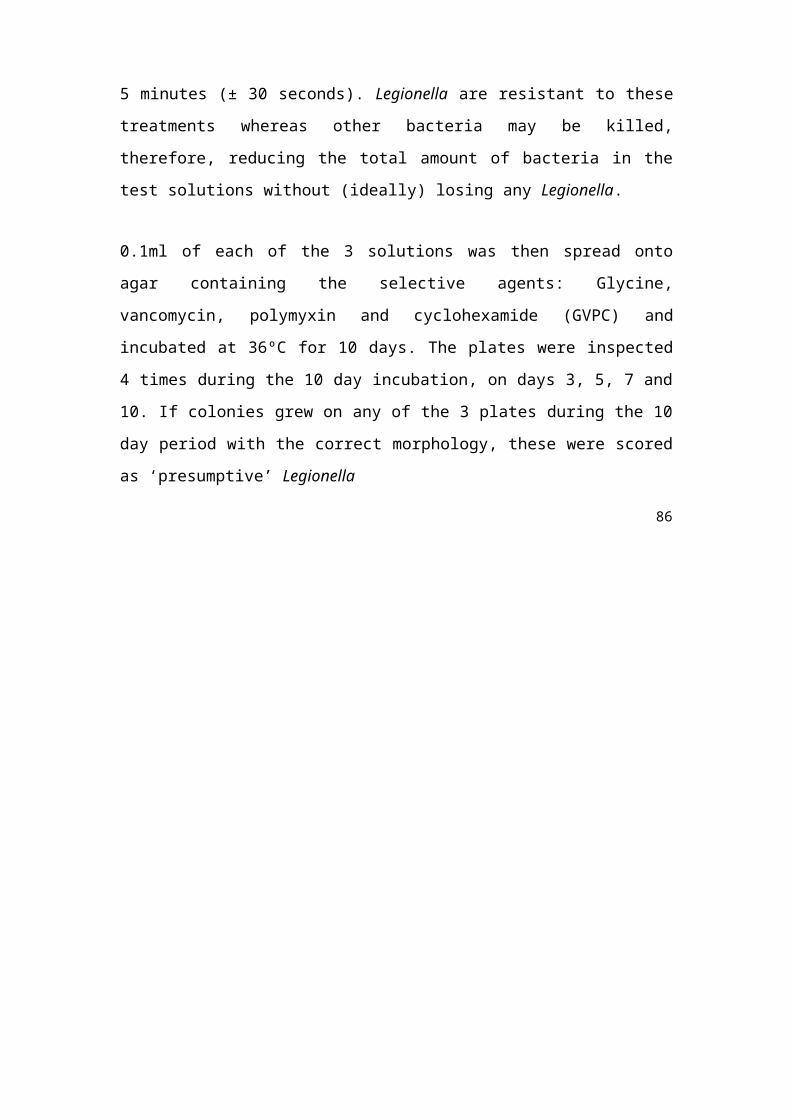
4.14 The Robbins device
Tables 4.34, 4.35, and 4.36 below show the results of the 3 tests carried out with the
Robbins device by releasing the rubber, copper, and polyethylene discs in 10ml
distilled water and shaking the sample for 30 seconds.
Test Disc 10-2 10-2
CFU/ml CFU/mlTest 1 A 350000 340000Test 1 B 2800000 2400000Test 1 C 2200000 3600000Test 1 D 1500000 1200000Test 1 E 1800000 1300000Test 1 F 380000 460000Test 2 A 1400000 550000Test 2 B 1200000 720000Test 2 C 1400000 870000Test 2 D 560000 750000Test 2 E 1500000 1100000Test 2 F 720000 540000Test 3 A 750000 840000Test 3 B 610000 560000Test 3 C 560000 600000Test 3 D 1330000 1430000Test 3 E 920000 800000Test 3 F 710000 700000
Table 4.34 The Robbins device - rubber discs results.
Test Disc 10-2 10-2
CFU/ml CFU/mlTest 1 A 210000 170000Test 1 B 130000 200000Test 1 C 1300000 1000000Test 1 D 880000 1160000Test 1 E 1640000 1240000Test 1 F 1410000 740000Test 2 A 1900000 1500000Test 2 B 1900000 2100000Test 2 C 900000 920000Test 2 D 570000 580000Test 2 E 810000 920000Test 2 F 1200000 1100000Test 3 A 140000 180000Test 3 B 280000 270000Test 3 C 70000 210000Test 3 D 250000 450000Test 3 E 300000 300000Test 3 F 300000 450000
Table 4.35 The Robbins device - copper discs results.
Page 181 of 229
Test Disc 10-2 10-2
CFU/ml CFU/mlTest 1 A 260000 50000Test 1 B 230000 200000Test 1 C 120000 380000Test 1 D 500000 70000Test 1 E 110000 280000Test 1 F 140000 200000Test 2 A 110000 90000Test 2 B 60000 110000Test 2 C 390000 100000Test 2 D 270000 110000Test 2 E 80000 50000Test 2 F 230000 190000Test 3 A 140000 140000Test 3 B 140000 240000Test 3 C 140000 190000Test 3 D 160000 150000Test 3 E 90000 210000Test 3 F 260000 50000
Table 4.36 The Robbins device - polyethylene discs results.
The average results of the 3 tests of the rubber, copper and polyethylene disc samples
were:
Rubber 1.1 x 10⁶ CFU/ml
Copper 7.7 x 10⁵ CFU/ml
Polyethylene 1.7 x 10⁵ CFU/ml
Table 4.37 below shows the results of the tests carried out with the Robbins device by
brushing the discs in 10ml distilled water.
Test Disc 10-2 10-2 10-3 10-3
CFU/ml CFU/ml CFU/ml CFU/mlTest 4 C- Rubber TNTC TNTC 11100000 16900000Test 4 F Rubber TNTC TMTC 13900000 8300000Test 4 I Rubber TNTC TNTC 5600000 5600000Test 4 L Rubber TNTC TNTC 12300000 13200000Test 4 B Copper 310000 150000 0 300000Test 4 E Copper 100000 80000 100000 300000Test 4 H Copper 890000 850000 500000 900000Test 4 K Copper 370000 670000 400000 500000Test 4 A Polyethylene 570000 480000 600000 300000Test 4 D Polyethylene 1890000 1380000 1100000 1700000Test 4 G Polyethylene 660000 520000 800000 700000Test 4 J Polyethylene 770000 330000 700000 300000
TNTC = Too Numerous To Count
Table 4.37 The Robbins device - results brushed rubber, copper and polyethylene discs
Page 182 of 229
The 10-2 samples of the rubber discs were too numerous to count. The average result
of the rubber disc 10-3 samples was 1.1 x 10⁷ CFU/ml. The average results of the
highest result of the two 10-2 and the two 10-3 copper and polyethylene disc samples
were 4.6 x 10⁵ CFU/ml for the copper discs and 8.7 x 10⁵ CFU/ml for the polyethylene discs.
Page 183 of 229

5. DISCUSSION
5.1 Evaluation study of 10 hospitals
Legionella contaminate water systems from public water supplies and borehole
waters, and colonize these systems from biofilms, and protozoa cells where they are
protected from disinfection. Preventing Legionella contamination of these systems is,
therefore, a difficult technological challenge. However, because Legionella can cause
devastating disease in humans, it is important to prevent these systems from becoming
contaminated and to control the risk of exposure.
Disturbing findings during this study were that many of the UK Health and Safety
Executive’s and Department of Health’s recommendations may not result in control
and prevention of Legionnaires’ disease. Furthermore, several of their recommended
practices can place an undue burden on UK national health estates departments to
perform costly, labour intensive, and hazardous tasks with uncertain benefit.
In the US, routine monitoring for Legionella in water distribution systems is
recommended as it is considered the only factor known with certainty to be predictive
of the risk of legionellosis. Routine monitoring also allows for evaluation of the
control modalities applied and, therefore, for effective prevention (Lin et al., 2011).
In the UK, however, monitoring for Legionella in water distribution systems is only
recommended when storage and distribution temperatures are not consistently
maintained at the levels recommended in the ACoP (L8) and HTM 04-01 documents
or when an outbreak is suspected or has been identified (UK Approved Code of
Practice (L8), 2000, UK Health Technical Memorandum 04-01, 2006). This approach
has resulted in a lack of evidence of control by the recommended control modalities.
The temperature regime described in the ACoP (L8) and HTM 04-01 documents
recommends that hot water is stored at 60ºC and distributed, so that it reaches a
temperature of 50ºC within 1 minute at outlets. The cold temperature should be below
20ºC after running outlets for up to 2 minutes. Whilst the ACoP (L8) advises that this
regime is the ‘traditional’ approach to Legionella control for hot water and cold water
systems, and that it is not necessary to apply it as long as proliferation of Legionella is
Page 184 of 229

prevented, the HTM 04-01 documents recommend the regime, however, as the
‘preferred’ strategy, and advises using alternative techniques, such as copper- and
silver ionization and chlorine dioxide, only together with but not instead of the
temperature regime (UK Approved Code of Practice (L8), 2000, UK Health Technical
Memorandum 04-01, 2006). The temperature regime is, therefore, still seen by UK
national health trusts as the main control method even though it has not been
validated.
None of the scientific papers evaluated by the UK Department of Health to compose
the HTM 04-01 documents supported the control of Legionella at 50ºC after 1 minute
or at 20ºC after 2 minutes (House of Commons Hansard debates for 22 May 2007,
www.parliament.uk).
In this study, although some control was afforded by maintaining hot water
temperatures above 55ºC, the results of the study with the 10 hospitals demonstrated
that, when water systems are complex, the temperature regime, described in the ACoP
(L8) and HTM 04-01 documents, does not achieve complete control.
Nine of the 10 hospitals studied relied solely on the recommended temperature regime
for the control of Legionella in their hot and cold water distribution systems. The
results of the samples taken from the hospitals before the copper and silver ionization
systems were activated, therefore, demonstrate the lack of complete control by the
temperature regime as Legionella were found. The results of the samples taken from
study hospital 10, before the copper and silver ionization systems were activated, not
only highlight the lack of complete control by the temperature regime but also by
chlorine dioxide as chlorine dioxide was applied as well as the temperature regime
because the temperature regime had failed to completely control the Legionella by
itself. Furthermore, the results of the samples taken from the 10 hospitals also
suggested the temperature regime actually promoted Legionella proliferation because
of the requirement to reduce hot water temperatures to below 46ºC to avoid scalding.
Also supporting this are the temperature recordings of 3073 outlets of other sites at
which Legionella were found. The hot water was deliberately blended with cold water
at 1344 of these outlets (~43.8%) to temperatures ranging from 38ºC to 46ºC. The
average Legionella colony forming unit count was the highest of all the 3073 outlets
Page 185 of 229
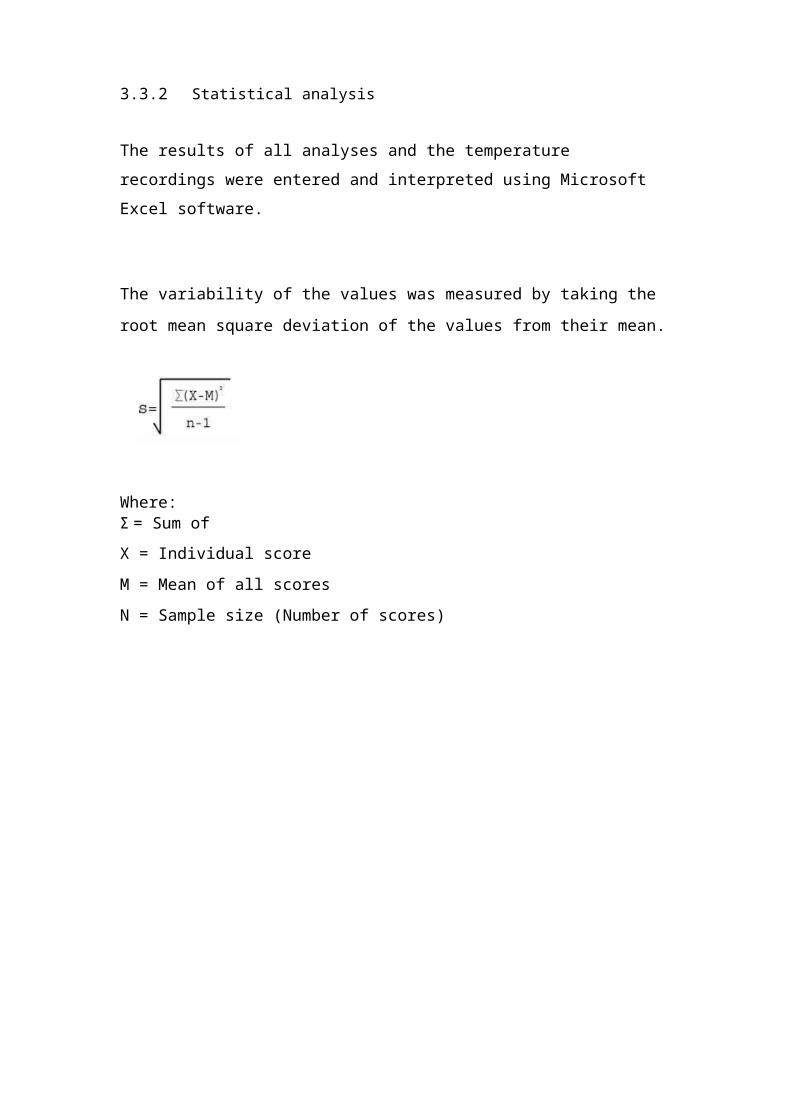
tested at these outlets, at 8339CFU/l (± 889CFU/l), with the highest Legionella colony
forming unit count, of 445500CFU/l, found at 38ºC.
The temperatures of 671 of the 3073 outlets (~21.8%) were between 21ºC and 38ºC
with an average Legionella colony forming unit count of 6213CFU/l (± 996CFU/l).
The hot water at most of these outlets was blended deliberately, which highlighted
another issue with the temperature regime as the mixing valves that were fitted to
these outlets may not have been working properly.
That Legionella are not eradicated by a hot water temperature of above 50ºC is
supported by the temperatures at 199 of the 3073 outlets at which Legionella were
found (~6.5%) being 50ºC and above. The average count was 2941CFU/l (±
474CFU/l). A Legionella colony forming unit count of 100CFU/l was found at the
highest temperature of 76ºC and the highest Legionella colony forming unit count, of
45000CFU/l, was found at 55ºC.
The temperatures of 165 of the 3073 outlets (~5.4%) were between 47ºC and 50ºC.
The average Legionella colony forming unit count was 5320CFU/l (± 1256CFU/l).
Unblended hot water serviced these outlets, which highlighted another issue with the
temperature regime as the water heating system may not have been working properly.
That Legionella are eradicated by a cold water temperature of below 20ºC is also
supported by the temperatures of 694 of the 3073 outlets at which Legionella were
found (~22.6%) being below 20ºC. The average count was 1829CFU/l (± 289CFU/l).
A Legionella colony forming unit count of 200CFU/l was found at the lowest
temperature of 6ºC. The highest Legionella colony forming unit count, of
130400CFU/l, was found at 20ºC.
Previous studies have also demonstrated that the recommended temperatures are
ineffective in controlling Legionella in hospital water systems. Legionella
pneumophila was isolated from taps and showers of 2 buildings in Holland when the
hot water temperature was circulated at 55ºC. The hot water system could also not be
completely decontaminated even by raising the hot water temperature to 70ºC
(Groothuis et al., 1985).
Page 186 of 229

Maintaining hot water at 50ºC to 55ºC at peripheral outlets of a university hospital in
Belgium, removing deadends wherever possible, and improving maintenance on the
hot water storage tanks, by draining, rinsing, refilling them with potable water, and
increasing the temperatures to 95ºC before decreasing temperatures to 60ºC, showed
only a reduction of the number of positive samples but these positive samples still
contained between 104 and 5 x 10⁵CFU/l L. pneumophila serogroups 6 and 10
(Ezzeddine et al., 1989).
Legionella pneumophila serogroup 6, associated with 2 cases of legionellosis,
persisted in a hot water system of a hospital in Italy at temperatures of 55ºC and 56ºC
(Visca et al., 1999).
Darelid et al., (2002), found that maintaining water temperatures above 55ºC was
associated with 12% of water samples being positive during a 10 year period in which
4 patients developed Legionnaires’ disease (Darelid et al., 2002).
After an outbreak of Legionnaires’ disease in August 2010, control of Legionella,
present in the hot water and cold water system of a nursing home in Slovenia, by
maintaining hot and cold water temperatures at 55C and below 20C proved to be
inadequate. The Legionella results of sample testing after these interventions still were
above 104 CFU/l (Skaza et al., 2010).
The results of the research project by BSRIA in 1996 also showed that no Legionella
were found in only 13% of the results of the rig to which the temperature regime was
applied. This study also showed that the hot water storage calorifier, which transferred
heat to water indirectly, did not provide complete protection against Legionella being
drawn into the hot water circuit even when the flow water temperature was maintained
at 60ºC (BSRIA TN6/96).
Studies have even demonstrated that elevated temperatures can promote biofilm re-
growth and that it creates dead organic material, inducing shifts in the prokaryotic
community, which is potentially beneficial for the growth of L. pneumophila (Saby et
al., 2005, van der Kooij et al., 2005, Vervaeren et al., 2006, Temmerman et al., 2006).
Legionella control by the recommended temperatures as in the ACoP (L8) and HTM
04-01 documents in hospitals is basically not possible due to:
Page 187 of 229
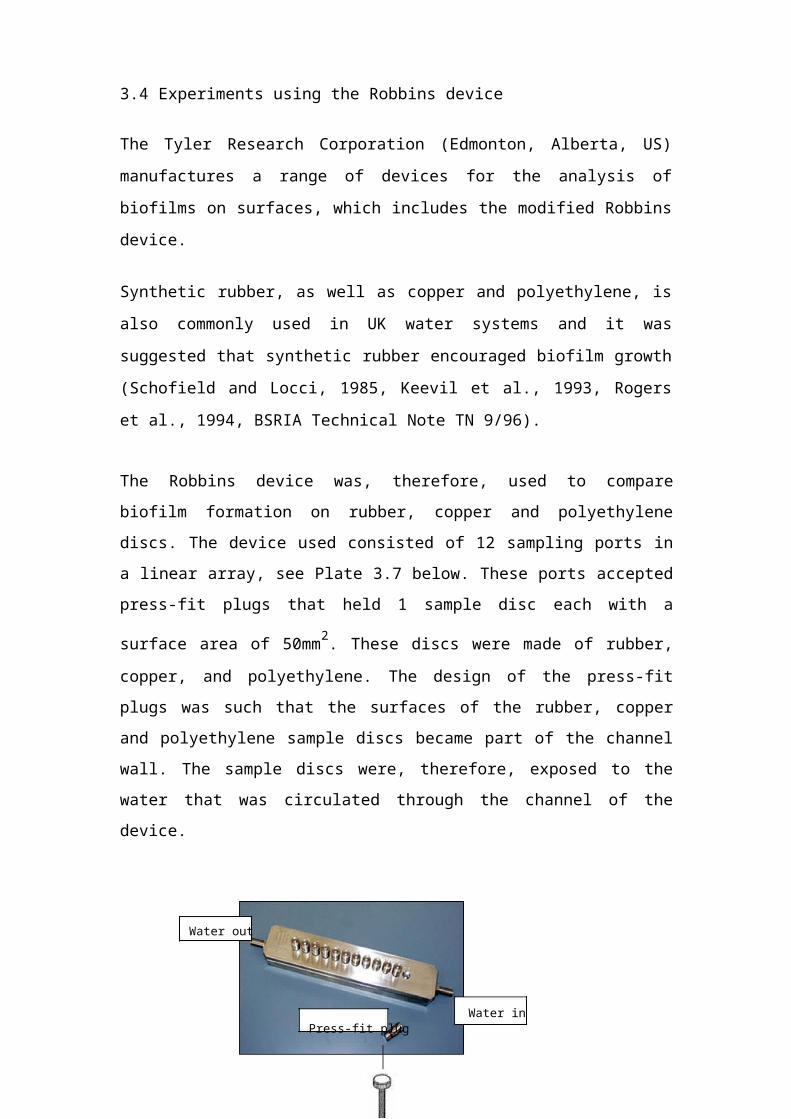
• Legionella being ubiquitous, entering hot and cold water distribution systems
through mains water. Restrictions to having Legionella in water supplies do not
exist (Water Supply (Water Quality) Regulations, 2000, UK Health Technical
Memorandum 04-01, 2006).
• Legionella surviving temperatures of 0ºC to 63ºC (Fliermans et al., 1981), and the
extensive contact time at 50ºC necessary to reduce Legionella populations. Dennis
et al., (1984) reported that L. pneumophila serogroup 1 had a long decimal
reduction time of 111 minutes at 50ºC. Muller, (1981) previously also
demonstrated that L. pneumophila serogroups 1 and 4 were only killed when
exposed to 58ºC for as long as 30 minutes (Muller, 1981, Dennis et al., 1984).
• Hot water being blended with cold water at outlets to avoid scalding to
temperatures of 38ºC (for bidets), 41ºC (for basins), 43ºC (for baths), and 46ºC
(for assisted baths) (UK Health Technical Memorandum 04-01, 2006), and water
temperatures between 20ºC and 46ºC being the range in which Legionella
proliferates most rapidly (Fliermans et al., 1981, Nguyen et al., 1991, Lee and
West, 1991, Newsome, 2001). Makin, (1998), also found that a mixing valve,
feeding blended water to a heavily colonized shower, contained large numbers of
Legionella (Makin, 1998), which highlighted that mixing valves can become a
niche for Legionella proliferation and require to be inspected and cleaned
regularly.
• The complexity of water systems, where there can be 4km of pipework, making
the engineering requirements to maintain the recommended temperatures
consistently for 24 hours a day, 365 days a year, impossible. Kusnetsov et al.,
(2003), demonstrated that it was difficult to maintain 50ºC in the whole length of
circulation in a hot water system of a hospital in Finland. The authors suggested
that this probably reflected a common situation in large buildings and that the
main disadvantage of maintaining such high temperatures is the lack of eradication
of Legionella (Kusnetsov et al., 2003).
• The pressures on UK national health trusts to reduce expenditure. A review,
completed in 2009 of healthcare premises in the UK by the Department of Health ,
highlighted not only that it is difficult to maintain the recommended hot
temperature at the same time in all parts of the system, which frequently results in
eradication failure, but it also emphasized the considerable energy cost associated
with maintaining the recommended hot water temperature (UK Independent
Review, 2009).
Page 188 of 229

• The pressures on UK national health trusts to reduce their carbon footprint (www.sdu.nhs.uk).
It was impracticable to collect samples from all outlets in the 10 hospitals studied
because of the number of outlets and the cost of Legionella analysis. The probability
of contamination at outlets at which Legionella were found before the copper and
silver ionization systems were activated in the 10 hospitals would be higher than at
outlets at which no Legionella were found. The Legionella contamination at outlets at
which Legionella were found before activation was, therefore, primarily monitored
after activation. The water system near to outlets at which Legionella persisted after
activation was also investigated by taking samples for Legionella analysis from outlets
close to the Legionella contaminated outlets.
The number of contaminated outlets before the copper and silver ionization systems
were activated in the 10 hospitals reduced considerably within 3 months after the
systems were activated. The averages of Legionella colony forming unit counts also
reduced considerably in the samples taken within 3 months after the systems were
activated. The number of outlets contaminated and the averages of Legionella colony
forming units continued to drop in all the hospitals and in 4 hospitals no Legionella
were found at the end of the studies. This suggested significant control of Legionella
by the copper and silver ionization systems.
The average hot water temperatures of the 10 hospitals during operation of copper and
silver ionization ranged from 38ºC to 46ºC, see Table 4.30. This indicated that
Legionella were controlled by copper and silver ionization at temperatures below
50ºC.
That Legionella is inactivated and controlled in water systems solely by copper and
silver ionization has been demonstrated by several studies (Liu et al., 1994, Miuetzner
et al, 1997, Liu et al, 1998, Stout et al., 1998, Rohr et al., 1999, Biurrun et al., 1999,
Kusnetsov et al, 2001, Stout and Yu, 2003, Chen et al., 2008, Lin et al., 2011).
Page 189 of 229
The ACoP (L8) and HTM 04-01 documents only recommend concentrations for
Legionella control of 0.4mg/l copper and 0.04mg/l silver in hot water systems, and
0.4mg/l copper and 0.02mg/l silver in soft water systems. Copper and silver
concentrations for cold water systems are, however, not given (UK Approved Code of
Practice (L8), 2000, UK Health Technical Memorandum 04-01, 2006). This is due to
lack of data being available of the copper and silver levels needed to achieve
Legionella control in cold water systems at the time of publication of the ACoP (L8)
in 2000.
The copper and silver levels necessary to maintain control in hot and cold water
systems vary from site to site and depend on the intensity of the contamination and the
conditions available within the water system that promote Legionella growth. The
quality of the incoming water is also important, such as the levels of anions (mainly
chloride and phosphorus) and the alkalinity of the water as these can reduce the
biocidal efficacy of the copper and silver ions and more copper and silver would be
needed to maintain control.
The conductivity of the water is also important as it determines the voltage required to
drive the electrical current between the copper and silver electrodes. High
conductivity requires less and low conductivity requires more.
The average copper and silver results of the samples taken after the copper and silver
ionization systems were activated in the 10 hospitals showed that control was attained
by copper levels ranging from 0.151mg/l to 0.539mg/l and silver levels ranging from
0.021mg/l to 0.043mg/l.
Legionella persisted, albeit at reduced counts, in samples taken from outlets from the
10 hospitals at which either less than 0.2mg/l copper or less than 0.02mg/l silver was
found, and at outlets at which less than both these copper and silver levels were found.
On the other hand, no Legionella were found in samples taken from outlets at which
the copper and silver levels were not consistently maintained above 0.2mg/l copper
and 0.02mg/l silver, indicating that the conditions at these outlets were less favourable
Page 190 of 229
for Legionella growth. However, the average copper and silver levels at these outlets
were mainly above 0.2mg/l copper and 0.02mg/l silver.
The results of study hospital 2 suggested that both the copper and silver target levels
needed to be consistently maintained at the outlet at which Legionella persisted to
control the Legionella, but that, especially, more silver was needed.
Legionella control was achieved solely by the silver produced by the ionization
system of study hospital 3 as the copper side of this system was deliberately turned
off. Control was achieved by an average of 0.033mg/l silver combined with an
average of 0.151mg/l copper from the copper pipes. This suggests that Legionella
control is possible solely by ionized silver but is accelerated in the presence of copper
whether copper ions are produced or leaching from copper pipes.
The copper release by the copper and silver ionization system of study hospital 5 was
low. This was because the electrical current between the copper electrodes could not
be increased due to low conductivity of the water (148.5µS/cm2). The installation of
more copper electrode chambers or increasing the surface area of the copper
electrodes could have overcome this lack of release but the hospital did not take this
up as Legionella were controlled by an average copper level of 0.187mg/l and an
average silver level of 0.036mg/l at the outlets tested.
The peaks in the average Legionella colony forming unit counts in samples taken from
hospital 9 after construction work was started indicated that when construction work
is carried out more copper and silver is needed to maintain control to cope with
heavier invasion of Legionella from dislodged biofilms. Microbial growth and biofilm
formation can also be higher when construction work is carried out because of
microorganisms entering water systems through open pipes from contaminated water
and soil, and settling on the surfaces of water pipes, as well as because of poor water
flows. Although a reduction from 14 contaminated outlets before activation of the
copper and silver ionization system to 1 at the end of the study as well as a reduction
from a 453CFU/l (± 216CFU/l) average Legionella count before activation to a
7CFU/l (± 7CFU/l) average count at the end of the study was reached, higher copper
and silver levels had to be maintained at the outlets, averages of 0.398mg/l copper and
Page 191 of 229

0.037mg/l silver, to achieve this control. This is an important finding when
considering control at other sites where maintenance work is being carried out.
Low copper and silver levels at outlets highlight poor water flow to these outlets
because the copper and silver is not arriving at the outlets, which indicated that these
outlets were either not used or the water flow was obstructed at the outlets by point of
use filters or the copper and silver was trapped upstream the outlets, for instance in
unserviced water heating systems (calorifiers, plate heat exchangers). Low used
outlets were identified in study hospital 10 because of low levels of copper and silver
found in the samples taken from them. The study with hospital 10 indicated that
remedial work, such as regular running of the identified little used outlets, the
replacement of old rubber lined flexible hoses, and regular inspection and cleaning of
mixing valves, would have aided in completely controlling the Legionella in this
hospital. Such remedial work was, however, not always possible because of lack of
staff, which resulted in a slower reduction in the number of contaminated outlets from
the beginning to the end of the study. The average Legionella colony forming unit
count still reduced however from 465CFU/l (± 156CFU/l) before activation of the
copper and silver ionization systems to 157CFU/l (± 112CFU/l) at the end of the
study.
The pH values of the 10 hospitals studied, shown in Table 4.30, show that efficacy in
controlling Legionella by copper and silver levels, ranging from 0.151mg/l to
0.539mg/l copper and 0.021mg/l to 0.043mg/l silver, was not affected in water with
pH values as high as 8.5. This can be attributed to the design of the copper and silver
ionization systems installed in the hospitals, which automatically remove calcium and
magnesium ions from the electrodes, as well as the regular manual cleaning of the
electrodes.
The BSRIA project of 1996 suggested, however, that a pH value greater than 7.6 could
adversely influence the copper and silver ionization Legionella inactivation process. It
was suggested that the silver concentration dropped dramatically to below 0.01mg/l due
to an increase in the pH of the tests carried out with hard water. The pH had increased to
8.6, which resulted in rapid scale formation on the surfaces of the electrodes. The scale
coverage on the electrodes obstructed, particularly, the release of
silver and reduced the availability of silver in the water. The authors found that by Page 192 of 229

acidifying the water with citric acid to a pH of 7.2, the electrodes de-scaled and the
number of copper and silver ions increased in solution (BSRIA TN6/96). The ACoP
(L8) and HTM 04-01 documents, therefore, advise that it is difficult to maintain silver
ion concentrations above a pH of 7.6 (UK Approved Code of Practice (L8), 2000, UK
Health Technical Memorandum 04-01, 2006).
The chloride values of hospital number 5, 7, 9 and 10, of 60.7mg/l, 58.5mg/l,
54.9mg/l and 57.3mg/l respectively, shown in Table 4.30, indicate that average silver
levels of 0.043mg/l, 0.031mg/l, 0.037mg/l, and 0.031mg/l with average copper levels
of 0.366mg/l, 0.539mg/l 0.398mg/l, and 0.231mg/l respectively achieved Legionella
control. Table 4.30 also shows that control was maintained by similar average silver
and copper levels in the water systems of the other hospitals studied but at lower
chloride levels.
Lin et al., (2002) suggested, however, that it was possible that chloride concentrations
in water may decrease the availability of silver cations and reduce its biocidal
potential (Lin et al., 2002).
The phosphorus values of hospital number 3, 6, and 10, of 1000µg/l, 1500µg/l, and
1030µg/l respectively, shown in Table 4.30, indicate that average silver levels of
0.033mg/l, 0.021mg/l, and 0.031mg/l with average copper levels of 0.151mg/l,
0.0.328mg/l, and 0.231mg/l respectively achieved Legionella control. However,
control was also maintained by similar average silver and copper levels in the water
systems of the other hospitals studied at lower phosphorus levels.
According to Lin et al., (2005), however, phosphorus may also interfere with the
efficacy of copper and silver ionization because of complexation with the copper and
silver ions, which could result in precipitation of copper and silver phosphates and
potential loss of biocidal action (Lin et al., 2005).
Although the data from the study with the 10 hospitals suggests that in reality chloride
and phosphorus may not have a great diminishing effect on the biocidal action of
Page 193 of 229
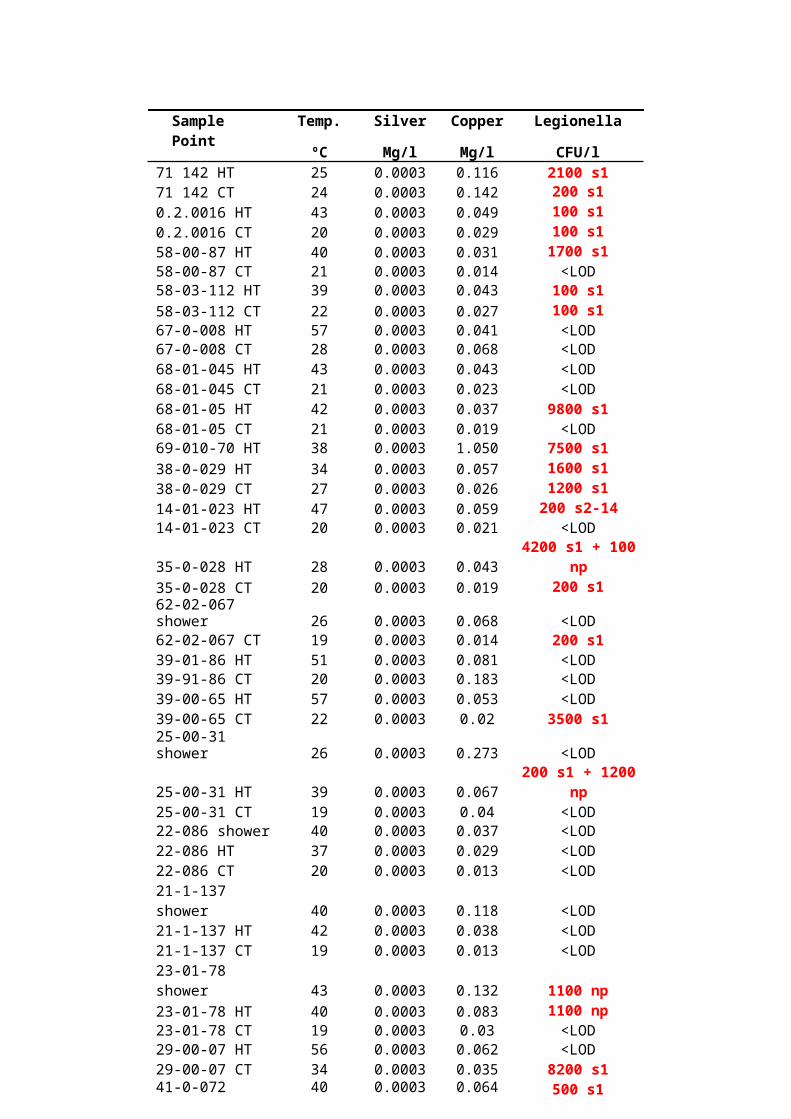
copper and silver ionization against Legionella, the chloride and phosphorus levels in
the water that is to be treated by copper and silver ionization need to be monitored.
Should there be a reduction of the copper and silver biocidal action against Legionella
then increasing the copper and silver levels in the water may need to be considered to
counteract the potentially adverse effect of higher chloride and phosphorus in the
water.
Long term treatment with copper and silver ions could theoretically result in the
development of resistance to these ions. Development of resistance was, however, not
noticed during the 4 years study with the 10 hospitals. Legionella were controlled by
consistently dosing the water systems with copper and silver, average copper levels
ranged from 0.151mg/l to 0.539mg/l and average silver levels ranged from 0.021mg/l
to 0.043mg/l. It is possible that because two biocides are utilized, the acquisition of
bacterial resistance to both copper and silver would be more difficult.
Studies, under laboratory conditions, have demonstrated the development of effective
defence mechanisms against metal ions by Salmonella, Pseudomonas, Enterococcus,
Klebsiella, and E. coli (McHugh et al., 1975, Bridges et al., 1979, Haefeli et al., 1984,
Kaur and Vadehra 1986, Solioz and Odermatt 1995, Silver, 1996, Gaillard and Webb,
1997, Gupta et al., 1999, Gupta, et al., 2001). However, according to Silver, (1996),
in Gram-negative bacteria, such as Legionella, plasmid-mediated resistance to silver
involved energy-dependent efflux of silver from the cell. For instance, plasmid-
mediated silver resistance in Salmonella involved a total of nine genes and was
considered unusual in that it included three separate types of resistance mechanisms
(Silver, 1996).
Dollenmeier, (2002), also suggested that development of resistance to metal ions was
metabolically expensive for bacteria, and that, therefore, the formation of resistance
was not likely. The author suggested as well that resistance to biocides occurred most
readily with substances that relied on specific protein binding or were susceptible to
chemical breakdown or metabolism, such as antibiotics, but that metal ions had such a
broad non-specific mode of action, and were also elements that could not be degraded,
which made resistance not likely (Dollenmeier, 2002).
Chopra, (2007) suggested that because resistance to metal ions is that metabolically
expensive for bacteria, it is also difficult to compete against non-resistant bacteria and
Page 194 of 229
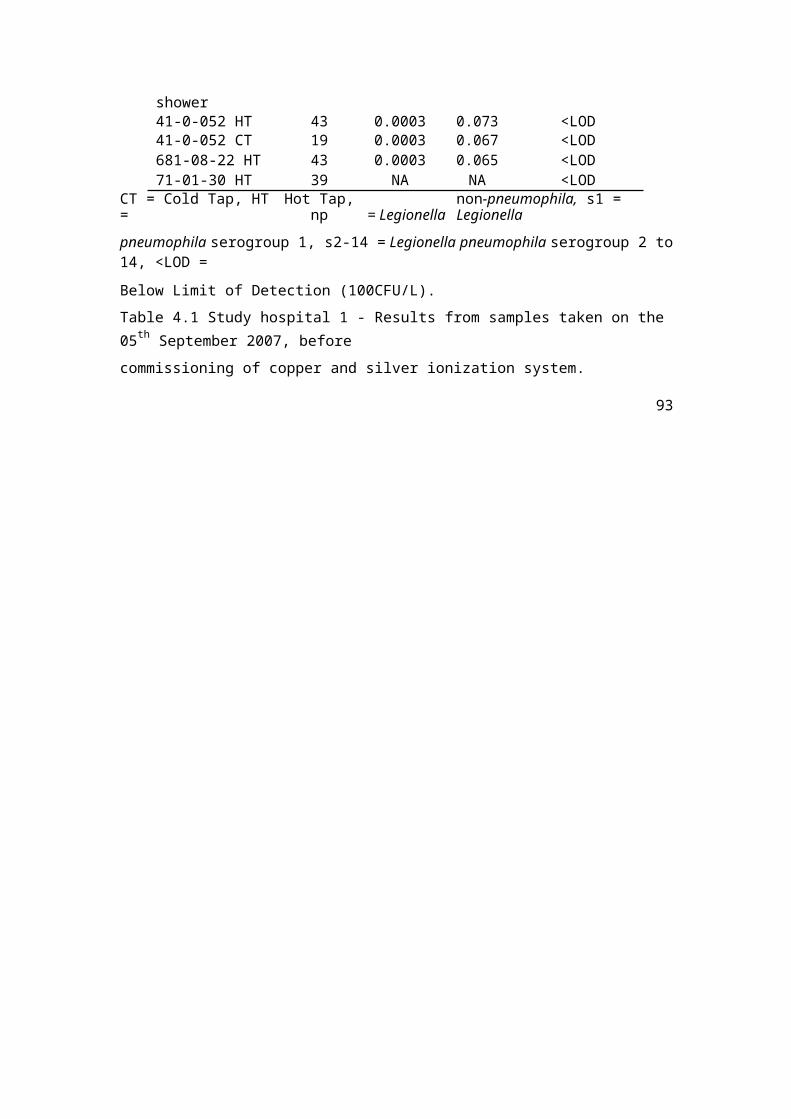
that, therefore, metal resistant strains do not persist through subsequent generations
(Chopra, 2007).
According to Edward-Jones, (2009), the low silver levels used in hygiene, personal
care and healthcare, the lesser contact time, and the multifaceted mechanisms of silver
action on bacteria meant that the development of resistance against silver was unlikely
(Edward-Jones, 2009).
The study with the 10 hospitals highlights that the temperature regime, based in this
instance on the measurements of temperatures at outlets, described in the ACoP (L8)
and the HTM 04-01 documents, was ineffective but that copper and silver ionization
was effective in controlling Legionella with copper and silver levels ranging from
0.151mg/l to 0.539mg/l copper and 0.021mg/l to 0.043mg/l silver, at temperatures
below 50ºC, at chloride values ranging from 8.4mg/l to 60.7mg/l, phosphorus values
ranging from 191µg/l to 2100µg/l, and at pH values ranging from 6.9 to 8.5.
The study highlighted that routine monitoring for Legionella, performed
simultaneously with monitoring for copper and silver levels, identified areas of
increased risk of contamination as well as risk of exposure, which allowed for
effective prevention of hospital-acquired legionellosis.
During the studies none of the 10 hospitals experienced any endemic hospital-
acquired Legionella pneumonia. One elderly, male, oncology patient of study hospital
1 contracted Legionnaires’ disease from an outlet contaminated with Legionella. A
rubber lined flexible hose was attached to this outlet. The hose was removed, brushed
through 5 times in 500ml distilled water, which was then analysed for Legionella by
the culture method. The analysis was conducted by the UK Health Protection Agency
and the same L. pneumophila serogroup 1 bacteria that had infected the stricken
patient were isolated. The patient survived, the contaminated hose was replaced with
copper pipe, the outlet was run regularly to encourage the copper and silver levels,
which were previously below 0.2mg/l copper and below 0.02mg/l silver, and the
Legionella contamination cleared.
Flexible hoses lined with synthetic rubber are commonly attached to outlets in
hospitals because of ease of use. The UK Water Regulations Advisory Scheme
Page 195 of 229
(WRAS) observed that the conditions within flexible hoses may favour the growth of
Legionella, and that evidence from scientific investigations of the occurrence of
Legionella in hospitals has shown that some flexible hoses were heavily infected with
biofilms which included Legionella. Microscopic examination showed that the inner
surface of these hoses were rough and pitted. The rough inner surfaces and the pits
provided an ideal environment for bacteria to attach and form biofilms that harboured
the Legionella. The hoses examined were made from the elastomer ‘ethylene
propylene diene monomer’ (EPDM), which is a synthetic rubber (Water Regulations
Advisory Scheme, January 2006, EPDM Flexible Hoses). Therefore, flexible hoses
lined with synthetic rubber should not be used in water systems where the risk of
legionellosis is high, such as in hospitals.
The study also highlighted that both healthcare facility and infection control personnel
play an important part in preventing hospital-acquired legionellosis. Remedial work,
such as replacing old rubber lined flexible hoses with new hoses at outlets at which
Legionella were found, flushing of outlets at which Legionella and little copper and
silver was found, inspecting and cleaning of mixing valves of outlets at which
Legionella were found, and removing deadlegs, deadends, should be followed up and
completed, whilst the presence of L. pneumophila in samples should prompt clinical
surveillance. Facility and infection control departments of hospitals as well as the
producers of control modalities should all work together to successfully prevent
hospital-acquired legionellosis. This was also emphasized by Lin et al., (2011).
Lin et al., (2011), not only demonstrated the importance of this synergy between
hospital facility and infection control departments and the significance of routine
monitoring for Legionella but also that recommended control modalities need to be
supported by evidence of their efficacy against Legionella.
In the US the following evaluation steps of modalities preventing hospital-acquired
legionellosis have been suggested (Stout and Yu, 2003, Stout, 2007):
• Demonstrated efficacy in vitro;
• Anecdotal experience in individual sites;
• Controlled studies of sufficient duration (years) in single sites; and
• Confirmatory reports from multiple sites
Page 196 of 229

The study with the 10 hospitals reports on the efficacy of copper and silver ionization
to control Legionella in multiple UK hospital water systems over a period of 1½ to 4
years as well as on the efficacy of copper and silver ionization in these water systems
in preventing legionellosis. This represents the last 2 of the above evaluation steps.
Previously, in laboratory assays, copper and silver ions have already been shown to
effectively kill Legionella in-vitro (Landeen et al., 1989, Lin et al., 1996, Rohr et al,
1996), anecdotal reports of the efficacy of copper and silver ionization systems have
also been presented (Thompson et al., 1990, Lee et al., 1994, Liu et al., 1994,
Mietzner et al., 1997, Mathys et al., 2002, Oesterholt, 2006), and studies have also
been conducted in the US into the efficacy of copper and silver ionization to prevent
hospital-acquired legionellosis over a prolonged period (Selenka et al., 1995, Rohr et
al., 1999, Reynaga et al., 2001, Stout and Yu, 2003). Copper and silver ionization is,
therefore, a Legionella control modality to have fulfilled all of the 4 evaluation
criteria.
This US evaluation methodology has, however, not been adopted in the UK. The
recommendations in the ACoP (L8) and HTM 04-01 documents are currently not
supported by evidence of their efficacy in controlling Legionella in water systems. At
the time of writing this thesis, however, a review of the ACoP (L8) is proposed but it
is unclear whether or not the efficacies of the recommended control modalities are
going to be evidence-based, and whether or not routine monitoring for Legionella as
well as for the biocidal agents applied and interaction between facility and infection
control departments is going to be recommended.
Page 197 of 229
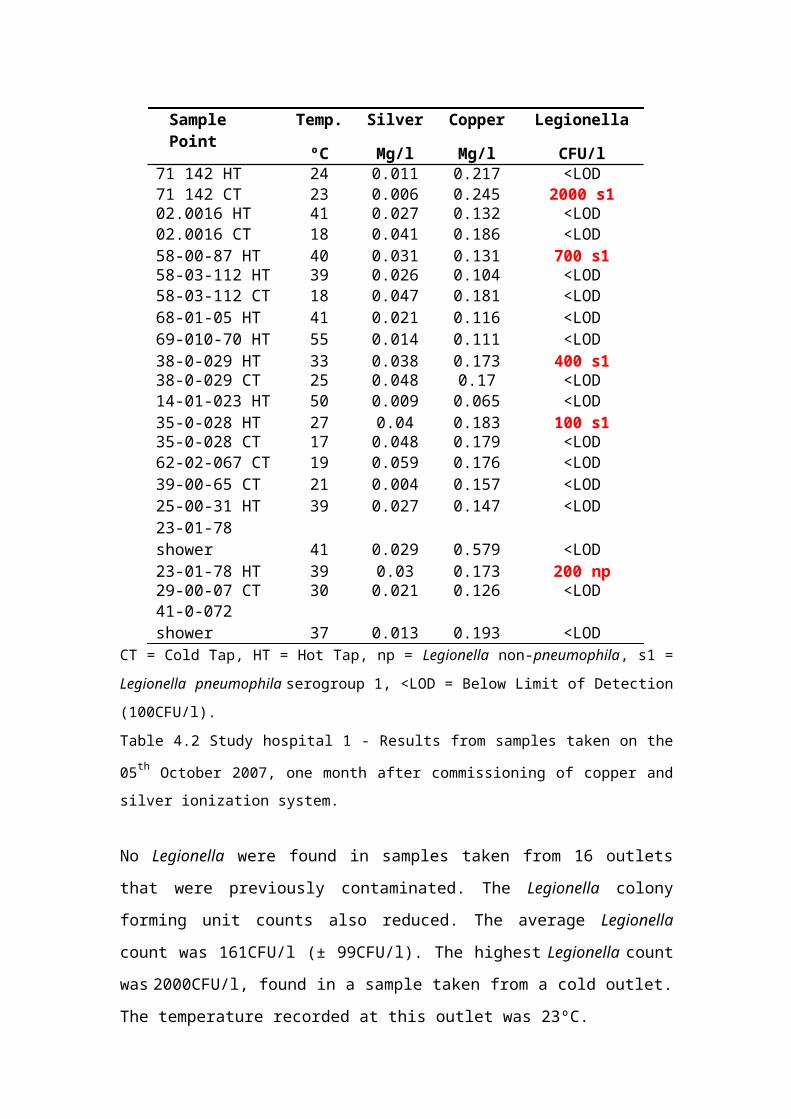
5.2 Initial experiment with rigs
According to the ACoP (L8) and HTM 04-01 documents, the plumbing materials
commonly used for hot water and cold water are copper, polyethylene, stainless steel
and iron. Unplasticized polyvinyl chloride (uPVC) is also often used.
However, in spite of research showing that L. pneumophila can colonize stainless
steel, that biofilm formation and L. pneumophila colonization is heavier on
polyethylene in comparison to copper, and that iron tubercles of eroded galvanized
pipes provide nutrients and a habitat for microorganisms including Legionella (Haas
et al.,1983, Schofield and Locci, 1985, Keevil et al., 1993, BSRIA Application Guide
Ag 2/93, Camper, 1996, BSRIA, 1996, Geldreich, 1996, Geldreich and Le Chevalier,
1999, van der Kooij et al., 2005, www.corrosion-doctors.org), no reference to this is
given in the ACoP (L8) and HTM 04-01 documents.
Instead, the ACoP (L8) and the HTM 04-01 documents specify that a hot water and
cold water installation must comply with the requirements of the Water Supply (Water
Fittings) Regulations 1999, which provides a list of products and materials that have
been assessed for compliance. This assessment is carried out in the UK according to
the British Standard BS6920, which ensures that the material does not contribute to
poor water quality by producing unacceptable taste and odours, by releasing
chemicals, or by encouraging microbial growth. The procedure uses a natural river
water inoculum and a water sample of known chemistry. Bacterial growth is
determined indirectly by measuring oxygen consumption. The procedure, therefore,
does not provide information on the rate of biofilm formation on different plumbing
materials or indicates which organisms are present within the biofilm (BS6920-01,
2000).
Experiments with model systems have indicated that polyethylene can promote
microbial growth more than copper (Keevil et al., 1993, van der Kooij et al., 2005).
Although the model systems constructed for these experiments endeavoured to
replicate small hot water systems, they did not simulate a copper and a polyethylene
piped hot water system of a typical small UK hospital, in which water is stored,
heated, blended and circulated. Biofilm formation and Legionella growth were also
Page 198 of 229
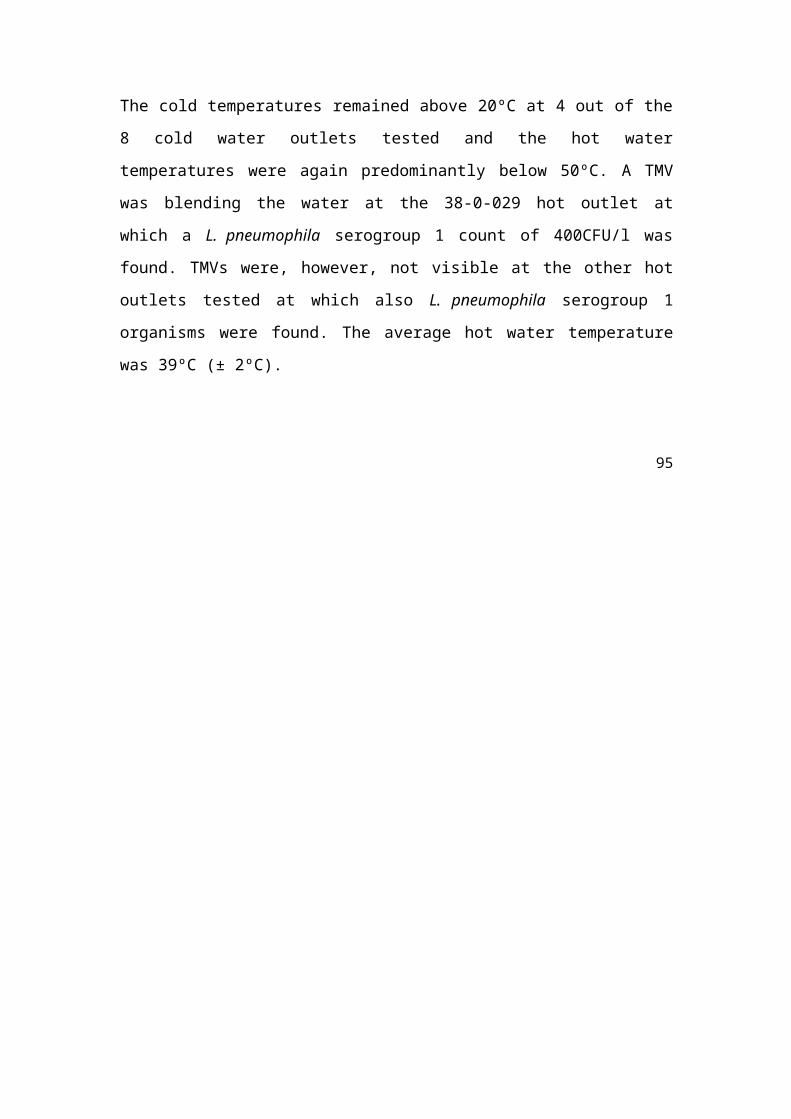
only examined in these model systems and Legionella control measures were not
tested.
For this project, copper and polyethylene piped model rigs were, therefore,
constructed to not only examine the differences in biofilm formation and Legionella
growth in copper and polyethylene piped water systems but also to examine
Legionella growth at a hot water temperature of below 46ºC, simulating a blended
water system, and to examine the efficacy of hot water temperatures of 50ºC, as well
as the efficacy of copper and silver ionization at temperatures below 46ºC, in
controlling Legionella in these rigs. The rigs were uniquely designed and operated in
that their pipes were divided into removable sections to examine biofilm formation,
and Legionella growth, on the inner surfaces of the different materials. Water was also
removed from and added to the rigs daily, therefore, consistent conditions were
effectively maintained within the rigs.
The initial experiment with the first rigs built, the A rigs (copper and polyethylene),
was carried out with the view to investigate whether this rig design was capable of
supporting growth of Legionella and, if so, to compare microbial growth between
polyethylene and copper pipes.
Samples were taken once every week over 582 days and were analysed for viable
bacteria by the standard culture method (BS EN ISO 6222:1999). This standard is the
industry standard used to establish microbial activity in water systems, and specifies
incubation of samples at 37ºC and at 22ºC to differentiate between bacteria that
proliferate at body temperature, ~37ºC, and can potentially cause disease in humans,
and bacteria that are ubiquitous in the environment and proliferate at 22ºC.
Both rigs were inoculated with viable bacteria. More viable bacteria were introduced
to the copper rig than to the polyethylene rig. In total, viable bacteria counts (TVCs)
of 8052CFU/ml, incubated at 37ºC, and 12238CFU/ml, incubated at 22ºC, were
introduced to the copper rig, whereby 6567CFU/ml, incubated at 37ºC, and
8218CFU/ml, incubated at 22ºC, were introduced to the polyethylene rig.
The TVC analysis results of the 67 samples taken individually over the 582 days from
the rigs demonstrated that a population of viable bacteria was successfully maintained
Page 199 of 229
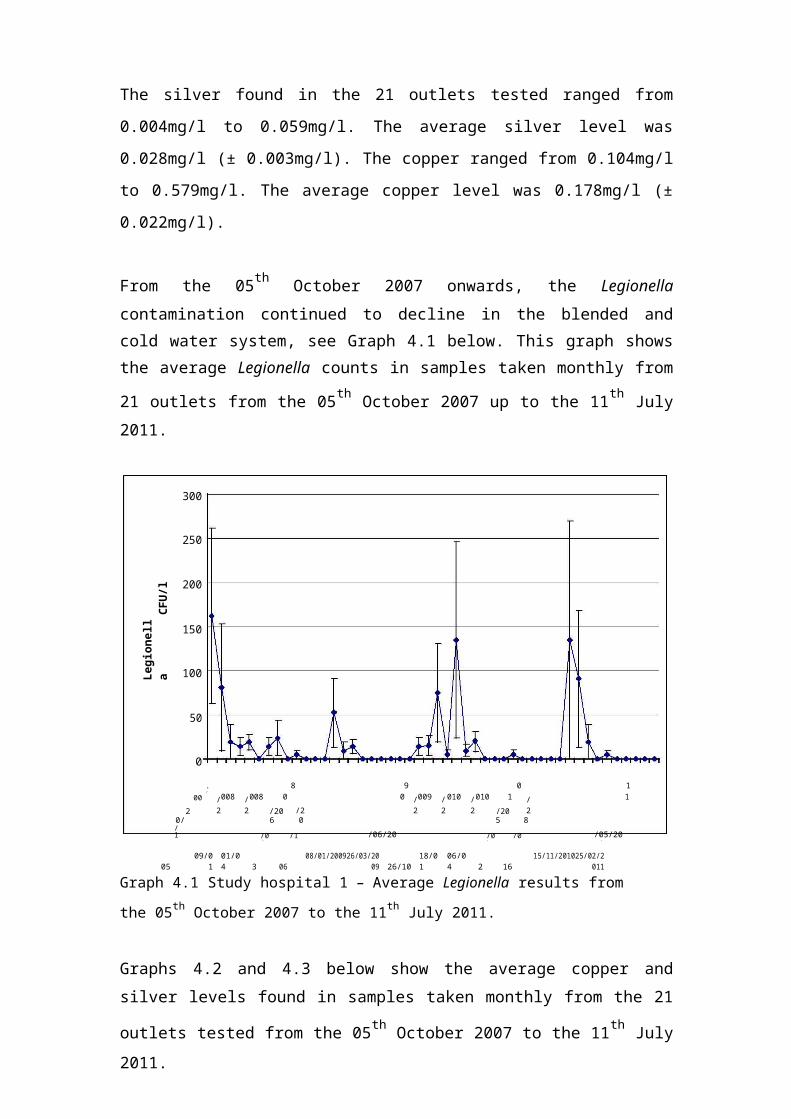
in both rigs. The results were, however, variable, fluctuating wildly. No replication
was found in the results and an overall trend could not be established. This could have
been due to 3 litres of water with viable bacteria being drawn from the rigs and 3
litres of fresh water, with possibly less viable bacteria, being added to the rigs daily.
This would explain fluctuating viable bacteria levels found in real situations.
What was seen was that there were apparently fewer bacteria isolated at 22ºC than at
37ºC were found in both rigs. Although many bacteria thrive at 22ºC as well as at
37ºC, and the 2 temperatures are close enough to be relatively unselective, this
possibly suggested that the population had adapted to 37ºC, which could perhaps be
explained by the rig water temperatures being kept between 40ºC and 45ºC.
More bacteria that responded to incubation at 22ºC were found in the copper rig than
in the polyethylene rig, which was surprising because of the superior biocidal property
of copper cited previously in studies conducted by Schofield and Locci, (1985),
Keevil et al., (1993), BSRIA, (1996), and van der Kooij et al., (2005).
A new method to analyze the pattern of biofilm development was developed for the
study with the rigs, whereby pipe sections of each rig were periodically removed and
brushed through 5 times aseptically in 500ml of distilled water, after which the
sample was dried and weighed. The viable biological material within the brushed
samples was also analyzed by the standard culture method (BS EN ISO 6222:1999) in
total viable counts (TVCs).
In spite of a considerable population of planktonic organisms, substantial biomass, in
weight and in TVC results, did not develop over 478 days, indicating that the
conditions within the rigs were not conducive to biofilm growth. This could be
explained by the biocidal action of copper in the copper rig cited in other studies, the
smooth surface characteristics of polyethylene, the fluid mechanics within both rigs
(high flow rates), and insufficient bacterial adhesive force. Also, a dynamic system
may have developed in the rigs whereby biofilms formed and dispersed rapidly, due to
the high flow rates, preferentially developing in parts of the rig away from the tested
sections, such as around the pushfit connections, which was difficult to follow
experimentally.
Page 200 of 229

The planktonic Legionella results of the samples taken from each rig after Legionella
was introduced to the rigs showed that substantial Legionella populations had
developed in the rigs, indicating that the conditions in the rigs were favourable for
Legionella growth and that biofilms may have, therefore, been present.
2700CFU/l of Legionella was introduced to each rig. The bacteria developed quickly
to counts of 22000CFU/l in the sample taken from the polyethylene rig and
48000CFU/l in the sample taken from the copper rig 39 days after introducing the
bacteria to the rigs. After the 39 days the Legionella results were, however, variable
and an overall trend in Legionella growth in the rigs could also not be determined.
This was not unexpected as a chemostat was effectively operated by drawing water
from and adding water to the rigs daily.
The average results of the analysis for planktonic Legionella showed that the
Legionella colony forming unit counts in the copper rig samples were higher than in
the polyethylene rig samples
A new method to analyze the presence of Legionella in biofilms (sessile Legionella)
was also developed for this study. Pipe sections of each rig were removed, brushed
through aseptically 5 times in 500ml of distilled water, after which the sample was
analyzed by the standard culture method (ISO 11731:1998). This method has since
been adopted by the UK Health Protection Agency in Birmingham.
The results of the Legionella analysis of these samples also showed that the
Legionella colony forming unit counts in the copper rig samples were higher than in
the polyethylene rig samples.
The higher planktonic and sessile Legionella counts found in the copper rig were
surprising considering the biocidal property of copper against Legionella cited in
studies conducted previously (Schofield and Locci, 1985, Keevil et al., 1993, BSRIA,
1996, van der Kooij et al., 2005).
Schofield and Locci, (1985), found that colonization by L. pneumophila was the least
on copper materials, the most on rubber, and that the bacteria also appeared to be able
to colonize silicone tubing and adhere to stainless steel (Schofield and Locci, 1985).
Page 201 of 229
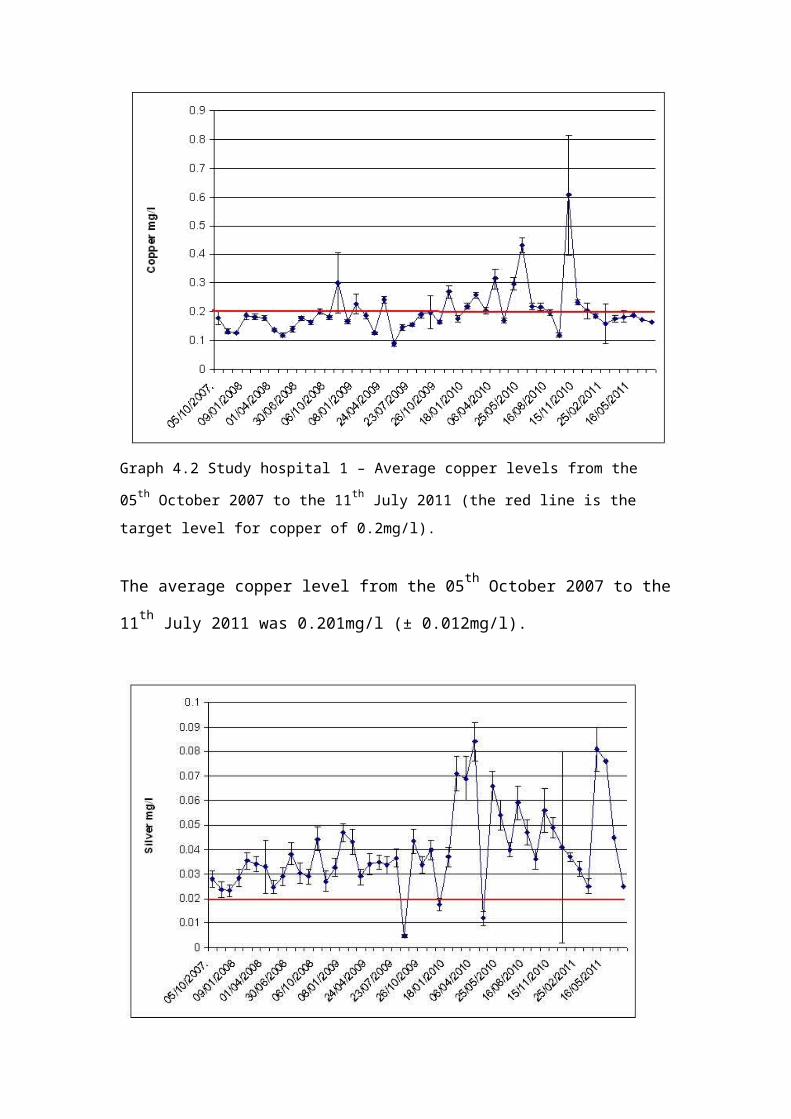
Keevil et al., (1993) and Rogers et al., (1994), found that Legionella comprised a very
low proportion of the microbial population on the copper coupons tested whilst, of the
plastic materials tested, polyethylene appeared to be most heavily colonized. The
authors suggested that copper ions could either inhibit Legionella selectively or the
organisms that support Legionella growth (Keevil et al., 1993, Rogers et al., 1994).
The BSRIA (1996) study also observed that the number of Legionella recovered from
the biofilms that had formed on the copper and glass reinforced plastic coupons was
only significant on the glass reinforced plastic coupons and not on the copper
pipework because this appeared to be naturally biocidal (BSRIA TN 9/96), and van
der Kooij et al., (2005), found that Legionella concentrations in water from the
polyethylene pipes were more than 10 times higher than those from the copper pipes
(van der Kooji et al., 2005).
The conditions in the copper rig were possibly more favourable for Legionella growth
than the conditions in the polyethylene rig. The presence of more viable bacteria,
isolated at 22ºC, may have provided more nutrients and the rougher surfaces of the
copper pipes may have given better microbial attachment for biofilm formation.
Enhanced biofilm formation and rougher surfaces of copper piping was demonstrated
by Kandlikar et al., (2001) and Renner and Weibel (2011).
The Legionella analysis results of the samples from the test carried out simultaneously
with brushed through sections 1 to 16 of the copper rig showed that the rig represented
a dynamic situation in which biofilms developed and declined rapidly over time. Parts
of these biofilms may have also sheared off and may have colonized other parts of the
rigs, which emphasizes the potential complexity of biofilms and microbial activity in
real water systems.
The highest Legionella count was found in brushed through section 10 that had been
in the copper rig for 353 days. This may have been because biolayers had developed
upstream this section, which had sheared off and re-formed in section 10, therefore,
providing better conditions for Legionella to thrive, and suggested local interaction
between biofilms. The drop in Legionella counts in section 3, 2 and 1 that had been in
the copper rig for the longest (496, 539 and 547 days) may have been because
Page 202 of 229

biofilms had sheared off and settled elsewhere in the rig, therefore, providing less
favourable conditions for Legionella to grow in these sections.
Because water was circulated through the rigs continuously at a relatively high rate,
and because 3 litres of water were drawn off and 3 litres of fresh water were added to
the rigs daily, dispersion of biofilms most likely occurred frequently, which is
supported by the variability in the TVC and Legionella results.
Less Legionella were found in the samples taken from the copper rig A than in the
polyethylene rig A after rigs A were used to inoculate rigs B and C. This could be
explained by the removal of sections and water from rigs A for rigs B and C and by
doing so a substantial amount of the established biofilms that had formed beforehand
in the copper rig A was removed from the rig. The conditions within the copper rig A
may have, therefore, become less favourable for Legionella to grow.
Although a superior biocidal action of copper compared to polyethylene was not
demonstrated in the initial experiment with rigs A, less Legionella were found in the
copper rigs B and C than in the polyethylene rigs B and C. The Legionella counts
found in polyethylene rigs B and C were ~473% higher than those found in copper
rigs B and C.
Interestingly, the Legionella found in all rigs during this study, L. pneumophila
serogroup 2-14, were different from the species introduced to the rigs, L. pneumophila
serogroup 1 and Legionella non-pneumophila. This suggested that the local
environment in both rigs promoted the growth of L. pneumophila serogroup 2-14, and
that the inoculum introduced could have contained a mixture, including serotypes not
readily detectable in the inoculum at the initial stages.
Page 203 of 229

5.3 Comparison experiment with rigs
The Legionella colony forming unit counts also reduced considerably whilst copper
and silver ionized water was added daily to the rigs A for 83 days, ~99% in the
polyethylene rig, and ~98% in the copper rig. This was achieved at reduced
temperatures, average 44ºC in the polyethylene rig and 42ºC in the copper rig, with an
average of 0.042mg/l silver and 0.866mg/l copper in the polyethylene rig, and of
0.031mg/l silver and 0.874mg/l copper in the copper rig.
The Legionella results of the samples taken from the brushed through sections during
treatment with copper and silver ionized water, were, however, inconclusive because
no results before treatment were available for the same sections analyzed, and
variability of the TVC and Legionella results, found previously, had highlighted that
biofilms may have been unstable because of frequent dispersion. Biofilms may also
have been removed from the rigs by draining 3 litres of water from them daily.
Before copper and silver ionized water was added to the polyethylene rig, Legionella
counts found in the samples of the brushed through sections were: Section 19, in place
in rig since design stage, 5600CFU/l
Section 18, in place in rig for 79 days, 0CFU/l
Section 17, in place in rig for 114 days, 13600CFU/l.
The Legionella counts found in the samples of the polyethylene rig brushed through
sections during treatment were:
Section 16, in place in rig for 133 days, day 13 of trial, 2900CFU/l
Section 14, in place in rig for 175 days, day 55 of trial, 30400CFU/l
Section 13, in place in rig for 203 days, day 83 of trial, 0CFU/l.
Before copper and silver ionized water was added to the copper rig, Legionella counts
found in the samples of the brushed through sections were: Section 19, in place in rig
for 58 days, 6700CFU/l
Section 17, in place in rig for 79 days, 1500CFU/l
Section 16, in place in rig for 114 days, 800CFU/l.
Page 204 of 229

The Legionella counts found in the samples of the copper rig brushed through sections
during treatment were:
Section 15, in place in rig for 133 days, day 13 of trial, 200CFU/l
Section 14, in place in rig for 175 days, day 55 of trial, 6600CFU/l
Section 13, in place in rig for 203 days, day 83 of trial, 900CFU/l.
A peak Legionella colony forming unit count, of 59200CFU/l, found in a sample
taken from the copper rig on day 55 of treatment, and the reduction in counts
thereafter, suggested that biofilms may have been broken up by the copper and silver,
dispersing significant numbers of Legionella into the water. Too many Legionella
may have been dispersed to be controlled by the available silver and copper at that
time.
As expected, the Legionella populations of rigs B, where temperatures were
maintained below 46ºC, without copper and silver addition, increased. More
Legionella were, however, found in the copper rig than in the polyethylene rig, which
was surprising due to the biocidal property of copper against Legionella cited in
previous work (Schofield and Locci, 1985, Keevil et al., 1993, BSRIA, 1996, van der
Kooij et al., 2005). The conditions in the copper rig were possibly more favourable for
Legionella growth than the conditions in the polyethylene rig. Less Legionella were,
however, found in a sample of a brushed through section that had been in the copper
rig for 203 days but these results were inconclusive because, as suggested previously,
biofilms may also have been actively dispersing, and may have been removed from
the rigs by draining the rigs’ water daily.
The study with the rigs C was conducted to establish the efficacy of controlling
Legionella by temperatures of 50ºC as this is the control modality adopted by most
UK building owners in response to the recommendations in the ACoP (L8) and 04-01
documents. The results of the Legionella analyses of rigs C showed, however, that
less control was achieved compared to in rigs A in which copper and silver ionized
water was added daily.
The results of the 10 hospitals studied already highlighted that the temperature regime,
recommended in the ACoP (L8) and HTM 04-01 documents, did not completely
control Legionella in the water systems of the hospitals. The large number
Page 205 of 229
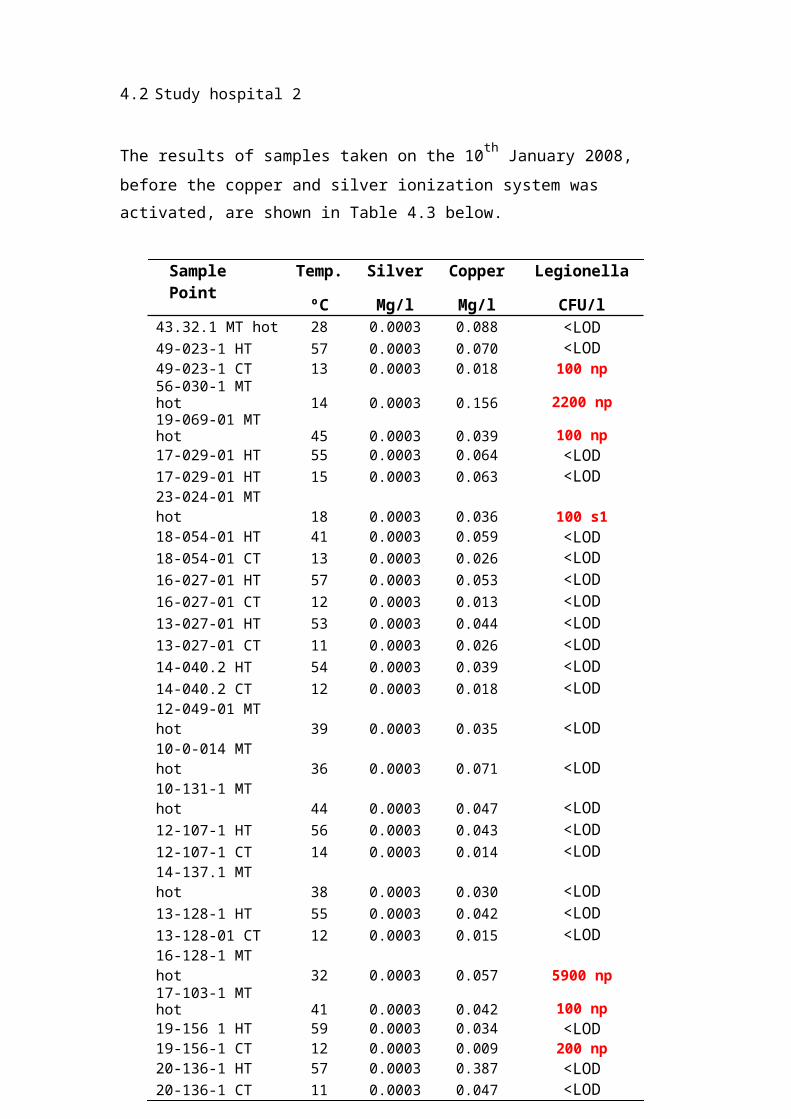
of contaminated hot outlets that were blended by cold water to avoid scalding, which
is a requirement when the temperature regime is applied as a control modality,
suggested that Legionella proliferation could actually be promoted by applying the
temperature regime. This was also supported by the high Legionella colony forming
unit counts found in the samples taken from rigs B, in which non-scalding water
temperatures were maintained.
A greater reduction in the Legionella colony forming unit counts, of 76%, was found
in the copper rig C than in the polyethylene rig (48%). Less Legionella were also
found in the samples taken from the 3 brushed through copper sections, although
these results were again inconclusive.
It was impossible to maintain the ACoP (L8) and HTM 04-01 documents’
recommended temperatures consistently at all outlets throughout the 10 hospitals, and
it was also difficult to maintain the temperatures of rigs C above 50ºC. The
temperatures of rigs C also fluctuated, similar to the hot water temperatures of the 10
hospitals studied.
The Legionella results of the samples taken from rigs C also demonstrated that even
when a temperature of 50ºC, and above, is maintained, Legionella is not controlled.
This was also observed in the study carried out with the 10 hospitals and from data
gathered from other sites.
Because the study with the 10 hospitals showed that control by copper and silver
ionization of the Legionella was maintained, it could be assumed that copper and
silver ionization also controlled biofilms as biofilms are the breeding grounds for
Legionella.
Control of biofilms by copper and silver ionization was also demonstrated by the
BSRIA project of 1996. It was demonstrated that, where operated at concentrations of
0.4mg/l copper and 0.04mg/l silver, copper-silver ionization was effective for the
control of biofouling. Biofilms were analysed in the copper pipework circuits and the
glass reinforced plastic (GRP) tanks by removing small copper coupons from the
copper pipework circuits and GRP coupons from the tanks. These coupons were
covered with biofilms and disinfected by copper-silver ionization. The cistern GRP
Page 206 of 229
and cold water circuit copper coupon samples of the rig that was supplied with hard
water demonstrated a 30% drop in biofilm coverage on commencement of
disinfection. After 14 days of disinfection, the percentage coverage on the surface of
the hot water circuit copper coupon was reduced to less than 5%. The percentage
coverage on the cistern GRP coupon sample began, however, to increase again to 30%
after 21 days. The authors suggested that biofouling returned on the cistern GRP
coupon because it was difficult to maintain silver concentrations above 0.01mg/l due
to scaling of the silver electrodes, which obstructed the release and presence of silver.
Copper-silver ionization disinfection resulted in a rapid decrease in biofilm coverage
on the cold water copper coupon samples of the rig that was supplied with softened
water, from over 50% to less than 5%. A more gradual constant decrease was noted,
to less than 10%, on the cistern GRP and the hot water copper coupons (BSRIA
TN6/96).
Shih and Lin (2010) also demonstrated that copper-silver ionization was effective in
controlling biofilms. A model plumbing system, consisting of four transparent PVC
biofilm sampling pipes, was designed. A 14-day inoculation period was followed by
120-hours disinfection. The inoculum solution consisted of a bacterial suspension (3 x
106cfu/ml) of environmental isolates of P. aeruginosa, S. maltophilia, and A.
baumannii, which are biofilm-associated sessile pathogens. Copper-silver
concentrations were maintained at 0.2mg/l copper and 0.02mg/l silver to 0.8mg/l
copper and 0.08mg/l silver and achieved complete inactivation of the biofilm-
associated P. aeruginosa within the first 24 hours. Biofilm-associated S. maltophilia
was completely inactivated in 48 hours, and 99.9% of biofilm-associated A.
baumannii was killed in 12 hours (Shih and Lin, 2010).
Whether or not control of biofilms was achieved by copper and silver ionization was,
however, inconclusive in the study carried out with the rigs A because biofilms were
potentially unstable and moving through the pipe sections, and because biofilms may
have been removed from the rigs A by draining 3 litres of water from them daily this
was considered essential to maintain uniform conditions in the rigs.
Although superior biocidal action of copper was observed in studies conducted
previously (Schofield and Locci, 1985, Keevil et al., 1993, van der Kooij et al., 2005),
Page 207 of 229
this was not seen in the studies carried out with the rigs as more average Legionella
colony forming unit counts were found in the copper rigs A and B than in the
polyethylene rigs A and B.
Although superior biocidal action of copper was not demonstrated by the studies with
rigs A and B, more Legionella control was, however, found in the study with copper
rig C, which could possibly be due to the superior biocidal action of copper cited in
previous work (Schofield and Locci, 1985, Keevil et al., 1993, BSRIA, 1996, van der
Kooij et al., 2005).
Page 208 of 229

5.4 The Robbins device experiment
Experiments with the Robbins device were conducted to clarify the results of the
studies with rigs A and B, which did not demonstrate the superior biocidal action of
copper cited previously in other work (Schofield and Locci, 1985, Keevil et al., 1993,
BSRIA, 1996, van der Kooij et al, 2005). The Robbins device offered a simplistic
means to observe in a short time whether or not bacterial growth was less on copper
than on polyethylene.
Tests 1, 2, and 3 with the Robbins device were conducted by releasing copper and
polyethylene discs in 10ml distilled water and shaking the samples for 30 seconds.
These tests showed more bacterial growth in the copper disc samples than in the
polyethylene disc samples after 24 hours, and, therefore, supported the findings of the
studies with rigs A and B. The rougher surface of the copper discs may have given a
better environment for microbial attachment and for biofilm formation than the
smoother surfaces of the polyethylene discs.
The Robbins device was also used to observe bacterial growth on rubber discs that
were cut from the Ethylene Propylene Diene Monomer (EPDM) rubber inners of a
flexible hose, commonly used in UK water systems.
Tests 1, 2, and 3 with the Robbins device were conducted by releasing also these
rubber discs in 10ml distilled water and shaking the sample for 30 seconds. These
tests showed greater growth in the rubber disc samples than in the copper and
polyethylene disc samples after 24 hours.
Adhesion and biofilm formation on materials used for medical devices, including
silastic rubber, has been studied in the past using a Robbins device. Jass et al., (1995)
used a chemostat coupled Robbins device to monitor the colonization of P.
fluorescens and P. putida on silastic rubber surfaces (Jass et al., 1995).
Greater bacterial growth on rubber, natural and synthetic, materials was has also been
demonstrated in other studies (Schofield and Locci, 1985, Keevil et al., 1993, Rogers
et al., 1994). These studies did not use a Robbins device and were conducted with
coupons of rubber inserted in complex model water systems.
Page 209 of 229
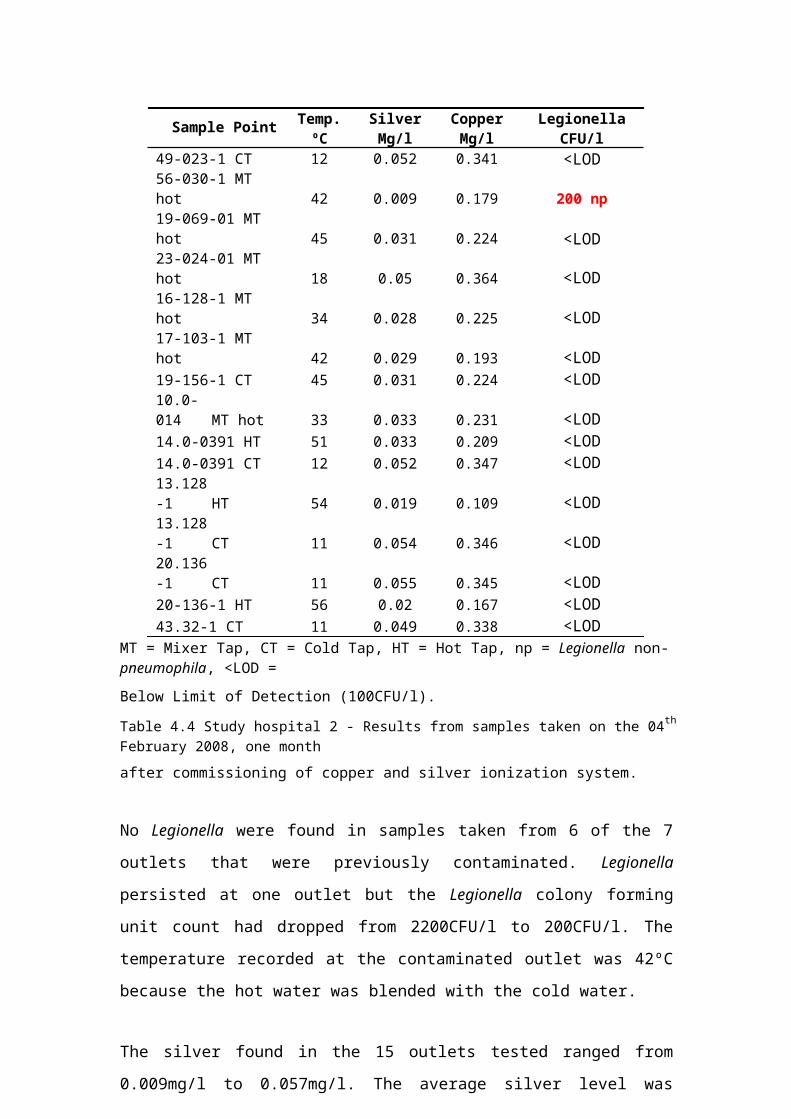
Mats of cells and slime-like debris was heaviest on rubber and least on copper
materials of the model hot water system built to examine colonization by L.
pneumophila. Abundant growth of L. pneumophila on rubber was also observed.
Polyethylene was not tested in this study (Schofield and Locci, 1985).
Keevil et al., (1993) found that the most prolific biofilms developed on the surface of elastomeric materials. The biofilm covered the entire elastomer surfaces after only 24
hours and contained more than 8.9x10⁶cfu/cm2 on latex and 2.7x10⁶cfu/cm2 on
ethylene propylene rubber. The highest populations of L. pneumophila were found on latex and ethylene propylene rubber as well. Copper and polyethylene were also tested in this study (Keevil et al., 1993).
Rogers et al., (1994) also investigated biofilm growth and L. pneumophila
colonization on latex, ethylene-propylene rubber, and polyethylene, and found that
latex and ethylene propylene rubber were also most heavily colonized with L.
pneumophila (Rogers et al., 1994).
Tests 4 were conducted with the Robbins device to also compare bacterial growth on
the copper, polyethylene, and rubber discs but by brushing the discs in 10ml distilled
water instead of shaking them in 10ml distilled water for 30 seconds. These tests
showed that most viable bacteria were released from the rubber discs but that more
viable bacteria were released from the polyethylene discs than from the copper discs,
which could be explained by the biocidal action of copper or by that not all viable
bacteria were removed from the copper discs through brushing them. The surfaces of
copper are rougher than the surfaces of polyethylene, and Donlan, (2002), had
reported that surface roughness of materials can allow microbes to reside in a
protected area (Donlan, 2002).
As with the studies with rigs A and B, the findings with the Robbins device also did
not demonstrate the superior biocidal action of copper but indicate that the surface
roughness of copper may provide a better surface for bacterial attachment and growth
than the smoother surfaces of polyethylene.
That rubber encourages bacterial growth was demonstrated by the Robbins device
experiment. As this could enhance the risk of harbouring Legionella, rubber lined
flexible hoses and other synthetic rubber materials used in water systems should be
identified and assessed for the possibility of contamination by Legionella.Page 210 of 229
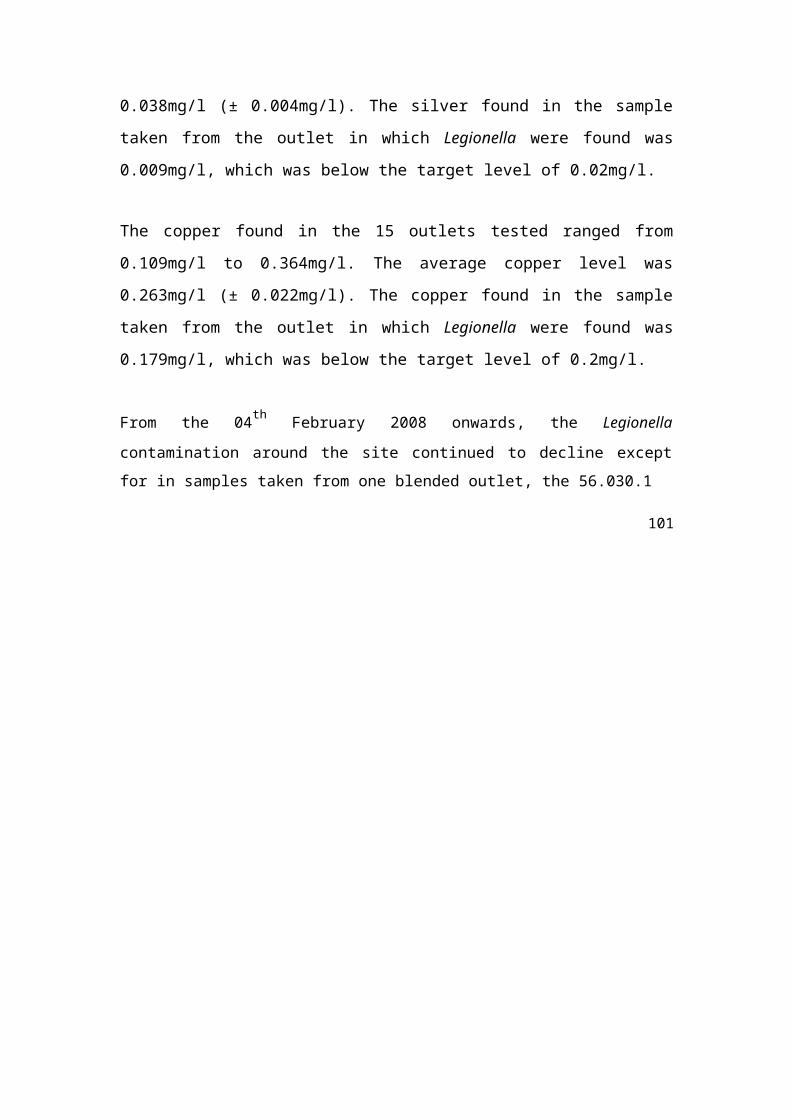
To summarize, this thesis set out to investigate microbial control using copper and
silver ionization systems.
The results demonstrated that the temperature regime as described in the ACoP (L8)
and the HTM 04-01 documents, of obtaining above 50°C after a 1 minute run of hot
outlets and below 20°C after a 2 minutes run of cold outlets, which was the Legionella
sole control modality applied to the water systems of 10 hospitals in the UK, did not
achieve complete control of Legionella. Legionella were not completely controlled at
hot outlets at which temperatures were maintained above 50°C and also not at cold
outlets at which temperatures were maintained below 20°C. A major issue was seen
when the temperature regime was applied in the hospitals studied because
temperatures needed to be kept at most outlets below 46°C to avoid scalding. The
results of the samples taken from outlets at which hot water was deliberately blended
by mixing valves with cold water demonstrated that a considerable number of blended
outlets were contaminated with Legionella.
Legionella were also not completely controlled in the copper and polyethylene rigs,
designed to simulate a typical hot water system of a small UK hospital, in which water
is stored, heated, and circulated. Furthermore, the results of the copper and
polyethylene rigs, in which temperatures were deliberately maintained below 46°C, to
simulate blended water, demonstrated that Legionella actually proliferated at these
temperatures.
On the other hand, the results of the samples taken from the hospitals demonstrated
that substantial Legionella control was maintained by copper levels ranging from
0.151mg/l to 0.539mg/l and silver levels ranging from 0.021mg/l to 0.043mg/l, and in
the presence of chloride concentrations ranging from 8.4mg/l to 60.7mg/l, phosphorus
concentrations ranging from 191µg/l to 2100µg/l, and a pH ranging from 6.9 to 8.5.
Legionella were also substantially controlled in the copper and polyethylene rigs to
which copper and silver ionized water was added daily for approximately 3 months.
Surprisingly, the results of the studies with copper rigs A and B did not demonstrate
the superior biocidal action of copper. However, the Robbins device results of the
brushed copper, polyethylene and rubber discs did show greater bacterial growth on
rubber and polyethylene than on copper.
Page 211 of 229
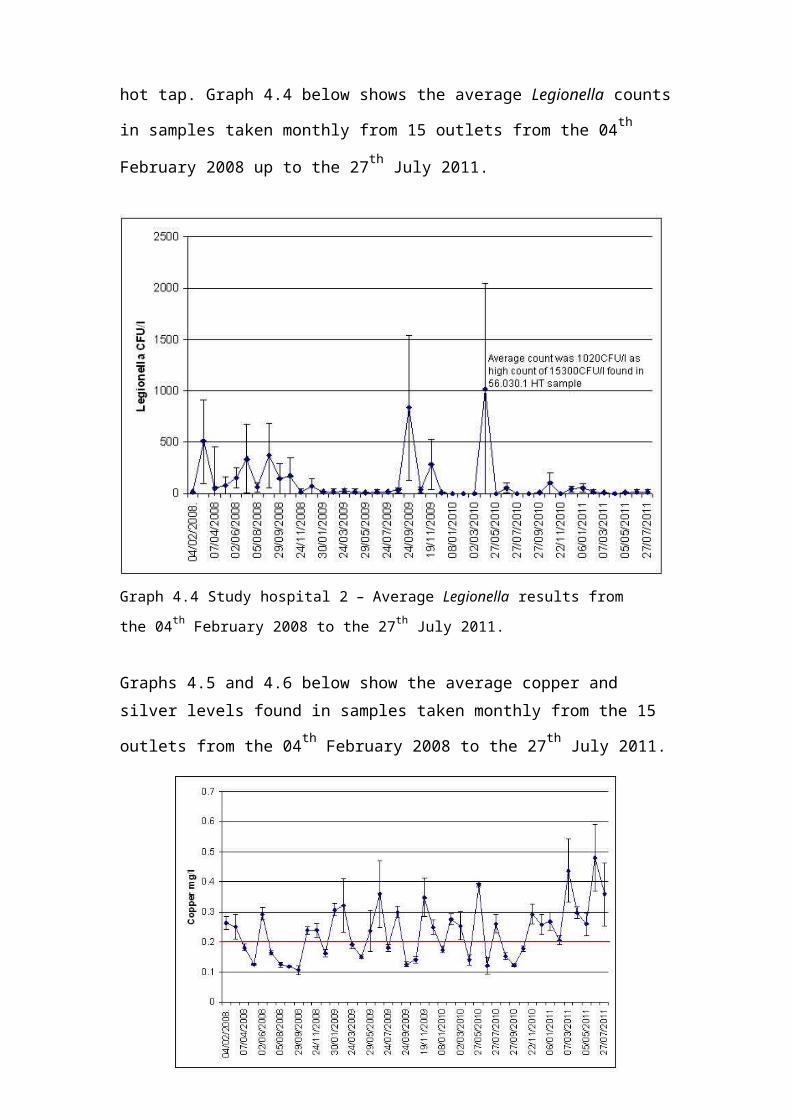
References
Abu Kwaik, Y. L.Y. Gao, O.S. Harb, and B.J. Stone. 1997. Transcriptional regulation
of the macrophage-induced gene (gspA) of Legionella pneumophila and phenotypic
characterization of a null mutant. Mol Microbiol. 24(3):629-642.
Antopol, S.C., and P.D. Ellner. 1979. Susceptibility of Legionella pneumophila
to ultraviolet radiation. Appl. Environ. Microbiol. 38(2):347-348.
Atlas, R.M.. 1999. Legionella: from environmental habitats to disease
pathology, detection and control. Environmental Microbiology. 1(4):283-293.
Barbaree, J.M. 1991. Legionnaires’ disease: Factors affecting the transmission of
Legionella species from aerosol-emitting equipment to people. ASHREA Journal.
33:38-42.
Barbeau, J., C. Gauthier, and P. Payment. 1998. Biofilms infectious agents, and dental
unit waterlines: A review. Can J Microbiol. 44: 1019-1028.
Barker, J., M.R.W. P. Brown, P. J. Collier, and P. Gilbert. 1992. Relationship between
Legionella pneumophila and Acanthamoeba polyphaga: Physiological status and
susceptibility to chemical inactivation. Applied and Environmental Microbiology.
58:2420-2425.
Bedford, B. 2003. Toxicity of copper and silver. M.Sc.Thesis Cranfield University
Institute of Bioscience and Technology.
Belyi, Y. 1999. Intracellular parasitism and molecular determinants of Legionella
virulence. Int Microbiol. 2(3):145-154.
Berk, S.G., N. Udin, M.B. Farone, K.S. Redding, E. Williams, J.H. Gunderson, A.L. Farone, A.L. Newsome, R.A. Johnson, and B.J. Hayes. 2005. Cooling Towers – ‘hot
spots’ for emerging pathogens? 6th International Conference on Legionella, Chicago.
Bird, T.L. 1987. Corrosion of mild steel in ozonised air-conditioning cooling water. U.K. Electricity Council. Capenhurst Research Memorandum ECRC/M2181 (Job No.
0203).
Biurrun, A., L. Caballero, C. Pelaz, E. Leon, and A. Gago. 1999. Treatment of a
Legionella pneumophila colonized water distribution system using copper-silver
ionization and continuous chlorination. Infect. Control. Hosp. Epidemiol. 20:426-428.
Blanc, D.S., P. Carrara, G. Zanetti, and P. Francioli. 2005. Water disinfection with
ozone, copper and silver ions, and temperature increase to control Legionella: seven
years of experience in a university teaching hospital. J. Hosp. Infect. 60:69-72.
Borella, P. M.T. Montagna, V. Romano-Spica, S. Stampi, C. Stancanelli, and M.
Riassi. 2004. Legionella infection risk from domestic hot water. Emerg Infect Dis.
Page 212 of 229

10:457-64.
Bornstein, N.M., D. Marmet, M. Surgot, M. Nowicki, H. Meugnier, J. Fleurette, E.
Ageron, P. Grimont, W.L. Thacker, R.F. Benson, and D.J. Brenner. 1989. Legionella
gratiana sp. nov. isolated from French spa water. Research in Microbiology. 140:541-
552.
Brabender, W., D. R. Hinthorn, M. Asher, N. J. Lindsey, and C. Liu. 1983. Legionella
pneumophila wound infection. Journal of the American Medical Association.
250:3091–3092.
Bragg, P.D., and D.J. Rainnie. 1974. The effect of silver ions on the respiratory
chains of Escherichia coli. Can. J. Microbiol. 20:883.
Breiman, R.F., W. Cozen, B.S. Fields, T.D. Mastro, S.J. Carr, J.S. Spika, and L.
Mascola. 1990. Role of air-sampling in an investigation of an outbreak of
Legionnaires' disease associated with exposure to aerosols from an evaporative
condenser. J Infect Dis. 161(6):1257-1261.
Brenner, D.J., A. G. Steigerwalt, G. W. Gorman, H. W.Wilkinson, W. F. Bibb, M.
Hackel, R. L. Tyndall, J. Campbell, J. C. Feeley, W. L. Thacker, P. Skaliy, W. T.
Martin, B. J. Brake, B. S. Fields, H. V. McEachern, and L. K. Corcoran. 1985. Ten
new species of Legionella. Int. J. Syst. Bacteriol. 35:50-59.
Brenner, D.J. 1987. Classification of Legionellae. Semin Respir Infect. 2(4):190-205.
Bridges, K., A. Kidson, E.J. Lowbury, and M.D. Wilkins. 1979. Gentamicin- and
silver-resistant pseudomonas in a burns unit. Br. Med. J.1(6161):446-449.
Brieland, J.K., J.C. Fantone, D.G. Remick, M. LeGendre, M. McClain, and N.C.
Engleberg. 1997. The role of Legionella pneumophila-infected Hartmannella
vermiformis as an infectious particle in a murine model of Legionnaires’ disease.
Infect Immun 65: 5330-5333.
British Standard 7592:1992.
British Standard 6222:1999.
Building Services Research and Information Services (BSRIA). 1993. Application
guide AG 2/93. Water treatment for building services systems.Building Services
Research and Information Services (BSRIA) Technical notes TN6/96. 1996.
Ionisation water treatment for hot and cold water services.
Campbell, J., W.F. Bibb, M.A. Lambert, S. Eng, A.G. Steigerwalt, J. Allard, C.W.
Moss, and D.J. Brenner. 1984. Legionella sainthelensi: a new species of
Legionella isolated from water near Mt. St. Helens. Applied and Environmental
Microbiology. 47:369-373.
Page 213 of 229
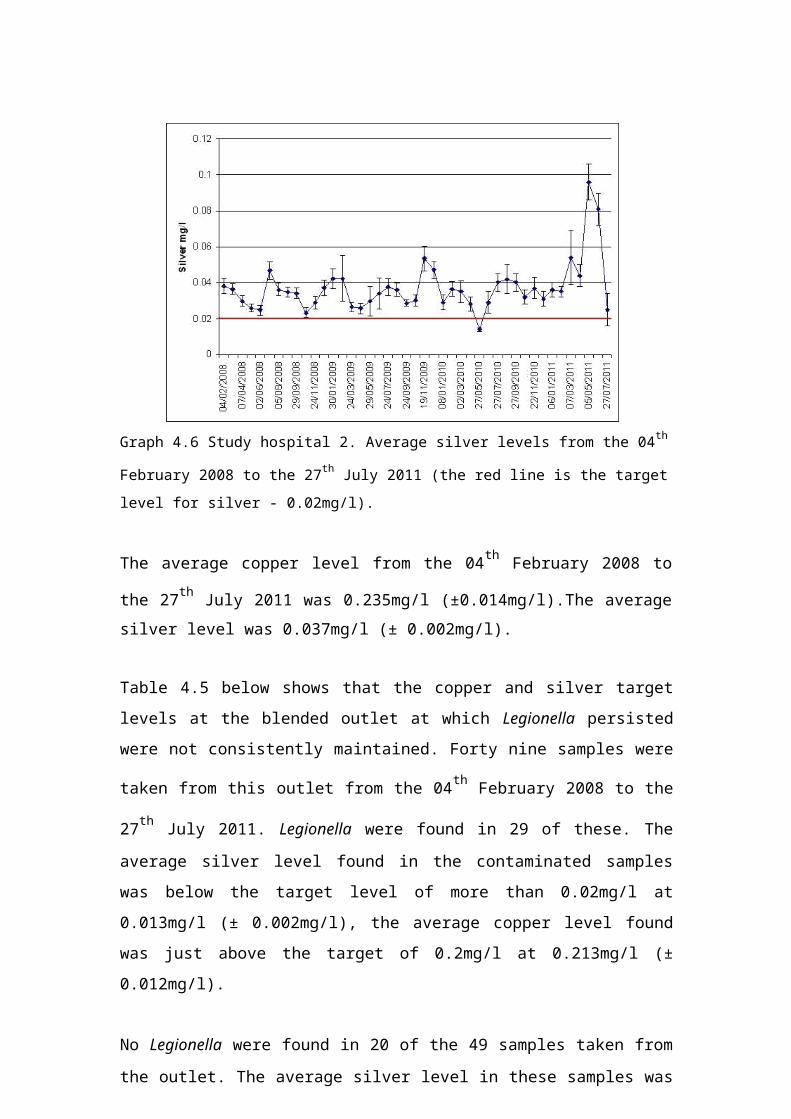
Camper, A.K. 1996. Factors limiting microbial growth in distribution systems:
Laboratory and pilot-scale experiments. Denver, CO, American Water Works
Association Research Foundation and American Water Works Association.
Cargill, K.L., B.H. Pyle, R.L. Sauer, and G.A. McFeters. 1992. Effects of culture
conditions and biofilm formation on the iodine susceptibility of Legionella
pneumophila. Can J Microbiol. 38(5):423-429.
Cassells, J.M., M.T. Yahya, C.P. Gerba, and J.B. Rose. 1995. Efficacy of a combined
system of copper and silver and free chlorine for inactivation of Naegleria fowleri
amoebas in water. Water Sciences and Technology 31:119-122.
Chen, Y.S., Y.E. Lin, Y.C. Liu, W.K. Huang, H.Y. Shih, S.R. Wann, S.S. Lee, H.C.
Tsai, C.H. Li, H.L. Chao, C.M. Ke, H.H. Lu, and C.L. Chang. 2008. Efficacy of point-
of-entry copper-silver ionisation system in eradicating Legionella pneumophila in a
tropical tertiary care hospital: implications for both hospitals contaminated with
Legionella in both hot and cold water. Journal of Hospital Infection. 68:152-158.
Chopra, I. 2007. The increasing use of silver-based products as antimicrobial agents: a
useful development or a cause for concern’? Journal of Antimicrobial
Chemotherapy.59:587-590.
Cirillo, J.D., S. Falkow, and L.S. Tompkins. 1994. Growth of Legionella pneumophila
in Acanthamoeba casterlanii enhances invasion. Infect Immun.62:3254-3261.
Colburne, J.S., D.J. Pratt, M.G. Smith, S.P. Fisher-Hoch, and D. Harper. 1984. Water
fittings as sources of Legionella pneumophila in a hospital plumbing system. Lancet
1:210-213.
Darelid, J., S Lofgren, E. Malmvall. 2002. Control of nosocomial Legionnaires’
disease by keeping the circulating hot water temperature above 55°C: experience from
a 10-year surveilland programme in a district general hospital. Journal Hospital
Infections.50:213-219
Declerck, P., J. Behets, J. Marginaenu, V. van Hoef, B de Keersmaecker, and F
Ollevier. 2009. Replication of Legionella pneumophila in biofilms of water
distribution pipes. Microbiological Research. 164(6):593-603.
Declerck, P, J. Bethets, V. van Hoef, and F. Ollevier. 2007. Detection of Legionella
pneumophila and some of its amoeba hosts in floating biofilms from anthropogenic
and natural aquatic environments. Water Res. 41:3159-3167
Den Boer, J.W., E.P. Yzerman, J. Schellekens, K.D. Lettinga, H.C. Boshuizen, J.E.
van Steenbergen, A. Bosman, S. Van den Hof, H.A. van Vliet, M.F. Peeters, R.J. van
Ketel, P. Speelman, J.L. Kool, and M.A. Conyn-van Spaendonck. 2002. A large
Page 214 of 229
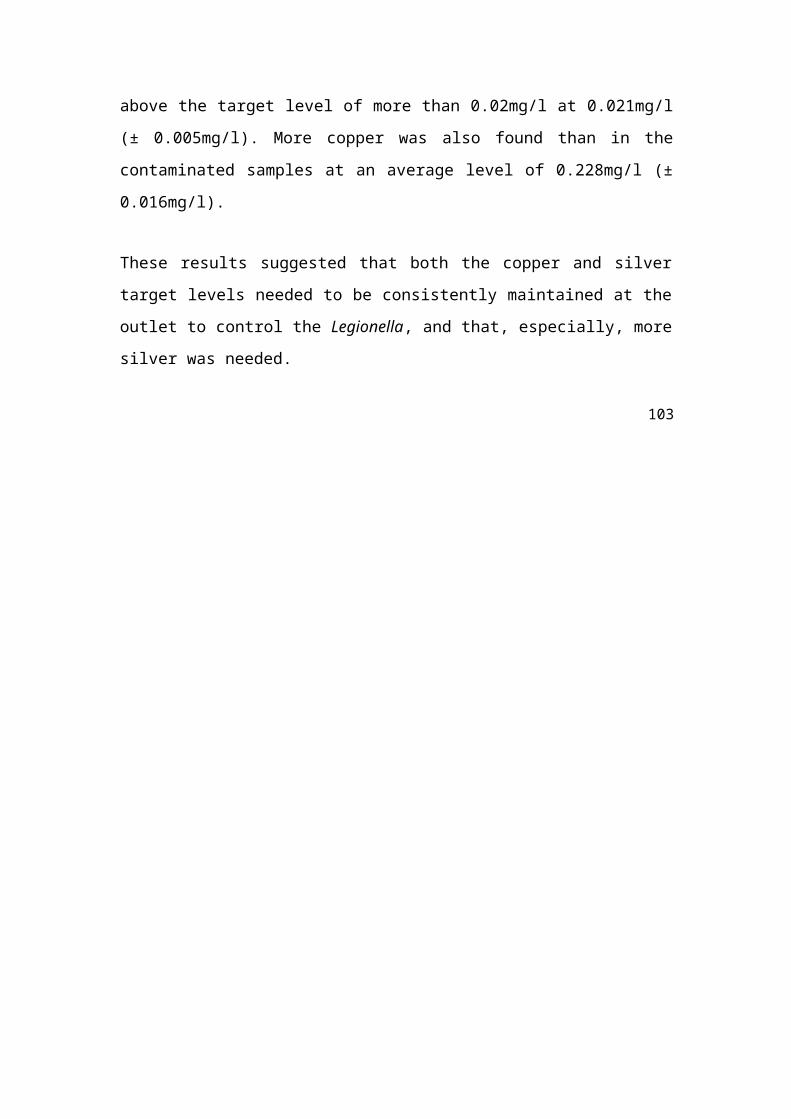
outbreak of Legionnaires’ disease at a flower show, the Netherlands, 1999. Emerg
Infect Dis. 8:37-43.
Dennis, P.J., D. Green, and B.P.C. Jones. 1984. A note on temperature tolerance of
Legionella. Journal of Applied Bacteriology. 56:349-350.
Dennis P J, and J.V. Lee. 1988. Differences in aerosol survival between pathogenic
and non-pathogenic strains of Legionella pneumophila serogroup 1. J. Appl. Bacteriol.
65:135-41.
Denyer, S.P., G.W. Hanlon, and M.C. Davies. 1993.. Mechanisms of microbial
adherence. Microbial biofilms: formation and control. S.P. Denyer, S.P. Gorman and
M. Sussman eds. Blackwell Scientific Publications. Technical series 30: 13-27.
Diederen, B.M.W., C.M.A. de Jong, I. Aarts, M.F. Peeters, A.B. van Gageldonk-
Lafeber, B. Wilbrink, and A. Van der Zee. 2005. No evidence of Legionella infection
in general practice patients presenting with acute respiratory infections in The
Netherlands. Clinical Microbiology and Infection. 11:410-142.
Donlan, R.M..2002. Biofilms: Microbial life on surfaces. Emerging Infectious
Diseases. 8(9):881-890.
Edelstein, P. H., R.E. Whittaker, R.L. Kreiling, and C.L. Howell. 1982. Efficacy of
ozone in eradication of Legionella pneumophila from hospital plumbing fixtures.
Applied and Environmental Microbiology. 44(6):1330-1334.
Edwards-Jones, V. 2009. The benefits of silver in hygiene, personal care and
healthcare. Letters in Applied Microbiology. 49:147-152.
Else, T.A., C.R. Pantle, and P.S. Amy. 2003. Boundaries for biofilm formation:
humidity and temperature. Appl. Environ. Microbiol. 69(8):5006-5010.
European Council Biocidal Products Directive (98/8/EC).
European Council Directive 98/83/EC.
EWGLINET – European Working Group for Legionella Infections. European
Surveillance Scheme.
Ezzeddine, H., C. van Ossel, M. Delmée, and G. Wauters. 1989. Legionella spp. In a
hospital hot water system: effect of control measures. Journal of Hospital Infection.
13:121-131.
Fang, G.D, V.L. Yu, and R.M. Vickers. 1989. Disease due to the Legionellaceae
(other than Legionella pneumophila). Histoerical, microbiological, clinical, and
epidemiological review. Meidcine Baltimore. 68(2):116-132.
Faris B, C. Faris, M. Shoushoe, and C. Heath. 2005. Legionellosis from Legionella
pneumophila serogroup 13. Emerging infectious Diseases. 11(9):1407-1411.
Page 215 of 229
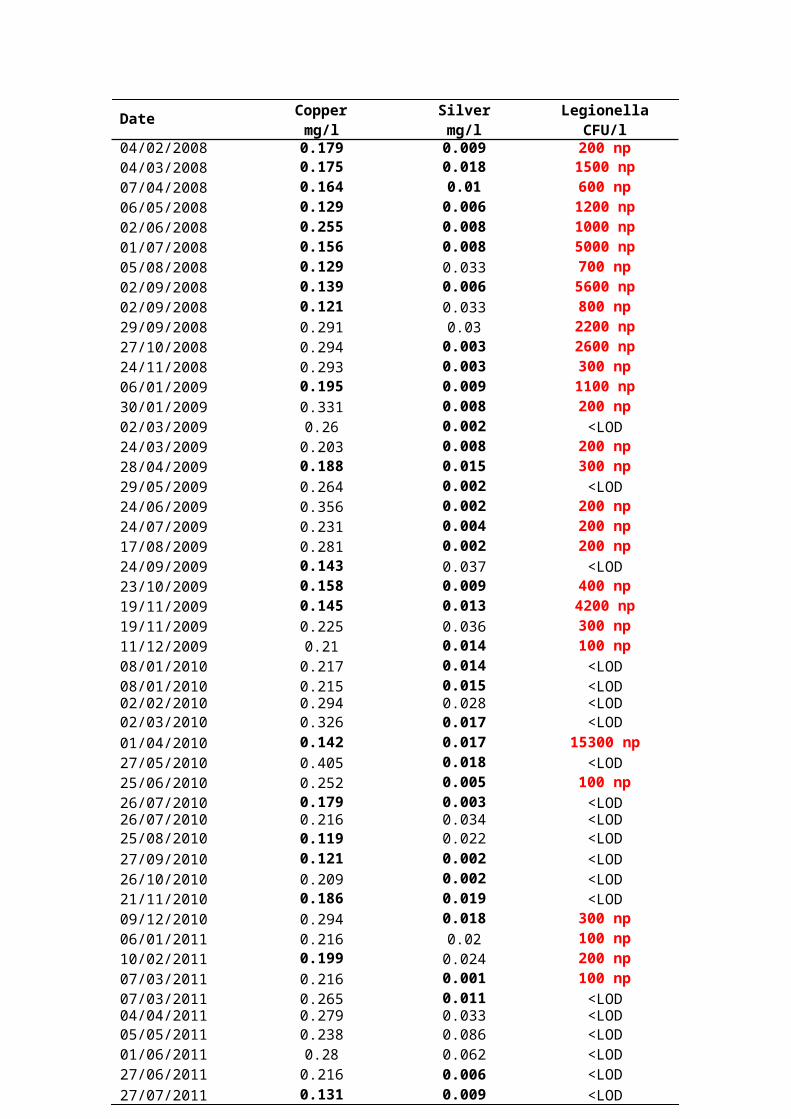
Fields, B.S., E.B. Shotts, J.C. Feeley, G.W. Gorman, and W.T. Martin. 1984.
Proliferation of Legionella pneumophila as an intracellular parasite of the ciliated
protozoan Tetrahymena pyriformis. Appl Environ Microbiol 47: 467-471.
Fields, B.S. 1996. The molecular ecology of legionellae. Trends Microbiol. 4:286-
290.
Fields B S, B.F. Benson, and R.E. Besser. 2002. Legionella and Legionnaires’
disease: 25 years of investigation. Clinical Microbiology Review. 15(3):506-526.
Fitzgeorge R B, S. Lever, and A. Baskerville. 1993. A comparison of the efficacy of
azithromycin and clarithromycin in oral therapy of experimental airborne
Legionnaires' disease. Journal of Antimicrobial Chemotherapy 31(E):171-176.
Flemming, H.C., and J. Wingender. 2001. Relevance of microbial extracellular
polymeric substances (EPSs)–Part I: Structural and ecological aspects. Water Sci.
Technol. 43:1-8.
Fliermans, C.B., W.B. Cherry, L.H. Orrison, S.J. Smith, D.L. Tison, and D.H. Pope.
1981. Ecological distribution of Legionella pneumophila. Applied and Environmental
Microbiology. Jan 1981:9-16.
Ford, T.J.E. 1991. Microbiological safety of drinking water: United States and global.
Environmental Health Perspectives. 107 (suppl.1) 1999. Water treatment for the
control of micro-organisms in cooling towers – some practical experience. Australian
Institute of Refrigeration Air-conditioning and Heating Journal. 45:42-47.
Franzin, L, D. Cabodi, and C. Fantino. 2002. Evaluation of the efficacy of ultraviolet
irradiation for disinfection of hospital water contaminated by Legionella. Journal of
Hospital Infection. 51:269-274.
Gaillard, J.F., and S.M. Webb. 1997. Biogeochemical aspects of metal microbes
interactions. Proceedings of the 5th International Conference, Transport, Fate and Effects of Silver in the Environment:77-86. Garcia-Fulgueiras, A., C. Navarro, D. Fenoll, J. Garcia, P. Gonzales-Diego, T.
Jimenez-Bunuelas, M. Rodriguez, R. Lopez, F. Pacheco, J. Ruiz, M. Segovia, B.
Balandron, and C. Pelaz. 2003. Legionnaires’ disease outbreak in Murcia, Spain.
Emerg Infect Dis. 9:915-921.
Geldreich, E.E., and M. Le Chevalier.1999. Microbiological quality control in
distribution systems. Water Quality and Treatment (5th ed.). Chapter 18:18.1-18.49. Letterman, R.D. (ed). McGraw-Hill, Inc. New York, NY.
Glick, T.H., M.B. Gregg, B. Berman, G. Mallison, W. Rhodes, and I. Kassanoff.
1977. Pontiac Fever an epidemic of unknown etiology in a health department:1.
Page 216 of 229
Clinical and epidemiologic aspects. American Journal of
Epidemiology.104(2):149-160.
Grass, G., C. Rensing, and M. Solioz. 2011. Metallic copper as an antimicrobial
surface. Appl. Environ. Microbiol. 77(5):1541-1547.
Greenberg D, C. C. Chiou, R. Famigilleti, T.C. Lee T.C., and V.L. Yu. 2006. Problem
pathogens: paediatric legionellosis implications for improved diagnosis. Lancet Infect
Dis. 6(8): 529-35.
Groothuis, D.G., H.R. Veenendaal, and H.L. Dijkstra. 1985. Influence of temperature
on the number of Legionella pneumophila in hot water systems. Journal Applied
Bacteriology. 59(6):529-36.
Gupta, A., K. Matsui, J.F. Lo, and S. Silver. 1999. Molecular basis for resistance to
silver cations in Salmonella. Nature Medicine. 5(2):183-188.
Gupta, A., L. Phung, D.Taylor, and S. Silver. 2001. Diversity of silver resistance
genes in IncH incompatibility group plasmids. Microbiology.147:3393-3402.
Haas, C.N., M.A. Meyer,and M.S. Palle. 1983. The ecology of acid-fast organisms in
water supply, treatment and distribution systems. J. Amer. Water Works Assoc.
75:139-144.
Haefeli, C, C. Franklin, and K. Hardy., 1984. Plasmid-determined silver resistance in
Pseudomonas stutzeri isolated from a silver mine. Journal of Bacteriology.70:389-
392.
Hamilton, E., D.V. Seal and J. Hay. 1996. Comparison of chlorine and chlorine
dioxide disinfection for control of Legionella in a hospital water supply.
Journal Hospital Infection. 32(2):156-160.
Harris, A., and M. Rendell. 1999. The elimination of Legionella in local hot and
cold water systems using a novel chlorine dioxide technique. Water Conference
Official Procedures Engineering Society of Western Pennsylvania, Pittsburgh.
Hill, D.W., C.E. Boyes, and I.K. Hosein. 2000. Continuous chlorine dioxide dosing of hospital hot water system following a case of nosocomial aspiration Legionella
pneumonia. 5th International Conference on Legionella, Ulm, Germany.
Holland/Oezel Robert Koch Institute.
Hood, J., G. Cheape, A. Mead, and E. Curran. 2000. Six years’ experience with
chlorine dioxide in control of Legionella pneumophila in the potable water supply
of Glasgow Royal Infirmary. American Journal Infection Control. 28:1:86.
International Standard 11731:1998.
Page 217 of 229
Jass, J., J.W. Costerton, and H.M. Lappin-Scott. 1995. Assessment of a chemostat-
coupled modified Robbins device to study biofilms. Journal of Industrial
Microbiology. 15:283-289.
Kandlikar, S.G, S. Joshi, and S. Tian. 2001. Effect of channel roughness on heat transfer and fluid flow characteristics at low Reynolds numbers in small diameter
tubes. Proceedings of NHTC’01 35th National Heat Transfer Conference.
NHTC01-12134. 1-10.
Kaur, P. and D. Vadehra. 1986. Mechanism of resistance of silver ions in Klebsiella
pneumoniae. Antimicrobial Agents and Chemotherapy. 74:165-167.
Keenahan, T. 1990. Overview of water treatment. In Proceedings of the Australian
Institute of Refrigeration Air-conditioning and Heating Seminar – What type of Water
Treatment? Melbourne. 7:1-20.
Keevil, C.W., A.B. Dowsett, and J. Rogers. 1993. Legionella biofilms and their
control. Microbial biofilms: Formation and control. S.P. Denyer, S.P. Gorman and M.
Sussman eds. Blackwell Scientific Publications. Technical series 30: 201-215.
Kilvington, S. and J. Price. 1990. Survival of Legionella pneumophila within cysts of
Acanthamoeba polyphaga. Journal of Applied Bacteriology. 68:519-525.
Kool, J.L., A.E. Fiore, C.M. Kioski, E.W. Brown, R.F. Benson, J. M. Pruckler, C.
Glasby, J. C. Butler, G.D. Cage, J. C. Carpenter, R. M.Mandel, B. England, and R.F.
Breiman. 1998. More than 10 years of unrecognized nosocomial transmission of
Legionnaires’ disease among transplant patients. Infection Control and Hospital
Epidemiology. 19:898–904.
Kuchta, J.M., J.S. Navratil, M.E. Shepherd, R.M. Wadowsky, J.N. Dowling, S.J.
States, and R.B. Yee. 1993. Impact of chlorine and heat on the survival of
Hartmanella vermiformis and subsequent growth of Legionella pneuophila. Applied
and Environmental Microbiology. 59(12):4096-4100.
Kuchta, J.M. 1995. Copper-Silver Electrode Ionization for Disinfection of Legionella
pneumophila and Hartmannella vermiformis. Amer. Soc. Microbiol. Abstract Q293:
451.
Kuiper, M.W., B.A. Wullings, A.D.L. Akkermans, R.R. Beumer, and D. van der
Kooij. 2004. Intracellular proliferation of Legionella pneumophila in Hartmannella
vermiformis in aquatic biofilms grown on plastized polyvinyl chloride. Applied and
Environmental Microbiology. 70(11):6826-6833.
Page 218 of 229

Kumar, S., D. Atray, D.Paiwal, G. Balasubramanyam, P. Duraiswamy, and S.
Kulkarni. 2010. Dental unit waterlines: Source of contamination and cross-infection.
J. Hosp Infect. 74:99-111.
Kusnetsov, J., E. Iivanainen, N. Elomaa, O. Zacheus, and P.J. Martikainen: 2001.
Copper and silver ions more effective against Legionellae then against Mycobacteria
in a hospital warm water system. Wat. Res. 35(17):4217-4225.
Kusnetsov, J., E. Torvinen, O. Perola, T. Nousiainen and M.L. Katila. 2003.
Colonization of hospital water systems by Legionellae, Mycobacteria and other
heterotrophic bacteria potentially hazardous to risk group patients. Apmis 111:546-56.
Landeen, L.K., M.T. Yahya, and C.P. Gerba. 1989. Efficacy of copper and silver ions
and reduced levels of free chlorine in inactivation of Legionella pneumophila.
Applied and Environmental Microbiology. 55:3045 –3050.
Le Chevallier, M.W., C.D. Cawthon, and R.G. Lee. 1988. Factors promoting
survival of bacteria in chlorinated drinking water supplies. Appl. Environ. Microbiol.
54:649-654.
Lee, J V, and A.A. West. 1991. Survival and growth of Legionella species in the
environment. Journal of Applied Bacteriology. Symposium Supplement 70:121S-
129S.
Lee, J.V., J.L. Crowley, A. Colville, and A. Kirby. 1994. The use of copper and silver
ions for the control of Legionella species in domestic hot water systems. PHLS Water
and Environmental Unit and Estates Department. University Hospital Queens Medical
Centre, Nottingham.
Lin, Y.S.E., R.D. Vidic, J.E. Stout, and V.L. Yu. 1996. Individual and combined
effects of copper and silver ions on inactivation of Legionella pneumophila. Wat. Res.
30(8):1905-1913.
Lin, Y.E., J. E Stout, V.L. Yu, and R.D. Vidic. 1998. Disinfection of Water
Distribution Systems for Legionella. Seminars in Respiratory Infections.
13(2):147-159.
Lin, Y.E., R.D. Vidic, J.E. Stout, and V.L. Yu. 2002. Negative effect of high pH on
biocidal efficacy of copper and silver ions in controlling Legionella pneumophila.
Applied and Environmental Microbiology. 68:2711-2715.
Lin, Y.E., and R.D. Vidic. 2005. Possible phosphate interference with copper-silver
ionization for Legionella control. The Hospital Infection Society. Letters to editor.
Doi:10.1016/j.jhin.
Page 219 of 229
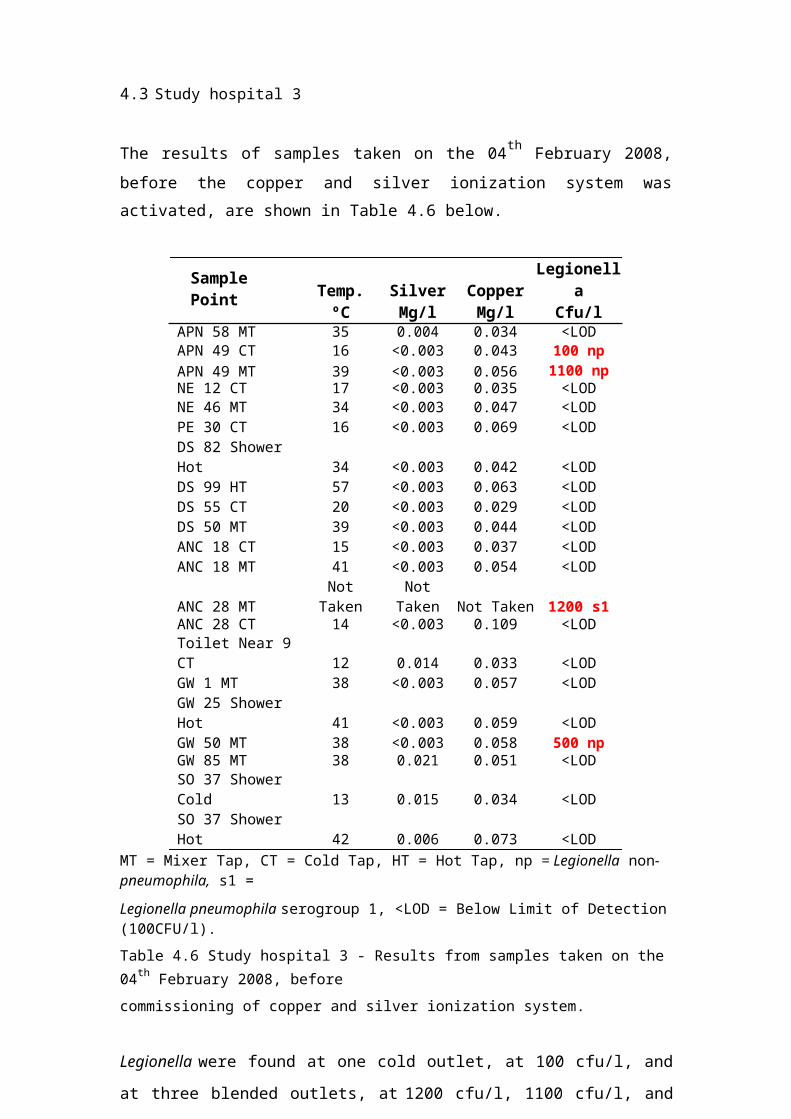
Lin, Y.E., J.E. Stout, and V.L. Yu. 2011. Controlling Legionella in hospital drinking
water: An evidence-based review of disinfection methods. Infection Control and
Hospital Epidemiology. 32(2):166-173.
Liu, Z., J.E. Stout, L. Tedesco, M. Boldin, C. Hwang, W.F. Diven, and V.L. Yu.
1994. Controlled evaluation of copper-silver ionization in eradicating Legionella from
a hospital water distribution system. J. Infectious Disease. 169:919-922.
Liu, Z., J.E. Stout, M. Boldin, J. Rugh, W.F. Diven, and V.L. Yu. 1998. Intermittent
use of copper-silver ionization for Legionella control in water distribution systems: A
potential option in buildings housing individuals at low risk of infection. Clinical
Infectious Diseases. 26:138-140.
Liu, Z., Y.E. Lin, J.E. Stout, C.C. Hwang, R.D. Vidic, and V.L. Yu. 2006 Effect of
flow regimes on the presence of Legionela within biofilm of a model plumbing
system. J. Appl. Microbiol. 101:437-442.
Lo Presti, F., S. Riffard, F. Vandenesch, M. Reyrolle, E. Ronco, P. Ichai, and J.
Etienne. 1997. The first clinical isolate of Legionella parisienis, from a liver
transplant patient with pneumonia. J Clin Microbiol. 35(7):1706-1709.
Mahbubani, M.H., A.K. Bej, R. Miller, L. Haff, J. DiCesare, and R.M. Atlas. 1990.
Detection of Legionella with polymerase chain reaction and gene probe methods.
Mol. Cell Probes. 4:175-187.
Makin, T., and C.A. Hart. 1992. The efficacy of ultraviolet radiation for eradicating L.
pneumophila from a shower. Abstracts of papers presented at the 1992 International
Symposium on Legionella, Orlando, Florida: American Society for Microbiology. 11.
Makin, T. 1998. Control of Legionellae in domestic water systems and potential
energy savings resulting from control of Legionellae with chlorine dioxide. 15th IFHE
Congress, Edinburgh, UK.
Mampel, J., T. Spirig, S.S. Weber, J.A. Haagensen, S. Molin, and H. Hilbi. 2006,
Planktonic replication is essential for biofilm formation by Legionella pneumophila in
a complex medium under static and dynamic flow conditions. Appl. Environ.
Microbiol. 72:2885-2895.
Marrie, T.T., S. Macdonald, and K. Clarke. 1991. Nosocomial Legionnaires’ disease.
Lessons from a four year prospective study. Am J Infect Control.19:79-85. Marston,
B.J., H.B. Lipman, and R.F. Breiman.1994. Surveillance for Legionnaires’ disease.
Risk factors for morbidity and mortality. Arch. Intern. Med. 154:2417-2422.
Mathys, W., M.C. Deng, J. Meyer, and E. Junge-Mathys. 1999. Fatal nosocomial
Legionnaires’ disease after heart transplantation: Clinical, epidemiology and
Page 220 of 229
prevention strategies for the highly immunocompromized host. J Hosp Infect. 43:239-
248.
Mathys, W., C.P. Hohmann, and E. Junge-Mathys. 2002. Efficacy of copper-silver
ionization in controlling Legionella in a hospital hot water distribution system: A
German experience. Marre R., Y.A. Kwaik, C. Bartlett, eds. Legionella. Washington,
DC: American Society for Microbiology:419-424.
McDonnell, G, and A.D. Russell. 1999. Antiseptics and disinfectants activity, action,
and resistance. Clin. Microbiol. Rev. 12:147-179.
McHugh, S.L., R.C. Moellering, C.C Hopkins, and M.N. Swartz. 1975. Salmonella
typhimurium resistant to silver nitrate, chloramphenicol, and ampicillin. Lancet I:235-
240.
Memish, Z.A., C. Oxley, J. Contant, and G.E. Garber. 1992. Plumbing system shock
absorbers as a source of Legionella pneumophila. Am J Infect Control. 20:305-309.
Metcalf and Eddy, Inc. 1991. Wastewater Engineering. Treatment, Disposal and
Reuse. Third edition. McGraw-Hill, Inc.
Michel, R., K.D. Muller, R. Amann, and E.N. Schmid. 1998. Legionella-like slender
rods multiplying within a strain of Acanthamoeba sp isolated from drinking water.
Parasitol Res. 84: 84-88.
Microbiology Third Edition, L.M. Prescott, J.P. Harley, and D.A. Klein. 1996. Wm.
C. Brown Publishers.
Mietzner, S., R.C. Schwille, A. Farley, E.R. Wald, J.H. Ge, S.J. States, T. Libert, and
R.M. Wadowsky. 1997. Efficacy of thermal treatment and copper-silver ionization for
controlling Legionella pneumophila in high-volume hot water plumbing systems in
hospitals. The Association for Professionals in Infection Control and Epidemiology,
Inc. 17(46):813-866.
Montagna, M.T., C. Napli, D. Tato, G. Spilotros, C. Barbuti, and S. Barbuti. 2006.
Clinical-environmental surveillance of legionellosis an experience in Southern Italy.
Eur J Epidemiol. 21:325-31.
Morton, L.H., D.I. Greenway, C.C. Gaylarde, and S.B. Surman. 1998.
Consideration of some implications of the resistance of biofilms to biocides. Int.
Biodeterior. Biodegr. 41:247-259.
Muder, R.R., V.L. Yu, J.K. McClure , F.J. Kroboth, S.D. Kominos, and R.M. Lumish.
1983. Nosocomial Legionnaires’ disease uncovered in a prospective pneumonia study.
Implications for underdiagnosis. The Journal of the American Medical Association.
249:3184-3188.
Page 221 of 229
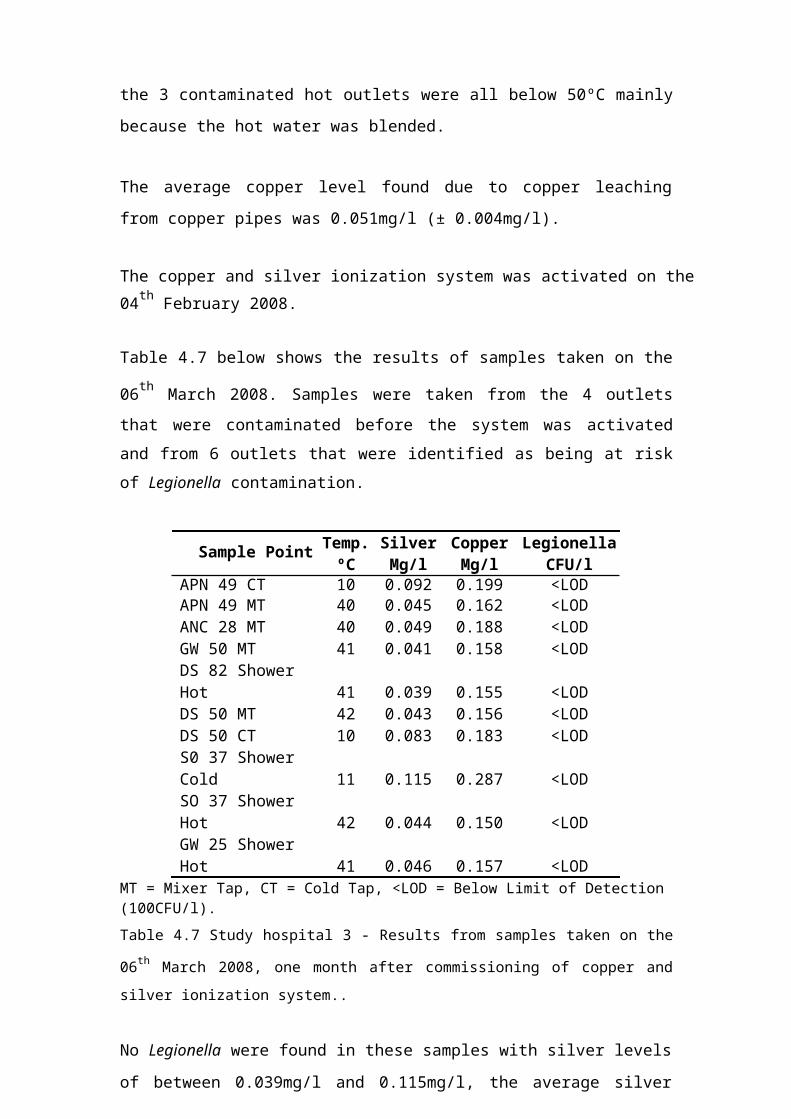
Muder, R.R. 1998. Pneumonia in residents of long-term care facilities .
Epidemiology, etiology, management, and prevention. Am J. Med. 105:319-330.
Muller, H.E. 1981. The thermic stability for Legionella pneumophila. Zentralblad
Bakteriol. Mikrobiol. Hyg. Abt. 1 Orig. B. 172:524-527.
Muraca, P. J. Stout, and V. Yu. 1986. Comparative assessment of chlorine, heat,
ozone, and UV light for killing Legionella pneumophila within a model plumbing
system. Applied and Environmental Microbiology. 53:447-453.
Murga, R., T.S. Forster, E. Brown, J.M. Pruckler, B.S. Fields, and R.M. Donlan.
2001. Role of biofilms in the survival of Legionella pneumophila in a model potable
water system. Microbiology. 147:3121-3126.
Nahapetian, K., O. Challemel, D. Beurtin, S. Dubrou, P. Gounon, and F. Squinazi.
1991. The intracellular multiplication of Legionella pneumophila in protozoa from
hospital plumbing systems. Res. Microbiol. 142(6):677-85.
Newsome, D H. 2001. Legionella in the environment. Foundation for Water Research,
UK.
Nguyen, M.H., J.E. Stout, and V.L. Yu. 1991. Legionellosis. Infectious Disease
Clinics North America. 5(3):561-584.
Oesterholt, F.I., 2006. Evaluation of practicle tests with alternative techniques for the
prevention of Legionella. Copper/silver ionization. KIWA N.V., Water Research,
Nieuwegein, Holland.
O’Mahony, M.C., R.E. Stanwell-Smith. H.E. Tillett, D. Harper, J.G. Hutchinson, I.D.
Farrell, D.N. Hutchinson, J.V. Lee, P.J. Dennis, and H.V. Duggal. 1990. Public Health
Laboratory Service Communicable Disease Surveillance Centre, London. The
Stafford outbreak of Legionnaires’ disease. Epidemiol Infections. 104(3):361-380.
Palmer, C.J., Y.L. Tsai, C. Paszko-Kolva, C. Mayer, and L.R. Sangermano.
1993. Detection of Legionella species in sewage and ocean water by polymerase
chain reaction direct fluorescent antibody and plate culture methods. Appl
Environ Microbiol. 59:3618-3624.
Pavey, J.D., and M. Roper. 1998. Chlorine dioxide water treatment for hot and cold
water services. The Building Services Research and Information Association,
Bracknell, Berkshire, UK.
Perola, O., J. Kauppinen, J. Kutnetsov, U.M. Karkkainen, P.C. Luck, and M.L. Katila.
2005. Persistent Legionella pneumophila colonization of a hospital water supply
efficacy of control methods and a molecular epidemiological analysis. APMIS. 113:
45-53.
Page 222 of 229
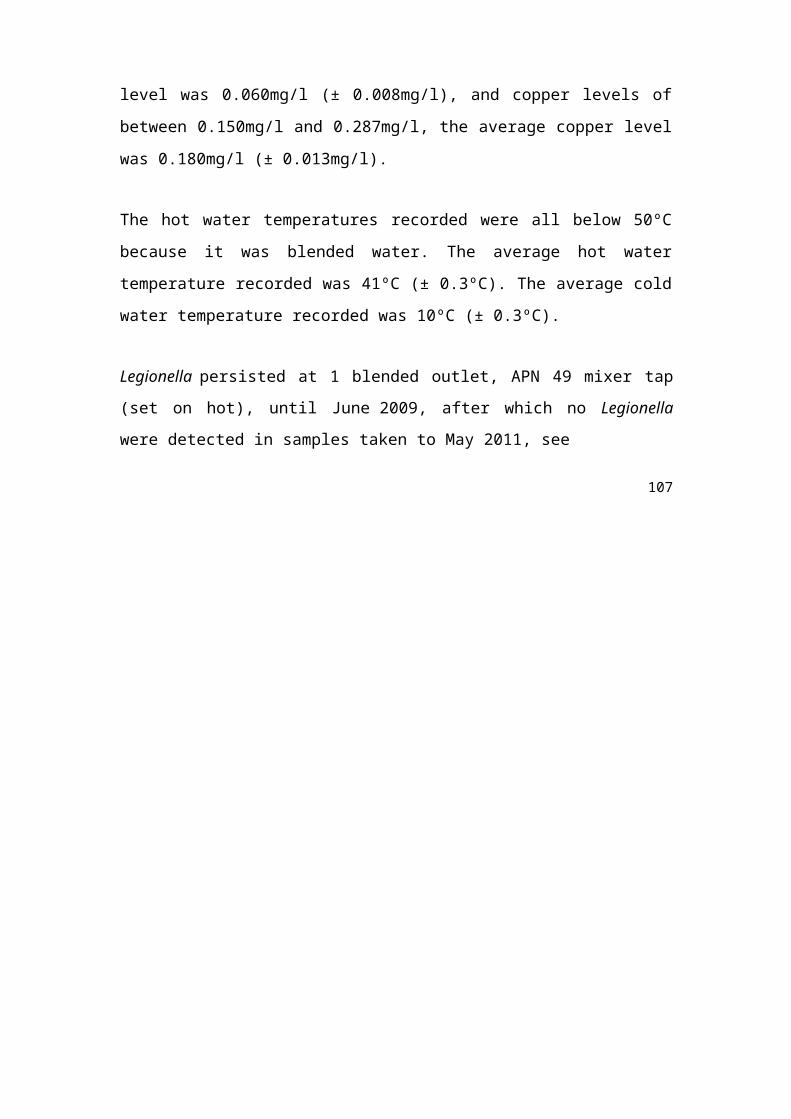
Pravinkumar, S.J., G. Edwards, D. Lindsay, S. Redmond, J. Stirlings, R. House, J.
Kerr, E. Anderson, D. Breen, O. Blatchford, E. McDonald, and A. Brown. 2010. A
cluster of Legionnaires’ disease caused by Legionella longbeachae linked to potting
compost in Scotland 2008-2009. Eurosurveillance. 15(8).
Rangel-Frausto, M.S., P. Rhomberg, R.J. Hollis, M.A. Pfaller, R.P. Wenzel, C.M.
Helms, and L.A. Herwaldt. 1999. Persistence of Legionella pneumophila in a
hospital’s water system: A 13-year survey. Infection Control and Hospital
Epidemiology. 20(12):793-797.
Rathore, M.H., and A. Alvarez. 2009. Legionella infection. Department of Pediatrics.
University of Florida College of Medicine at Jacksonville. Emedicine.medscape.com.
Renner, L.D., and D.B. Douglas. 2011. Physiochemcial regulation of biofilm
formation. Materials Research Society Bulletin. 36:1-9.
Research meeting. University of Plymouth. 2009. Solutions to reduce the risk of
biofilms and associated pathogens at hospital hand wash stations.
Reynaga, E., M. Garcia-Nunez, and M. Pedro-Botet. 2001. Copper-silver ionization
system water disinfection, and nosocomial legionellosis. Presented at the 41st Annual Interscience Conference on antimicrobial agents and chemotherapy. December 16-19, 2001. Chicago.
Ricketts, K., C.A. Joseph, and R. Yadav. 2010. Travel-associated Legionnaires
disease in Europe in 2008. www.eurosurveillance.org.
Rogers, J., A. Dowsett, P. Dennis, J. Lee, and C. Keevil. 1994. Influence of plumbing
materials on biofilm formation and growth of Legionella pneumophila in potable
water systems. Applied Environmental Microbiology. 60:1842-1851.
Rohr, U., S. Weber, R. Michel, F. Selenka, and M. Wilhelm. 1998. Comparison of
free-living amoeba in hot water systems of hospitals with isolates from moist sanitary
areas by identifying genera and determining temperature tolerance. Appl. Environ.
Microbiol. 64(5):1822-1824.
Rohr, U., M. Senger, F. Selenka, R. Turley, and M. Wilhelm. 1999. Four years of
experience with silver-copper ionization for control of Legionella in a German
university hospital hot water plumbing system. Clinical Infectious Diseases. 29:1507-
1511.
Rohr, U., S. Weber, F. Selenka, and M. Wilhelm. 2000. Impact of silver and copper
on the survival of amoeba and ciliated protozoa in vitro. Int J Hyg Environ Health.
203:87-89.
Page 223 of 229
Rowbottom, T.J. 1980. Preliminary report on the pathogenicity of Legionella
pneumophila for freshwater and soil amoebae. J Clin Pathol. 33:1179-1183.
Rowbottom, T.J. 1986. Current views on the relationships between amoebae,
Legionellae and man. Israel Journal of Medical Sciences. 22:678-689. Rusin,
P.A., J.B. Rose, C.N. Haas, and C.P. Gerba. 1997. Risk assessment of
opportunistic bacterial pathogens in drinking water. Rev Environ Contamination
Toxicol.152:57-83.
Saby, S., A. Vidal, and H. Suty. 2005. Resistance of Legionella to disinfection in hot
water distribution systems. Water Science & Technology. 52(8):15-28.
Salvatorelli, G., S. Medici, G. Finzi, S. De Lorenzi, and C. Quarti. 2005.
Effectiveness of installing an antibacterial filter at water taps to prevent Legionella
infections. J. Hosp. Infect. 61:270-271.
Sauer, K., A.K. Camper, G.D. Ehrlich, J.W. Costerton, and D.G. Davies. 2002.
Pseudomonas aeruginosa displays multiple phenotypes during deleopment as a
biofilm. J Bacteriol. 184:1140-1154.
Schofield, G.M., and R. Locci. 1985. Colonization of components of a model hot
water system by Legionella pneumophila. Journal of Applied Bacteriology. 58:151-
162.
Seenivasan, M. H., V.L. Yu, and R.R. Muder. 2005. Legionnaires’ disease in long-
term care facilities: Overview and proposed solutions. Journal American Geriatrics
Society. 53:875-880.
Selenka, F., U. Rohr, and M. Volker. 1995. Studies on reducing the Legionella load of
a hospital warm-water system by using copper and silver ionization. Hygiene
Medicine. 20:292-302
Sheenan, K.B., J.M. Henson, and M.J. Ferris. 2005. Legionella species diversity in
an acidic biofilm community in Yellowstone National Park. Appl. Environ,
Microbiol. 71:507-511
Sheffer, P.J., J.E. Stout, M.M. Wagener, R.R. Muder. 2005. Efficacy of new point-of-
use water filters for preventing exposure to Legionella and waterborne bacteria. A. J.
Infect. Control 33:S20-25.
Shih, H.Y., and Y.E. Lin, 2006. Caution on interpretation of Legionella results
obtained using real-time PCR for environmental water samples. Applied
Environmental Microbiology. 72(10):6859.
Page 224 of 229
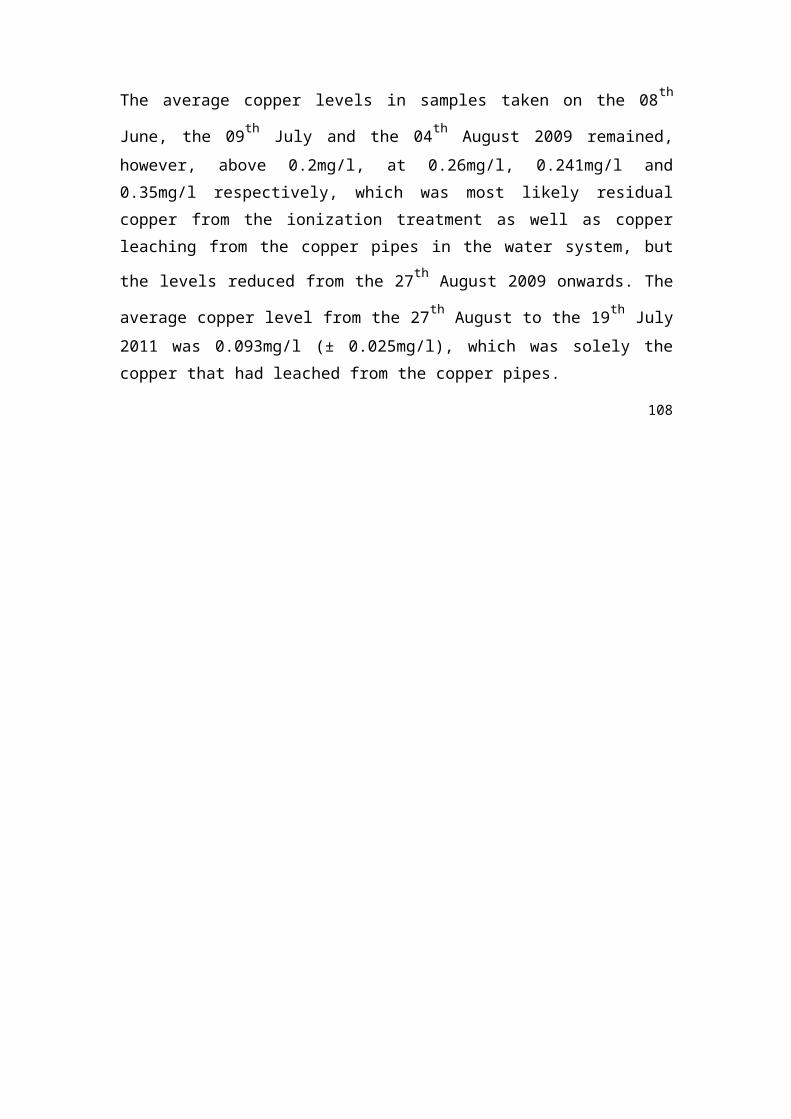
Shih, H.Y., and Y.E. Lin. 2010. Efficacy of copper-silver ionization in controlling
biofilm- and plankton-associated waterborne pathogens. Applied and Environmental
Microbiology. 76(6):2032-2035.
Sidari, F.P., J.E. Stout, and J.M. van Briesen. 2004. Keeping Legionella out of water
systems. J. Am. Water Works Assoc. 96:111-119.
Silver, S. 1996. Bacterial resistance to toxic metal ions. Gene. 179:9-19.
Skaza, A.T., L. Beskovnik, A. Storman, S. Ursic, B. Groboljsek, and D. Kese.
2010. Outbreak of Legionnaires’ disease in a nursing home, Slovenia, August 2010:
Preliminary report. Euro Surveill. 15(39):19672.
Solioz, M. and A. Odermatt. 1995. Copper and silver transport by CopB-ATPase in
membrane vesicles of Enterococcus hirae. The American Society of Biochemistry
and Molecular Biology. 270(16):9217-9221.
Sopena, N., M. Sabria-Leal, M.L. Pedro-Botet, E. Padilla, J. Dominguez, J. Morera,
and P. Tudela. 1998. Comparative study of the clinical presentation of Legionella
pneumomia and other community-acquired pneumonias. Chest. 113(5):1195-1200.
Spieker, S., D. Petersen, A. Rolfs, F. Fehrenbach, R. Kuntz, R.H. Seuffer, M. Fetter,
and J. Dichgans. 1998. Acute disseminated encephalomyelitis following Pontiac
fever. Eur Neurol. 40(3):169-172.
States, S.J., L.F Conley, M. Cerasso, T.E. Stephenson , R.S. Wolford, R.M.
Wadowsky, A.M. McNamara, and R.B. Yee. 1985. Effects of metals on Legionella
pneumophila growth in drinking water plumbing systems. Appl Environ Microbiol.
50:1149-1154.
States, S.J., C.F. Conley, J.M. Kuchta, R.S. Wolford, R.M. Wadowsky, and R.B. Yee.
1989. Chlorine, pH and control of Legionella in hospital plumbing systems. J Am
Med Assoc. 261: 1882-1883.
Steele, T.W., and A.M. McLennan. 1996. Infection of Tetrahymena pyriformis by
Legionella longbeachae and other Legionella species found in potting mixes. Applied
and Environmental Microbiology. 62(3):1081-1083.
Stewart, P.S., and J.W. Costerton. 2001. Antibiotic restance of bacteria in biofilms.
The Lancet. 358(9276):135-138.
Stone B.J., and Y. Abu Kwaik. 1998. Expression of multiple pili by Legionella
pneumophila: identification and characterization of a type IV pili gene and its role in
adherence to mammalian and protozoan cells. Infect Immun Apr. 66(4):1768-1775.
Page 225 of 229
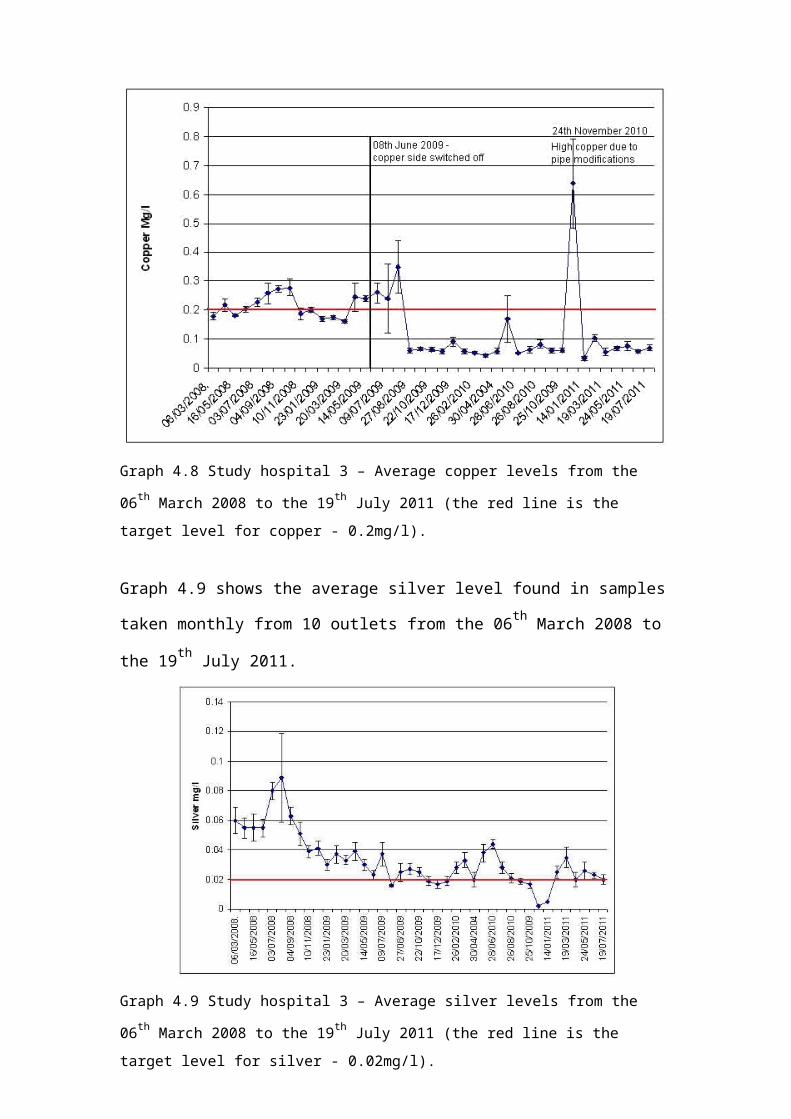
Stout, J.E., V.L. Yu, R.M. Vickers, J. Zuravleff, M. Best, A. Brown, R.B. Yee, and R.
Wadowsky. 1982. The ubiquitousness of Legionella pneumophila in the water supply
of a hospital with endemic Legionnaires' disease. N Engl J Med.306:466-468.
Stout, J.E., and V.L. Yu. 1997. Legionellosis. New England Journal of Medicine,
337:682–687.
Stout, J.E., Y.E. Lin, A.M. Goetz, and R.R. Muder. 1998. Controlling Legionella in
hospital water systems: Experience with the superheat-and-flush method and copper-
silver ionization. Infection control and Hospital Epidemiology. 19(12):911-914.
Stout, J. E., and V.L. Yu. 2003. Experiences of the first 16 hospitals using copper-
silver ionisation for Legionella control: Implications for the valuation of other
disinfection modalities. Infection Control and Hospital Epidemiology. 24(8):563-568.
Tachikawa, M., M. Tezuka, M. Morita, K. Isogai, and S. Okada. 2005. Evaluation of
some halogen biocides using a microbial biofilm system. Water Res. 39:4126-4132.
Temmerman, R., H. Vervaeren, N. Boon, and W. Verstraete. 2006. Necrotrophic
growth of Legionella pneumophila. Applied Environmental Microbiology. 72:4323-
4328
Thompson, R.B., T.M. File, J. Plouffe. 1990. Use of copper and silver ionization to
eradicate Legionella pneumophila from a hospital hot water system. Proceedings of
annual meeting of the American society for microbiology (Anaheim, CA).
Washington, DC: American Society for Microbiology.
Timbury, M.C. J.R. Donaldson, A.C McCartney, R.J. Fallon, J.D. Sleigh, D. Lyon,
G.V. Orange, D.R. Baird, J. Winter, and T.S. Wilson. 1986. Outbreak of
Legionnaires’ disease in Glasgow Royal Infirmary. Microbiological aspects. J Hyg
Camb. 97: 393-403.
Tison, D.L., D.H. Pope, W.B. Cherry, and C.B. Fliermans. 1980. Growth of
Legionella pneumophila in association with blue-green algae (cyanobacteria). Appl
Envrion Microbiol. 39:456-459.
Tison, D.L., J. Baross, and R.J. Seidler. 1983. Legionella in aquatic habitats in the
Mount Saint Helens blast zone. Current Microbiology. 9:345-348.
Uchida, M., T. Yamamoto, and A. Taniguchi. 2003. Reaction of silver ions and some
amino acids. Bokin Bobai 31:695-704.
UK Approved Code of Practice and Guidance (ACoP) (L8). 2000. Health and Safety
Executives. Legionnaires’ disease: The control of Legionella bacteria in water
systems.HSE books. ISBN9780717617722.
UK Control of Substances Hazardous to Health Regulation. 2002.
Page 226 of 229
UK Drinking Water Inspectorate.
UK Estates and Facilities. Department of Health. 2010. Alert Reference: DH 2010
03.05/05/10.
UK Health and Safety at Work Act. 1974.
UK Health Technical Memorandum 04-01. 2006. The control of Legionella hygiene,
‘safe’ hot water, cold water and drinking water systems. Part A: Design, installation
and testing. Part B: Operational management. Department of Health.
UK Independent review of evidence regarding selection of techniques for the suppression of Legionella in water supplies of hospitals and other healthcare premises.
20th March 2009.
UK Water Regulations Advisory Scheme, January 2006
UK Water Supply (Water Quality) Regulations. 1989.
UK Water Supply (Water Quality) Regulations. 2000.
Van der Kooij, D., H.R. Veenendaal, and W.J.H. Scheffer. 2005. Biofilm formation
and multiplication of Legionella in a model warm water system with pipes of copper,
stainless steel and cross-linked polyethylene. Water Res. 39:2789-2798.
Vervaeren, H., R. Temmerman, L. Devos, N. Boon, and W. Verstraete. 2006.
Introduction of a boost of Legionella pneumophila into a stagnant-water model heat
treatment. FEMS Microbiol. Ecol. 58:583-592.
Villanueva, V.D., J. Font, T. Schwartz, and A. Romani. 2010. Biofilm formation at
warming temperature: acceleration of microbial colonization and microbial
interactive effects Biofouling: The Journal of Bioadhesion and Biofilm Research.
27(1):59-71. Visca, P. P. Goldoni, P.C. Lück, J.H. Helbig, L. Cattani, G. Giltri, S.
Bramati, and M. Castellani Pastoris. 1999. Multiple types of Legionella pneumophila
serogroup 6 in a hospital heated-water system associated with sporadic infections. J.
Clin. Microbiol. 37(7):2189-2196.
Wadowsky, R.M., and R.B. Yee. 1983. Satellite growth of Legionella pneumophila
with an environmental isolate Flavobacterium berve. Appl Environ Microbiol.
46:1447-1449.
Wadowsky, R.M., T.M. Wilson, N.J. Kapp, A.J. West, J.M. Kuchta, S.J. States, J.N.
Dowling, and R.B. Yee. 1991. Multiplication of Legionella spp. in tap water
containing Hartmannella vermiformis. Appl. Environ. Microbiol. 57(7):1950-1955.
Walker, J.T., C.W. Mackerness, D. Mallon, T. Makin, T. Williets, and C.W. Keevil.
1995. Control of Legionella pneumophila in a hospital water system by chlorine
dioxide. Jour Indust Microbiol. 15(4):384.
Page 227 of 229
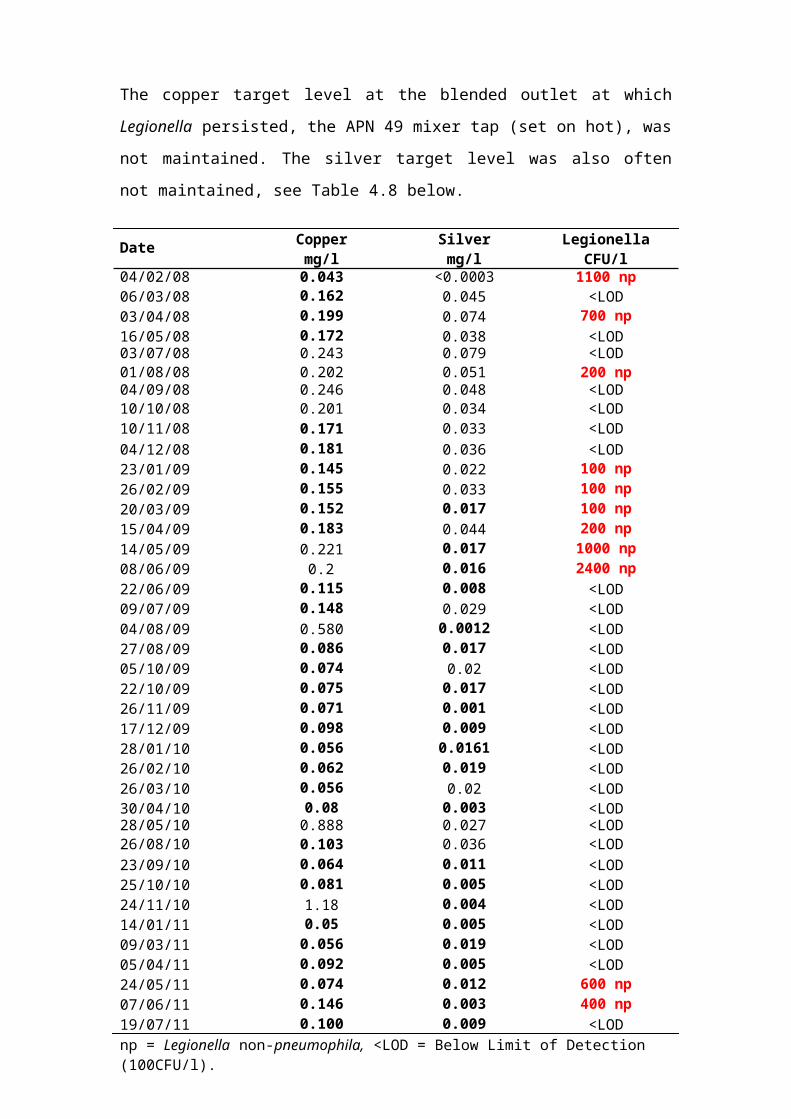
Walker, J.T., A.A. West, M. Morales, S. Ives, and N. Pavey. 1997. Controlling
Legionella and biofouling using silver and copper ions: Fact or fiction? Bioline:279-
286.
World Health Organization. Legionella and the prevention of legionellosis. 2007.
Edited by Jamie Bartram, Yves Chartier, John V Lee, Kathy Pond and Susanne
Surman-Lee. WHO Library Cataloguing-in-Publication Data.
World Health Organization. Guidelines for Drinking Water Quality. Fourth Edition.
2011. WHO Library Cataloguing-in-Publication Data. NLM classification:WA 675.
ISBN 978 92 4 154815 1.
Wuhrmann, K., and F. Zobrist. 1958. Bactericidal effect of silver in water. Schwiez Z.
Hydrol. 20:218-254.
Wullings, B.A., and D. van der Kooij. 2006. Occurrence and Genetic Diversity of
Uncultured Legionella spp. in Drinking Water Treated at Temperatures below 15ºC.
Appl Environ Microbiol. 72:157-166.
www.bbc.co.uk
www.corrosion-doctors.org
www.dwi.defra.gov.uk
www.eurosurveillance.org
www.hcinfo.com
www.hpa.org.uk
www.nhs.uk
www.sdu.nhs.uk
www.speedfit.co.uk
www.tylerresearch.com
www.who.int
Yamanaka, M., K. Hara, and J. Kudo. 2005. Bactericidal actions of a silver ion
solution on Escherichia coli, studied by energy-filtering transmission electron
microscopy and proteomic analysis. Applied and Environmental Microbiology.
71(11):7589-7593.
Yu V L, J. F. Plouffe, M.C. Pastoris, J. E. Stout, M. Schousboe, A. Widmer, J.
Summersgill, T. File, C.M. Heath, D.L. Patterson, and A. Chereshsky. 2002. A.
Distribution of Legionella species and serogroups isolated by culture in patients with
sporadic community-acquired legionellosis: an international collaborative survey.
Journal Infectious Diseases. 186(1):127-8.
Page 228 of 229

Zevenhuizen, L.P.T.M, J. Dolfing, E.J. Eshuis, and I.J. Scholten-Koerselman. 1979.
Inhibitory effects of coppers on bacteria related to the free ion concentration. Microb.
Ecol. 5:139-146.
Page 229 of 229