Embed Size (px)
Citation preview
© Synovate 2008
Where are the D’s and E’s?
Does our education system make or break them?
The Steadman Group
Prepared by:Maggie Ireri, Business Development Director
Emily Gumba, Research Club of Kenya CoordinatorJuly 2009
© Synovate 2008
Preamble
• Education is expected to drive and accelerate innovation, idea generation and the skills and
qualifications required to efficiently mobilize, utilize and manage available resources critical for wealth
building and development.
• The current 8-4-4 system of education, has undergone various restructuring in order to meet the
Nation’s needs and goals for economic empowerment.
© Synovate 2008
• This presentation analyses the employment status of the youth who sat for KSCE and did not pursue
tertiary education/higher education mainly on account of poor performance - largely those scoring D+ and
below.
Preamble
© Synovate 2008
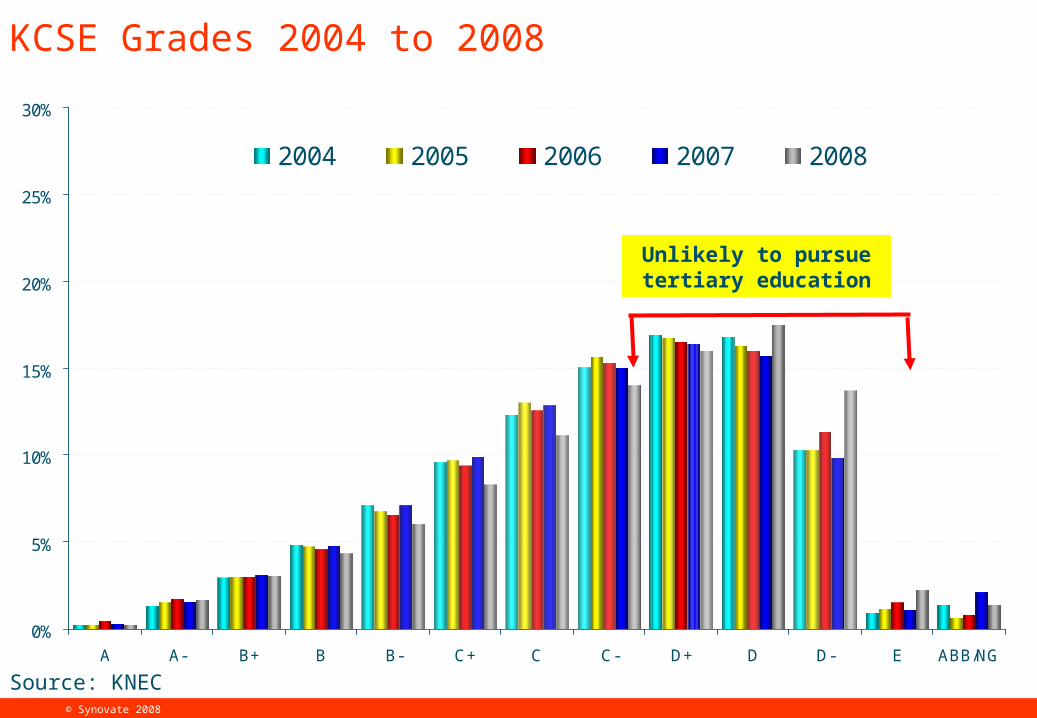
KCSE Grades 2004 to 2008
596,895 candidates attained D+ and below
Preamble
© Synovate 2008
0%
5%
10%
15%
20%
25%
30%
A A- B+ B B- C+ C C- D+ D D- E ABB/NG
2004 2005 2006 2007 2008
Unlikely to pursue tertiary education
Source: KNEC
KCSE Grades 2004 to 2008
© Synovate 2008
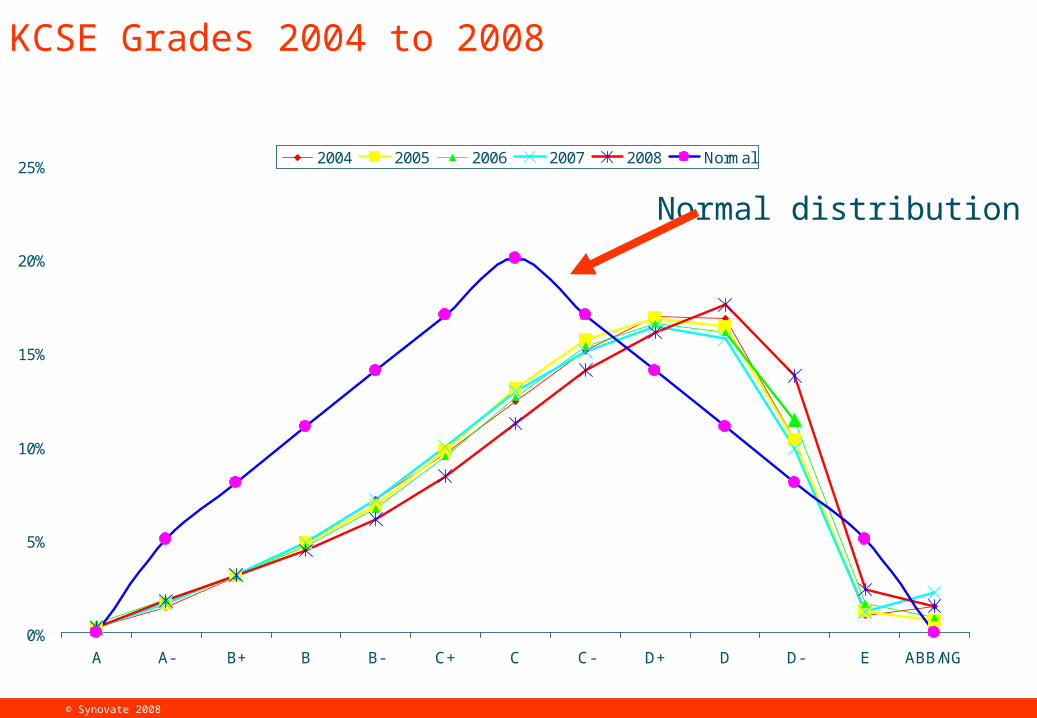
KCSE Grades 2004 to 2008
0%
5%
10%
15%
20%
25%
A A- B+ B B- C+ C C- D+ D D- E ABB/NG
2004 2005 2006 2007 2008 Normal
Normal distribution
© Synovate 2008
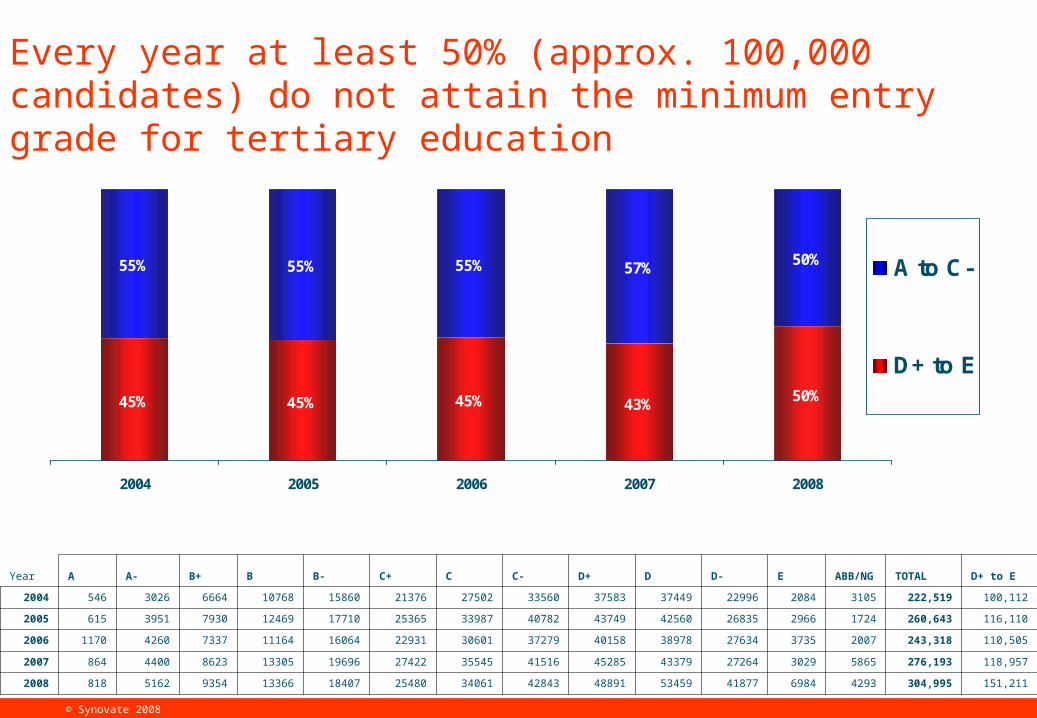
45% 45% 45% 43% 50%
55% 55% 55% 57% 50%
2004 2005 2006 2007 2008
A to C-
D+ to E
Every year at least 50% (approx. 100,000 candidates) do not attain the minimum entry grade for tertiary education
Year A A- B+ B B- C+ C C- D+ D D- EABB/NG TOTAL D+ to E
2004 546 3026 6664 10768 15860 21376 27502 33560 37583 37449 22996 2084 3105 222,519 100,112
2005 615 3951 7930 12469 17710 25365 33987 40782 43749 42560 26835 2966 1724 260,643 116,110
2006 1170 4260 7337 11164 16064 22931 30601 37279 40158 38978 27634 3735 2007 243,318 110,505
2007 864 4400 8623 13305 19696 27422 35545 41516 45285 43379 27264 3029 5865 276,193 118,957
2008 818 5162 9354 13366 18407 25480 34061 42843 48891 53459 41877 6984 4293 304,995 151,211
© Synovate 2008
Performance in KSCE
What happens to those who have low grades and are not eligible for higher education?
Is this target group equipped with necessary skills to make a positive contribution to the economy?
© Synovate 2008
Economic status versus education level attained
Youth Post Education Status
© Synovate 2008
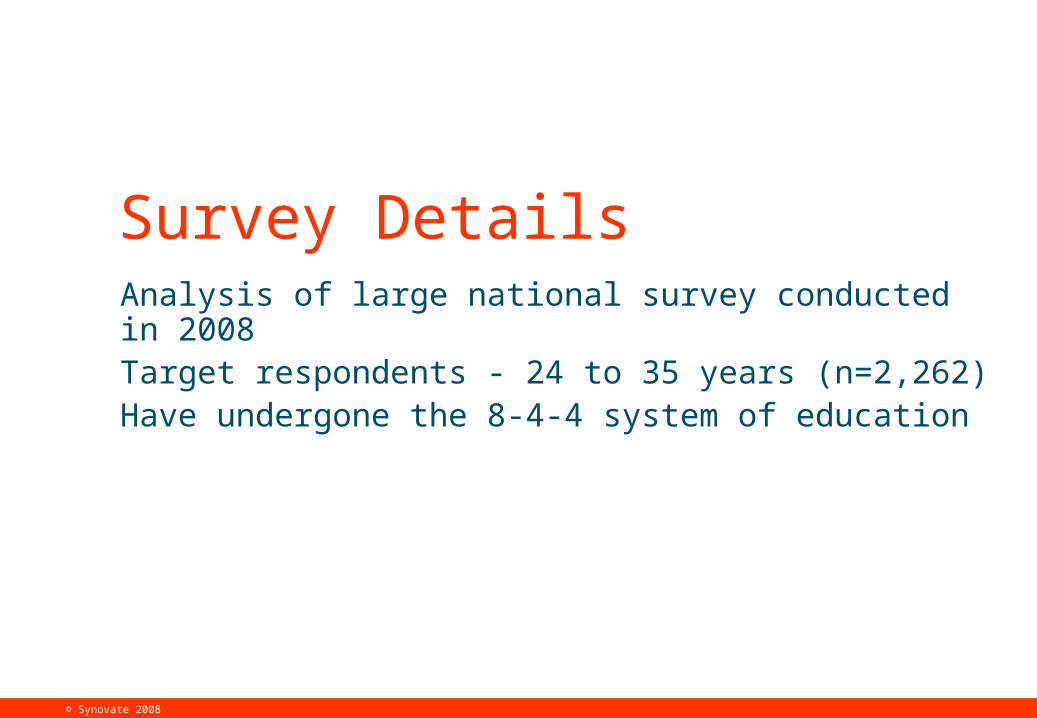
Survey Details Analysis of large national survey conducted in 2008Target respondents - 24 to 35 years (n=2,262)Have undergone the 8-4-4 system of education
© Synovate 2008
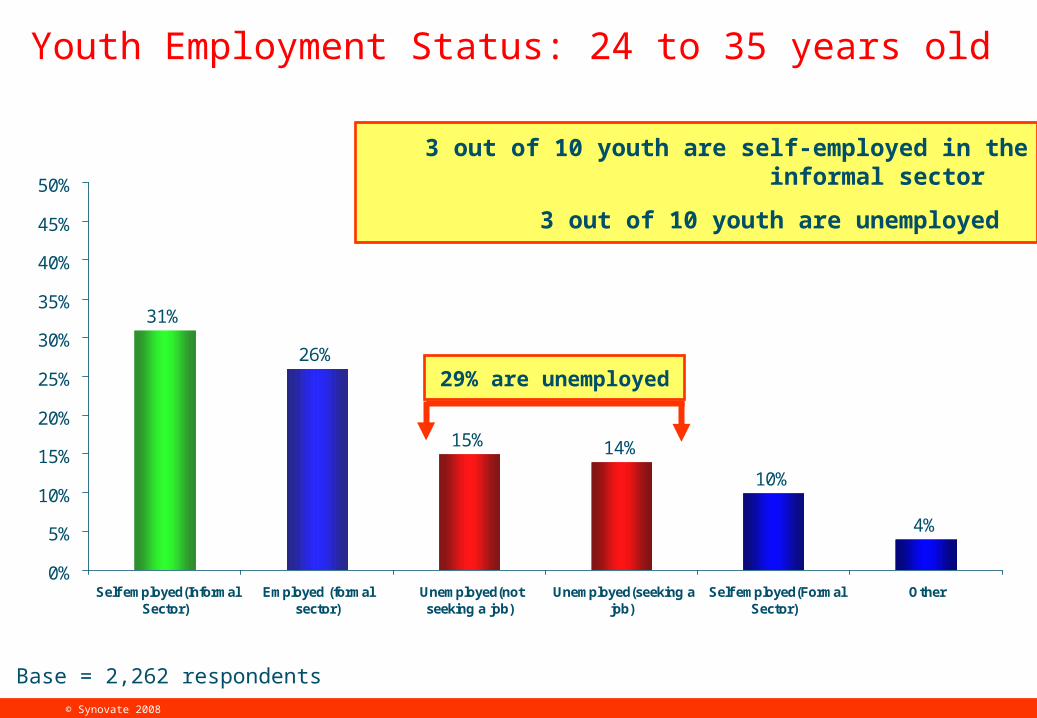
Youth Employment Status: 24 to 35 years old
PIE CHART 31%
26%
15% 14%
10%
4%
0%
5%
10%
15%
20%
25%
30%
35%
40%
45%
50%
Self employed(InformalSector)
Employed (formalsector)
Unemployed(notseeking a job)
Unemployed(seeking ajob)
Self employed(FormalSector)
Other
29% are unemployed
3 out of 10 youth are self-employed in the informal sector
3 out of 10 youth are unemployed
Base = 2,262 respondents
© Synovate 2008
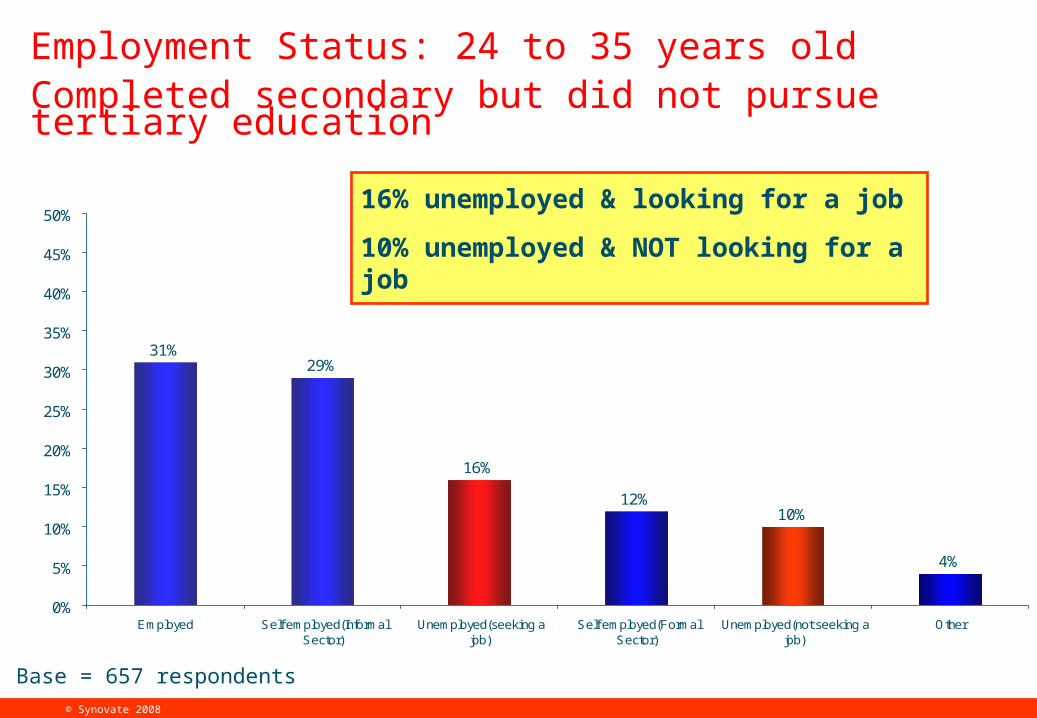
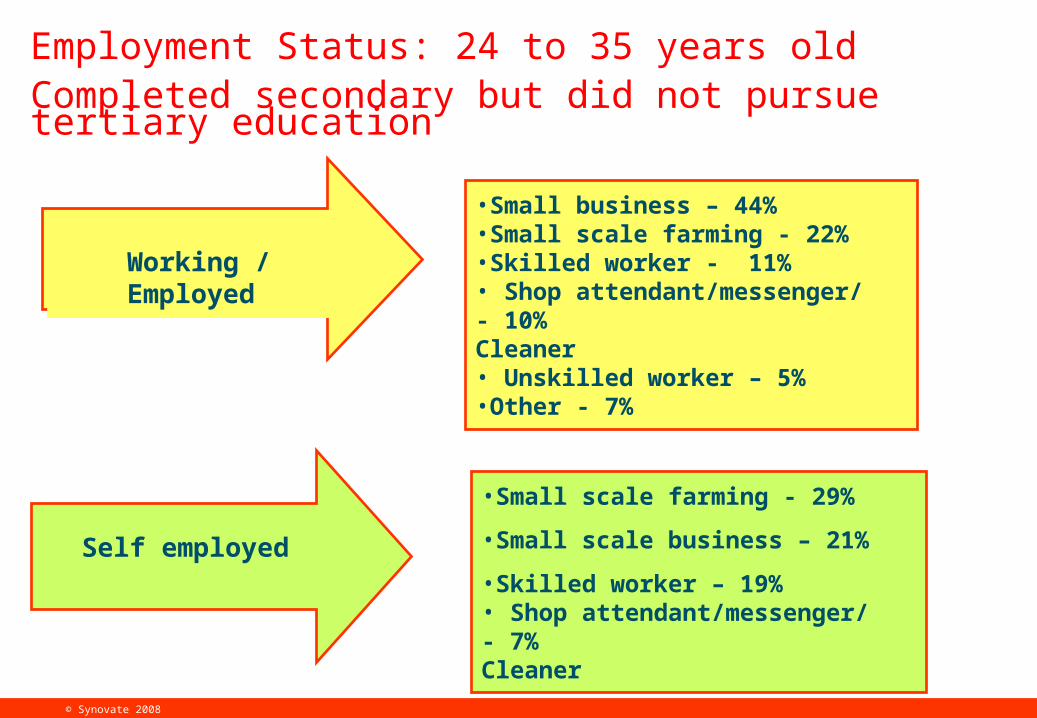
Employment Status: 24 to 35 years oldCompleted secondary but did not pursue tertiary education
PIE CHART
31%29%
16%
12%10%
4%
0%
5%
10%
15%
20%
25%
30%
35%
40%
45%
50%
Employed Self employed(InformalSector)
Unemployed(seeking ajob)
Self employed(FormalSector)
Unemployed(not seeking ajob)
Other
16% unemployed & looking for a job
10% unemployed & NOT looking for a job
Base = 657 respondents
© Synovate 2008
Working / Employed
•Small business – 44%•Small scale farming - 22%•Skilled worker - 11%• Shop attendant/messenger/ - 10%Cleaner• Unskilled worker – 5% •Other - 7%
Employment Status: 24 to 35 years oldCompleted secondary but did not pursue tertiary education
•Small scale farming - 29%
•Small scale business – 21%
•Skilled worker – 19%• Shop attendant/messenger/ - 7%Cleaner
Self employed
© Synovate 2008
Career Secondary School Students Want to Pursue
PIE CHART
RCK Objectives:
• The aim of the club is to promote the early understanding, appreciation and use of market research in the early stages of learning.
• The outcome will be that the youth will learn to use research (information gathering) to make informed decisions.
© Synovate 2008
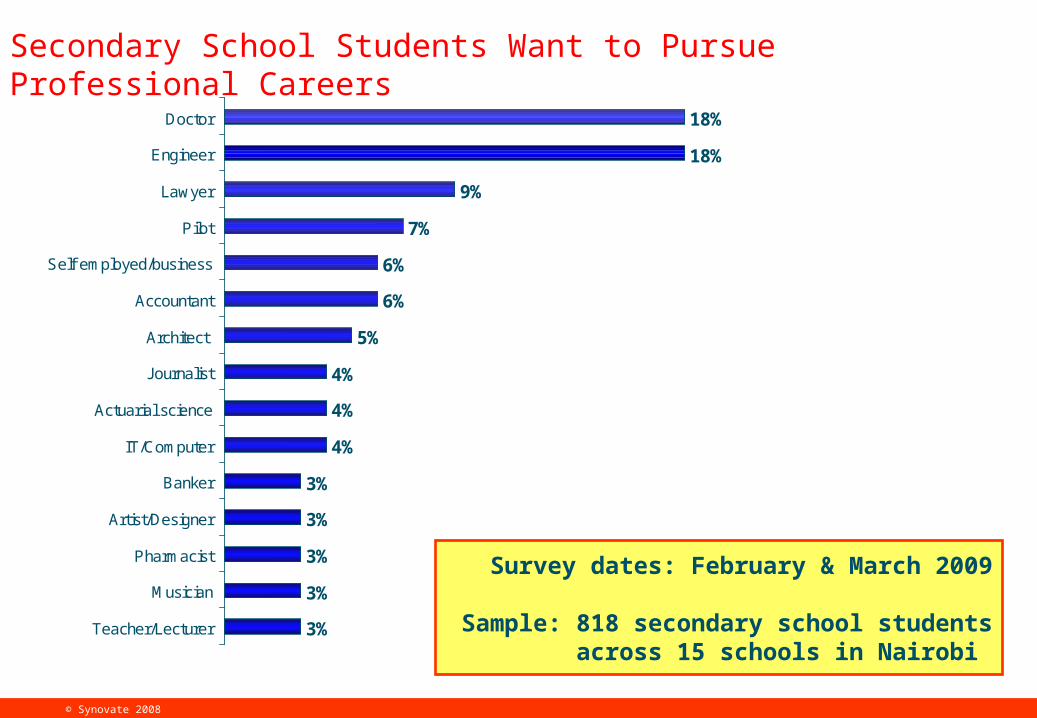
Secondary School Students Want to Pursue Professional Careers
PIE CHART
3%
3%
3%
3%
3%
4%
4%
4%
5%
6%
6%
7%
9%
18%
18%
Teacher/Lecturer
Musician
Pharmacist
Artist/Designer
Banker
IT/Computer
Actuarial science
Journalist
Architect
Accountant
Self employed/business
Pilot
Lawyer
Engineer
Doctor
Sample = 818 students
Survey dates: February & March 2009
Sample: 818 secondary school students across 15 schools in Nairobi
© Synovate 2008
Comparative Analysis Employment Status vs. Education Level
Below Secondary (up-to some secondary school education)Completed secondary education University Graduates
© Synovate 2008
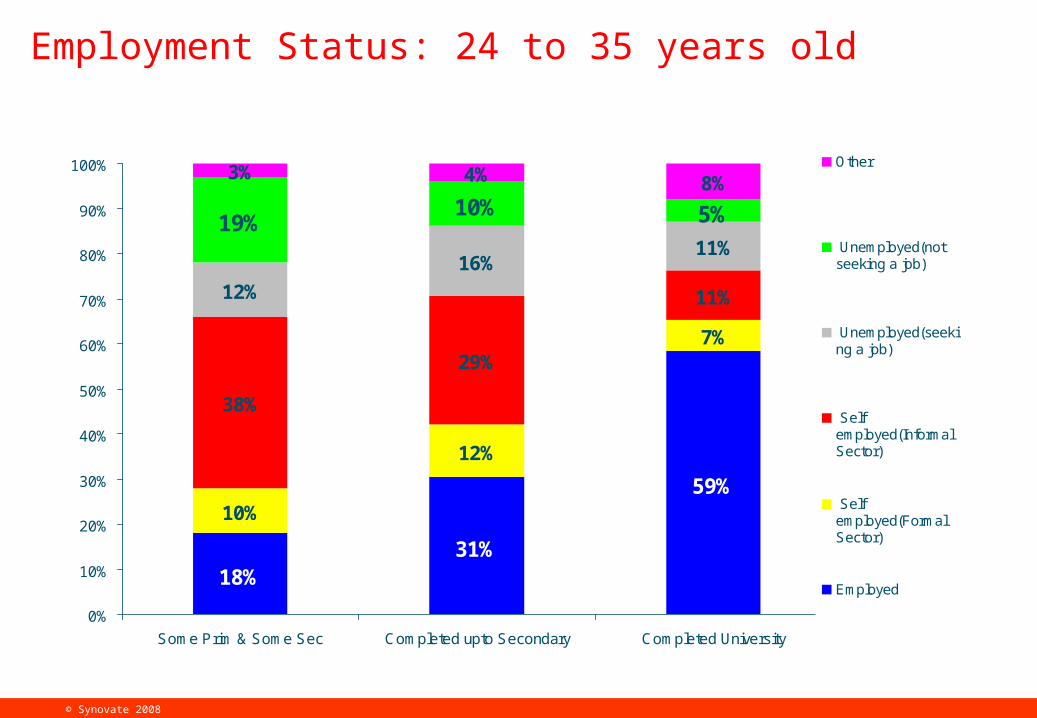
Employment Status: 24 to 35 years old
PIE CHART
18%31%
59%10%
12%
7%
38%
29%
11%12%
16%11%
19%10% 5%
3% 4% 8%
0%
10%
20%
30%
40%
50%
60%
70%
80%
90%
100%
Some Prim & Some Sec Completed upto Secondary Completed University
Other
Unemployed(notseeking a job)
Unemployed(seeking a job)
Selfemployed(InformalSector)
Selfemployed(FormalSector)
Employed
© Synovate 2008
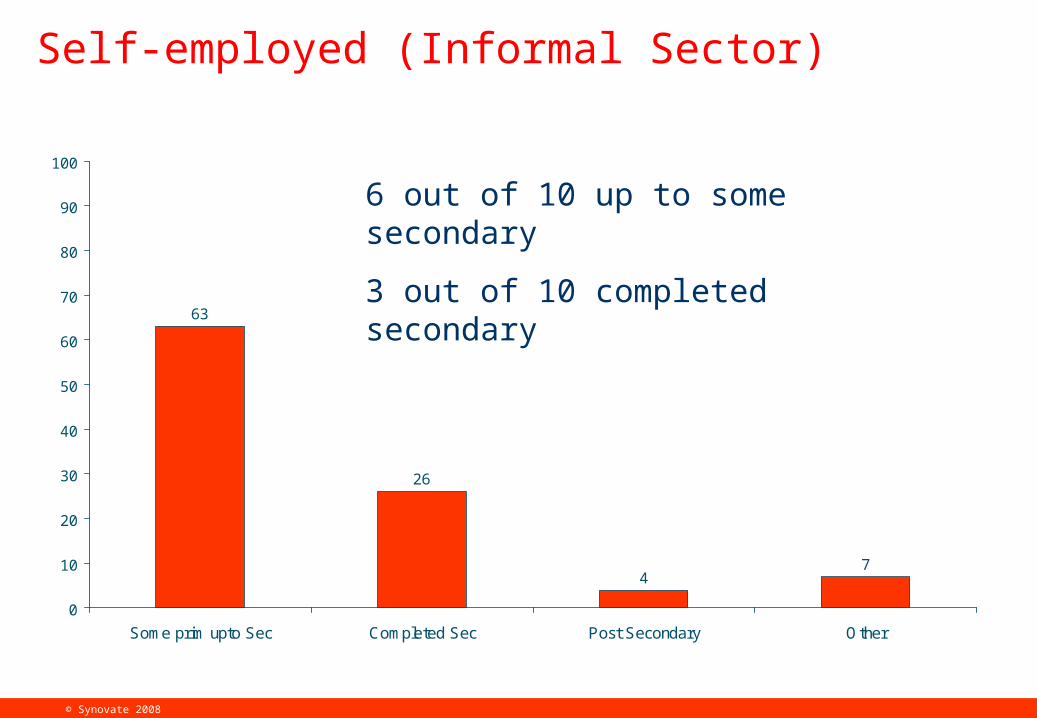
63
26
47
0
10
20
30
40
50
60
70
80
90
100
Some prim upto Sec Completed Sec Post Secondary Other
Self-employed (Informal Sector)
6 out of 10 up to some secondary
3 out of 10 completed secondary
© Synovate 2008
Education We Want………….
Less educated: Significant proportions of those in secondary school are more likely to be self employed. Would the % of this target group be higher with a more vocational based education system?
Curriculum: can the curriculum be tailored to meet the needs of the employment market? Should the secondary education focus be more on vocational skills training for students will low academic potential?
© Synovate 2008
Education We Want………….
Attitudinal change: there is a view that academic excellence results to professional success and vocational competencies are looked down upon. Eventually, a large proportion of those who do not attain high grades still pursue vocational careers or are unemployed.
What can be done to foster attitudinal change that will encourage and promote vocational skills capability?
© Synovate 2008
Education We Want………….
For further information contact
Tel: 4450190/6