Embed Size (px)
Citation preview
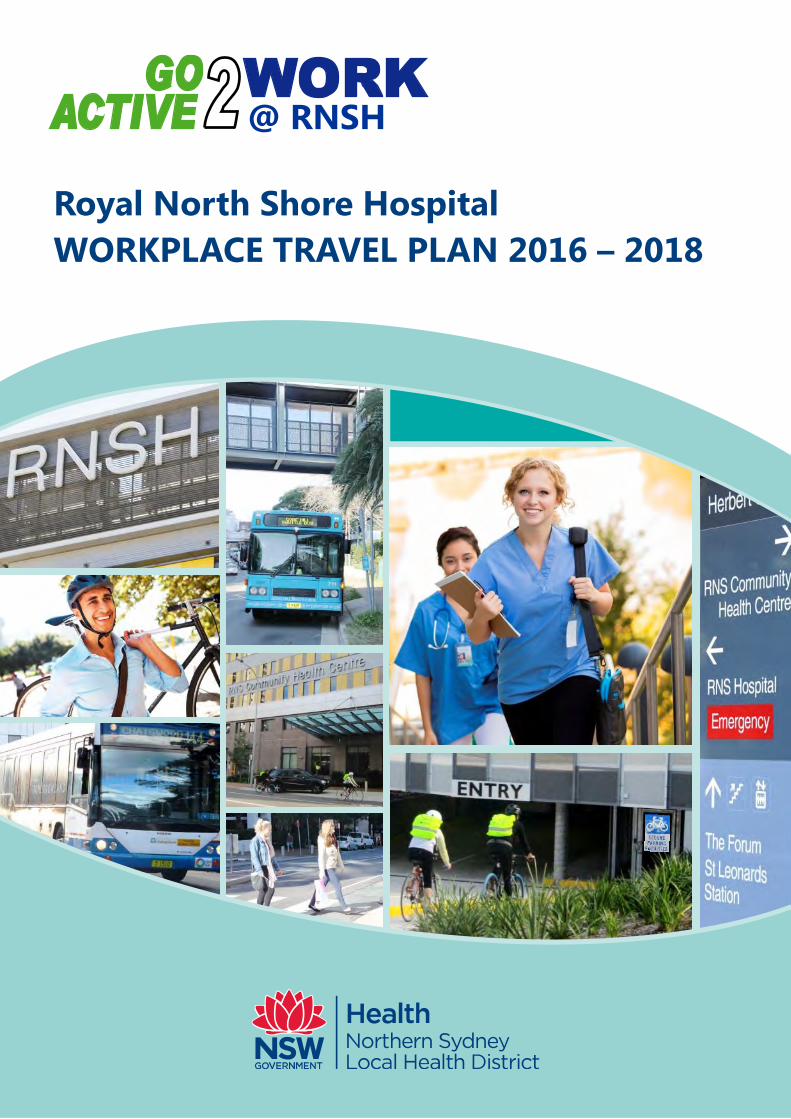
@ RNSH
Royal North Shore Hospital
WORKPLACE TRAVEL PLAN 2016 – 2018
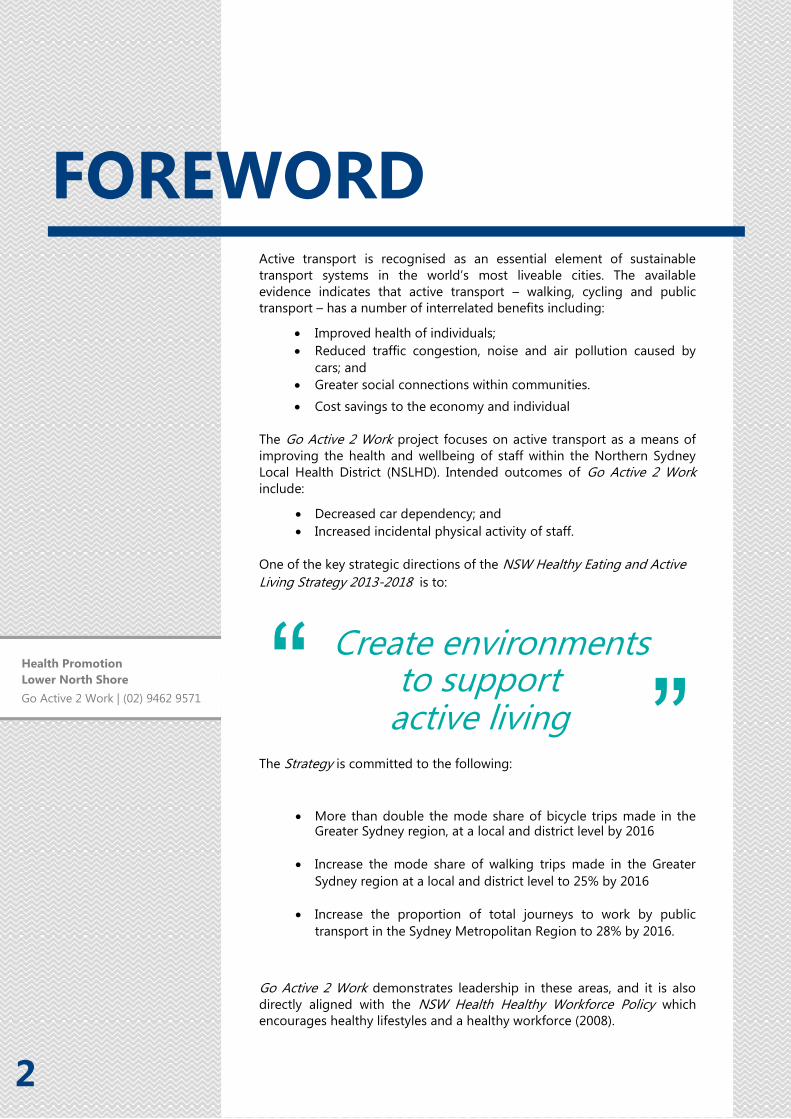
Active transport is recognised as an essential element of sustainable
transport systems in the world’s most liveable cities. The available
evidence indicates that active transport – walking, cycling and public
transport – has a number of interrelated benefits including:
Improved health of individuals;
Reduced traffic congestion, noise and air pollution caused by
cars; and
Greater social connections within communities.
Cost savings to the economy and individual
The Go Active 2 Work project focuses on active transport as a means of
improving the health and wellbeing of staff within the Northern Sydney
Local Health District (NSLHD). Intended outcomes of Go Active 2 Work
include:
Decreased car dependency; and
Increased incidental physical activity of staff.
One of the key strategic directions of the NSW Healthy Eating and Active
Living Strategy 2013-2018 is to:
The Strategy is committed to the following:
More than double the mode share of bicycle trips made in the Greater Sydney region, at a local and district level by 2016
Increase the mode share of walking trips made in the Greater
Sydney region at a local and district level to 25% by 2016
Increase the proportion of total journeys to work by public
transport in the Sydney Metropolitan Region to 28% by 2016.
Go Active 2 Work demonstrates leadership in these areas, and it is also
directly aligned with the NSW Health Healthy Workforce Policy which
encourages healthy lifestyles and a healthy workforce (2008).
“ ” Create environments
to support active living
FOREWORD
Health Promotion
Lower North Shore
Go Active 2 Work | (02) 9462 9571
2

02 FOREWORD
04 WORKPLACE
TRAVEL PLAN
OBJECTIVES
08 RNSH
Go Active 2 Work
STAFF SURVEY
SUMMARY
09
CONTENTS
RNSH
Go Active 2 Work
STAFF SURVEY
RESULTS
3
05 WORKPLACE
TRAVEL PLAN
STRATEGIES

The actions in the RNSH Workplace Travel Plan will be implemented over three years. The lead agency for each action is NSLHD Health Promotion unless indicated otherwise. Progress will be
evaluated by repeat survey and audit at the end of the three years.
OBJECTIVES
Improve active transport access &
connectivity from outside and within
the hospital campus
Influence greater uptake of active
transport by external organisations and
the general community
Increase public transport use by
developing targeted information
and incentives for potential public
transport users
The objectives of RNSH workplace travel plan relate to the following four main areas of action;
PUBLIC TRANSPORT CYCLING & WALKING
LEADERSHIP & ADVOCACY HOSPITAL ACCESS & CONNECTIVITY
Increase cycling and walking by staff
who live within 5km from work through
improved end-of-trip facilities and other
targeted strategies
4
ROYAL NORTH SHORE HOSPITAL WORKPLACE TRAVEL PLAN

2016 2017 2018
Promote the NSW Government 131 500 Transport
Infoline.
Promote the NSLHD procedure whereby departments
can access Opal cards for work related travel.
Provide information about public transport in staff
orientation kits.
PUBLIC TRANSPORT
End of Trip Facilities 2016 2017 2018
Audit current shower and changing facilities at RNSH to
ensure facilities are accessible and in working order.
Promote RNSH bicycle parking and end-of-trip facilities
(including the availability of lockers) within the hospital.
Provide a bicycle repair station within RNSH bicycle
parking area.
Co-locate a Go Active information ‘hub’ with end-of-trip
facilities, including signage and noticeboard.
·
Assess the need for additional bicycle parking and make
recommendations as appropriate e.g. emergency
department, back entrance of CHC.
CYCLING & WALKING
5
STRATEGIES
· · · ·
· ·
· · · · · ·
· · ·

CYCLING & WALKING
2016 2017 2018
Provide a RNSH bike fleet available to all staff, if feasible.
Other Targeted Strategies
Disseminate resources to encourage higher rates of
walking and cycling i.e. council maps and resources.
Promote initiatives to encourage staff who live within 5
kilometres from work to cycle, walk or take public
transport e.g. take the stairs, National Walk to Work
Day, National Ride to Work Day, Bike buddy programs
and NSW Bike Week. ·
Initiate practical activities such as ‘Get Back on Your Bike’
workshops, training in cycle skills and cycle maintenance
in partnership with local bicycle retailers and councils.
Increase the knowledge and awareness of the NSLHD
Cycling Policy by promoting it in hospital newsletters,
staff e-mail correspondence, during state and national
events such as Bike Week, Health Promotion website
and so on.
CYCLING & WALKING
6
· · · ·
· ·
· · ·
· · · Rework and further develop the Go Active 2 Work
Intranet page to promote active travel and the options
available to staff at each hospital and across the NSLHD ·
2016 2017 2018
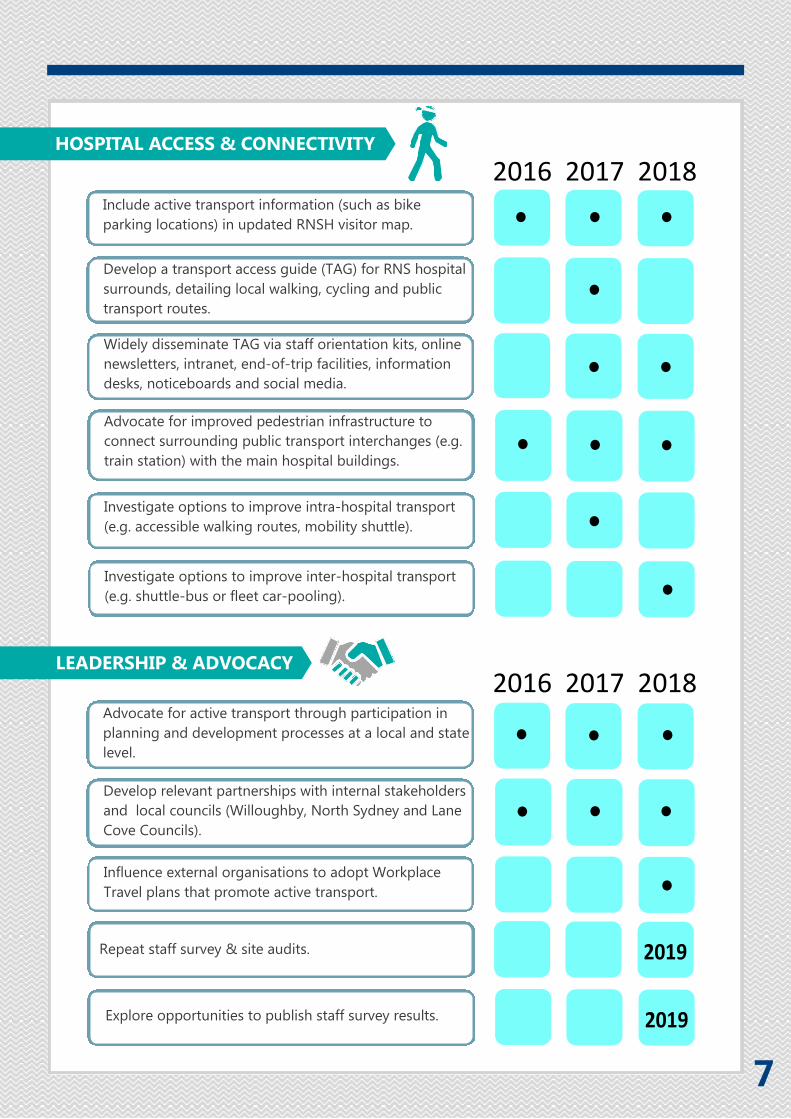
Advocate for improved pedestrian infrastructure to
connect surrounding public transport interchanges (e.g.
train station) with the main hospital buildings.
2016 2017 2018
Develop a transport access guide (TAG) for RNS hospital
surrounds, detailing local walking, cycling and public
transport routes.
Include active transport information (such as bike
parking locations) in updated RNSH visitor map.
Investigate options to improve intra-hospital transport
(e.g. accessible walking routes, mobility shuttle).
Widely disseminate TAG via staff orientation kits, online
newsletters, intranet, end-of-trip facilities, information
desks, noticeboards and social media.
Advocate for active transport through participation in
planning and development processes at a local and state
level.
Develop relevant partnerships with internal stakeholders
and local councils (Willoughby, North Sydney and Lane
Cove Councils).
Influence external organisations to adopt Workplace
Travel plans that promote active transport.
Repeat staff survey & site audits.
Investigate options to improve inter-hospital transport
(e.g. shuttle-bus or fleet car-pooling).
Explore opportunities to publish staff survey results.
HOSPITAL ACCESS & CONNECTIVITY
LEADERSHIP & ADVOCACY
7
· · · ·
· · · ·
· ·
·
· · · · · ·
· 2019
2019

35% of respondents live within 10 km of RNSH of which
15% live within 5 km These distances represent a potential for staff to possibly switch to walking or
cycling to work.
8% would like to walk to work For those that drove to work, when asked what would make them consider an
alternative form of transport the majority stated more frequent public transport
followed by financial incentives for public transport tickets and improved
showering/changing facilities.
12% would like to cycle to work A lack of continuous cycle paths, showering/change facilities and lack of cycling
skills experience were considered barriers for those who did not regularly cycle to
work.
51% would consider switching to public transport The main barriers were ’length of travel time’, infrequency of public transport,
having to drop off/pick up other people and needing to attend before/after work
activities.
NSLHD Health Promotion is committed to improving the health of RNSH staff, with a
focus on making it easier to commute to work in a physically active way. In September
2014, RNSH staff were surveyed about their ‘travel to work‘ habits and views.
@ RNSH
STAFF SURVEY RESULTS SUMMARY
857 RNSH staff completed the survey
Just under half of respondents (47%) drive to work, 41%
catch public transport whilst 9% either walk or cycle.
The stand-out reasons for why people chose their particular mode of travel to work were the length of
travel time (32%) and convenience (18%).
Over half (51%) of respondents had considered using an
alternative form of transport to their current form.
Of those:
8
STAFF TRAVEL SURVEY REPORT
ROYAL NORTH SHORE HOSPITAL
CAMPUS
@ RNSH 9
METHODOLOGY
Staff at the Royal North Shore Hospital (RNSH)
site were surveyed about their travel habits and
influences between the 1st- 26
th September,
2014.
A total of 857 survey responses were collected
in the 26 day survey period.
Respondents had the option to complete the
survey online on survey monkey (n=611) or in
hard copy format (n=246). The survey was
officially ‘opened’ on the 1st September
through a series of online and staff newsletter
promotions. To supplement the online sphere
the Health Promotion team at RNSH held two
promotional stalls in the main foyer of the
main hospital building and the community
health building where staff could fill out
surveys on the spot and receive a muffin/piece
of fruit for their
efforts. These events were held in the second
week of the survey being released.
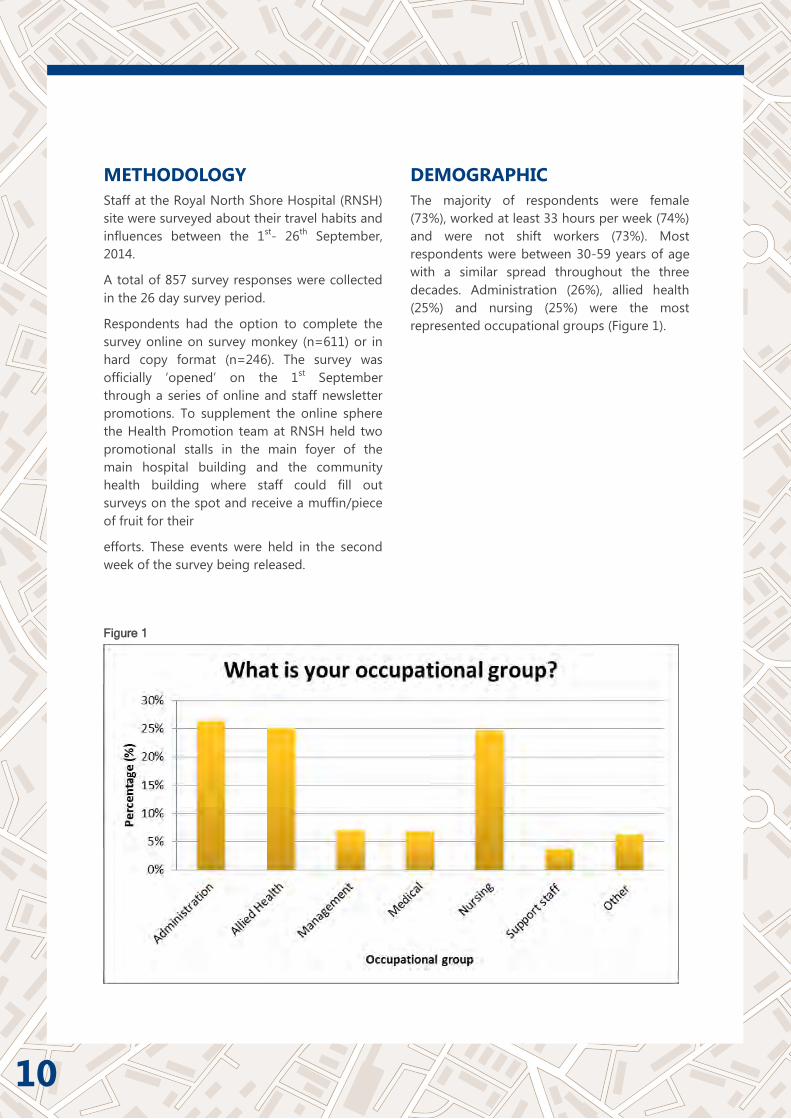
DEMOGRAPHIC
The majority of respondents were female
(73%), worked at least 33 hours per week (74%)
and were not shift workers (73%). Most
respondents were between 30-59 years of age
with a similar spread throughout the three
decades. Administration (26%), allied health
(25%) and nursing (25%) were the most
represented occupational groups (Figure 1).
Figure 1
10
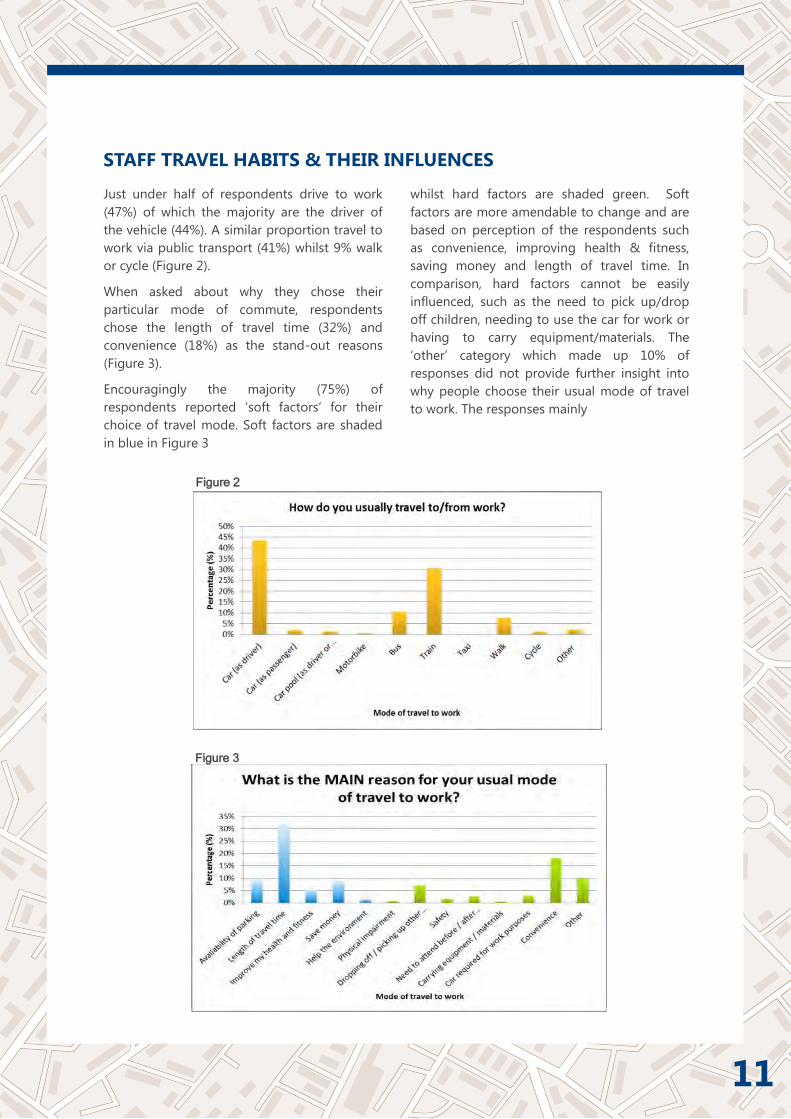
Just under half of respondents drive to work
(47%) of which the majority are the driver of
the vehicle (44%). A similar proportion travel to
work via public transport (41%) whilst 9% walk
or cycle (Figure 2).
When asked about why they chose their
particular mode of commute, respondents
chose the length of travel time (32%) and
convenience (18%) as the stand-out reasons
(Figure 3).
Encouragingly the majority (75%) of
respondents reported ‘soft factors’ for their
choice of travel mode. Soft factors are shaded
in blue in Figure 3
whilst hard factors are shaded green. Soft
factors are more amendable to change and are
based on perception of the respondents such
as convenience, improving health & fitness,
saving money and length of travel time. In
comparison, hard factors cannot be easily
influenced, such as the need to pick up/drop
off children, needing to use the car for work or
having to carry equipment/materials. The
‘other’ category which made up 10% of
responses did not provide further insight into
why people choose their usual mode of travel
to work. The responses mainly
STAFF TRAVEL HABITS & THEIR INFLUENCES
Figure 2
Figure 3
11

consisted of reiterations of the existing
response categories (Figure 3) or comments
regarding public transport options being
lacking, infrequent or not efficient.
For those respondents who did not regularly
travel by public transport the most cited reason
was ‘length of travel time’ followed by public
transport being considered too infrequent,
having to drop off/pick up other people and
needing to attend before/after work activities
(Figure 4).
The ‘other’ category, whilst being in the top
four responses did not provide further insights
into why people did not use public transport.
The majority of the responses in ‘other’ were
respondents who lived close-by to work and so
chose to walk or ride over catching public
transport. The remaining bulk of ‘other’
responses were indicating that if public
transport were more efficient they would
choose it as a mode of commuting.
CONTINUED...
*Percentages (%) are
not shown in the
graph because
respondents were able
to select more than
one answer. Therefore
the total number of
responses are
reflected in this
instance.
Figure 4
12
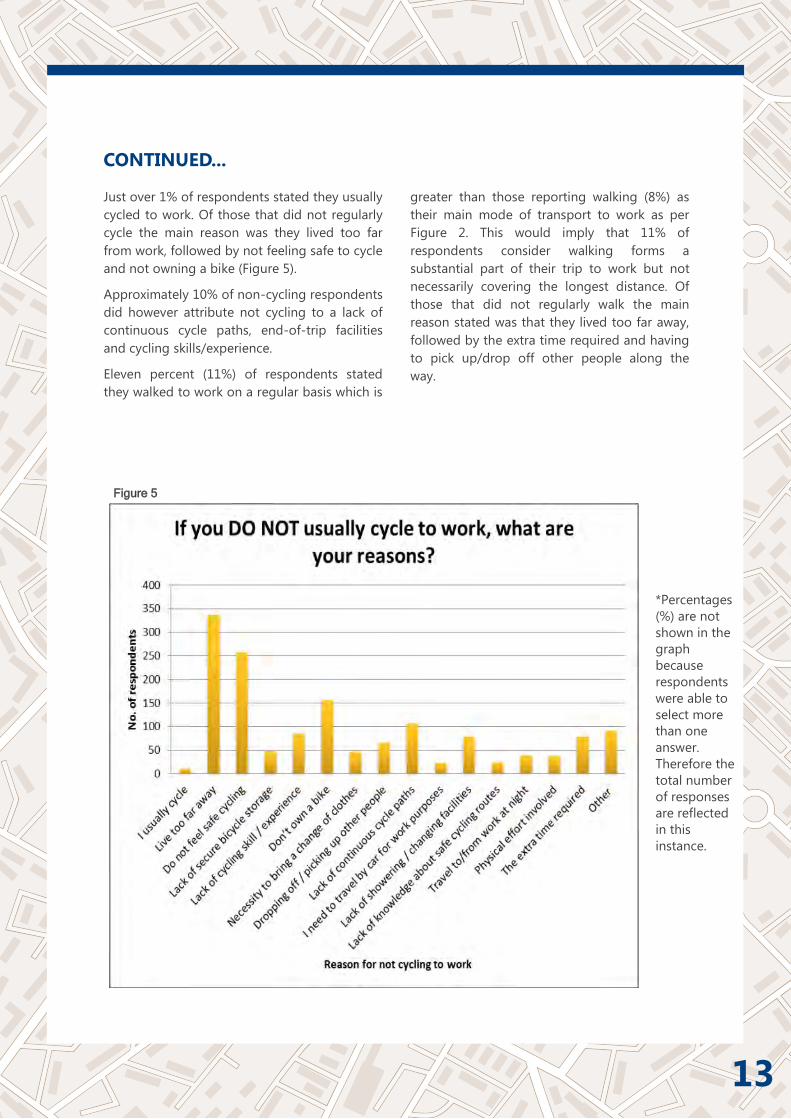
Just over 1% of respondents stated they usually
cycled to work. Of those that did not regularly
cycle the main reason was they lived too far
from work, followed by not feeling safe to cycle
and not owning a bike (Figure 5).
Approximately 10% of non-cycling respondents
did however attribute not cycling to a lack of
continuous cycle paths, end-of-trip facilities
and cycling skills/experience.
Eleven percent (11%) of respondents stated
they walked to work on a regular basis which is
greater than those reporting walking (8%) as
their main mode of transport to work as per
Figure 2. This would imply that 11% of
respondents consider walking forms a
substantial part of their trip to work but not
necessarily covering the longest distance. Of
those that did not regularly walk the main
reason stated was that they lived too far away,
followed by the extra time required and having
to pick up/drop off other people along the
way.
CONTINUED...
*Percentages
(%) are not
shown in the
graph
because
respondents
were able to
select more
than one
answer.
Therefore the
total number
of responses
are reflected
in this
instance.
Figure 5
13

Just over half (51%) of respondents reported
considering using an alternative mode of
transport to their current commuting mode. Of
those, the majority reported considering public
transport (51%), followed by driving (25%),
cycling (12%) and walking (8%). For those that
drove to work, when asked what incentives or
information would encourage them to change
from their current commuting habits, the
majority stated more frequent public transport
followed by financial incentives for public
transport tickets and improved showering/
changing facilities (Figure 6).
The ‘other’ category formed a significant
proportion of responses however the majority
of these were a combination of comments
about inadequate public transport and hard
factors such as dropping off/picking up
children being barriers to staff choosing
alternatives to car travel to work.
CONTINUED...
*Percentages
(%) are not
shown in the
graph
because
respondents
were able to
select more
than one
answer.
Therefore the
total number
of responses
are reflected
in this
instance.
Figure 6
14
When at work 37% of respondents stated they
travelled for business during the working day.
When they do travel for work-related business,
38% use their own vehicle while 27% use a fleet
or department car.
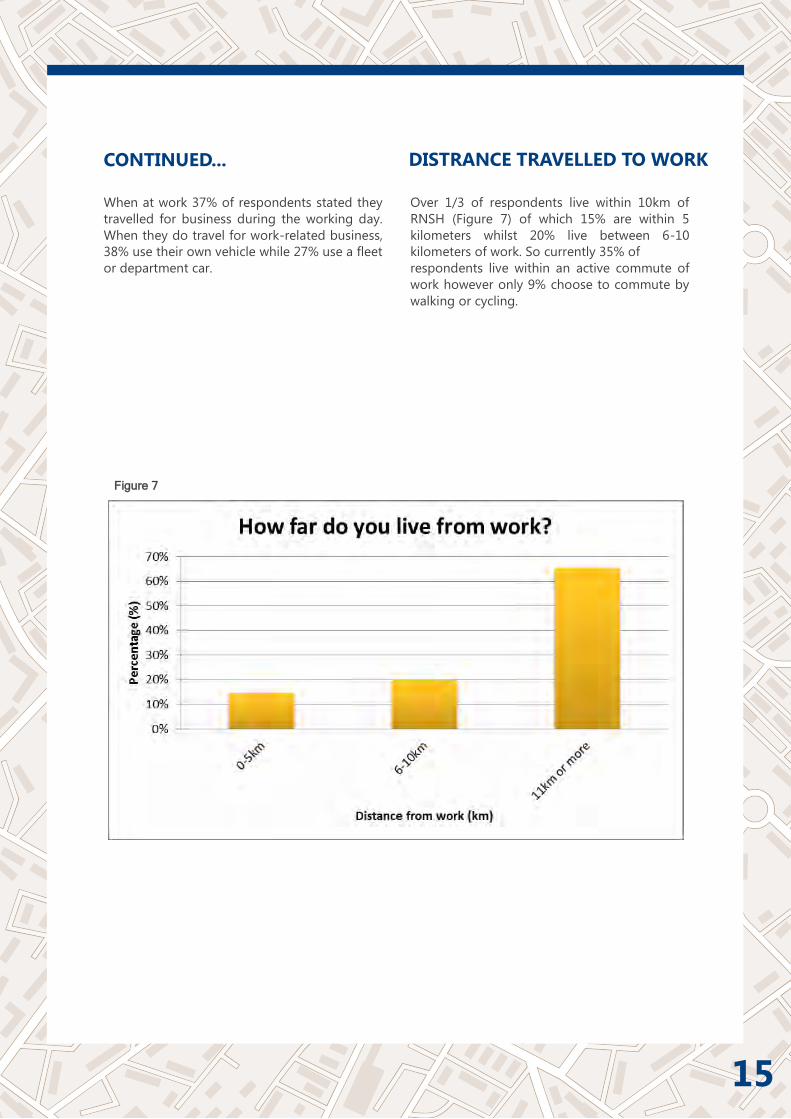
Over 1/3 of respondents live within 10km of
RNSH (Figure 7) of which 15% are within 5
kilometers whilst 20% live between 6-10
kilometers of work. So currently 35% of
respondents live within an active commute of
work however only 9% choose to commute by
walking or cycling.
CONTINUED...
Figure 7
DISTRANCE TRAVELLED TO WORK
15