Embed Size (px)
Citation preview

Energy Analysis
Mellie Pullman ISQA 511

Overview
Primary Energy Sources Current Oregon Statistics Analysis of different energy related
investments Case Analysis of solar photovoltaic
installation
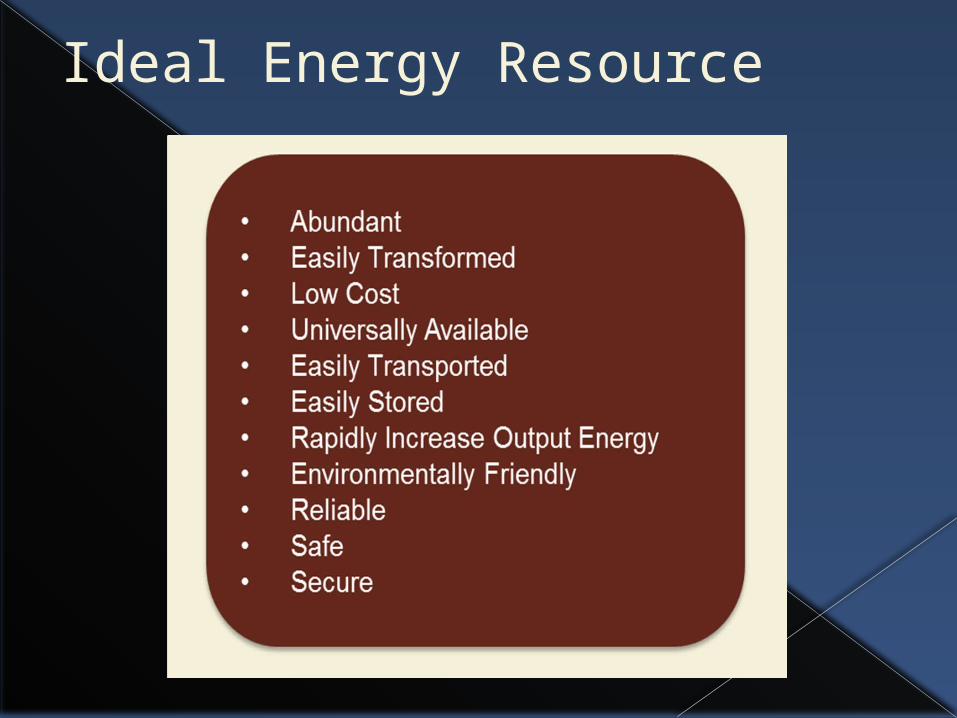
Ideal Energy Resource

Fuel Sources for Electric PowerOregon vs. US (2005) Oregon
(trillion BTU)› Coal: 35.4› Natural Gas: 89.8› Petroleum: 1› Nuclear: 0› Hydroelectric:
309.5› Biomass,
Geothermal, Solar, and Wind: 14.8.
United States (trillion BTU)› Coal: 20,737› Natural Gas:
6035.8› Petroleum: 2469› Nuclear: 8149› Hydroelectric: 2670› Biomass,
Geothermal, Solar, and Wind: 1,018

Challenge of Balancing the Power Grid in Oregon
Renewable Energy Growth –non Hydro› Independent Power Producers
(Aug 10-Aug 11)
OR 389-482 (megaWh) wind (362-455)
WA 266-366 (megaWh) wind (240-359)
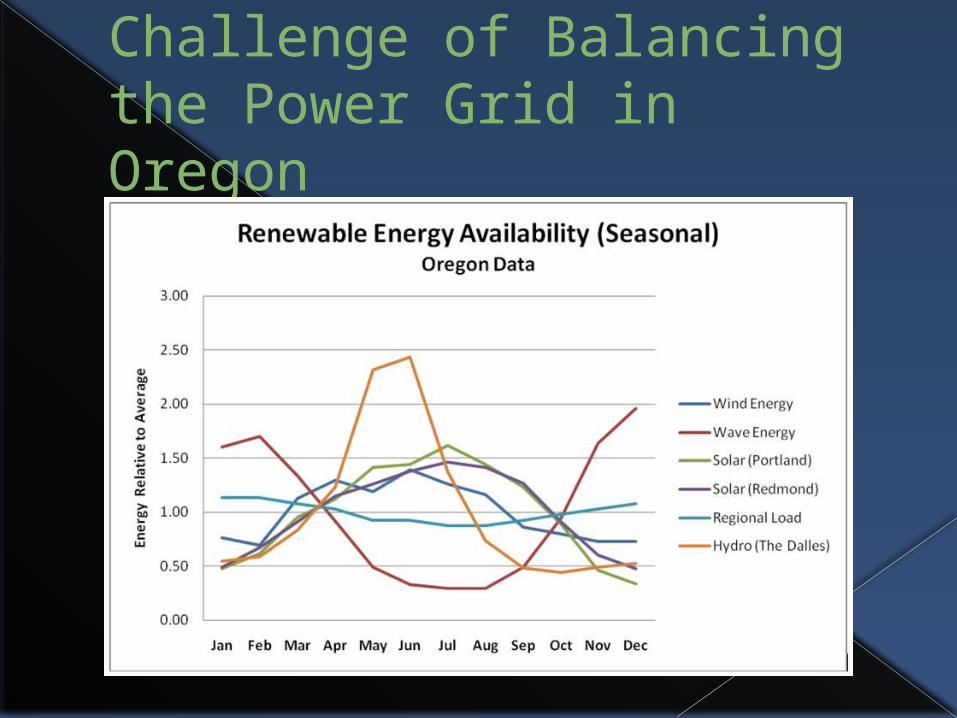
Challenge of Balancing the Power Grid in Oregon

Electric Energy Use patterns throughout the year

The ability to get wind power to the market is dependent on water flow conditions:Low Water Flow• Wind helps reduce import of other electricity sources (on-peak & off-peak)• Wind provides Increased utility export opportunitiesAverage Flow• Wind increases utility export opportunities to the limit of installedgeneration/tie-linesHigh Flow• Wind has virtually no value once tie-lines saturated with wind Kwh
Integrating Wind & Water in NW

Smart Grid
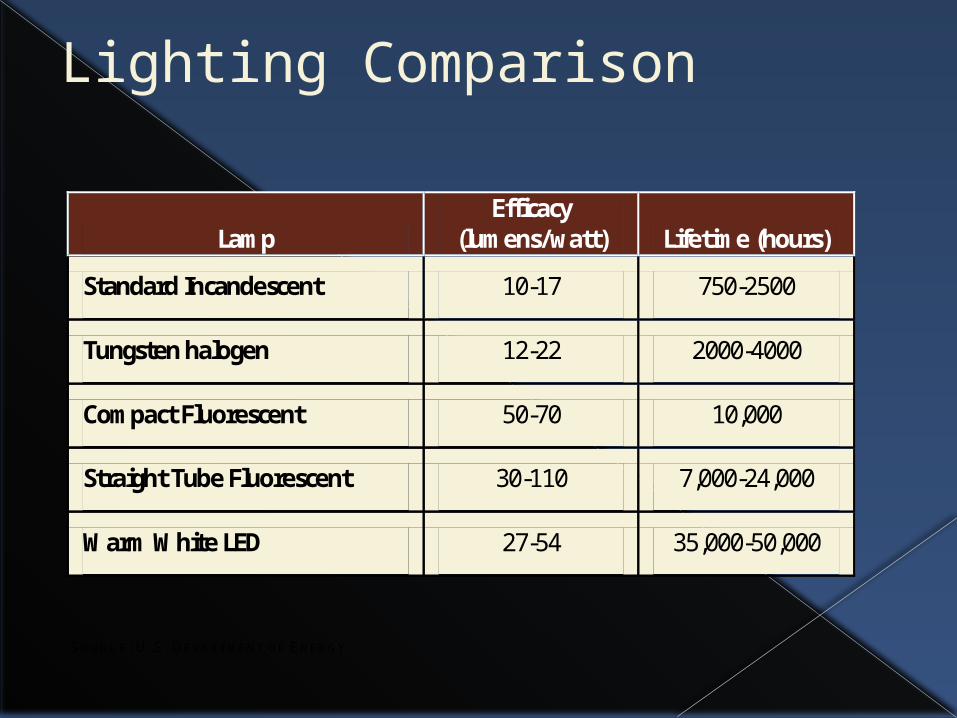
Lighting Comparison
Lamp Efficacy
(lumens/watt) Lifetime (hours)
Standard Incandescent 10-17 750-2500
Tungsten halogen 12-22 2000-4000
Compact Fluorescent 50-70 10,000
Straight Tube Fluorescent 30-110 7,000-24,000
Warm White LED 27-54 35,000-50,000 SOURCE: U.S. DEPARTMENT OF ENERGY
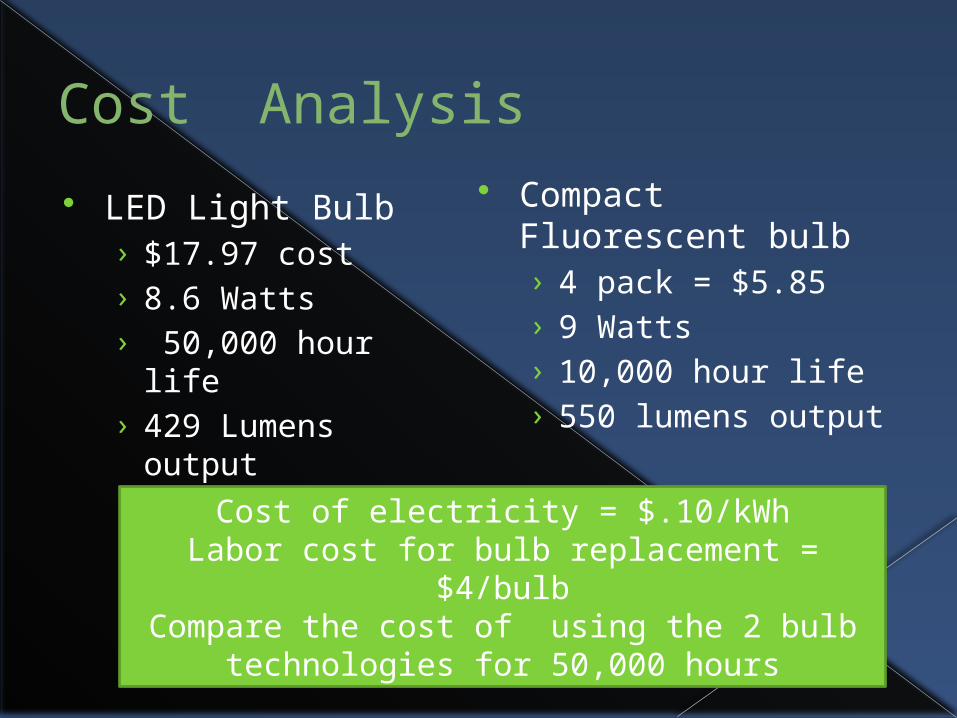
Cost Analysis
LED Light Bulb › $17.97 cost› 8.6 Watts› 50,000 hour life› 429 Lumens output
Compact Fluorescent bulb› 4 pack = $5.85› 9 Watts› 10,000 hour life› 550 lumens output
Cost of electricity = $.10/kWhLabor cost for bulb replacement = $4/bulb
Compare the cost of using the 2 bulb technologies for 50,000 hours

Lighting Investment Problem
LED CFL
Purchase price, $/Lamp $ 17.97 $ 1.46
Hours of operation 50,000 50,000
Lamp life 50,000 10,000
Lamps for 50,000 hours 1 5
Lamp cost for 50,000 hours $ 17.97 $ 7.31
Power, watts 8.6 9.0
Energy for 50,000 hours, kWh 430 450
Energy Cost , $/kWh $ 0.100 $ 0.100
Energy Cost for 50,000 hours, $ $ 43.00 $ 45.00
Bulb Replacement Cost, $/bulb $ 4.00 $ 4.00
Bulb Replacement Cost for 50,000 hours, $ $ 4.00 $ 20.00
Total cost for 50,000 hours $ 64.97 $ 72.31
Hours Operation x Power/1000

Class Cost Analysis Problem
Standard Incandescent bulb› 4 pack = $1.27› 60 Watts› 1,000 hour life› 860 Lumens output
Compact Fluorescent bulb› 4 pack = $5.85› 9 Watts› 10,000 hour life› 550 lumens output
Cost of electricity = $.10/kWhCompare the cost of using the different bulb
technologies for 10,000 hours.How many hours does it take to break even
with CFL?

Home or Commercial Energy AuditingSupport with a process /value stream map to improve efficiency

Estimate some of your daily appliance use
Appliance Power(Watts
)
Average
Usage(Hours/
Day)
Consumption
(KWh/Day)
Kitchen Appliances
Cooker stove 3000 0.6 1.8 Cooker Oven 5000 0.4 2
Cooker Microwave
1700 0.2 0.34
Grill 1000 0.1 0.1 Barbeque 3000 0.01 0.03
Extractor Fan 200 0.3 0.06 Dish Washer 1000 3 3
Washing Machine
1000 1.5 1.5
Spin Dryer 3000 1 3 Refrigerator 300 4 1.2
Freezer 400 4 1.6 Food Mixer 500 0.04 0.02
Kettle 3000 0.25 0.75 Coffee Maker 800 0.25 0.2
Iron 2000 0.25 0.5 Toaster 1000 0.02 0.02 Garbage Disposal
500 0.04 0.02
Appliance Power(Watts)
AverageUsage(Hours/
Day)
Consumption(KWh/Day)
Personal Care
Hair Dryer 1500 0.05 0.075 Hot Rollers 350 0.1 0.035
Shaver 13 0.05 0.00065 Toothbrush 13 0.05 0.025
Clock 3 24 0.072Computer
Equipment Desktop 300 3 0.9 Laptop 100 2 0.2 Printer 200 0.1 0.02
Scanner 100 0.04 0.004 Fax 60 0.1 0.006
Broadband Equipment
10 24 0.24
Entertainment Equipment
Television (2 Sets) 600 5 3.0
DVD 200 1 0.2 Audio Equipment 100 1 0.1
Video Games 50 1 0.05
Standby Modes
TV 3 24 0.072 DVD 3 24 0.072 Radio 3 24 0.072
Set top Box 3 24 0.072 Fax Machine 3 24 0.072
Cordless phones (4) 12 24 0.288
Answering Machine 3 24 0.072
Computer 6 24 0.144 Printer 3 24 0.072
Kitchen Appliances (3)
9 25 0.225
Radio Alarm Clock 5 24 0.12

Class Exercise
Just considering your kitchen and living room:› Identify the number of appliance› Determine your hours of operation and the
watts used.
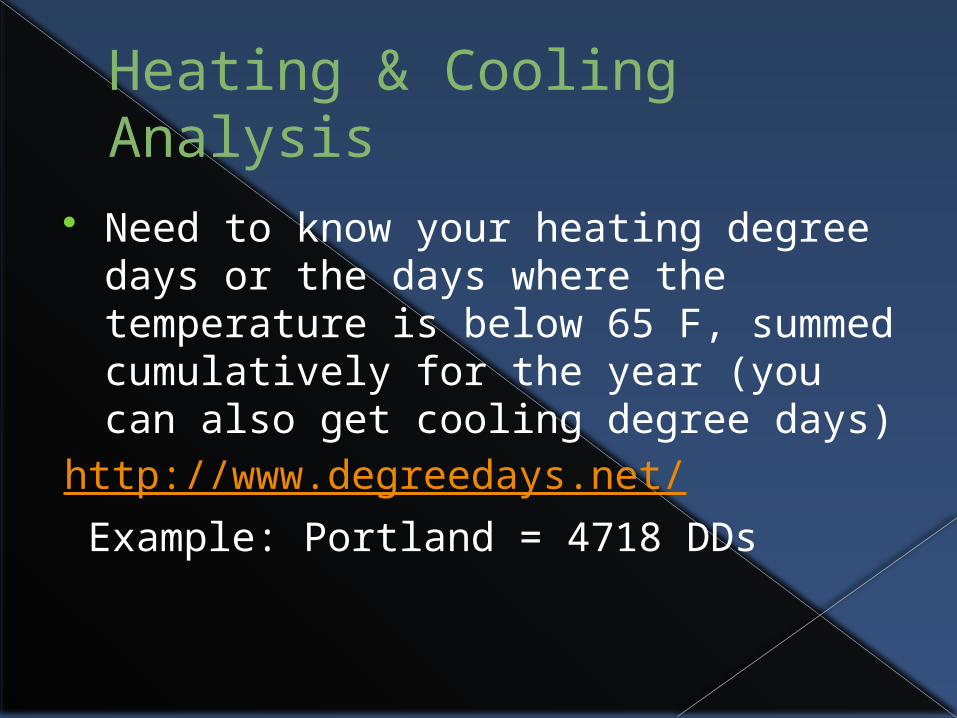
Heating & Cooling Analysis
Need to know your heating degree days or the days where the temperature is below 65 F, summed cumulatively for the year (you can also get cooling degree days)
http://www.degreedays.net/ Example: Portland = 4718 DDs

Insulation vs. Heating Cost
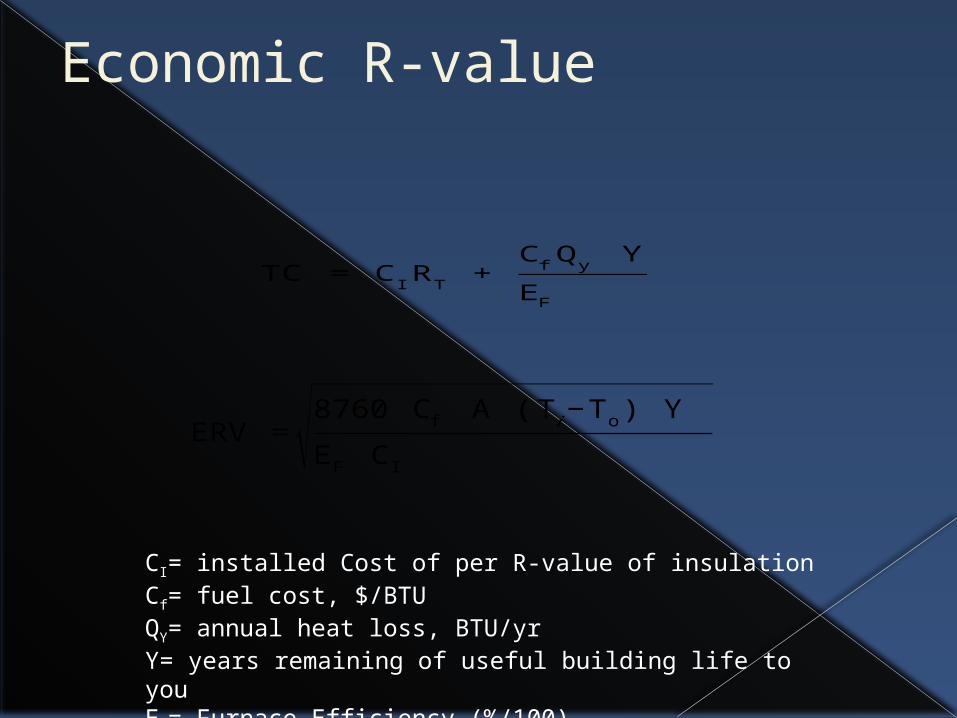
Economic R-value
TC = CIRT + CfQ y Y
EF
ERV =√8760 Cf A ( T𝒊−To ) Y EF CI
CI= installed Cost of per R-value of insulationCf= fuel cost, $/BTUQY= annual heat loss, BTU/yrY= years remaining of useful building life to youEf= Furnace Efficiency (%/100)

Investing in more insulation
A Portland Four Square Home owner is considering adding blown insulation to a 1000 sqft attic space (R value = 3R/inch)
Marginal cost of natural gas = $1.31 per therm
Cost of insulation = $.0425 per R for each square foot
Assuming a building life of 30 years and a furnace efficiency of 85%. What is the economic R-value to install?
Payback period of investment?

Calculation ERV
CI 0.0425 Cost of Insulation
Cf 0.0000131 Cost of fuel ( therm = 100000 BTUs)A 1 square footHDD 4718 Average Yearly Degree days
Ti- To 12.93 HDD/365 daysY 30 Building life
Ef 0.85 Furnace Efficiency
ERV
35.1 SQRT (8760*Cf*A*(Ti-To)*Y/(Ef Ct)) From Energy Chapter pg. 30

Calculation of Cost Savings:
Existing Ceiling Energy Use Insulation Depth = 35.1 R/3 R/inch =12 inch Insulation Cost = $.0425/R (35 R)*1000sq ft= $1487.5Assume existing ceiling R= 4Q existing = A* average DD/day/R= 1000*12.93/4= 3235 BTU/hrAdjust for furnace and estimate annual heat
loss= (3235/.85) *(24*365/100,000 Btu/therm)= 333.4 therms per year
@ $1.31/therm= $437
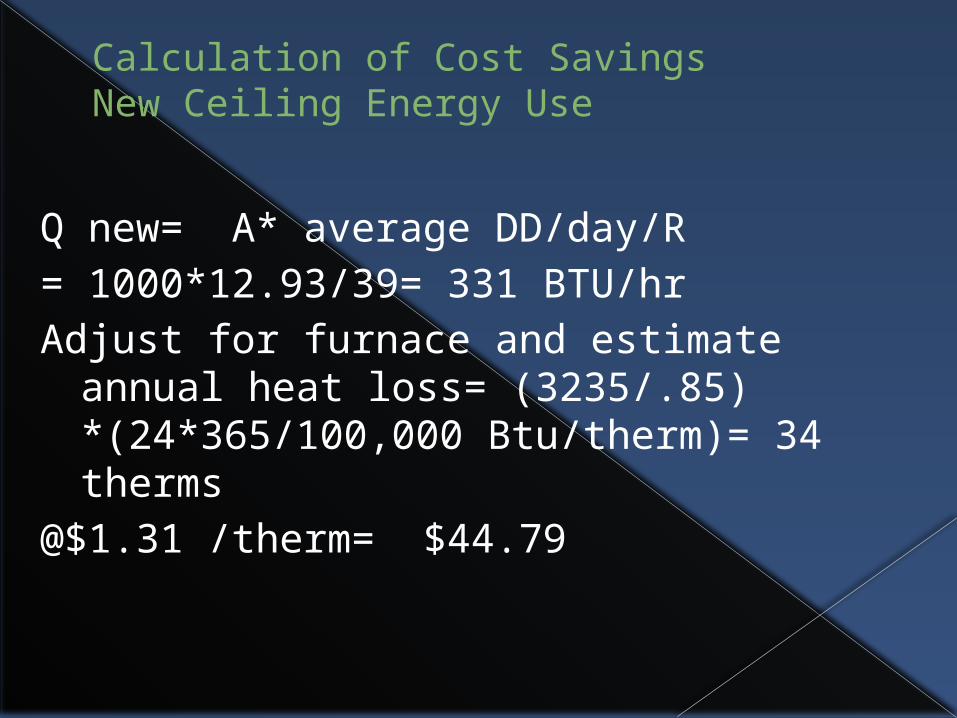
Calculation of Cost SavingsNew Ceiling Energy Use
Q new= A* average DD/day/R= 1000*12.93/39= 331 BTU/hrAdjust for furnace and estimate annual
heat loss= (3235/.85) *(24*365/100,000 Btu/therm)= 34 therms
@$1.31 /therm= $44.79

2011 Auto Statistics
Car Sticker $
Average MPG
Kwh/100 miles
Ford Escape 30,570 34 Hybrid
Toyota Prius 26,400 44 Hybrid
Nissan Leaf 32,780 35 Electric
Toyota Highlander
37,305 17 Traditional

Comparisons
Assume that you drive the same amount of miles with each car (12,000 miles or your choice)› Calculate gallons of gas or kwh of electricity used per year.
Assume that gas will cost $4/gal and electricity is $.12/kWh › Translate your gas or electric use into $
Calculate your total Life Cycle Cost of your choices (estimate the total life of your car)› Sticker plus gas cost for say 10 to 15 years of ownership› Calculate the breakeven miles
StickerA + fuelA $/mi (M miles)=Sticker B+fuel B $/mi (M miles)Solver for M.

Case Development
Solar Photovoltaic projects are popular Opportunity to integrate
› Forecasting methods Seasonal adjustment Trend adjusted exp. Smoothing
› Solar Radiation data is available for many cities in the US to estimate energy generation
› Break-even, return on investment calculations› Implications of policy shifts to remove
incentives at different levels. Discussion points

Case Story
A sustainability manager at a brewery in Bend, OR has energy use and photovoltaic system energy generation data for comparable Portland brewer.
Assuming similar energy needs and a similar 4.7 KW photovoltaic system, how can she use this data to calculate the daily energy flows (in or out) and the financial benefits of the system.

Additional information provided Current cost of
system All relevant
incentives Net-metering rate
per kilowatt-hour from local utility
Daily energy use and energy generated for one year.

Appendix: Portland Energy Data(Available in Spreadsheet Solar Home Case Data.xls)
Daily Data: August 31, 2010 to August 31, 2011
Date & Time Electricity Use Solar Generation Net from/to Grid
kilowatthours kilowatthours kilowatthours
Totals for the year 8165.38 4069.10 4140.88
8/31/2010 1:00 10.39 4.80 5.60
9/1/2010 1:00 12.02 7.41 4.62
9/2/2010 1:00 10.51 23.44 -12.93
9/3/2010 1:00 14.48 21.55 -7.06
9/4/2010 1:00 11.32 18.60 -7.28
9/5/2010 1:00 10.44 10.13 0.30
9/6/2010 1:00 13.57 22.15 -8.58
9/7/2010 1:00 8.92 5.30 3.62
9/8/2010 1:00 11.39 11.19 0.20

JAN FEB MAR APR MAY JUN JUL AUG SEP OCT NOV DEC ANNUALOREGONASTORIA 3 3 3 3 3 3 6 6 8 5 3 3 38BURNS 5 6 6 5 9 12 19 20 16 12 6 5 120EUGENE 2 3 3 4 6 8 16 14 12 5 2 1 75MEACHAM 3 3 3 4 6 9 20 18 13 8 4 3 94MEDFORD 3 4 5 6 9 13 23 22 18 10 3 2 117PENDLETON 2 3 5 5 8 10 19 18 15 10 4 3 101PORTLAND 3 3 3 3 5 6 13 11 10 5 3 2 68SALEM 3 3 4 4 6 7 15 14 11 6 3 2 77SEXTON SUMMIT 5 4 5 6 9 13 23 21 17 11 6 5 126
Number of Sunny Days in Oregon Cities

Daily Average Global Data (2004 -10)
average daily KWhr/meter^2 per Day
Portland-PSU, OR Latitude: 45.51 degrees; Longitude: 122.69 degrees and Altitude: 70 metersYear\Mth Jan Feb Mar Apr May Jun Jul Aug Sep
Oct Nov Dec Yearly2004 ---- 1.91* 3.29 4.83 4.48 5.77 6.20 4.95 3.49
2.31 1.28 0.83* ----2005 1.15 2.47 2.87 3.60 4.38 4.92 6.37 5.66 4.10
1.95 1.34 0.84 3.312006 0.76 2.00 2.63 4.35 5.27 5.66 6.25 5.46 4.27
2.49 0.90 0.95 3.422007 1.28 1.50 2.52 3.87 5.65 5.51 5.87 4.95 3.75
2.02 1.39 0.63 3.252008 1.00 1.94 2.52 3.74 4.25 5.24 6.07 4.58 4.15
2.38 1.06 0.79 3.152009 1.25 1.77 2.47 4.24 5.98 5.11 6.25 4.52 3.84
1.98 1.15 0.99 3.302010 0.78 1.88 2.76 3.85 4.62 4.71 5.95 4.82 3.21
2.14 1.00 0.69 3.04Average 1.04 1.92 2.72 4.07 4.95 5.28 6.14 4.99 3.83
2.18 1.16 0.82 3.26% SD 22 15 11 11 14 7 3 9 10
10 16 16 4Values in average daily KWhr/meter^2 per Day* Less than 15 days of data in month. Univ. of Oregon Solar Radiation Monitoring Lab.Bend-SSE, OR. Latitude: 44.06 degrees; Longitude: 121.31 degrees and Altitude: 1124 metersYear\Mth Jan Feb Mar Apr May Jun Jul Aug Sep
Oct Nov Dec Yearly2004 ---- 2.67 3.82 5.36 5.91 6.89 7.15 5.64 4.80
3.12 1.88 1.26 ----2005 1.37 2.64 3.62 4.57 5.22 6.52 7.32 6.54 4.97
3.35 1.66 1.30 4.092006 1.32 2.65 3.52 5.07 6.14 6.68 7.24 6.26 5.01
3.47 1.80 1.41 4.222007 1.53 2.20 3.92 5.05 6.63 6.74 6.73 6.45 4.99
3.24 1.96 1.28 4.232008 1.68 2.80 4.11 5.27 5.37 7.28 7.16 6.18 5.08
3.21 1.64* 1.44 4.272009 1.78 2.41 3.71 5.24 6.70 6.70 7.30 6.11 5.08
2.97 2.06 1.29 4.292010 1.34 2.41 4.04 4.94 5.88 6.55 7.29 6.28 4.39*
3.18 1.80 1.24 4.12Average 1.50 2.54 3.82 5.07 5.98 6.77 7.17 6.21 4.90
3.22 1.83 1.32 4.20% SD 13 8 6 5 9 4 3 5 5
5 8 6 2Values in average daily KWhr/meter^2 per Day * Less than 15 days of data in month.
Univ. of Oregon Solar Radiation Monitoring Lab.Data from: http://solardat.uoregon.edu/SelectCumulativeSummary.html

Tasks for Case
Questions Plot the existing data and using the most
appropriate method, create a forecast of 365 days worth of data for Portland, OR. (use the existing data for solar radiation generation for that facility and a forecast method that will create an average baseline).
Create monthly seasonal indices to adjust the Portland forecast data to Bend and recalculate the energy needs of the Bend Brewery.

Tasks-continues
Calculate the break-even point for both the Portland and Bend breweries, considering how the capital improvement to the facility and return on investment factor into your decision.
If the Oregon State and Federal Tax incentives are eliminated but Energy Trust’s incentives continue to subsidize solar projects, how do your financial numbers change?
How does the scenario in question 4 change if electricity prices double (on average) in the next 20 years?