Embed Size (px)
Citation preview
PRAGMATEK Consulting Group, Ltd. 2000
Alignment of Executive Strategy with Operational Execution
through Performance Dashboards
Association for Strategic Planning
Minnesota ChapterDecember 19, 2006

PRAGMATEK Consulting Group, Ltd. 2006
Agenda
Value Proposition Which Metrics? Project Approach Technology Pitfalls Question and Answer
PRAGMATEK Consulting Group, Ltd. 2006
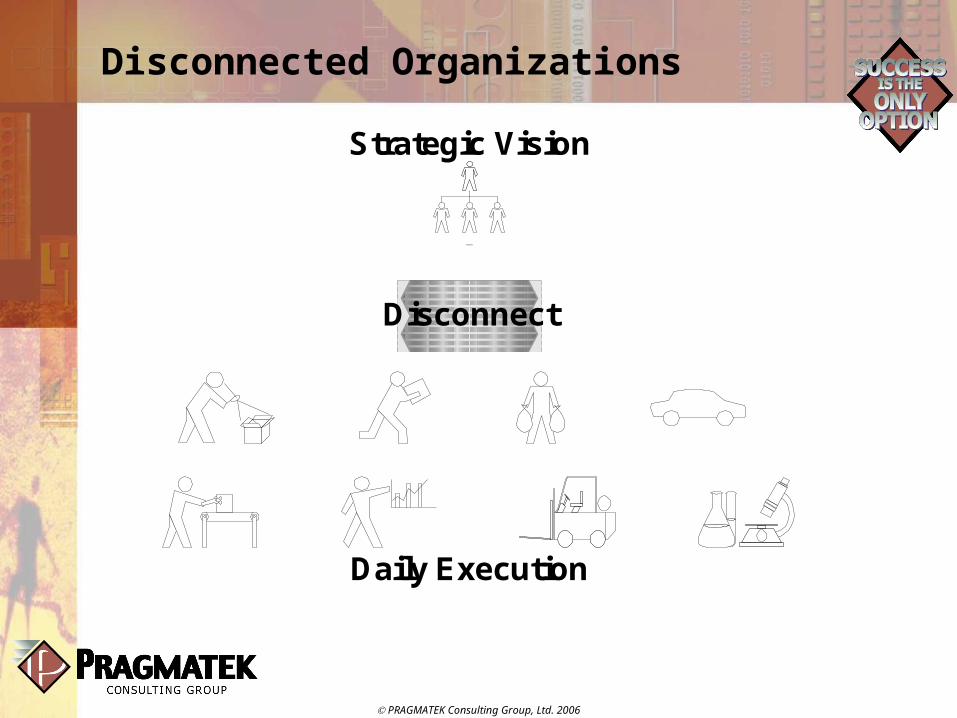
Disconnected Organizations
Shipping
$$
TreasurerQuality Assurance
Manufacturing Marketing Warehouse
Motorpool
Research & Development
Management
Strategic Vision
Daily Execution
Disconnect
PRAGMATEK Consulting Group, Ltd. 2006
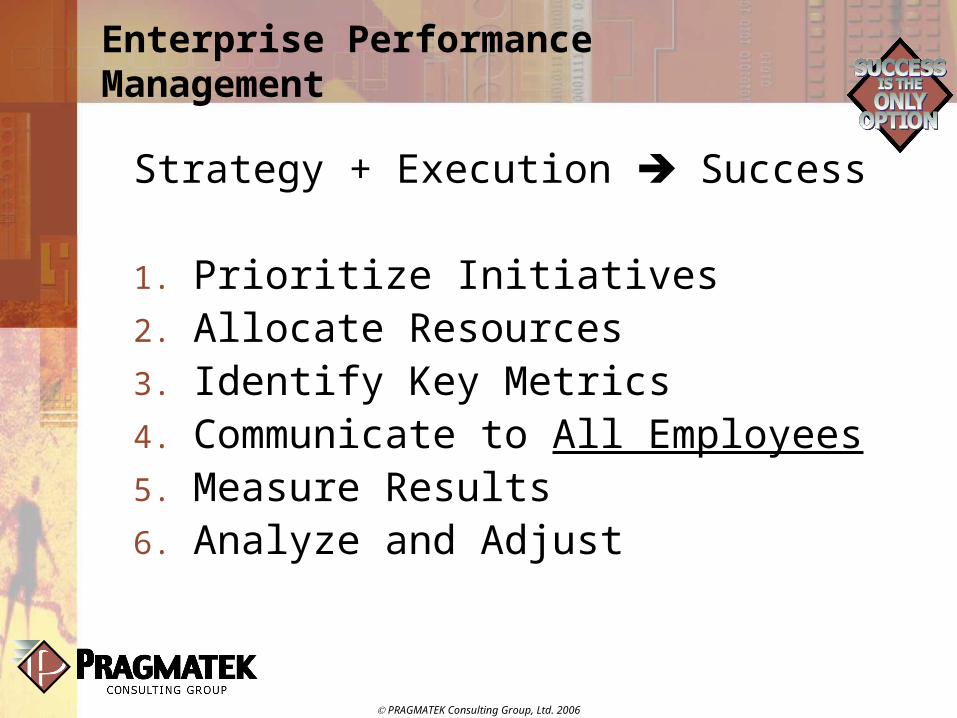
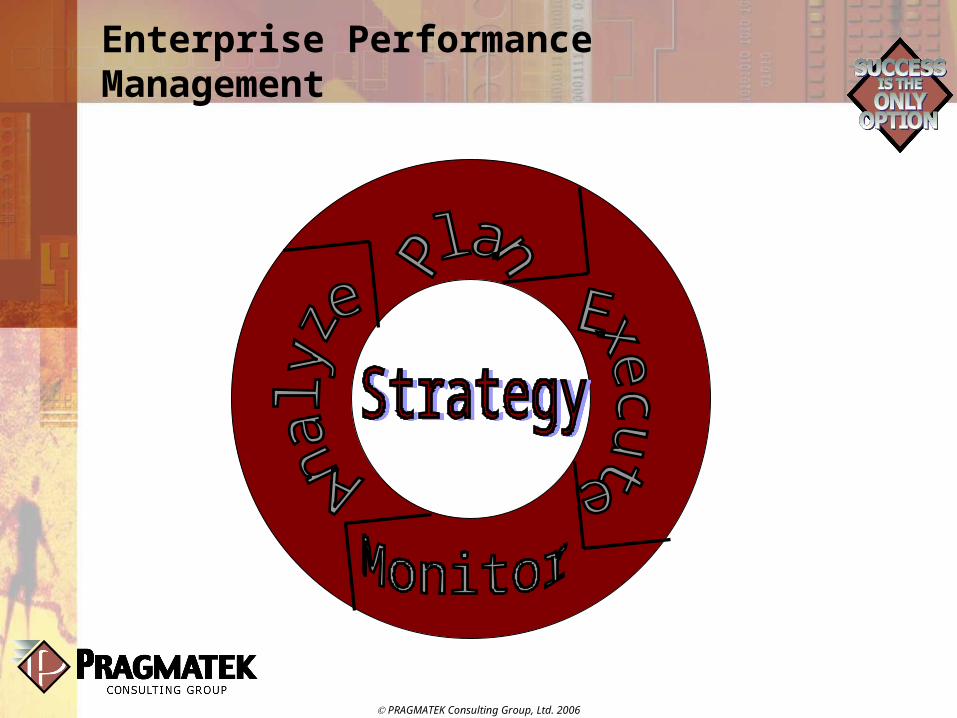
Enterprise Performance Management
Strategy + Execution Success
1. Prioritize Initiatives2. Allocate Resources3. Identify Key Metrics4. Communicate to All Employees5. Measure Results6. Analyze and Adjust
PRAGMATEK Consulting Group, Ltd. 2006
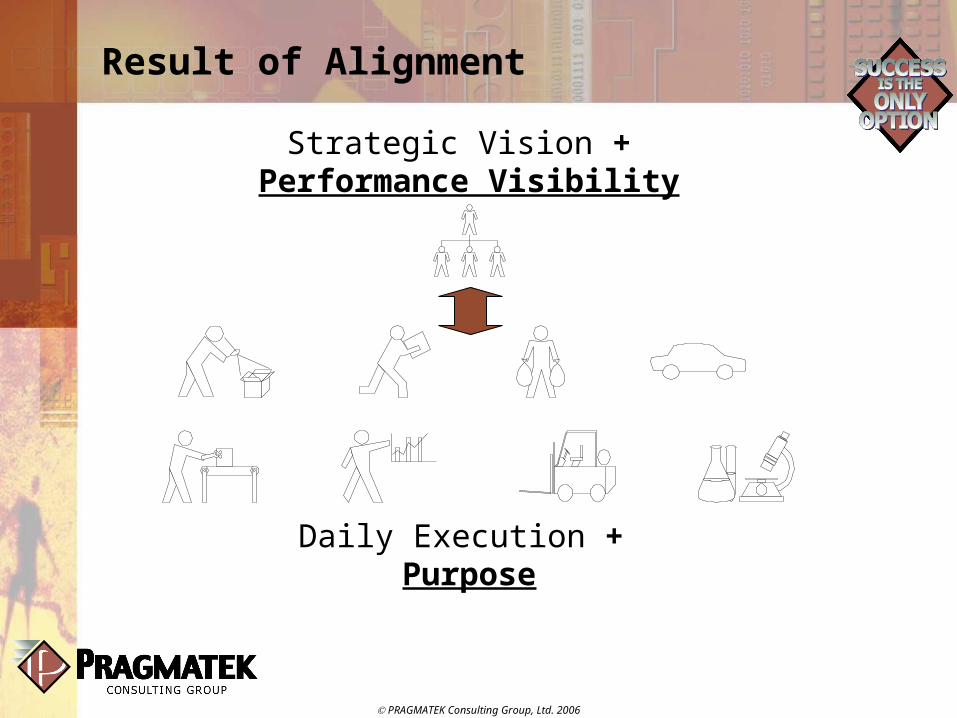
Result of Alignment
Shipping
$$
TreasurerQuality Assurance
Manufacturing Marketing Warehouse
Motorpool
Research & Development
Management
Strategic Vision +Performance Visibility
Daily Execution +Purpose
PRAGMATEK Consulting Group, Ltd. 2006
Enterprise Performance Management
PRAGMATEK Consulting Group, Ltd. 2006
Why Build a Dashboard?
Single, consistent version of truth for performance management Executive visibility Employee alignment
Easily accessible throughout organization Up-to-date information Flexible solution
Simple for casual users Advanced drill down and analysis for power
users
PRAGMATEK Consulting Group, Ltd. 2006
Return on Investment (ROI)
Proactively identify potential issues Exceptions – red, yellow, green Knowledge Mgmt – send email notification
Support root-cause analysis Learn from competitive analysis
Which business unit is best in class? Explain performance results for future learning Streamline communication efforts Focus operational excellence
PRAGMATEK Consulting Group, Ltd. 2006
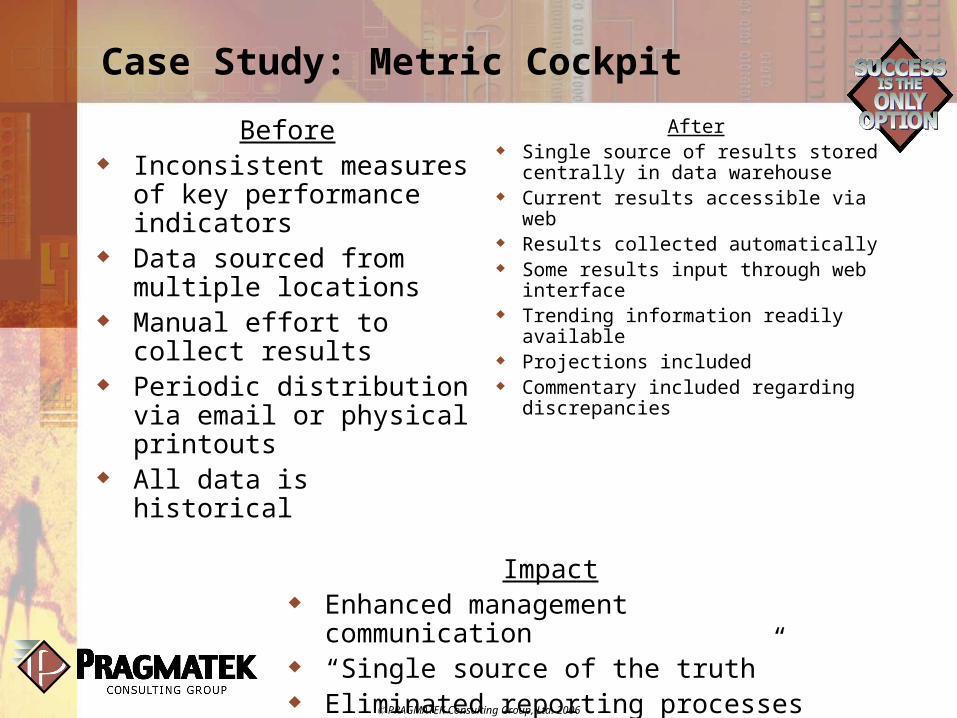
Case Study: Metric Cockpit
After Single source of results stored
centrally in data warehouse Current results accessible via web Results collected automatically Some results input through web
interface Trending information readily
available Projections included Commentary included regarding
discrepancies
Before Inconsistent measures of
key performance indicators
Data sourced from multiple locations
Manual effort to collect results
Periodic distribution via email or physical printouts
All data is historical
Impact Enhanced management
communication “Single source of the truth” Eliminated reporting processes

PRAGMATEK Consulting Group, Ltd. 2006
Agenda
Value Proposition Which Metrics? Project Approach Technology Pitfalls Question and Answer
PRAGMATEK Consulting Group, Ltd. 2006
Key Performance Metrics
Should be actionable and/or manageable Must be understood by every member of
the audience Remember to include a definition link from
the dashboard! In many cases, the ultimate source will be
dependent upon company-specific definitions and application system usage
Value is found when showing trend, targets, or relationship with other metrics
PRAGMATEK Consulting Group, Ltd. 2006
Human Resources Metrics
Headcounts New hires Outgoing employees Average length of service Minority percentages Full-time vs. part-time Hiring rates Open positions
PRAGMATEK Consulting Group, Ltd. 2006
Finance Metrics
Budget vs. actual spent Cost center Internal order or project
Plan vs. actual financial statements Profit center Company code
Profitability Economic Value Added (EVA) Production cost variances Days sales outstanding (A/R vs. Sales) Miscellaneous cross-functional possibilities
PRAGMATEK Consulting Group, Ltd. 2006
Sales Metrics
Incoming orders, shipments, and invoices Order fulfillment (production and delivery
performance) Sales backlog (open orders) Cycle times (order processing) Pricing variations Returns Product sales mix Quotations close rate
PRAGMATEK Consulting Group, Ltd. 2006
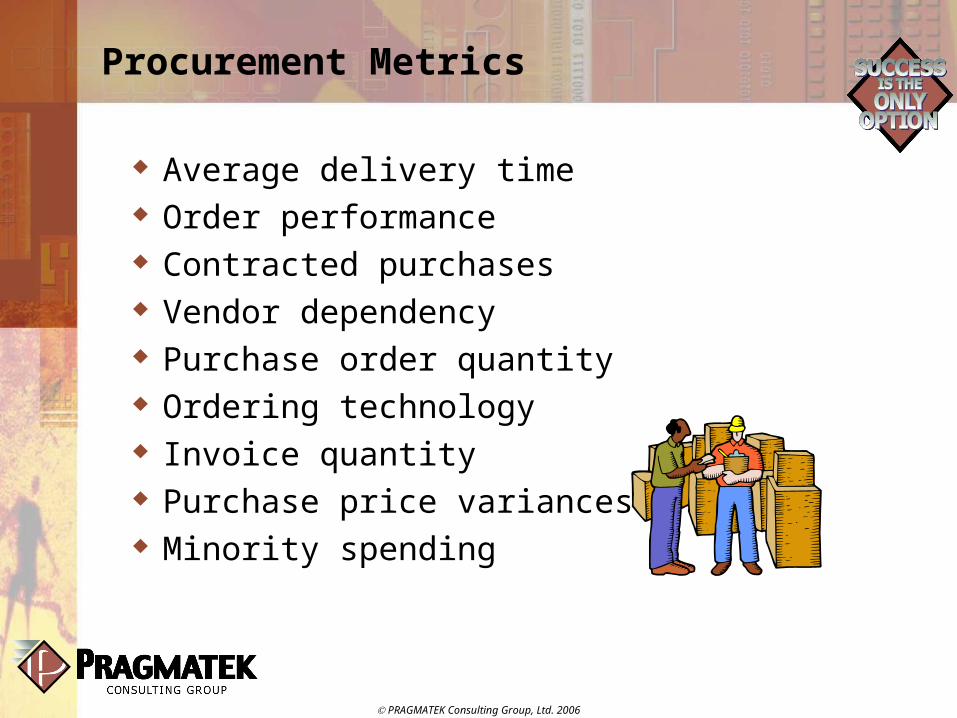
Procurement Metrics
Average delivery time Order performance Contracted purchases Vendor dependency Purchase order quantity Ordering technology Invoice quantity Purchase price variances Minority spending
PRAGMATEK Consulting Group, Ltd. 2006
Agenda
Value Proposition Which Metrics? Project Approach Technology Pitfalls Question and Answer
PRAGMATEK Consulting Group, Ltd. 2006
General Statement of Direction
Start with the end goal in mind Consider developing front-end first – then
fill in the technical details Favor Strategic Iterations over “Big Bang”
or “Uncoordinated Projects” approaches Maximize Return on Investment (ROI) and
reduce Total Cost of Ownership (TCO) Capture and sustain momentum through
entire project lifecycle Provide many opportunities to refine
requirements
PRAGMATEK Consulting Group, Ltd. 2006
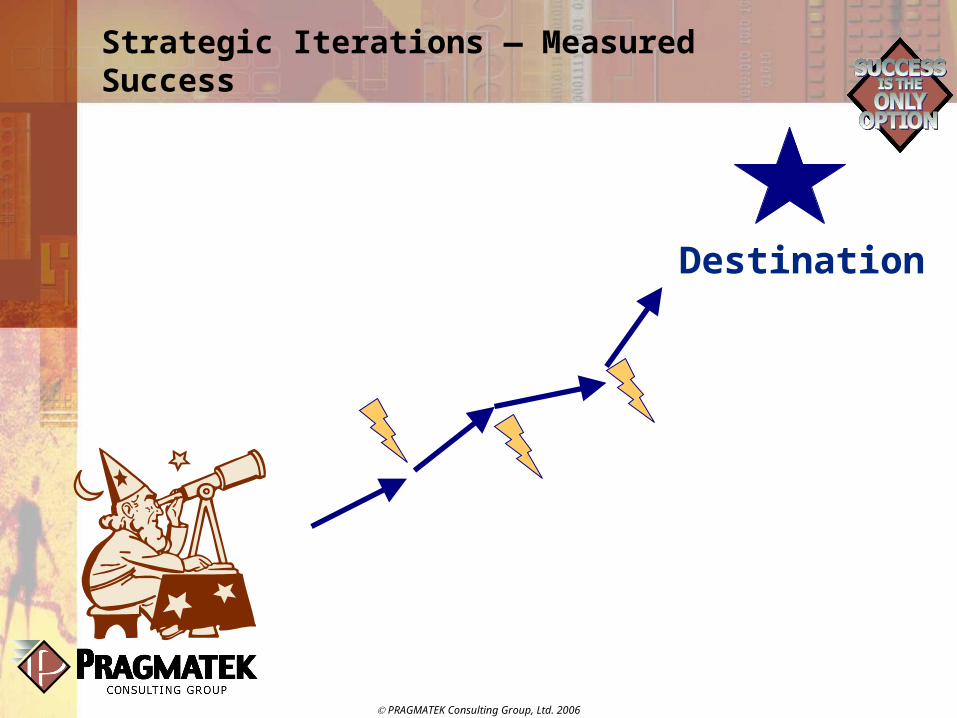
Strategic Iterations — Measured Success
Destination
PRAGMATEK Consulting Group, Ltd. 2006
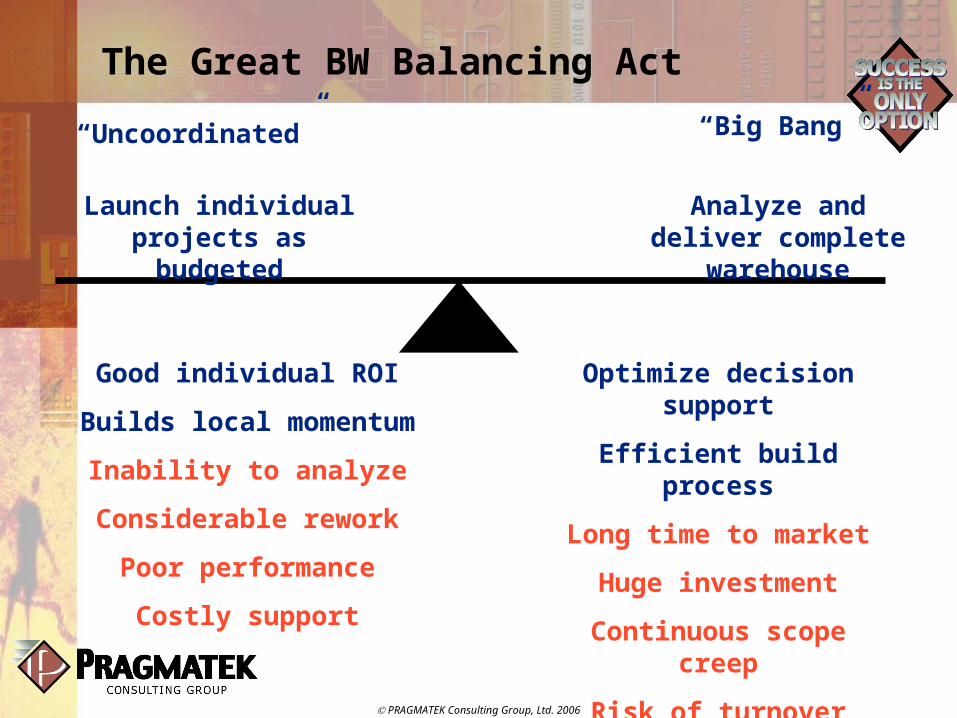
The Great BW Balancing Act
Launch individual projects as budgeted
Analyze and deliver complete warehouse
Good individual ROI
Builds local momentum
Inability to analyze
Considerable rework
Poor performance
Costly support
Optimize decision support
Efficient build process
Long time to market
Huge investment
Continuous scope creep
Risk of turnover
“Big Bang”“Uncoordinated”
PRAGMATEK Consulting Group, Ltd. 2006
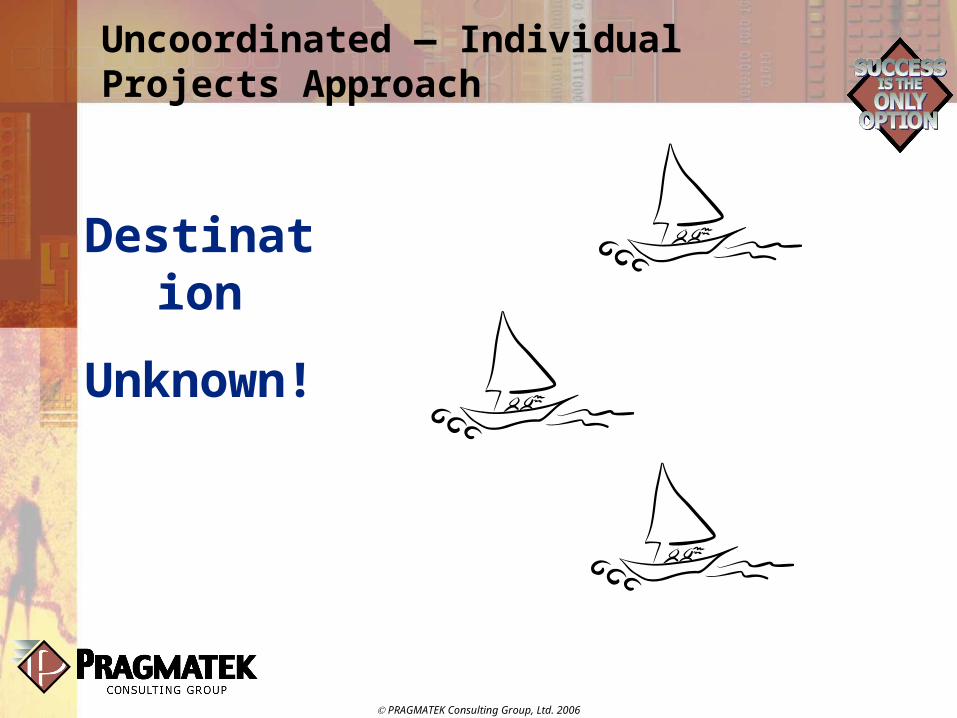
Uncoordinated — Individual Projects Approach
Destination
Unknown!

PRAGMATEK Consulting Group, Ltd. 2006
Big Bang — Complete Warehouse Approach
Like driving with a microscope – you may arrive at your
destination, but the journey will be slow
and inefficient
PRAGMATEK Consulting Group, Ltd. 2006
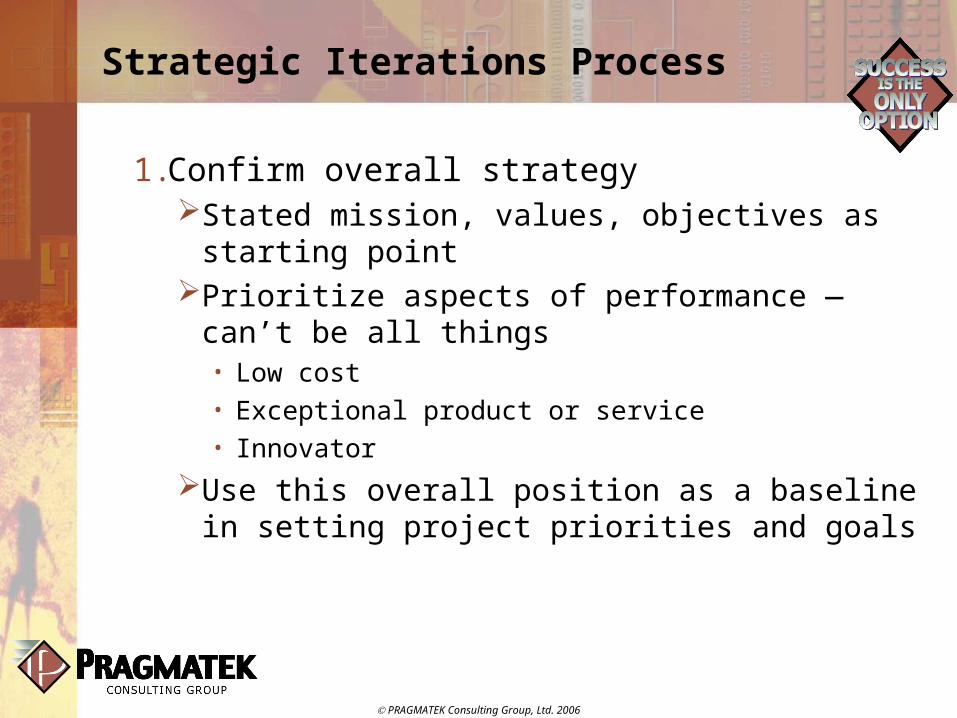
Strategic Iterations Process
1.Confirm overall strategyStated mission, values, objectives as
starting pointPrioritize aspects of performance — can’t
be all things• Low cost• Exceptional product or service• Innovator
Use this overall position as a baseline in setting project priorities and goals
PRAGMATEK Consulting Group, Ltd. 2006
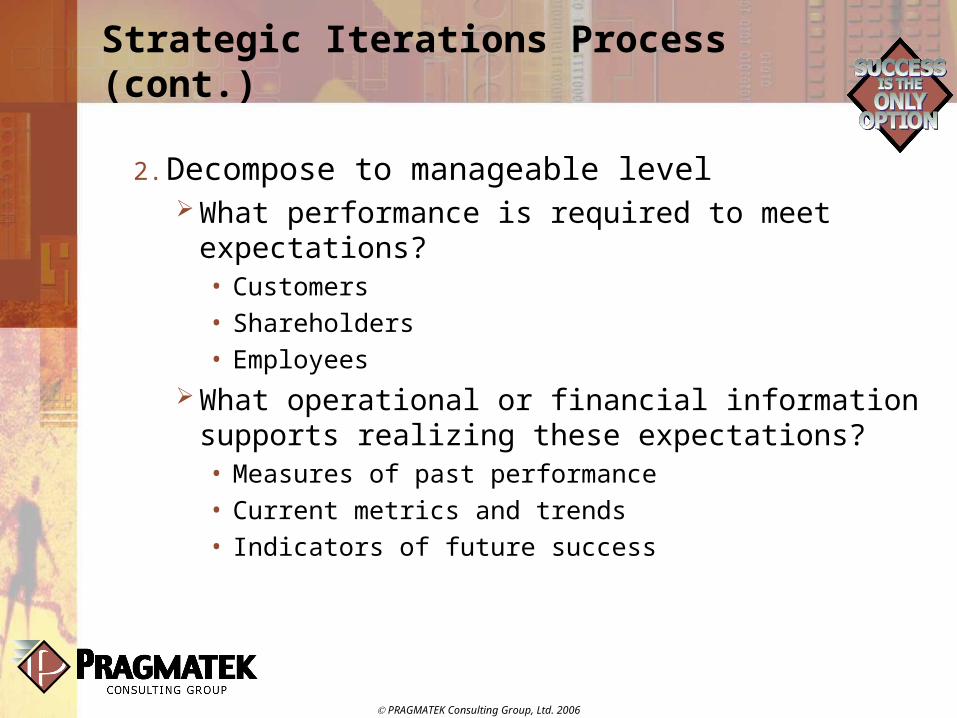
Strategic Iterations Process (cont.)
2. Decompose to manageable level What performance is required to meet
expectations?• Customers• Shareholders• Employees
What operational or financial information supports realizing these expectations?• Measures of past performance• Current metrics and trends• Indicators of future success
PRAGMATEK Consulting Group, Ltd. 2006
Strategic Iterations Process (cont.)
3. Identify decision points Investment in promotional activities
• Sales information• Competitor data
Continuous improvement opportunities• Returns• Customer feedback
Inventory carrying cost reduction• Forecast accuracy• Production lead times• Order fulfillment performance
PRAGMATEK Consulting Group, Ltd. 2006
Strategic Iterations Process (cont.)
4. Build core metric matrix Measure Characteristics Source Value
• How well does this support decisions?
PRAGMATEK Consulting Group, Ltd. 2006
Core Metric Matrix
Measure
TimeCust.
Product
Product-ion Org.
CompanySource(s)
Value
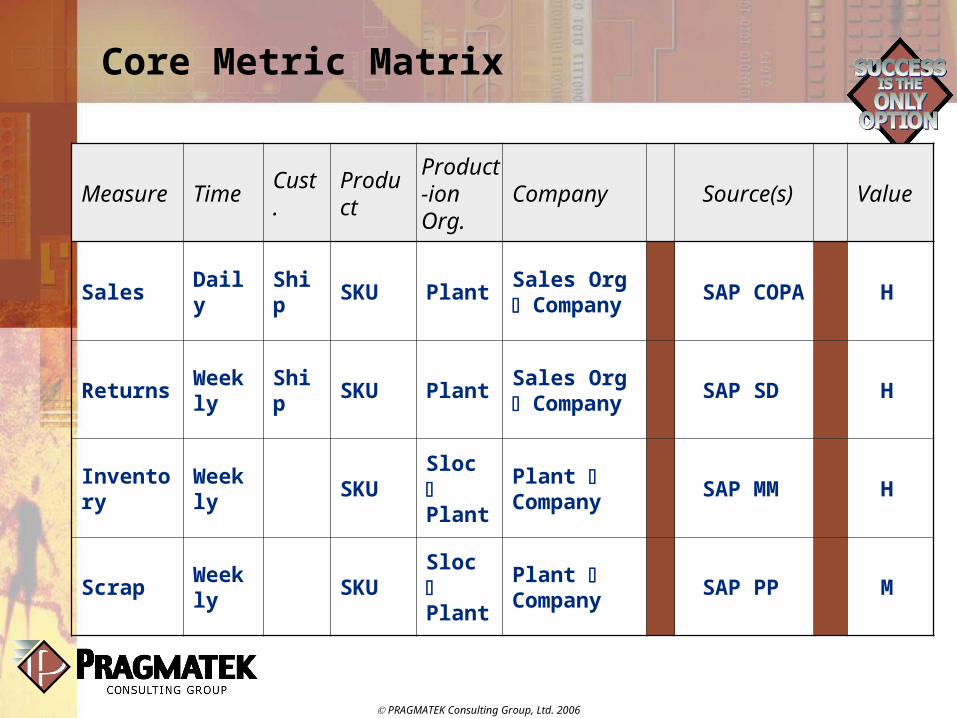
Sales Daily Ship SKU PlantSales Org Company
SAP COPA H
Returns Weekly Ship SKU PlantSales Org Company
SAP SD H
Inventory Weekly SKUSloc Plant
Plant Company
SAP MM H
Scrap Weekly SKUSloc Plant
Plant Company
SAP PP M
PRAGMATEK Consulting Group, Ltd. 2006
Strategic Iterations Process (cont.)
5. Identify prerequisites and dependencies• For example, must have sales before
forecast accuracy
6. Derived metrics Identify cross-functional relationships Validate level of detail is supportive For example, order fulfillment by
material, but forecast accuracy by material group
PRAGMATEK Consulting Group, Ltd. 2006
Strategic Iterations Process (cont.)
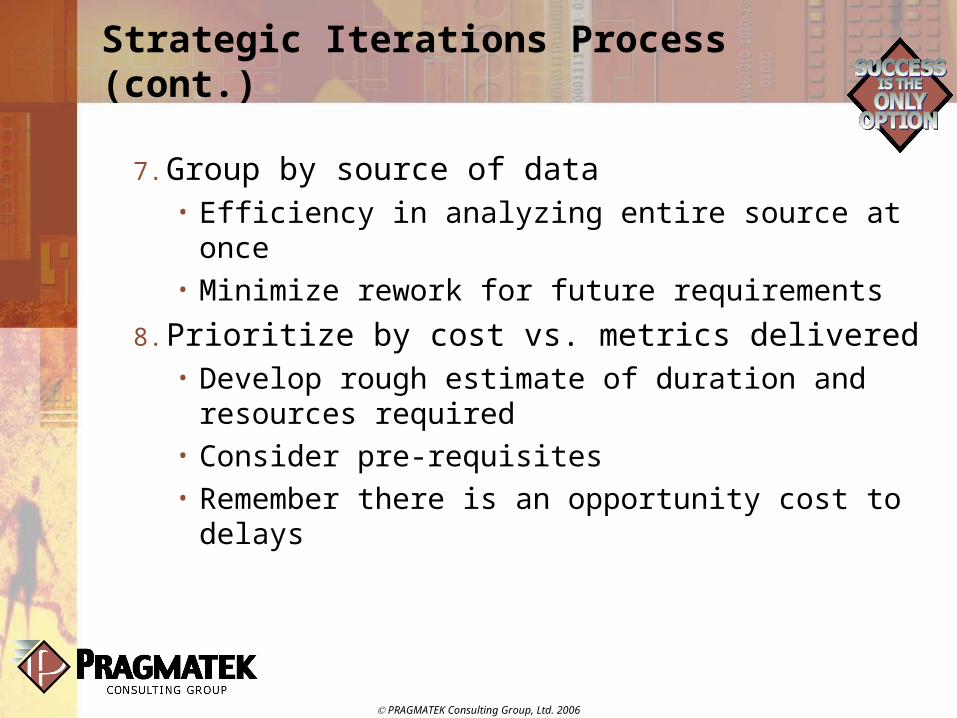
7. Group by source of data• Efficiency in analyzing entire source at once• Minimize rework for future requirements
8. Prioritize by cost vs. metrics delivered• Develop rough estimate of duration and
resources required• Consider pre-requisites• Remember there is an opportunity cost to
delays
PRAGMATEK Consulting Group, Ltd. 2006
Strategic Iterations Process (cont.)
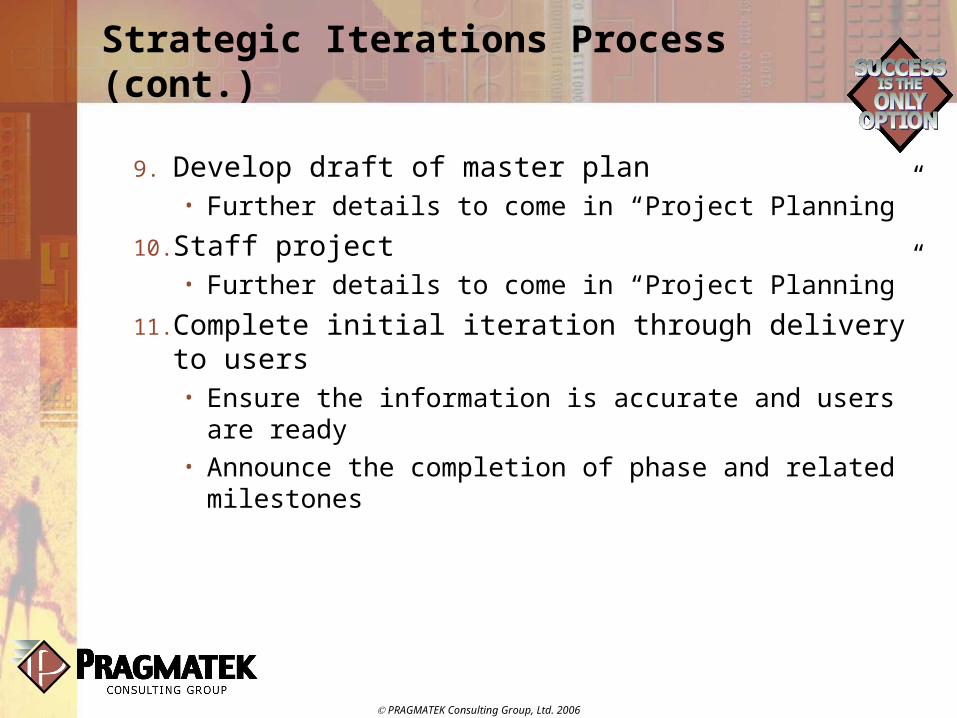
9. Develop draft of master plan• Further details to come in “Project Planning”
10.Staff project• Further details to come in “Project Planning”
11.Complete initial iteration through delivery to users• Ensure the information is accurate and users
are ready• Announce the completion of phase and
related milestones
PRAGMATEK Consulting Group, Ltd. 2006
Milestones
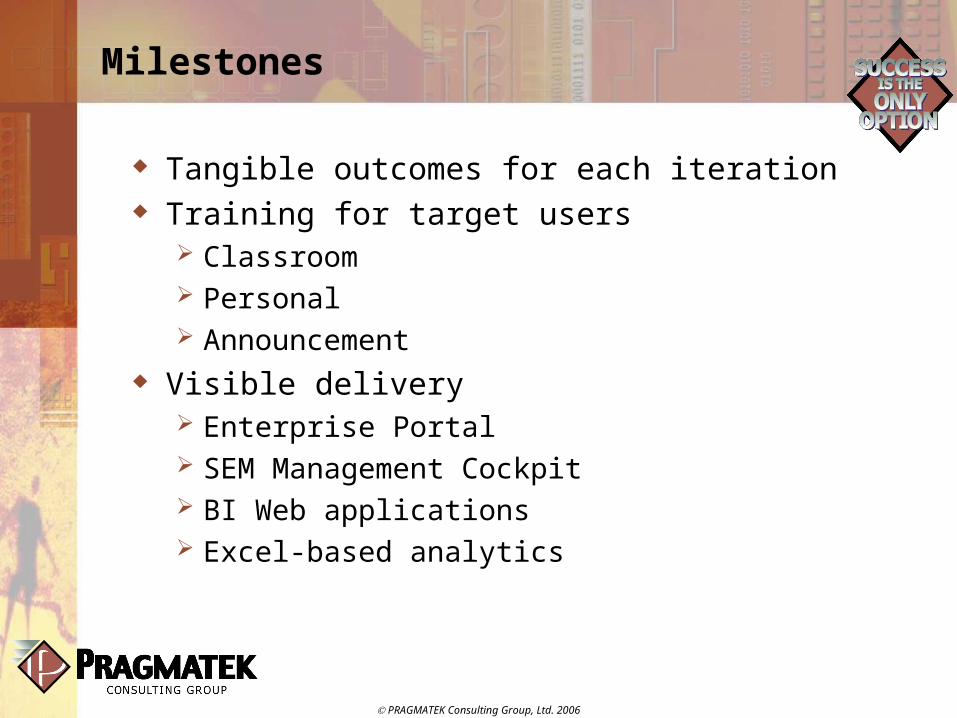
Tangible outcomes for each iteration Training for target users
Classroom Personal Announcement
Visible delivery Enterprise Portal SEM Management Cockpit BI Web applications Excel-based analytics
PRAGMATEK Consulting Group, Ltd. 2006
Strategic Iterations Process (cont.)
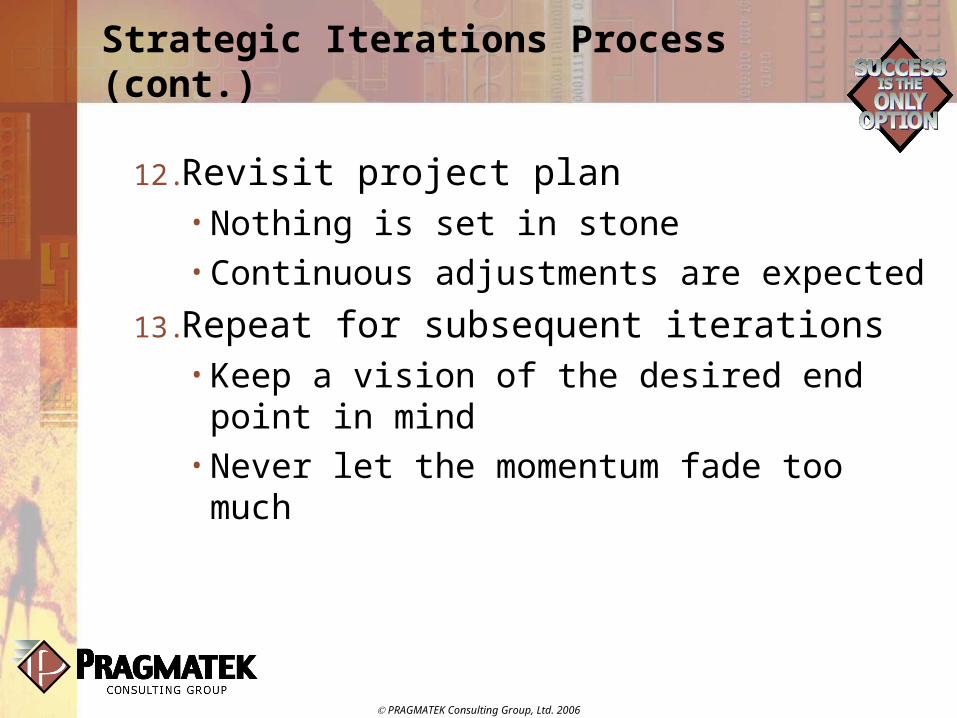
12.Revisit project plan• Nothing is set in stone• Continuous adjustments are expected
13.Repeat for subsequent iterations• Keep a vision of the desired end point in mind
• Never let the momentum fade too much
PRAGMATEK Consulting Group, Ltd. 2006
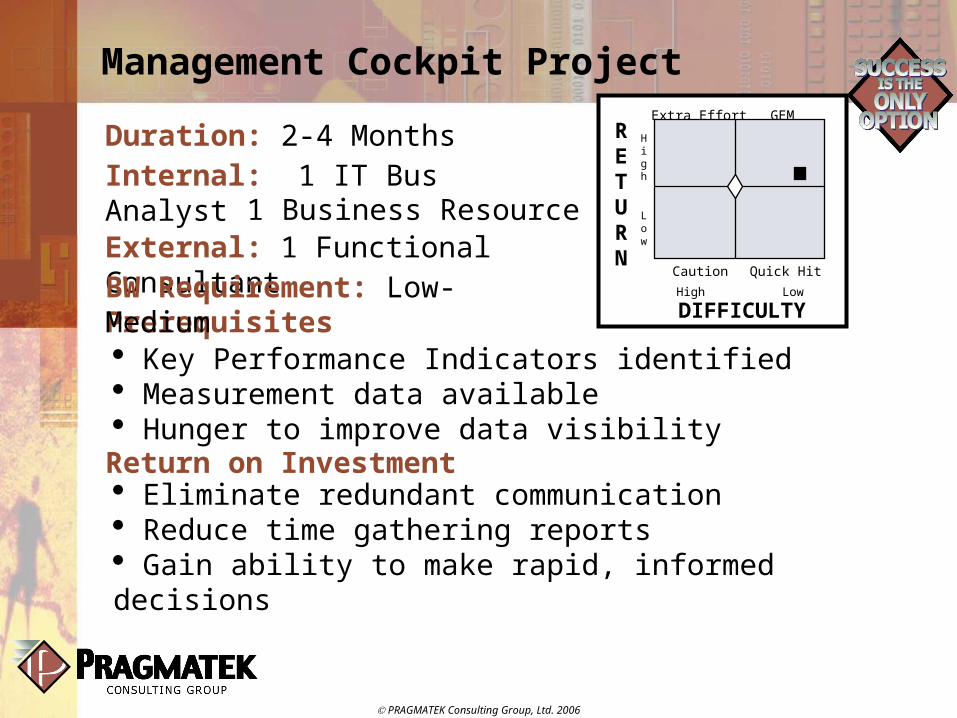
Eliminate redundant communication Reduce time gathering reports Gain ability to make rapid, informed decisions
Key Performance Indicators identified Measurement data available Hunger to improve data visibility
Management Cockpit Project
Duration: 2-4 Months
DIFFICULTY
RETURN
Low
LowHigh
High
GEMExtra Effort
Caution Quick Hit
Internal: 1 IT Bus Analyst
Prerequisites
External: 1 Functional ConsultantBW Requirement: Low-Medium
1 Business Resource
Return on Investment

PRAGMATEK Consulting Group, Ltd. 2006
Agenda
Value Proposition Which Metrics? Project Approach Technology Pitfalls Question and Answer
PRAGMATEK Consulting Group, Ltd. 2006
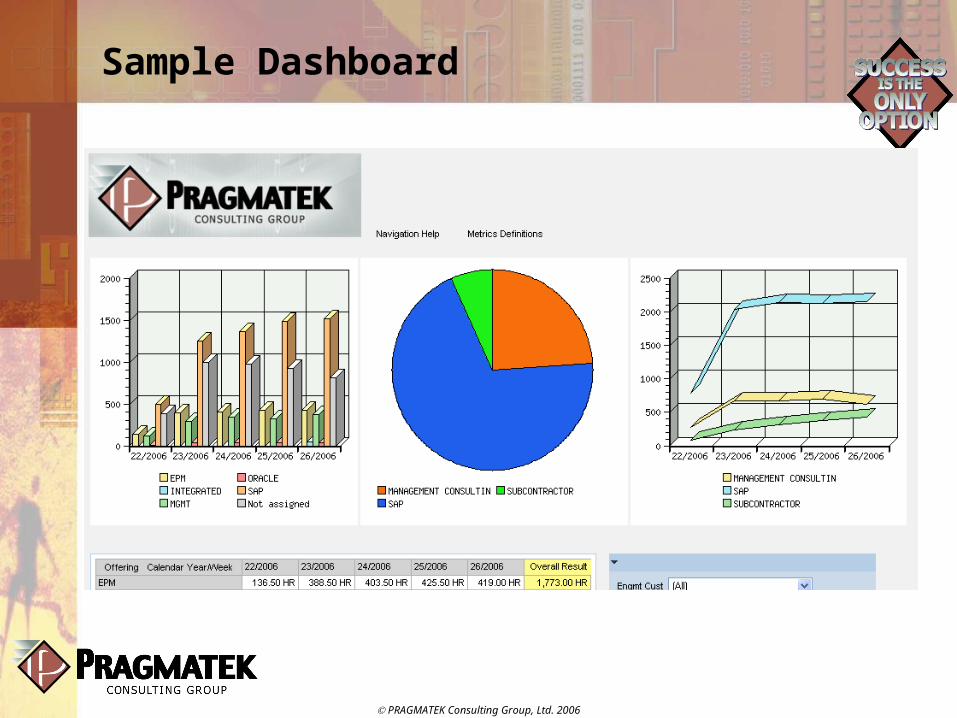
Sample Dashboard
PRAGMATEK Consulting Group, Ltd. 2006
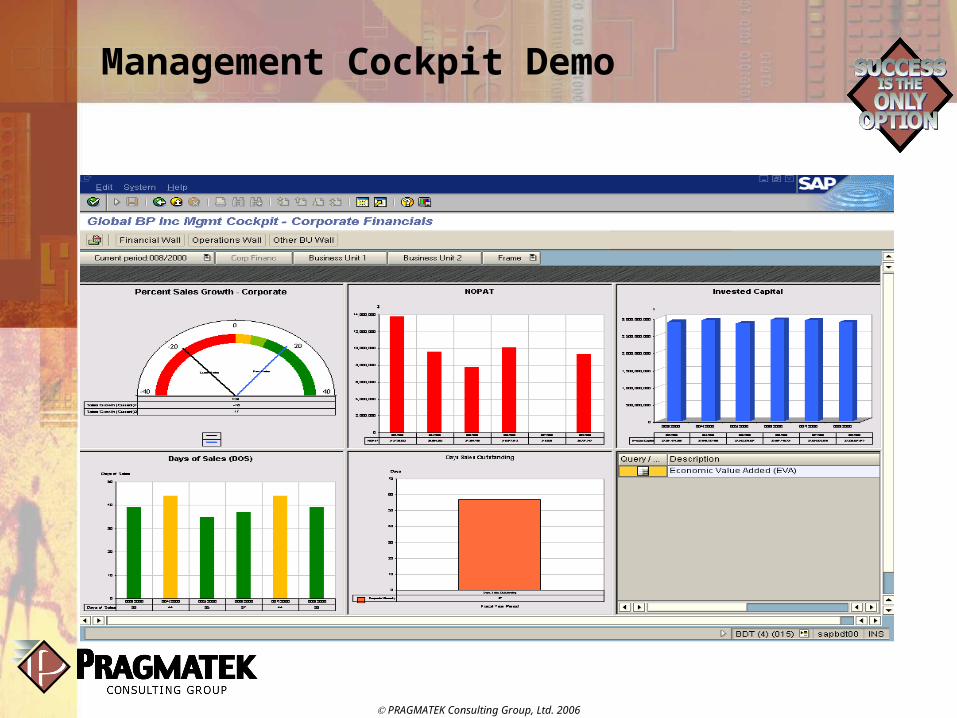
Management Cockpit Demo
PRAGMATEK Consulting Group, Ltd. 2006
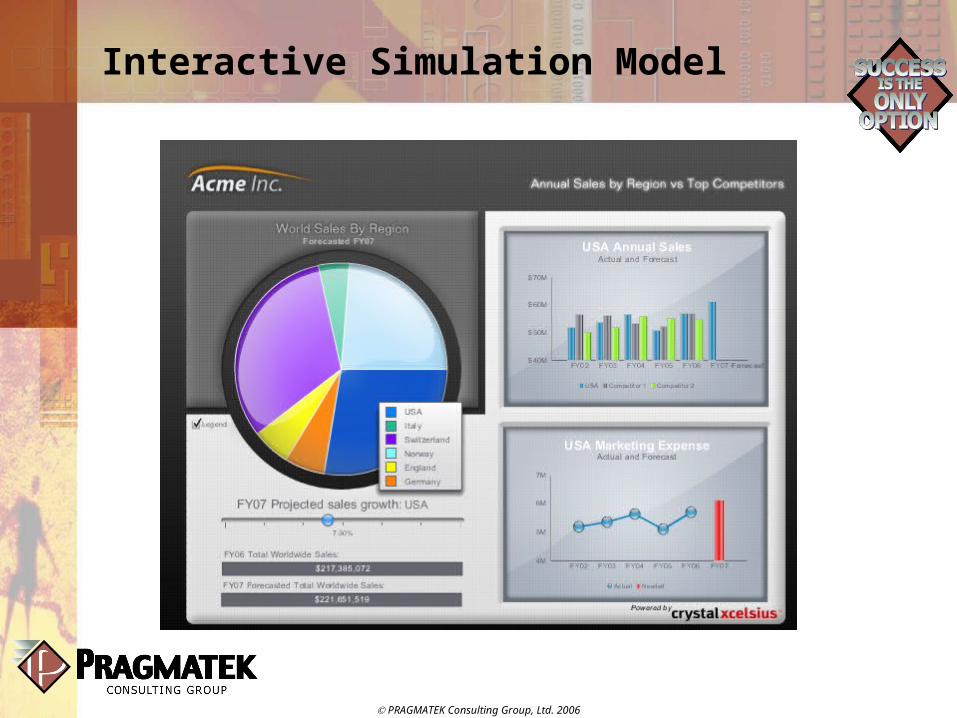
Interactive Simulation Model
PRAGMATEK Consulting Group, Ltd. 2006
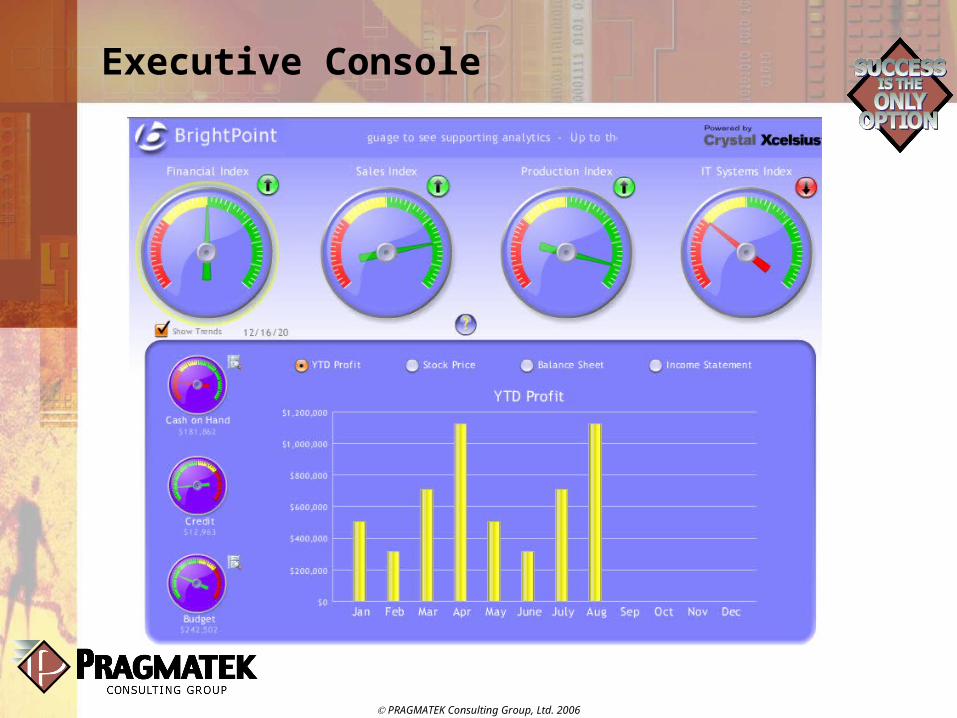
Executive Console
PRAGMATEK Consulting Group, Ltd. 2006
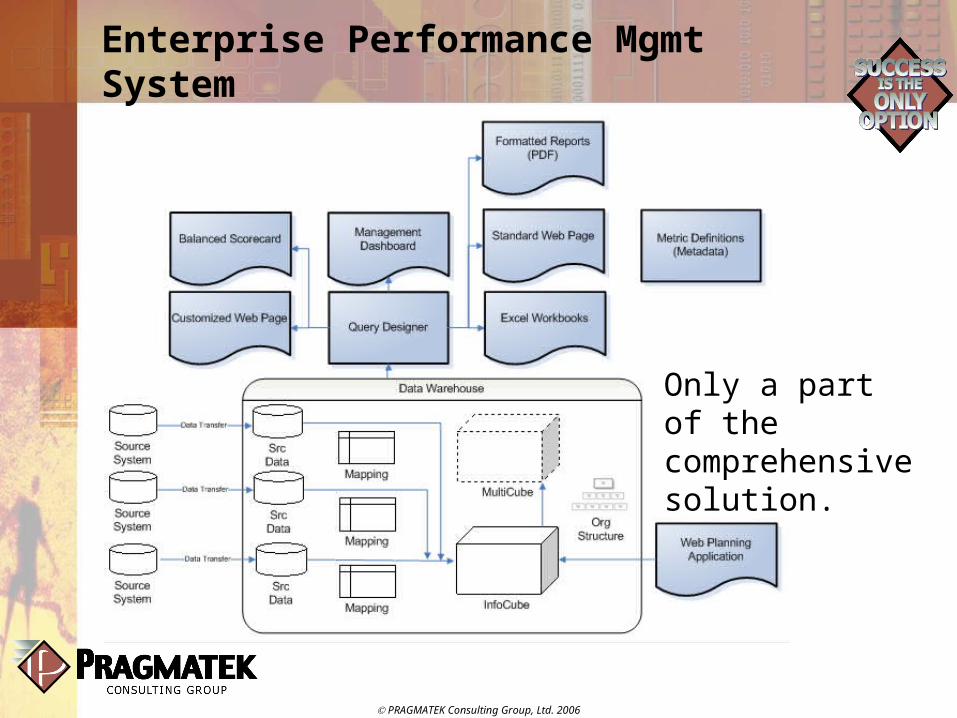
Enterprise Performance Mgmt System
Only a part of the comprehensive solution.
PRAGMATEK Consulting Group, Ltd. 2006
Key Dashboard Components
Branding Status reporting Navigation tutorial Visibility to metric definitions Easy-to-consume information Detailed analysis capability Data validity statistics (last refresh
time)
PRAGMATEK Consulting Group, Ltd. 2006
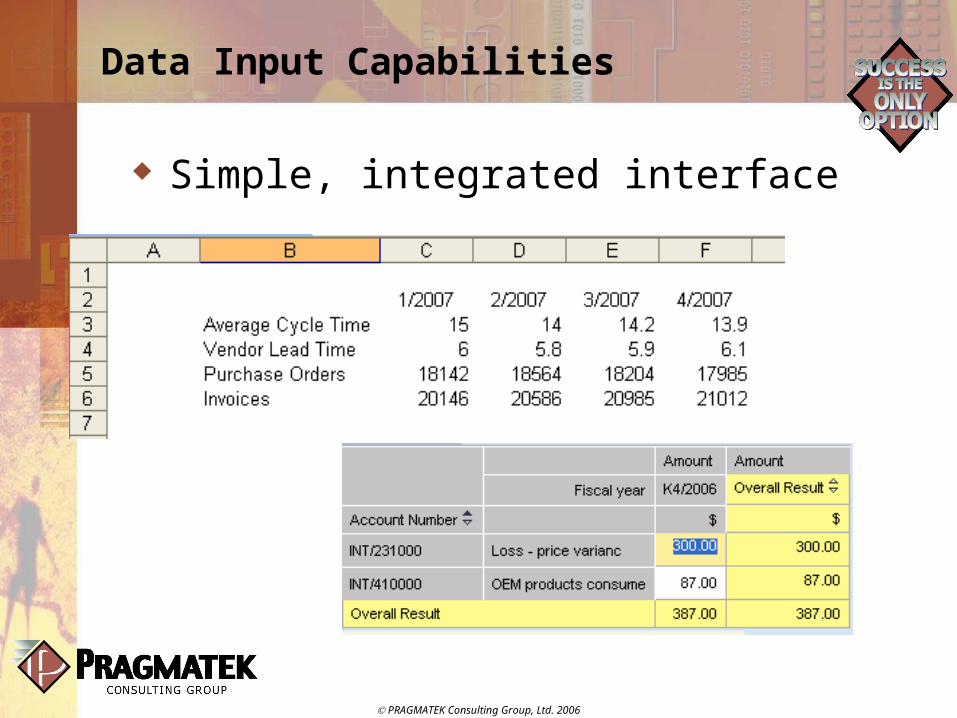
Data Input Capabilities
Simple, integrated interface
PRAGMATEK Consulting Group, Ltd. 2006
Formatted Printing
Web-based solutions are notoriously poor as printing platforms
Export to Excel Export to .pdf Modify font size, formats, or layout Copy-and-paste to PowerPoint
presentations
PRAGMATEK Consulting Group, Ltd. 2006
General Technology Considerations
Stop light concept to call out exceptions
Maintenance by power users Data collection capabilities

PRAGMATEK Consulting Group, Ltd. 2006
Agenda
Value Proposition Which Metrics? Project Approach Technology Pitfalls Question and Answer
PRAGMATEK Consulting Group, Ltd. 2006
Metrics Pitfalls
Information overload Functional bias Hindsight Limited perspective Inconsistent definitions Irrelevant metrics
PRAGMATEK Consulting Group, Ltd. 2006
Approach Mistakes
Strategic confusion Destination unknown No executive mandate Misalignment Big bang Incorrect results Unguided exploration
PRAGMATEK Consulting Group, Ltd. 2006
Technology Red Flags
Complex user experience Only ad hoc research No knowledge retention Inflexible Segregated Dead-end audit Outdated information
PRAGMATEK Consulting Group, Ltd. 2006
Key Points to Summarize
There are real opportunities for Return on Investment (ROI) through dashboard implementations
You can quickly deliver a dashboard solution The application designer should be usable by
power users and developers Web applications can incorporate a variety of
sources and publish to many different destinations
Outputs can be simple or complex to fit the audience

PRAGMATEK Consulting Group, Ltd. 2006
Question and Answer
How to contact me:Matt Christensen