Embed Size (px)
Citation preview

December 2020
Looking
Ahead

Disclaimer
This presentation includes the main points of the Company's strategic plan for the
years 2020-2024 as formulated by it in recent months. Accordingly, the
presentation includes Forward-looking information as defined in section 32A of the
Securities Law 5728-1968.
Such information includes, inter alia, various forecasts, objectives, assessments and
estimates, including information provided by way of illustrations and / or graphs
and/or tables relating to future events or matters, revenue and profitability from
new initiatives and from the implementation of various plans, EBIDTA forecast and
other future financial data that the realization of those is uncertain and are not
under the control of the Phoenix Group.
In recent months, the management of the Company has carried out a process
accompanied by an international strategy consulting company (hereinafter: "the
consulting company"), based on the Company's data, market data, raw or
processed inside information collected by the consulting company and
comparative data while working with the consulting company financials models
and based on certain working assumptions regarding the Company's operations
and relevant markets.
This information is based on the subjective assessment of the Company and its
consultants, and among other things, relies on past experience, professional
knowledge gained by the Company, research knowledge and tests and analyzes
performed by the consulting company, existing information and current
expectations and assessments, including future developments as known to the
Company today. Forecasts assume 3% yield on investments.
The realization and / or non-realization of the forward-looking information will
be affected by risk factors that characterize the Company's and companies'
activities in the Phoenix Group, as detailed in the Company's periodic reports,
including economic situation, capital market situation in Israel and the world,
the development of competition in the markets relevant to the group's activities,
regulatory changes, changes in consumer preferences and consumption habits,
a change in the data of work assumptions or in the economic models
assumptions used by the consulting company – that can not be estimated in
advance and are not controlled by the Company. Hence, there is no certainty
that the actual results and achievements of the Company in the future will be in
accordance with these views and may differ, also substantially, from those
presented in this presentation.
The business strategy presented in this presentation is correct as of the date of
the presentation and may change in the future, among other things, taking into
account the risk factors listed above and the decisions of the Company's Board
of Directors and the Group companies.
The presentation should not be construed as an offer to purchase or sell the
Company's securities, or an invitation to receive such offers. The presentation
was made for convenience and outline presentation only and does not exhaust
or purport to encompass the full data about the Company and its activities
and/or any relevant information which may be relevant in order to make any
decision regarding the investment in the Company's securities and in general. In
any case of discrepancy and/or inadequacy between the information presented
in this presentation and the information in the Company's financial statements
and/or public reports, the aforesaid financial statements and such reports shall
prevail. The presentation also includes information which been collected from
third parties in regard of which the Company has not checked the data itself. For
the avoidance of doubt, the Company does not undertake to update or change
the information contained in this presentation.
2
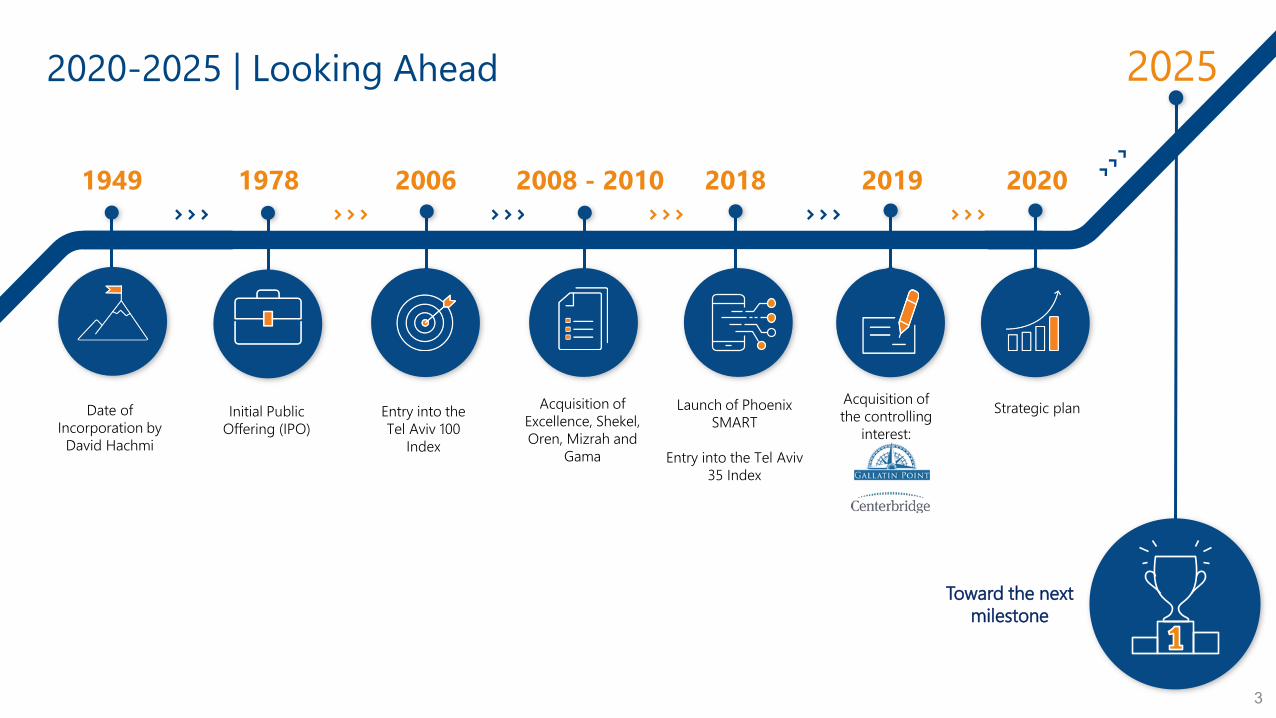
2025
Date of
Incorporation by
David Hachmi
1949 1978
Initial Public
Offering (IPO)
2006
Entry into the
Tel Aviv 100
Index
2010-2008
Acquisition of
Excellence, Shekel,
Oren, Mizrah and
Gama
2018
Strategic plan
2019
Acquisition of
the controlling
interest:
2020
Launch of Phoenix
SMART
Entry into the Tel Aviv
35 Index
2020-2025 | Looking Ahead
Toward the next
milestone
3

Roger Abravanel
Ben Langworthy
Marilyn Victoria Hirsch Hila Confronti
Dr. Rivy CohenOrit AlsterZhak CohenEliezer Yones
Zohar Tal
Dr. Ehud Shapira
Rita RubinsteinMarc Vonk Rachel Lavine
Israel
Insurance, Finance,
Investments
Fmr. Partner, E&Y; Milliman;
Consulting; co-CEO of
Universal Motors
Israel
Insurance, Finance,
Investments, Strategy, Risk
Fmr. CEO of Mizrahi Tefahot
Bank, Hapoalim, and Bank
Clali; Accountant General
State of Israel
Israel
Finance, Risk Management
Fmr. Head of Corporate
Division, Discount Bank;
Director at IDB NY Bank
Israel
Insurance, Risk Management
Kiryat Ono Academic College,
Vice President. Fmr. IDI Direct
Insurance, External Director
Israel
Insurance, Risk
Management, Finance
Fmr. Deputy CEO & Chief
Risk Officer, Clal Insurance;
Credit Control, Bank of
Israel
UK
Finance, Investments
Senior Managing Director,
Centerbridge; Director at Banca
Farmafactoring, Resort Finance
America, Auxmoney, Canopius
Israel
Insurance, Risk Management,
Finance
Fmr. Chairman, Psagot
Investment House; Chairman,
Phoenix Holdings; Head of
Corporate Division, Bank Leumi
Israel
Finance, Investments
CEO of finance consulting firm;
External Director, Adika Style.
US
Insurance, Risk Management,
Finance, Investments and IT
Senior VP – Corporate
Development & Capital
Deployment, Allstate; Fmr.
Head of Strategy, AIG
UK
Insurance, Risk Management,
Finance, Investments
Principal, Centerbridge;
Director Belenus Lux, Sand Lux,
and Fortuna
Israel
Risk Management, Finance
Fmr. Member of Board of
Management and Head of
HR, Logistics &
Administration Division,
Mizrahi Tefahot Bank
Italy
Insurance, Finance,
Investment, Strategy
Director, Caesar Stone. Fmr.
Senior Director, McKinsey;
Director of public companies
including Admiral Insurance
and Teva
Israel
Insurance, Real Estate,
Finance, Investments
Fmr. Director and CEO of
public companies including
Elscint, Plaza Centers, Atrium,
Gazit-Globe; Director of Africa
Israel Properties
Benny Gabbay
US
Insurance, Risk Management,
Finance, Investments
Managing Director, Gallatin Point;
Director, Bowhead Insurance
4
Board of Directors with Broad Israeli and International
Experience
Chairman, Holdings & Insurance HoldingsInsuranceHoldings & Insurance Holdings & Insurance Insurance Holdings
HoldingsHoldingsHoldings & Insurance Holdings & Insurance Insurance Insurance Insurance
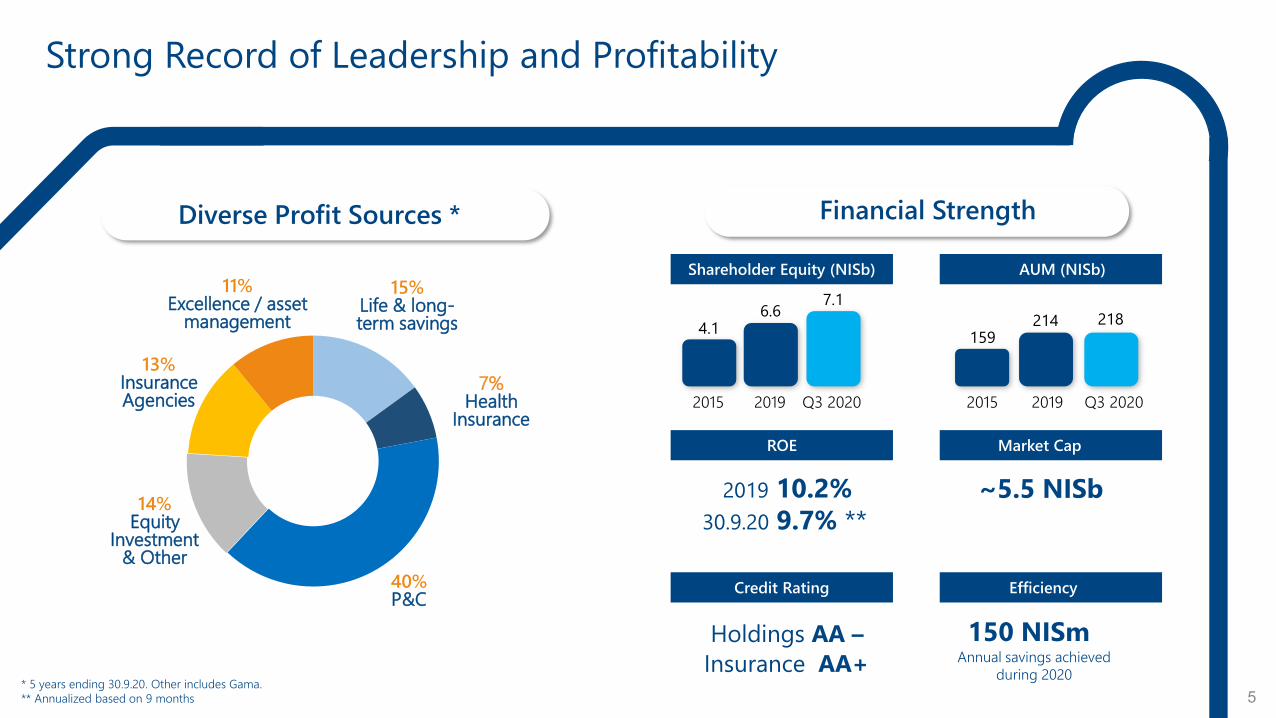
40%P&C
7%Health
Insurance
15%Life & long-term savings
14%Equity
Investment & Other
13%Insurance Agencies
11%Excellence / asset
management
Strong Record of Leadership and Profitability
Financial StrengthDiverse Profit Sources *
AUM (NISb)Shareholder Equity (NISb)
Market Cap
~5.5 NISb
ROE
Efficiency
150 NISm
Credit Rating
Annual savings achieved
during 2020
–Holdings AA
Insurance AA+
2019 10.2%
30.9.20 9.7% **
6.6
2019
7.1
2020Q3
4.1
2015
214
20192015
159218
2020Q3
5* 5 years ending 30.9.20. Other includes Gama.
** Annualized based on 9 months

Leading Investment Management
• Strong, leading organization
• Proactive, dynamic and
specialized teams
• Effective governance processes
• Advanced systems and
infrastructure for investment and
risk management
6
The presented published periods: last 12 months: (11/19-10/20), last 3 years (11/17-10/20), last 5 years (11/15-10/20), standard deviation in yearly terms – last 5 years: (11/15-10/20). The presented yield returns are average gross
nominal depending on the selected period, before deducting administration fees. There is no information about the rank and returns achieved in the past to indicate the rating and returns that will be achieved in the future or
commitment to any yield. For additional legal remarks regarding the presented information in this slide and details regarding the investment tracks which were the basis for comparison, see Annex A to the presentation. Annex A is
an integral part of this presentation.
InsuranceParticipating Policies(General, since 2004)
Training Fund(General)
PensionComprehensive
(aged 50 and under)
Provident Fund
(aged 50 and under)
Company12
Months 3 years 5 yearsStandard Deviation
12 Months 3 years
12 months 3 years
12 months 3 years 5 years
Standard Deviation
Phoenix 0.88% 4.30% 4.91% 6.34% 0.72% 4.58% 2.06% 4.36% 0.35% 3.71% 4.35% 6.28%
Harel -0.28% 3.21% 4.11% 5.99% 0.85% 3.81% -1.33% 2.49% -0.50% 2.88% 3.58% 5.80%
Clal -0.71% 3.59% 3.72% 6.17% -0.10% 4.01% -1.23% 3.27% -0.33% 3.56% 3.50% 5.98%
Migdal 0.48% 3.59% 3.91% 6.06% 1.21% 3.92% 0. 57% 3.35% 0.42% 3.25% 3.53% 5.77%
Menora -1.64% 2.99% 3.53% 6.44% -0.42% 4.10% -2.06% 2.68% -2.21% 2.49% 3.15% 6.56%
Leadership among 5 large insurance groups

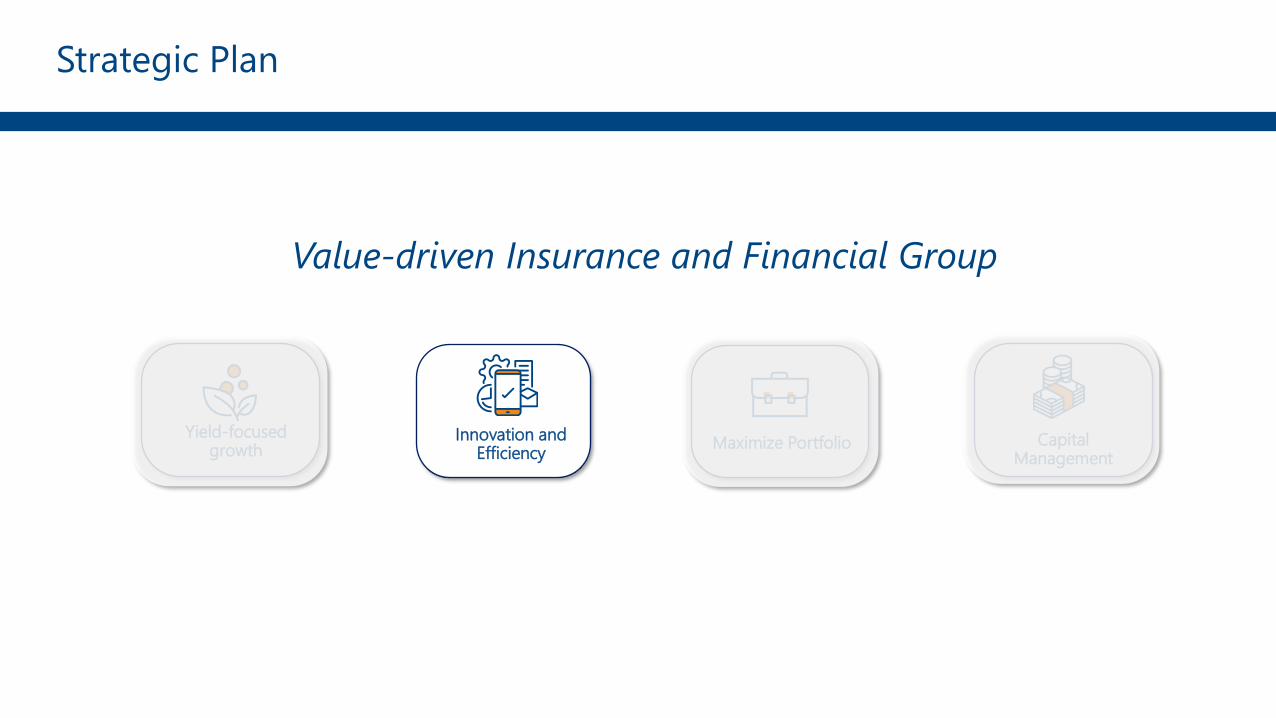
Innovation and Efficiency
Strategic Plan
Capital Management
Maximize PortfolioYield-focused
growth
Value-driven Insurance and Financial Group

Innovation and Efficiency
Strategic Plan
Capital Management
Maximize PortfolioYield-focused
growth
Value-driven Insurance and Financial Group

Accelerated Growth in High-ROE Activities
Growth Drivers
Growth in P&Cinsurance
Growth in agencies and SMART direct
channel
Growth in Excellence
Growth in Provident and
Pension
Growth in asset management:
9
P&C Premiums (NISb)
2.8
20192015
2.5
3.8
Target
Pension / Provident
Deposits (NISb)
6.8
20192015
4.8
9.8
Target
Excellence / AM Revenues
(NISm)
405
20192015
359
543
Target
Insurance Agency
Revenues (NISm)
406
20192015
262
592
Target
Targets based on 5-year plan

Targeting 40% Growth in AUM
Growth Drivers
Growth in KSM Funds (Excellence)
Growth in Provident and
Pension (compulsory
savings)
Potential mergers and acquisition
(not included in the target)
As of 30.9.20:
218 NISb
Target2019
300
214
2015
159
10
Assets Under Management (NISb)
Provident and
Pension
Nostro
Excellence Asset
ManagementMutual Funds, ETFs,
Brokerage
Insurance and
Investment
Contracts
40%+
Targets based on 5-year plan and 3% returns on investment

Growth Drivers
Increasing activity in
brokerage for private clients
Economies of scale
30.9.20 YTD:
94 NISm
Comprehensive profit (NISm)
Forecast10-15%CAGR
5373 76
114
175
2016 2017 2018 2019 Target
Growth in AUM, focusing on
mutual funds and ETFs
• Manages 50 NISb
• Activities including mutual funds
and ETFs, private & institutional
brokerage, discretionary
portfolio management, options
trust services, and underwriting
• Leader in performance and bank
ratings
Accelerated Growth in “Excellence” Asset Management
11Targets based on 5-year plan

Growth Drivers Forecast
5-8%CAGR
6589 85
114
144
2016 2017 2018 2019 Target
30.9.20 YTD:
77 NISm
Accelerated Growth in Proprietary Agencies
Accelerating organic growth
Continued acquisitions of
insurance agencies
Digitization and implementation of information
systems for customers and
agencies
Economies of scale
Comprehensive Profit (NISm)
• The largest distribution channel
among Israeli insurance
companies
• Includes leaders in life and P&C
distribution
• Track record of consolidation
and integration of smaller firms
12
Targets based on 5-year plan

Continued Share Expansion in Direct Distribution
Phoenix SMART - Market Share of Direct Distribution *
2%
10%
20%
2015 2019 Target
* Market share of direct distribution vehicle insurance (estimate only)
Growth Drivers
Optimizing
the digital
customer
journey
Digital
marketing
and marketing
automation
Pricing and
market
analytics
Cross-sales
Vehicle Insurance Market
– Distribution Channels
70%
30%
Indirect
Direct
13
80%
20%Direct
2019
2025
Innovation and Efficiency
Strategic Plan
Capital Management
Maximize PortfolioYield-focused
growth
Value-driven Insurance and Financial Group

Impact Range (in years)
Ongoing Digital and Technological Transformation
Transformative
activity
Core Activity
Distance
from core
activity
3-51-3
Growth engine
development
lab
Investments in
startups
Open platforms
for accelerating
technological
progress
Advanced data
Automation and
streamlining of
processes
Infrastructure
upgrade
Advanced
digital tools
Data-based
pricing and
underwriting
Improving
customer & agent
experience
Implementing
startup
technologies
Entrepreneurship
and innovation
Infrastructure and data
Digital
Innovation
Initiatives in progress
Launching
Activity
15

Achieving 6 out of 7 on
customer survey scores
Improving satisfaction
35% reduction in call center
inquiries
Reduction in call centers
First Place in 7 out of 9
categories of digital service
Market leaders in digital services
18% increase in internet service
users between 2019 and 2020
Growth in self-service
Decrease Expenses and
Acquisition Costs
Process Optimization
Centralized OperationsTotal Savings300 NISm
300 NISm Annual Savings While Improving ServiceImplementing digital tools to improve service and cut costs
80% Complete
10% Complete50% Complete
Achieved as
of 30.9.20
150 NISm
16
Streamline processes
Automation Robotics
OCR
DigitizationEliminating duplicate
units
Size Advantage
Standardization Establishment
of a central trade and
procurement unit
Decrease in additional expenses
Savings on procurement and claims providers

Innovation and Efficiency
Strategic Plan
Capital Management
Maximize PortfolioYield-focused
growth
Value-driven Insurance and Financial Group
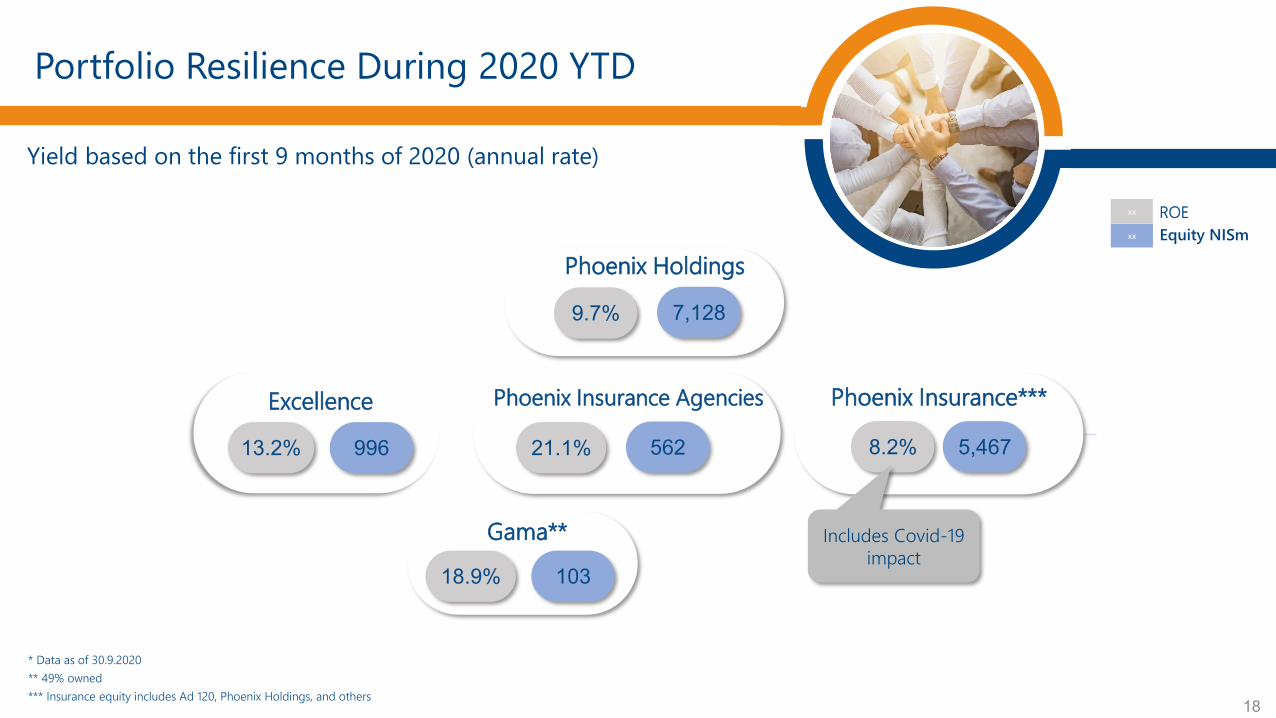
Phoenix Insurance Agencies Phoenix Insurance***Excellence
Gama**
** 49% owned
8.2% 5,46721.1% 56213.2% 996
18.9% 103
xx
xx ROE
Equity NISm
* Data as of 30.9.2020
Phoenix Holdings
9.7% 7,128
Portfolio Resilience During 2020 YTD
18
Yield based on the first 9 months of 2020 (annual rate)
*** Insurance equity includes Ad 120, Phoenix Holdings, and others
Includes Covid-19
impact

Active Portfolio Management to Unlock & Create Value
19* Includes Ad 120, Phoenix Holdings, and others
Value drivers Holdings
Comprehensive Profit2019
NISm
Comprehensive Profit
30.9.20 YTD
NISm
Equity of Phoenix Holdings
30.9.20NISm
Insurance*Growth
Profitability100% 415 309 5,467
AgenciesOrganic Growth
Acquisitions100%
50-100% (sub.)114 77 562
ExcellenceFunds &
Brokerage100%
84%-100% (sub.)114 94 996
GamaCash to Credit New Products
49% 21 14 103
Total 664 494 7,128
Portfolio Contribution 249 185 1,661
Percent of total 38% 37% 23%
Focus on
unlocking
appropriate
valuation metrics
for non-balance
sheet businesses

Innovation and Efficiency
Strategic Plan
Capital Management
Maximize PortfolioYield-focused
growth
Value-driven Insurance and Financial Group

• 165% solvency ratio with standard model
transitional measures (through 2032), 105%
without transitional measures **
• The strategic plan supports strengthening and
streamlining the capital base and building
economic capital
Reduce Volatility and Build Capital and Solvency Ratios
• Improved hedging of interest rate risk
• Improved matching of assets and liabilities
(including duration)
• Optimization of old insurance portfolios through
reinsurance solutions
21
Capital Target
Reduce
volatility and
optimize risk
IncludingExcluding
Solvency rate including/excluding transitional measures **
100%
150%170% Target Range
573
(937)
(29)
147 1%+
1%-
Sensitivity to interest rate changes (in NISm) *
31.12.19 30.9.20
165%105%
Scenarios
* Impact on comprehensive profit of an increase / decrease of 1% in the interest rate
** As of December 31, 2019

* Targets based on 5-year plan and assuming 3% return on investments. ROE target range assumes 3% to 4.8% return on Nostro investments (4.8% based on average actual annual return during 1.10.15-30.9.20).
** Includes approximately 230 NISm of Mehadrin shares as a dividend in kind
*** Including 2020 share buy-back program and an additional dividend for 2020 to be distributed in 2021
3.6 3.8 4.14.8
5.76.4 6.6
2013 2014 2015 2016 2017 2018 2019 Target
10.2%8.3%
16.5%
15.5%8.1%
12.0%22.2%
Dividend (NISm) 480**120--200325
12-15%*
9
ROE
As of 30.9.20: 7.1 NISb
ROE 30.9.20 YTD annualized: 9.7%
22
Increase ROE and Distribute Dividends
Shareholder Equity (NISm)
• Dividend distribution
policy – 30% of profits
• Annual dividend
forecasted in 2020***
• Share repurchase plan

23
214
300
2019 Target
710
1,000
AVG.
5YRS
Target
6.6
9
2019 Target
ROE
13.3%12-15%
AVG.
5YRS
Target
Equity (NISb)Comprehensive Profit
(NISm)
7.1
2020
Q3
4.1
20152015
159
218
2020
Q3
2020
Q3YTD
9.7%
2020
Q3YTD
494
Targets based on 5-year plan and assuming 3% return on investments. ROE target range assumes 3% to 4.8% return on Nostro investments (4.8% based on average actual annual return during
1.10.15-30.9.20). Actual performance will depend on financial markets, macroeconomic growth, industry trends, company performance and other variables.
Selected Targets
AUM (NISb)

24
For further information
please contact us at
and see
https://investor-relations.fnx.co.il/

25
Appendix

Eyal Ben SimonCEO
• Phoenix since 2003
• Experience in insurance
and management
• Israel Ministry of Finance
Eli Schwartz
CFO
• Phoenix since 2002
• Experience in finance and
subsidiaries’ finance
functions
Haggai Schreiber
Investments
Menachem NeemanLegal
• Phoenix since 2015
• Former Partner in HFN
Keren GraniteService Operations Claims
• Phoenix since 2000
• Experience in claims and
operations
Moti MorP&C
• Phoenix since 2003
• Experience in P&C
Daniel CohenLong-term Savings & Life
Daphna ShapiraHealth
• Phoenix since 1996
• Experience in health
insurance
Hanna HollanderExcellence
• Phoenix since 2012
• Investment experience,
banking, risk management
and raising capital
• Phoenix since 2018
• Experience in life insurance,
health, and long-term
savings
• Phoenix since 2014
• Investment
management
experience
Ron ShviliInnovation and Technology
• Phoenix since 2020
• Experience in technology
• Previous experience at IDF and
Cellcom
Raanan SaadSMART Direct
• Phoenix since 2019
• Experience in direct
insurance, marketing and
business development
Strong and Experienced Management Team
26

Israel Opportunity
3.3% 0.1% 5.1%A1 (Stable) / AA- (Stable)
/ A+ (Stable) 59.9%Average Real GDP
growth (2015-2019)1Average Inflation
Rate (2015-2019)
Unemployment
(Jul-2020)2Ratings/Outlook
(Moody’s/S&P/Fitch)
Public Debt/GDP3
22,072 km c. 9.3mNew Israeli
Shekel (NIS) 395 USDb 41,624 USDArea Population
(Sep-2020)
Currency GDP (2019) GDP per
Capita (2019)
Sources: Bank of Israel (BOI); Central Bureau of Statistics (CBS); OECD; Ministry of Finance (MOF)
1 Real GDP growth according to BoI. Israel forecast based on BoI’s upside case as of Aug-2020. BoI’s downside case forecast for 2020E is -7%.
2 COVID-normalized unemployment rate. Unemployment rate including COVID impact – 12.3%.
3 The public debt in the preceding December divided by GDP during the previous 4 quarters.
The Israeli economy has a unique profile, combining the emerging market growth with developed market stability.
These characteristics support the development of strong domestic insurance and asset management sectors.
27

Phoenix’s risk-return profile is that of a best-in-market, low-cat exposed P&C insurer and asset manager with greater technological capabilities and demographic growth than most U.S. and European peers
Strong Growth Unlike European peers, Phoenix is a leader in a rapidly growing market: ~2x GDP growth relative to Western Europe with strong demographic and wealth trends.
Compulsory, high savings rates contribute to the growth in asset management and long-term savings products.
High Barriers to Entry Israel’s insurance market is led by five multiline insurers with years of experience (~80% of GWP over past 5 years), brand loyalty and stable market shares. Due
to the importance of these companies to the public, regulators apply a high bar for new entrants / control shareholders.
Market Leader Status Phoenix has historically been a top performing insurance company in its market with strong ROEs over the past five years and through the cycle.
Diversified income driven by P&C
and asset management
Phoenix enjoys the significant covariance benefits derived from being a multiline insurer, but only 22% of its income is attr ibutable to its life/health segment,
compared with 40% from P&C and 24% from asset management, distribution, and other fee-based businesses.
Focus on Data & Technology Among the large insurers in Israel, Phoenix stands out for its focus on data and technology. For example, its Phoenix SMART platform is the quickest growing
direct to customer with telematics.
Untapped Portfolio Potential Phoenix Holdings’ market cap today suggests a material portfolio discount – benchmarking the market value of non-balance sheet businesses suggest additional
upside. Its control shareholders and board are experienced in and focused on properly highlighting these assets.
Solid Solvency Ratio
w/ Upside Potential
Solvency ratio of 165% as of December 31, 2019 based on recently passed transitional measures that will extend until 2032 (105% without transitional measures).
The measurement is based on standard models and there is potential upside if the market (like Europe and the U.S.) comes to use internal models over time.
Even with standard models, company has long, sustainable runway for regular dividend distribution.
Reduced Interest Rate Exposure Phoenix has achieved strong ROE over the past five years in a historically low rates environment. On the liabilities side, the company has focused on ALM and
other features to reduce exposure to interest rates - a 1% decrease in rates today would represent a loss less than 100 NISm.
Limited Cat Risk Exposure Insuring in Israel-only, Phoenix has limited exposure to natural catastrophe risks such as hurricane or typhoons. Its exposure to earthquake risk is substantially
reinsured.
Experienced management, board
and control shareholders
The company’s senior management has longstanding experience in the industry and with the Phoenix, and has been bolstered by best-in-class board of directors
and sophisticated international control shareholders.
Phoenix’s Strengths
28

29
Annex A
Legal remarks and details regarding the investment tracks which were the basis for the comparison in Slide 6.
The presented published periods: last 12 months: (11/19-10/20), last 3 years (11/17-10/20), last 5 years (11/15-10/20), standard deviation in yearly terms – last 5 years: (11/15-10/20)
The presented yield returns are average gross nominal depending on the selected period, before deducting administration fees. There is no information about the ranks and returns achieved in the past to indicate the rating
and returns that will be achieved in the future or commitment to any yield. Data sources: Nat Insurance Website, Provident Net and Pension Net.
Comprehensive Pension Fund: The Phoenix - Track 9974, Harel -Track 9823, Clal – Track 9654, Migdal - Track 8801 & Menorah Mivtachim – Average weighted spanning tracks 2040-2060.
Last 12 months (11/19-10/20): *Menorah Mivtachim – below are the subject tracks yields which were the basis for the weighted average: retirement target track 2050 track 2015 – 0.08%, retirement target track 2045 track 2016
– -0.56%, retirement target track 2050 track 2183 – -0.59%, retirement target track 2055 track 2184 – -0.72% and retirement target track 2060 track 8812 – -0.48%.
Last 3 years (11/17-10/20): *Menorah Mivtachim - below are the subject track yields which were the basis for the weighted average: retirement target track 2050 track 2015 – 4.34%, retirement target track 2045 track 2016 –
4.08%, retirement target track 2050 track 2183 – 4.03%, retirement target track 2055 track 2184 – 3.93% and retirement target track 2060 track 8812 – 3.94%. The yields returns are on investments and do not include
demographic or actuarial surplus (deficit) yields.
Study Fund: The Phoenix - Track 964, Harel -Track 154, Clal – Track 456, Migdal - Track 579 & Menorah Mivtachim – Track 828.
Provident Fund: The Phoenix - Track 9916, Harel -Track 9774, Clal – Track 9651, Migdal - Track 9779 & Menorah Mivtachim – Track 9793.
The Pension Fund, Study Fund & Provident Fund of the Phoenix are managed by The Phoenix Excellence Pension & Provident Fund Ltd.
The comparison between the tracks is between companies that manage pension funds, provident funds and study funds in the five major insurance groups.
Insurance: general investment track in unit linked policies that have been produced since 2004 and on and that from 2016 is opened for new costumers in individual programs only.
The Phoenix - Track until 50, Harel -Track 88, Clal – Track 99, Migdal - Track 17013 & Menorah Mivtachim – Track 18013.
The Phoenix insurance policies are managed by The Phoenix Insurance Company Ltd.
The comparison is between the five major insurance companies.
The aforementioned does not constitute advice and/or recommendation and/or opinion for the purchase of a pension product and/or Insurance product.


![מצגת של PowerPoint - משרד החקלאות€¦ · מצגת של PowerPoint Author: בני רון [Benny Ron] Created Date: 1/28/2020 12:22:00 PM](https://img.pdfslide.us/doc/110x75/6017b7c184dfb66f06094152/-oe-powerpoint-oe-oe-powerpoint-author.jpg)