Embed Size (px)
Citation preview

MAR
KET
KNO
WLE
DG
E &
D
EVEL
OPM
ENT
PR
OjE
cT
Nu
Mb
ER
: PR
07.1
047
This
rel
ease
can
als
o b
e vi
ewed
on
th
e FW
PRD
C w
ebsi
te
ww
w.f
wp
rdc.
org
.au
FWPR
DC
PO B
ox 6
9, W
orld
Tra
de C
entr
eM
elbo
urne
800
5, V
icto
riaT
+61
3 9
614
7544
F +
61 3
961
4 68
22
Comparative service lifeassessment of windowsystems
AUGUST 2007
The FWPRDC is jointly funded by the Australian forest and wood products industry and the Australian Government.
Comparative service life assessment of window systems
Prepared for the
Forest & Wood Products Research & Development Corporation
by
N.P. Howard, J. Burgess and C. Lim
© 2007 Forest & Wood Products Research & Development Corporation. All rights reserved. Publication: Comparative service life assessment of window systems The Forest and Wood Products Research and Development Corporation (“FWPRDC”) makes no warranties or assurances with respect to this publication including merchantability, fitness for purpose or otherwise. FWPRDC and all persons associated with it exclude all liability (including liability for negligence) in relation to any opinion, advice or information contained in this publication or for any consequences arising from the use of such opinion, advice or information. This work is copyright and protected under the Copyright Act 1968 (Cth). All material except the FWPRDC logo may be reproduced in whole or in part, provided that it is not sold or used for commercial benefit and its source (Forest and Wood Products Research and Development Corporation) is acknowledged. Reproduction or copying for other purposes, which is strictly reserved only for the owner or licensee of copyright under the Copyright Act, is prohibited without the prior written consent of the Forest and Wood Products Research and Development Corporation. Project no: PR07.1047 Researchers: N. P. Howard BRANZ PO Box 830, Brookvale, NSW 2100 J. Burgess Timber Queensland PO Box 2014, Fortitude Valley BC, QLD 4006 C. Lim BRANZ PO Box 830, Brookville, NSW 2100 Final report received by the FWPRDC in August 2007 Forest and Wood Products Research and Development Corporation PO Box 69, World Trade Centre, Victoria 8005 Phone: 03 9614 7544 Fax: 03 9614 6822 Email: [email protected]: www.fwprdc.org.au

i
Abstract
The objective of this project was to assess the service life and life cycle environmental performance of the main variants of window system used in the Australian market. The project compares timber framed windows (and aluminium-skinned timber framed windows) with their major competitors in the market. In order to assess the window systems, 51 archetypical window specifications were chosen, with the help of a Project Advisory Group to represent the range of window types and variants used in the market. These archetypes were then studied in detail for their maintenance, durability, service life and hence full life cycle environmental impacts. Initial embodied, life cycle embodied and operational energy implications are all assessed using Life Cycle Assessment (LCA). The LCA results were interpreted by characterisation, normalisation and weighting. Characterisation used the CML 2000 protocol and the results were then normalised against the annual impacts estimated for an average Australian citizen. Finally the results were weighted using data compiled from international sources and adapted in line with the Green Building Council of Australia’s weighting values for different Australian States and Territories, to bring the results to a single ecopoint value. Results are presented for embodied ecopoints and embodied CO2-E. In contrast to similar work conducted in other countries (mostly in Europe), the embodied impacts prove to be dominant to the life cycle assessment of the windows in areas where the climate is very mild and only minimal heating or cooling are required. Only in Northern Territories are the cooling loads in buildings high enough to justify the additional embodied impacts for double glazed windows. Under heating conditions though, double glazed windows are justified in all States and Territories except Northern Territories and Queensland. Under combined heating and cooling conditions, fully air-conditioned buildings for example, double glazed windows are justified in all States and Territories except Queensland and Western Australia. Window size is the most significant factor in life cycle impact, double or single glazed is next most important, frame type next and window style next. Other factors are not so significant. Overall, aluminium skinned timber framed windows perform best, hardwood timber framed windows next, PVC next and aluminium worst. The biggest differences occur in harsher climates for either heating or cooling. In milder climates, where double glazing is not justified, the frame becomes the main differentiating factor. The report identifies messages that differentiate aluminium skinned timber and hardwood timber framed windows that can be promoted to the Australian market, but recommends caution given some gaps and uncertainties in the LCA data and assumptions. The report identifies research and innovation opportunities for the industry to improve the reliability of these results and to further enhance the environmental performance of timber framed windows
ii
Contents Page
1. Introduction................................................................................................................................................................... 1 2. Background.................................................................................................................................................................... 1 3. Objective..........................................................................................................................................................................2 4. Project Methodology.................................................................................................................................................2 5. Selection of Archetypes ..........................................................................................................................................3
5.1 The archetypes.................................................................................................................................................4 6. SECTION A – SERVICE LIFE PERFORMANCE...........................................................................................................6
6.1 Methodology for Operational Energy Performance ......................................................................6 6.2 Service Life Performance Results.......................................................................................................... 7
6.2.1 Air Leakage results ................................................................................................................................... 7 6.2.2 Lifetime of components.......................................................................................................................... 7 6.2.3 Lifetime of windows..................................................................................................................................8 6.2.4 UV degradation............................................................................................................................................8 6.2.5 Energy performance of windows.......................................................................................................9 6.2.6 Double Glazing (IGUs) ..............................................................................................................................9
6.3 Service Life Performance Recommendations.................................................................................9 6.4 Service Life Performance References ...............................................................................................10
7. Section B – LIFE CYCLE ASSESSMENT................................................................................................................. 11 7.1 Project LCA Methodology .......................................................................................................................... 11
7.1.1 Selection of LCA Application Protocol .......................................................................................... 11 7.1.2 Goal and Scope and Functional Unit .............................................................................................. 11 7.1.3 Material Quantities .................................................................................................................................12 7.1.4 Component Life and Replacement .................................................................................................12 7.1.5 Life Cycle Inventory Data (LCI) ..........................................................................................................12 7.1.6 Data Sources ..............................................................................................................................................13 7.1.7 Data Gaps .....................................................................................................................................................14 7.1.8 Impact Assessment................................................................................................................................15
7.1.8.1 Characterised Data ...........................................................................................................................15 7.1.8.2 Normalisation Australia.................................................................................................................16 7.1.8.3 Weighting Australia ......................................................................................................................... 17
7.2 LCA Results .......................................................................................................................................................18 7.2.1 Initial Embodied Performance..........................................................................................................18 7.2.2 Life Cycle Embodied Performance..................................................................................................21 7.2.3 Use Phase Results ..................................................................................................................................23
7.2.3.1 Cooling ...................................................................................................................................................23 7.2.3.2 Heating....................................................................................................................................................27 7.2.3.3 Cleaning.................................................................................................................................................31
7.3 Full LCA Results...............................................................................................................................................31 7.3.1 Literature Survey Results ...................................................................................................................34
7.4 LCA Conclusions ...........................................................................................................................................35 7.4.1 General .........................................................................................................................................................35 7.4.2 Initial Embodied.......................................................................................................................................35 7.4.3 Life Cycle Embodied...............................................................................................................................36 7.4.4 Operational Energy Impacts .............................................................................................................36

iii
7.5 LCA Recommendations ..............................................................................................................................37 7.5.1 Marketing Messages .............................................................................................................................37 7.5.2 Innovation to Further Enhance Performance...........................................................................39
7.6 LCA References..............................................................................................................................................40 APPENDIX.A Degree Days .............................................................................................................................................41
A.1 Calculation method: ....................................................................................................................................41 A.2 Degree Day Data............................................................................................................................................ 42
ACKNOWLEDGEMENTS.........................................................................................................................................................43

1
1. INTRODUCTION
This is the final report on the Comparative Service Life Assessment of Window Systems. The project compares timber framed windows (and aluminium skinned timber framed windows) with their major competitors in the market. This report collates findings on the selection of archetypes for further study, on the service life performance of the archetypes and on how these can be assessed using environmental LCA. The LCA assessment itself considers the initial embodied performance, the life cycle embodied performance (repair and maintenance) and the energy implications of the windows’ performance. The LCA results are expressed in terms of CO2-E and Australian ecopoints.
2. BACKGROUND
There is growing international pressure on all sectors of industry and commerce to transition rapidly to new models of sustainable development. This is driven by emerging concerns over Climate Change, pollution and ecosystem degradation, collapse of marine ecosystems and fish stocks and the depletion of scarce resources especially fossil fuels and the associated vulnerability of many economies to the available fossil fuel resources especially oil. This has become a major focus of change in the real estate and construction industries as both public and private sector clients increasingly demand “Green” buildings as a public statement of their own environmental commitments to their customers, to their investors and to their staff. This has proved a powerful business driver as companies adopting this ethic achieve superior investment performance and efficiency by better attracting and retaining staff and housing them in more productive buildings. Individuals also identify strongly with this ethic and eco-labeled products and services and environmentally rated homes provide the means to inform individual purchasing/tenant decisions. Green Building Councils have emerged internationally as the key promoters of this change using building rating tools, but these are relatively unsophisticated in the way they address materials and products. The building material and product sectors are now engaging proactively to improve the methods of assessment of building materials and products available in Australia with widespread acceptance that the technique of Life Cycle Assessment should be used. Windows are very important elements of all buildings in terms of their aesthetic value as well as their functional performance – allowing heat and light in and permitting occupants access to views which have been proven to contribute to occupants sense of well-being, health and productivity. The Australian windows market is dominated by aluminium framed windows at 74% for residential and 99% for commercial. The rest are mainly wood framed with some aluminium skinned wood framed windows. UPVC is not prominent as a frame material in Australia (1.5%). The overall size of the market is 3 000,000 to 4 000,000 units per year valued at $2-3Bn meeting a mainly domestic market (80-85% from new build, the rest from renovation). While the market penetration of advanced windows in the domestic sector is not known precisely, the majority of windows in Australia are single glazed, and it is hoped that a confidential survey of the double glazing manufacturers will be able to reveal accurate numbers soon. The two major trends that are significant for the windows market are – the growth in competition from Asia due to increased importation of manufactured (mainly PVC) windows

2
and the growing interest in and concern for environmental issues. By understanding the environmental attributes of Australian windows thoroughly, the industry will be able to position itself to promote the legitimate benefits of timber framed windows and innovate to overcome any environmental liabilities or to maintain any advantages by further improvement. This will in-turn improve competitiveness within both domestic and export markets. Life Cycle Assessment studies of alternative window systems, mainly in Europe (Richter, Anderson 1992, Howard 2000), have revealed that timber framed windows may have environmental advantages over alternatives because the frames are made from renewable materials which during growth sequester carbon dioxide from the atmosphere. The timber framed window industry needs authoritative and comprehensive life cycle and performance in service data to compare timber framed windows with their main competitors. This project explores whether there are similar benefits from timber framed windows used in Australia and identifies the data gaps that may affect the conclusions. These results may provide the basis for marketing campaigns to highlight any environmental benefits and further research and innovation to minimise or mitigate any environmental liabilities identified for these products. If appropriate, the results might also be promoted to the developers of whole building rating tools such as Green Star, NABERS and BASIX and providing a basis for the award of credits under these tools. In particular: “FWPRDC seek a review of information relating to the comparative in-service performance of window systems manufactured from timber or other materials and an audit and assessment/review of life cycle assessment studies of window systems conducted in Australia or elsewhere.”
3. OBJECTIVE
To conduct a comparative review of the available studies conducted in Australia or elsewhere on the environmental life cycle and service life of timber framed, aluminium framed and other window systems.
4. PROJECT METHODOLOGY
This project entails internet search and data analysis to study the initial impacts from the materials used, the performance in use of the products – cleaning, maintenance, durability and life together with the energy transmission qualities of the products. The following major tasks have been completed:
1 Constitution of an advisory group of key stakeholders. The role of the stakeholders is to provide industry relevant information, provide guidance throughout and act as reviewers for the interim and final reports.
2 Identification of Australian sources of data on window service life. 3 Brief review of the Australian market for window systems – identification of up to
51 typical archetypes for size, frame, glazing panes, argon or other fill, low-E or other coatings representative of the market
4 Consultation with advisory committee on archetypes and refine list for further study
5 Literature survey to identify the cradle to site profile for different window systems. Scrutinisation of the data and sources and adjustment (where possible) to ensure

3
methodological consistency. (LCA data from different sources frequently has inherent differences due to different interpretations of ISO 14040 – e.g. differences in scope, allocation rules, sources of upstream data). Adjustment of the data (where possible) for relevance to Australia and for source to end-use transport effects. Averaging between compatible data.
6 Literature survey of the cleaning, maintenance and replacement periods for window systems and components in different environments – marine, inland or temperate.
7 Collation of initial and lifetime embodied materials impacts from the alternatives/combinations. Impact assessment comprising characterisation, normalisation and weighting (using an appropriate Australian weighting dataset) to condense the results to ecopoints for practicable comparison. (ecopoint comparisons can be used compatibly for all components at all stages and can be equated to the impacts of an average Australian citizen – 100 ecopoints)
8 Literature search and calculation of thermal transmittance and air-tightness of the combinations. Use of Heating and Cooling degree days to estimate the heating/cooling energy implications of the alternatives for the 7 Australian States and Territories capital cities. Literature survey to identify the cradle to site profile for electricity and gas for the 7 Australian States and Territories capital cities and hence estimate the LCA profile for energy losses/gains associated with each of the combinations in each location.
9 Collation of the initial embodied, repair and maintenance embodied, operational energy results, synthesis of conclusions and recommendations into the final report. a. Section (A) shows the available data on the service life of timber and other
window types under Australian conditions that can serve as a guide to improving service performance
b. Section (B) shows the environmental performance and LCA studies of windows expressed as life cycle ecopoints, and provides the basis for immediate marketing messages that can be drawn and initial recommendations for the industry to mitigate any liabilities through product innovation
5. SELECTION OF ARCHETYPES
Drawing on BRANZ experience of window testing for operational performance, the main variants of window systems were identified as:
• Opening Size
• Window Type / Mode of Opening
• Frame Material
• Glazing / Coatings / Spacing
• Gas fill (for multiple glazed)
AWA and WADIC assisted BRANZ by volunteering to survey their members to obtain more information about the market represented by each archetype, and AGGA also provided information. This has extended the value of this study since results can now be equated to a proportion of the market that each archetype represents. It will also allow the results to be projected into the future for any proposed scenarios of market change.
BRANZ adopted the following criteria to determine the list of archetypes:
1) Assemble a list of the frame types currently available in Australia.
4
2) Assemble a list of the glazing types currently available in Australia.
3) Assemble a list of the window and door sizes currently available in Australia.
4) Assemble a list of the hardware options currently available in Australia.
5) Reach consensus with industry on which of the above options best represent the Australian fenestration market.
6) Ensure that the relevant building codes are met by the specific parameters used for each member of the set of archetypes, and that best practice is used for thermal and durability considerations.
7) Use statistical techniques to ensure that a comprehensive survey of Australian fenestration options is represented as a set of ‘archetypes’ within a set of 51.
8) Add in minority glazing products to the archetypes when these products can be shown to have relevance to the study.
These were compiled into a series of tables with the variations in design parameters shown together with an estimate of the proportion of that variant served by the market. The list was refined in consultation with the Project Advisory Group to identify the following final list of archetypes for further study:
5.1 The archetypes The fenestration types that reside in the list of archetypes include doors and windows, framing and operating variations, together with single and double glazing. Sidelights and over-lights were not included in this work, nor were the variety of decorative and aesthetic ornamentations used.
Four frame types were chosen for the archetypes: standard aluminium (non-thermally broken); PVC; timber; and ‘aluminium-skinned’ timber, where the structural strength is provided by the timber, but the durability is provided by a thin ‘skin’ of aluminium. Three types of doors were chosen being: the familiar ‘Double Casement’ or ‘French’ doorset with a standard opening size of 2.1m with two 900mm wide leaves closing against each other; a sliding patio, or ‘Ranchslider’ of 2.7m wide; and a ‘Bifold’ door with four panels in two sets of two leaves of 3.6m wide. Four window types were used: the typical horizontal sliding window at 1200 high, by 1800 wide; an ‘awning’ or ‘toilet’ window which is a small, projecting top-hung window of 900 high by 600 wide; a ‘casement’ window being the typical side-hung timber window of 1200 high and 1200 wide; and a double hung window, commonly used in timber frame where one sash slides up and behind the higher sash, which also can slide down of 1200mm by 900mm wide.

5
Door / Window Fenestration type Height Width Panes Framing Glass 1 type
Glass 1 thickness
Gap between panes Gas Fill Glass 2 type
Glass 2 thickness
Market share (%)
27 doors, 38 windows.
1 Door Double Casement 2100 1800 2 Aluminium Toughened 5 0.60%2 Door Double Casement 2100 1800 2 Aluminium Toughened 5 12 Toughened 5 0.01%3 Door Double Casement 2100 1800 2 Timber Toughened 5 1.20%4 Door Double Casement 2100 1800 2 Coated timber Toughened 5 0.01%5 Door Double Casement 2100 1800 2 PVC Toughened 5 0.10%6 Door Double Casement 2100 1800 2 PVC Toughened 5 12 Toughened 5 0.10%7 Door Sliding Patio 2100 2700 2 Aluminium Toughened 5 5.00%8 Door Sliding Patio 2100 2700 2 Aluminium Toughened 5 12 Toughened 5 0.01%9 Door Sliding Patio 2100 2700 2 Timber Toughened 5 1.00%
10 Door Sliding Patio 2100 2700 2 Coated timber Toughened 5 0.01%11 Door BiFold 2100 3600 2 Aluminium Toughened 5 1.20%12 Door BiFold 2100 3600 2 Aluminium Toughened 5 12 Toughened 5 0.01%13 Door BiFold 2100 3600 2 Timber Toughened 5 0.10%14 Door BiFold 2100 3600 2 Coated timber Toughened 5 0.01%
15 Window Horizontal Slider 1200 1800 2 Aluminium Laminated Low-E 6.7 0.01%16 Window Horizontal Slider 1200 1800 2 Aluminium Clear annealed 4 6 Argon Clear annealed 4 0.01%17 Window Horizontal Slider 1200 1800 2 Aluminium Clear annealed 4 61.00%18 Window Horizontal Slider 1200 1800 2 Aluminium Toned 5 4.00%19 Window Horizontal Slider 1200 1800 2 Aluminium Laminated 6.38 0.20%20 Window Horizontal Slider 1200 1800 2 Aluminium Clear annealed 3 12 Clear annealed 3 0.10%21 Window Awning, toilet 900 600 1 Aluminium Clear annealed 4 9.00%22 Window Awning, toilet 900 600 1 Aluminium Toned 5 0.50%23 Window Awning, toilet 900 600 1 Aluminium Clear annealed 3 12 Clear annealed 3 0.01%24 Window Awning, toilet 900 600 1 Timber Clear annealed 4 4.00%25 Window Awning, toilet 900 600 1 Timber Clear annealed 3 6 Clear annealed 3 0.01%26 Window Awning, toilet 900 600 1 Timber Toned 5 0.10%27 Window Awning, toilet 900 600 1 Timber Clear annealed 3 6 Clear annealed 3 0.01%28 Window Awning, toilet 900 600 1 Coated Clear annealed 4 0.01%29 Window Awning, toilet 900 600 1 Coated Clear annealed 3 12 Clear annealed 3 0.01%30 Window Awning, toilet 900 600 1 PVC Clear annealed 3 12 Clear annealed 3 0.10%31 Window Casement 1200 1200 1 Timber Clear annealed 4 1.50%32 Window Casement 1200 1200 1 Timber Toned 5 0.10%33 Window Casement 1200 1200 1 Timber Laminated 6.38 0.01%34 Window Casement 1200 1200 1 Timber Clear annealed 3 6 Clear annealed 3 0.01%35 Window Casement 1200 1200 1 Coated Clear annealed 4 0.01%36 Window Casement 1200 1200 1 Coated Toned 5 0.01%37 Window Casement 1200 1200 1 Coated Laminated 6.38 0.01%38 Window Casement 1200 1200 1 Coated Clear annealed 3 12 Clear annealed 3 0.01%39 Window Double Hung 1200 900 2 Aluminium Clear annealed 4 3.00%40 Window Double Hung 1200 900 2 Aluminium Toned 5 0.10%41 Window Double Hung 1200 900 2 Aluminium Laminated 6.38 0.05%42 Window Double Hung 1200 900 2 Aluminium Clear annealed 3 12 Clear annealed 3 0.01%43 Window Double Hung 1200 900 2 Timber Clear annealed 4 6.00%44 Window Double Hung 1200 900 2 Timber Toned 5 0.10%45 Window Double Hung 1200 900 2 Timber Laminated 6.38 0.10%46 Window Double Hung 1200 900 2 Timber Clear annealed 3 6 Clear annealed 3 0.01%47 Window Double Hung 1200 900 2 Coated Clear annealed 4 0.01%48 Window Double Hung 1200 900 2 Coated Toned 5 0.01%49 Window Double Hung 1200 900 2 Coated Laminated 6.38 0.01%50 Window Double Hung 1200 900 2 Coated Clear annealed 3 12 Clear annealed 3 0.01%51 Window Double Hung 1200 900 2 PVC Clear annealed 3 12 Clear annealed 3 0.50%
Total 100.00%
6
6. SECTION A – SERVICE LIFE PERFORMANCE
This section reports on the ‘operational energy’ that may be attributed to the use of each of the archetypes, being the amount of energy that passes in either direction through each of the windows, which must then be accounted for in the operation of the window. While the actual operational energy results are not presented in isolation, they are included in Section B together with the other LCA results from embodied and life-cycle energies.
6.1 Methodology for Operational Energy Performance It was originally intended to use the WERS software to estimate the energy implications of each of the window systems. However, it did not prove possible to differentiate the performance of the window from the performance of the building that it was modelled within. For this study it was decided that the effect of the windows must be separated from the effect of the building so that valid assumptions may be made just about the windows’ performances. The alternative approach adopted was to use the concept of degree days which has the merit of simplicity, transparency and comparability, but with some limitations which are discussed below. There are two types of degree day data – heating degree days and cooling degree days and the calculation details are provided as Appendix 1. While the WERS approach maintains the inter-relationship of the windows with the building, taking the degree day approach has the effect of factoring out thermal mass, ‘code’ insulation values, inter-zone air infiltration and a number of other parameters. It effectively measures the windows’ performance under worst case conditions of low/no thermal mass, but at the same time does not load onto the apparent performance of the windows how the building as a whole responds to these factors. Heating degree days are a measure of the amount of heating needed and the length of time for which it is needed. The heating degree day figures published for each location are calculated as the integral of the product of time for which the external temperature is below a defined base comfort temperature and by how much the external temperature lies below the base comfort temperature. The base comfort temperature used for heating in Australia is 18 Deg C (lower than the real comfort temperature assuming that people, equipment and windows all provide heat that offsets the need for external heating). Cooling degree days provide the equivalent measure for the amount of cooling needed and the length of time for which it is needed. The cooling degree day figures are calculated as the integral of the product of time for which the external temperature exceeds a defined base comfort temperature and by how much the external temperature exceeds the base comfort temperature. The base comfort temperature used for cooling in Australia varies with acclimatisation and States and Territories expectations, but has been taken as 26 Deg C (higher than the real comfort temperature assuming that people, equipment and windows all provide heat that also needs to be removed by the cooling systems). Windows contribute to the need for heating or cooling of buildings due to the thermal conductivity of the window systems (their ‘R’ or ‘U’ values and their solar heat gain coefficients (SHGC)) and the air leakage (or deliberate ventilation) that the windows permit/allow that might take the internal temperatures outside of the comfortable temperature range. In addition, the windows permit radiated heat to enter buildings, which can be in the form of direct or diffuse solar radiation from the sun or from warm materials around the window. Direct solar radiation is very intense and varies dramatically with location, latitude and orientation. Designers generally design to shade direct solar radiation from entering
7
buildings, except perhaps for winter heating conditions, but even then it can still be problematic for glare discomfort or overheating. In this simulation, it is assumed that only diffuse solar gain is transmitted, where an average value for the SHGC of the individual glazing systems has been used. This will on average overestimate the heating requirement and underestimate the cooling requirement for buildings, representing a worst case scenario. In addition, because thermal mass of the building is not factored into this assessment, both heating and cooling will be based on a thermally lightweight building, where the building has no capacity to ‘even-out’ the external temperature swings for the internal spaces of buildings – this again will overestimate both heating and cooling loads. Likewise there are no inter-zone air flows allowed, although air infiltration through air leakage at windows has been incorporated. Hence the heating and cooling loads modelled here can be considered as worst case, which provides an appropriate conservative approach, separating the effect of the archetype windows from the effect of the building, and providing a result for the ‘worst case’ building.
6.2 Service Life Performance Results To maintain the performance of the archetype window systems, there are specific requirements for maintenance, based on best international practice. While the Australian Building Code (ABC) has avoided specifying ‘lifetime expectations’, or ‘maintenance intervals’ for parts of buildings (including the building envelope) guidance has been taken from international building codes in similar climates. Here we can see that non-structural elements that are used in the external skin of residential buildings are required to have a durability exceeding 15 years. Structural elements of residential construction typically require a 50 year durability, and those elements that are relatively easily replaced, and where the need for maintenance can be seen without removal of elements, can be expected to have a durability of only 5 years (or alternatively need maintenance at this interval to maintain their performance). While some timber window systems have historically been used as part of the structure of external residential walls, this is no longer expected within the Australian glazing standards (AS2047, AS1288), so that the maintenance interval for fenestration could be seen as 15 years, with a durability requirement of less than 50 years. 6.2.1 Air Leakage results
The aluminium, PVC and aluminium skinned timber window and door systems represented within the archetypes have been assumed to require the replacement of their external glazing seals at 5 yearly intervals to maintain the air leakage performance of the window system at 1 l/sec.m² (at 75 Pa), as required by AS2047 Table 2.3. The glazing putty in the timber framed windows is also replaced at 15 year intervals to maintain this air leakage performance. It has been assumed that all the archetypes meet this air leakage performance requirement. 6.2.2 Lifetime of components
All the components of the archetype set have varying lifetimes. For the purposes of this report, where specific lifetimes could be defined, they are used, but in other cases the requirements of international building codes in similar climates are followed. While some of the more recent window developments have been less concerned with durability than with aesthetics, there remains the benchmark of element maintenance/replacement required every 5 years for elements that are visible and easily replaced, and 15 years for elements that are non structural.

8
6.2.3 Lifetime of windows
While the lifetime of the complete window as a product is required to have a lifetime of 15 years, it is understood that with maintenance, window systems can last considerably longer than this, and in fact there are examples of largely original timber windows still existing in some of the early colonial dwellings with a life span approaching 200 years. Current window performance shows a market dominated by aluminium horizontal sliding windows that can continue to perform well past the expected 15 year mark, provided the maintenance of the ‘mohair’ sliding seals and hardware is performed. External beads (aluminium and PVC) will need to be replaced at 15 year intervals, and surface coatings on timber will need to be replaced at 5 year intervals. Hardware such as locks, handles and stays will often slowly degrade and lose functionality, although sudden failure occurs when fasteners (particularly in maritime and heavy industrial areas) corrode. These elements are also expected to have a 15 year lifetime, although in reality they are often not replaced, and the user suffers the slow degradation of performance, as stays sag, handles loosen, seals harden, shrink and perish, locks wear and moving parts bind. International studies have found that the anticipated life expectancy of the framing used in window systems varies with type. While no specific Australian studies of lifetime have been performed, it seems reasonable to use the international results as a guide for lifetime expectation in Australian climates. Only one published study could be found, which gave a lifetime of 45 years for ‘aluminium-skinned timber’, 40 years for aluminium, 35 for timber and 22.5 for PVC. Experience of lifetimes in the range of Australian climates indicates that the life expectancy of windows varies greatly, and that in maritime environments some window types will degrade significantly faster than in dry alpine areas. However, there is still a reasonable correlation between the lifetimes of the various types, such that the comparative lifetimes appear to still be appropriate. The replacement of seals at 5 yearly intervals, external aluminium or PVC beads at 15 years, and complete IGUs at 20 year intervals are the other major factors governing the operational life of window systems, which are otherwise limited by the numbers above for window system lifetimes. Double glazing will normally fail due to internal fogging, (when moisture appears between the panes) which does not imply a failure to perform thermally, but is an aesthetic failure. Therefore if double glazing is not replaced at its anticipated 20 year lifetime, it will have an insignificant effect on the energy performance, unless it has a major failure mode of glass cracking, or begins to fill with water. 6.2.4 UV degradation
Chemical degradation of window framing systems occurs from the incidence of high levels of ultraviolet radiation. This is a particular problem for plastics materials, such as PVC framing, weather seals, glazing seals, and surface coatings. This is both a problem at low (equatorial) latitudes due to high sunlight intensity, and also a problem of the higher latitudes that are increasingly being affected by tropospheric ozone depletion (ozone hole). It is UV degradation that is the main cause of the shrinkage of some of the plastics material comprising external glazing ‘rubbers’ which leads to both air infiltration and water ingress, and why there is a 5 yearly expectation for seal replacement. While UV light has a deleterious effect on other components, provided that the double glazing edge seals are protected (see below), and coatings are maintained on timbers, this degradation is aesthetic only, and is not functional.

9
6.2.5 Energy performance of windows
The thermal performance of the archetypes has been developed as discussed above using the degree days methodology. R values have been calculated for each of the archetypes using the WERS thermal performance numbers as a basis, with modifications made for the size of the windows and the structural and safety requirements of the glazing code (AS1170.2 and AS/NZS2208). While it is recognised that the actual ‘R’ values of the windows and doors is actually a dynamic parameter, the same assumptions as imbedded in the Accurate software, stemming from the NatHERS and WERS work have been used, together with appreciation of the role of the SHGC in diffuse solar transmission. Given the discussion above on durability, it has been assumed that the R value does not degrade since maintenance is performed as necessary, and ensures this is the case. 6.2.6 Double Glazing (IGUs)
Double glazing (or insulated glazing units known as IGUs) internationally are known to have a 35 year lifetime, although this is typically stated as 30 - 35 years for lifetime forecasting purposes in countries where international-standard durability assessments are regularly performed. The Australian IGU industry is still relatively young, and there has been very little penetration of double glazing into the domestic market, although international-best practice in sealant-use and IGU-design is being adopted. Therefore, until a comprehensive survey of Australian domestic IGU lifetime can be performed, the lifetime of IGUs can only be assumed to be for the lesser period of 20 years within the Australian environment. The Australian domestic market could benefit hugely from the greater use of double glazing in domestic applications, since significant energy savings are possible particularly in the cooling-dominated climates of QA, WA and NT, as well as in the mixed climates of NSW, SA, and Vic, and not just the heating-dominated climates of Tasmanian, or of the ACT, which is the more traditional market for IGUs, and where WERS first was launched in 1994. Section B of this report shows this energy performance. The Australian IGU industry has not yet adopted a robust means (such as the European standard EN1279-3) for assessing the Argon gas loss from within double glazed units. Until Australian-built units that have been accredited against EN1279-3, they must be assumed to lose gas at more than 1% per year, (the requirement of EN1279 Part 3) which leads to a slow decrease in thermal performance. This decrease is not measurable until the Argon concentration falls below 85%, however complete filling of the IGU cavity with Argon must be assumed. The Australian manufacturers who are already gas-filling, use equipment that is calibrated to deliver known quantities of gas. Given the use of the BS5713 IGU durability test, some assurance can be gained that the performance of all the double glazing units will be retained within reasonable bands for a 20 year lifetime. Although the degradation of performance of gas-filled IGUs is expected, this has not been factored into this analysis, since the Argon-filled units do not feature highly in the volume production.
6.3 Service Life Performance Recommendations The major factor affecting the service life of fenestration, is the maintenance of the window and door systems. While many consumers believe that aluminium and PVC framed windows and doors, together with aluminium skinned timber fenestration, are essentially maintenance-free, this is actually not the case. The aluminium window manufacturing industry recommends cleaning windows at regular intervals (monthly in some States and Territories) with warm soapy water to remove surface contaminants and maintain the anodised or powder aluminium skinned finish. Similarly the timber window industry recommends maintaining the finish coats on the exterior joinery to shield the timber from the deleterious effects of the weather. Maritime, congested-urban, dusty, and heavy industrial environments

10
can be particularly harsh on window products exposed to the exterior environment, as can exposure to high levels of UV light, as discussed above. Section B discusses cleaning issues, and shows that there is no significant differentiation between cleaning requirements for any of the window types. The window systems that can be seen to perform the best in terms of service life currently are horizontal sliding windows made of ‘aluminium-skinned timber’, followed by aluminium, then timber and finally PVC. The other window types cannot be easily separated in terms of lifetime, however may be critically dependent upon the mechanical failure of their hardware, provided that maintenance is performed. Caution must be shown with the use of this information, since this conclusion is made on the basis of non-Australian data, however it has been assessed as being relevant to Australia.
6.4 Service Life Performance References 1 Brown AW, Allwinkle A.J, Weir GF, 1999, “Durability of Building Materials and
Components 8”, Institute for Research in Construction, Ottawa ON, KIA 0R6, Canada 2 Scharai-Rad M, Welling J, 2002, “Environmental and energy balances of wood
products and substitutes”, FAO, Rome 3 Shorrock L.D, Henderson G, 1980, “Energy use in buildings and carbon dioxide
emissions”, Building Research Establishment Report (L7)(R3) 4 Weir G, 1998, “Life Cycle Assessment of multiglazed windows”, Ph.D. Thesis, Napier
University 5 Han B, 1996, “Thermal transmission characteristics of multi-glazed windows”, Ph.D.
thesis, Napier University 6 Abodahab N, 1998, “Temperature stratification in double-glazed windows and its
effect on condensation”, Ph.D. thesis, Napier University 7 Weir G, Muneer T, 1997, Low-emissivity coatings in high-performance double-glazed
windows: Energy, monetary and environmental costs, Building Services Engineering Research and Technology, 18 (2), 125-127
8 Fernie D, Muneer T, 1996, “Monetary, energy and environmental cost of infill gases for double glazings”, Building Services Engineering Research and Technology, 17 (1) 43-46
9 EMPA, 1996, “Ecological assessment of window structures with frames made from different materials without glass”, SZFF Riedstrasse 14, CH-8953 Dietikon, Switzerland.
10 EN1279 Parts 1-6, 2000-2006, “Glass - Durability of double glazing”, Standard of the European Union
11 NZS4218:2004 energy Efficiency – Small building envelope. 12 AS/NZS4666:2000. Insulating Glass Units. 13 AS/NZS 4668:2000 Glossary of terms used in the glazing industry. 14 Isaacs NP et. al, “A sensible step to building energy efficiency: 1995 revision of NZBC
clause H1”; Centre for building performance research, Victoria university of Wellington, 1995.
15 AS/NZS 2208: Safety glazing materials in buildings. 16 AS 1170-2 (Supplement 2002) Loads on buildings.

11
7. SECTION B – LIFE CYCLE ASSESSMENT
Section B of the report provides an analysis of the comparative environmental performance of windows using LCA from which marketing messages can be drawn for the environmental benefits of timber framed windows and from which initial recommendations can be made for the industry to mitigate any liabilities or further improve performance through product innovation.
7.1 Project LCA Methodology This entailed the following key steps:
• Selection of an LCA application protocol • Estimation of material quantities for each archetype • Use of Simapro to derive/compile Life Cycle Inventory data for each material • Adaptation of Simapro inventory data for consistent methodology and Australian
relevance • Estimation of the total embodied impacts for each archetype • Identification of the replacement rates for window components • Estimation of the component replacement embodied impacts for each variant • Estimation of the energy consumption for heating and cooling and the fuel mix in
each State and Territory • Use of Simapro to derive/compile Life Cycle Inventory data for each energy source • Impact assessment for all phases – initial embodied, life cycle embodied, energy
implications • Characterisation • Normalisation • Weighting • Collation of results from all phases
7.1.1 Selection of LCA Application Protocol
BRANZ is committed to using an LCA approach that is both ISO14040 compliant and consistent for all materials and products at all life cycle stages and points on the supply chain. In this work, BRANZ have used the BRE Environmental Profiles Methodology Ref 17. and attempted to bring all the data used to a common economic basis for allocation between co-products, adapt any data that originates from overseas to an Australia relevant context and ensure that the scope used for different data sources is, as far as possible consistent and compatible and appropriate for this project. 7.1.2 Goal and Scope and Functional Unit
The Goal of the study was to conduct a comparative review of the available studies conducted in Australia or elsewhere on the environmental life cycle and service life of timber framed, aluminium framed and other window systems. The scope was cradle to site over the life of the products (Window systems being assessed over a 60 year life), in accordance with the BRE Environmental Profiles Methodology. This approach accounts for end-of-life aspects in terms of the recycled content of the materials going into the new products. The methodology treats recycled content as though it was mined from the waste stream at the start of the life cycle analogously to mining the resources for primary product rather than recycled at the end of life. The scope stops at end of life to

12
avoid double counting. This makes all data contemporary and attributional (rather than mixed between attributional for new material but consequential and less certain for recycling at the end of life). The data was compiled for each window system with its attendant dimensions, but the results are compared in terms of an equivalent 1m2 served by each window. 7.1.3 Material Quantities
The approach taken comprised estimating the material quantities used for each of the 51 archetypes. This was done by determining the list of parts to construct the different window types and determining material quantities per component (e.g. hardware, corner pieces), per m length of component (e.g. frame section, casement section, mullion section, transom section, IGU spacer bar) or per m2 area of component (e.g. glazing, IGU) as appropriate to the component. These were then multiplied by the corresponding number of components, length of component or area of component to provide the material quantities estimate. 7.1.4 Component Life and Replacement
Component life and replacement is discussed in section A and determined the lifetimes assumed for the LCA studies as follows: Frame Material
Frame/ Sash
Frame/ sash joints
Wedges, brushes, seals
Hardware Glass IGU Reveal liners
Powder Coat
Paint
yrs yrs yrs yrs yrs yrs yrs yrs yrs
Aluminium 35 15 5 15 35 20 15 15 5
Timber 35 15 5 15 35 15 15 15 5
Aluminium skinned Timber
45 15 5 15 45 20 15 15 5
PVC 22.5 15 5 15 - 20 15 15 5
The life of the whole window system is of course the same as the life of the Frame/sash combination. 7.1.5 Life Cycle Inventory Data (LCI)
For this phase of the project, BRANZ used the Simapro v7.0 software to compile the inventory data for the materials and products used and to characterise the data (discussed below). Compiling the inventory data was the most complex aspect of this project. BRANZ are committed to consistency in their LCA assessment of all materials and products. However, the commonly available sources of materials LCA/LCI data internationally (mainly European) and for Australia have been compiled by different researchers at different times working for different industry sectors where different methodological choices are considered the norm. This problem is compounded because it also applies to the upstream supply chain for any product being manufactured and to any downstream products fabricated. This means that the data used for the different window system components may have very different rules applied to the allocation of burdens between co-products and the data may

13
have a different geographic relevance, a different scope and a different timeframe. Moreover, for window systems, life cycle performance implies a reconciliation of the energy in use implications with the embodied implications derived from the materials of manufacture. It is important that the rules used for the energy supplies are compatible with the rules used for the materials used. Many materials are also recyclable or carry a proportion of recycled content or both. This implies the need for rules which provide a discount from recyclable primary products because they are going to be available for recycling, whilst transferring the discount to the recycled product spread over its recyclable lives to account for the fact that the recycled material can only be available if it has previously been produced from primary manufacture. Many of the window components (plastics) derive from fossil fuel resources. These need to be treated differently for their emissions to the fossil fuel resources that are consumed by combustion. Finally, the timber framed materials are renewable resources that sequester carbon dioxide from the atmosphere and sequester solar energy as the timber is being grown. If the scope of the methodology used to derive the data is drawn from the point of harvest of the timber, then the benefits of sequestered carbon and solar energy in the timber are not accounted for. For this study, sequestered carbon was taken into account, with the scope being drawn from the point of seeding the trees. 7.1.6 Data Sources
The main data source used for the LCA was Australian dataset provided with the Simapro v7.0 software. This data mostly originates from RMIT. Where required data were not available, BRANZ used data from the Ecoinvent database which originates from the Ecoinvent Center in Switzerland and compiles data for most European countries. New data was obtained for glass from Pilkingtons. The main adaptations made to the data used for this project were as follows:
1 Universal and consistent application of economic allocation between all co-products and recycled wastes from all processes, including to end-of-life recycled materials going to recycled products. This affects all components and energy sources and feedstocks either directly or indirectly from their upstream supply chain.
2 Provision of discounts to the primary products that are recyclable on the basis of the value and quantity of scrap recycled compared to the value and quantity of primary product produced
3 Transfer of this discount and spreading it between the recycled materials that derive from the primary product in proportion to their value and quantity
4 Review of the unit process data for all material inputs (except PVC) to ensure consistency of feedstock emissions accounting. (The only raw PVC resin data available was from the Ecoinvent data and presented as a System process which prevented adaptation to the Australian context and to consistency of methodology with the other materials – it is hard to determine either the extent or direction (larger or smaller impact) of the error that this implies)
5 Review of the unit process data for all renewable material inputs (mainly timber, but also some vegetable oils) to ensure that the scope accounted for sequestered CO2 and solar energy – this was not the case in the basic Australian data set. In doing so, the data reflects a significant difference in CO2 sequestration from fast-growing plantation species compared to slower growing but more durable broad-leaved timber.

14
6 Adoption of LCA data for timber species that were considered closest to those used for manufacture of timber framed windows – data for the specific species and Australian forestry practices could not be found.
7 Numerous minor changes to maximise consistency of assessment. 7.1.7 Data Gaps
BRANZ encountered a number of data gaps for the materials used and in the supply chain of materials used. The following approach was taken for materials for which data could not be found:
Material Action Reason
Silica Gel Omitted Only affects IGU’s, only a small mass used per unit, unlikely to affect final results significantly
Coating for toned glass Omitted Very small quantities of material used – sputtering process for application likely to be more significant, but no data readily available for this
Polyvinyl Butyral (PVB) Estimated from the known chemical constituents, stoichiometric quantities, analogous processes for polymerisation
Best professional judgment – significant quantity used in laminated glass systems
Linseed oil putty Estimated from the known chemical constituents in an average oil/filler mix substituting a vegetable oil for linseed oil (for which no data were available)
Best professional judgment
Polyisobutylene strip Assumed similar to PVB Small mass of material therefore small contribution to the final result
Polyurethane sealant Assumed similar to PVB Small mass of material therefore small contribution to the final result
Ethyline propylene diene monomer rubber (EPDM)
Assumed similar to PVB Small mass of material therefore small contribution to the final result
Polyisoprene rubber Assumed similar to PVB Small mass of material therefore small contribution to the final result

15
2-Butoxyethanol No data could be found or adapted
Small quantity used, but used many times over the life and likely to be a fairly high impact chemical
In addition, for many materials used in the lifecycle, the upstream data nearly always originate from Europe, drawing from the Ecoinvent or Buwal databases. These have embedded assumptions about fuel mix, transport distances and allocation rules between co-products. In most cases the data was available in “inventory” format and this allowed modification of the fuel mix and allocation rules to indigenise the data. The available Australian data appears to be largely comprised of indigenised European data rather than data sourced directly from and relevant to Australia. For many processes, the thermodynamics of the process and the economics of the market constrain the results to a narrow range of variation and the results are probably valid. The main problem areas for indigenisation were:
• The only source of PVC data was system process data from the BUWAL database and could not be indigenised to Australian production. This is appropriate for Australian production because Australia is not a producer of PVC resin.
• Timber LCA data used was for Radiata Pine from New Zealand and generic broad leaved timber from Australia. It is recommended that Australian plantation and forest timber LCI’s and LCA’s are developed for specific timber species to confirm these results before the results of the project are exploited too vigorously. It is understood that these data are being developed in a project that is being undertaken by CSIRO.
• Transport data (road and rail freight - have not been amended from the predominantly European data sources, although the diesel and electric fuel sources have been indigenised.
It is difficult to confidently predict the affect of these uncertainties on the final results, but BRANZ would expect the major conclusions drawn here to be robust to these uncertainties. 7.1.8 Impact Assessment
It is very common for LCA practitioners to use impact assessment methods (e.g. Ecoindicator 99 NL and Europe) that come packaged within tools like Simapro without adapting them to country context. BRANZ have taken the following approach to impact assessment to generate an Australian ecopoint.
7.1.8.1 Characterised Data In this project, in line with the BRE ecoprofiles methodology, BRANZ used the characterisation data from CML Leiden updated to the 2002 dataset. These are considered appropriate internationally for global impacts but should be adapted to a national context (or better still to a climate region or bioregion context) for local impacts. This work is beyond the scope of this project but should be considered as a proposal to ALCAS and Australian government. Using the CML 2002 characterisation factors, life cycle data is characterised under the following headings:
• Abiotic Depletion • Global Warming (GWP100 years) • Ozone Depletion Potential (ODP) • Human Toxicity • Fresh Water Aquatic Ecotoxicity

16
• Marine Aquatic Ecotoxicity • Terrestrial Ecotoxicity • Photochemical Oxidation • Acidification • Eutrophication
Most are clearly defined, but the abiotic depletion factors relate to resource depletion issues including water, fossil fuel depletion etc. This data has very much a European context and is probably not appropriate to the Australian context. For Australia, it would have been better to have broken down the abiotic depletion category into separate sub-categories of:
• Landfill Waste • Water Consumption • Oil & Gas Depletion • Solid Fuel Depletion • Deforestation • Productive Farmland lost • Habitat & Ecosystem
Then Australia relevant characterisations, normalisations and weightings could be applied. This work exceeds the scope of this project but might be considered as a component of the development of an Australian national LCA methodology and database. This might be promoted with ALCAS, Industry and Government. For this work, the abiotic depletion category was excluded and the results renormalised excluding this factor. If future work provides appropriate characterisation factors for this class of impacts, the results can be refined to take them into account.
7.1.8.2 Normalisation Australia Commensurate with these impact categories, BRANZ have compiled the following data for Australia which were used to normalise the characterised data for the materials, energy and water consumption associated with each of the archetypes:
Global Warming (GWP100 years) kg CO2 eq 34222
Ozone Depletion Potential (ODP) kg CFC-11 eq 0.0136
Human Toxicity kg 1,4-DB eq 51102
Fresh Water Aquatic Ecotoxicity kg 1,4-DB eq 1679
Marine Aquatic Ecotoxicity kg 1,4-DB eq 574025
Terrestrial Ecotoxicity kg 1,4-DB eq 259
Photochemical Oxidation kg C2H4 eq 14.8
Acidification kg SO2 eq 128
This data was compiled from national statistics from ABS, ABARE and the national pollutant emissions inventory (NPI data).

17
7.1.8.3 Weighting Australia In order to apply Australian relevant weightings of the impacts, BRANZ reviewed weighting data from UK, US and NZ and correlated them / adapted them for the regional variations used by the Green Building Council of Australia to generate the following State based weightings:
Weightings by State ACT NSW NT QLD SA TAS VIC WA Au
AverageGlobal Warming (GWP100) 17.0 17.0 17.4 17.4 16.5 15.9 16.5 17.0 16.8Ozone Layer Depletion (ODP) 6.6 6.6 6.8 6.8 6.4 6.2 6.4 6.6 6.6Human Toxicity 8.9 8.9 9.1 9.1 8.7 8.7 8.7 8.9 8.9Fresh Water Aquatic Ecotoxicity 3.6 3.6 3.1 3.1 4.4 5.3 4.4 3.6 3.9Marine Aquatic Ecotoxicity 5.3 5.3 5.5 5.5 5.2 5.0 5.2 5.3 5.3Terrestrial Ecotoxicity 3.0 3.0 3.1 3.1 2.9 2.8 2.9 3.0 3.0Photochemical Oxidation 8.9 8.9 9.1 9.1 8.7 8.7 8.7 8.9 8.9Acidification 3.9 3.9 3.9 3.9 3.8 3.6 3.8 3.9 3.8Eutrophication 3.6 3.6 3.1 3.1 4.4 5.3 4.4 3.6 3.9
It is surprising that the regional weightings do not change much between States and Territories given the different vulnerabilities to climate and water shortage. This is also another area which may warrant further development.

18
7.2 LCA Results
7.2.1 Initial Embodied Performance
Figure 1 shows the initial embodied CO2 and Figure 2 shows the initial embodied ecopoints for the production of each of the archetype windows.
Fig 1 Embodied CO2
0
500
1000
1500
2000
2500
51 Archetype Windows
kg C
O2-
E
Fig 2 Embodied Ecopoints (Average Australia)
0.0
0.5
1.0
1.5
2.0
2.5
3.0
3.5
4.0
51 Archetype Windows
Ecop
oint
s
There is a strong correlation between the ecopoint scores and the embodied CO2 results, with window size as the dominant factor.

19
Figures 3 and 4 show the corresponding results per m2 of window, revealing the importance of frame type for initial embodied performance. The aluminium framed window has a consistently higher embodied impact per m2 of window expressed either in terms of embodied CO2 or ecopoints. The best performer for embodied CO2 is the aluminium skinned timber framed window, probably reflecting the use of fast growing poorer quality plantation timber (achieving rapid sequestration of CO2). Next best (40% higher than aluminium skinned timber) is the hardwood framed window again reflecting its sequestration of CO2, but at a slower rate. The hardwood framed window though does not need a protective skin to give it durability. Next best is the PVC framed window (45% higher than aluminium skinned timber) and the aluminium frame worst (147% higher). The best performer overall for the full range of parameters assessed by the ecopoint is the hardwood timber framed window. Next best are the PVC framed (28% higher) and
Fig 3 Embodied CO2 per m2
Al
Al
TiAl/TiPVC
PVC
Al
Al
TiAl/Ti
Al
Al
TiAl/Ti
Al
Al
AlAlAl
Al
AlAl
Al
Ti
Ti
Ti
Ti
Al/Ti
Al/Ti
PVC
TiTiTiTi
Al/TiAl/TiAl/Ti
Al/Ti
AlAlAl
Al
TiTiTiTi
Al/TiAl/TiAl/Ti
Al/Ti
PVC
0
50
100
150
200
250
300
350
400
450
500
51 Archetype Windows
kg C
O2-
E /m
2 W
indo
w
FrameAl AluminiumTi TimberPVC PVCAl/Ti Aluminium Skinned Timber

20
aluminium skinned timber framed windows (29% higher). Once again, the aluminium framed window is highest (197% higher). Whether the windows are single or double glazed is also a significant factor in the embodied CO2/ecopoint performance. Comparing between equivalent window types double glazing adds on average about 25% to the embodied CO2 impacts and about 17% to the embodied ecopoints of the window system. This addition varies with window size and frame type ranging from about 10% to 50% extra in CO2 terms or 10% to 40% extra in ecopoint terms. The style of window/door also significantly affects the results. Per square metre of door opening, the sliding door consistently gave the lowest embodied CO2 and ecopoints – bi-fold doors were 8-9% higher – double casement doors worst at 26%-28% higher. Per square metre of window opening, the casement windows consistently gave the lowest embodied CO2 and ecopoints - double hung windows are next best 26%-32% higher and awning style windows worst overall 35%-43% higher. For aluminium framed windows horizontal sliding windows have the lowest CO2 and embodied ecopoint performance. Figure 5 shows how the ecopoints are distributed amongst the different impact categories. Across all categories, the aluminium framed windows have the highest impacts except for ozone depletion potential, where the PVC framed windows have significantly the highest relative impact. The PVC framed window has generally the second highest impact throughout, but the aluminium skinned framed window is higher in the toxicity categories – human, fresh water and marine.
Fig 5 Normalised Embodied Impacts by Category (Av All Windows)
1.E-05
1.E-04
1.E-03
1.E-02
1.E-01
1.E+00
globa
l warm
ing (G
WP100)
ozon
e lay
er de
pletio
n (ODP)
human
toxic
ity
fresh
wate
r aqu
atic e
cotox
.
marine
aqua
tic ec
otoxic
ity
terres
trial e
cotox
icity
photo
chem
ical o
xidati
on
acidi
ficati
on
eutro
phica
tion
Pers
on.Y
ears
of I
mpa
ct
AlTiAl/TiPVC
These results may appear to contrast the overall performance results because these are normalised results with no weighting applied to the categories. If stakeholder opinion upgrades the relative importance of toxicity issues then the aluminium skinned timber framed window might be vulnerable to such changes in priorities for environmental protection. If stakeholders upgrade their opinion of the relative importance of climate change, then the aluminium skinned timber framed window would be favoured by this perception. Readers are advised to use caution in quoting these results, because in categories where none of the products makes a significantly damaging contribution then the presentation may imply a greater significance for these small differences than is justified.

21
Figure 6 shows how the embodied ecopoint scores for the double hung windows vary by State and Territory as a result of the different weightings. The variation is only small, so for the embodied impact results, we can use the Australian average values for the embodied performance in all locations.
Fig 6 Windows Double HungInitial Embodied Ecopoints by State
0.0
0.1
0.2
0.3
0.4
0.5
0.6
0.7
0.8
Al-S Al-S Al-S Al-D Ti-S Ti-S Ti-S Ti-D Al/Ti-S Al/Ti-S Al/Ti-S Al/Ti-D PVC-D
Ecop
oint
s
ACTNSWNTQLDSATASVICWAAU Average
7.2.2 Life Cycle Embodied Performance
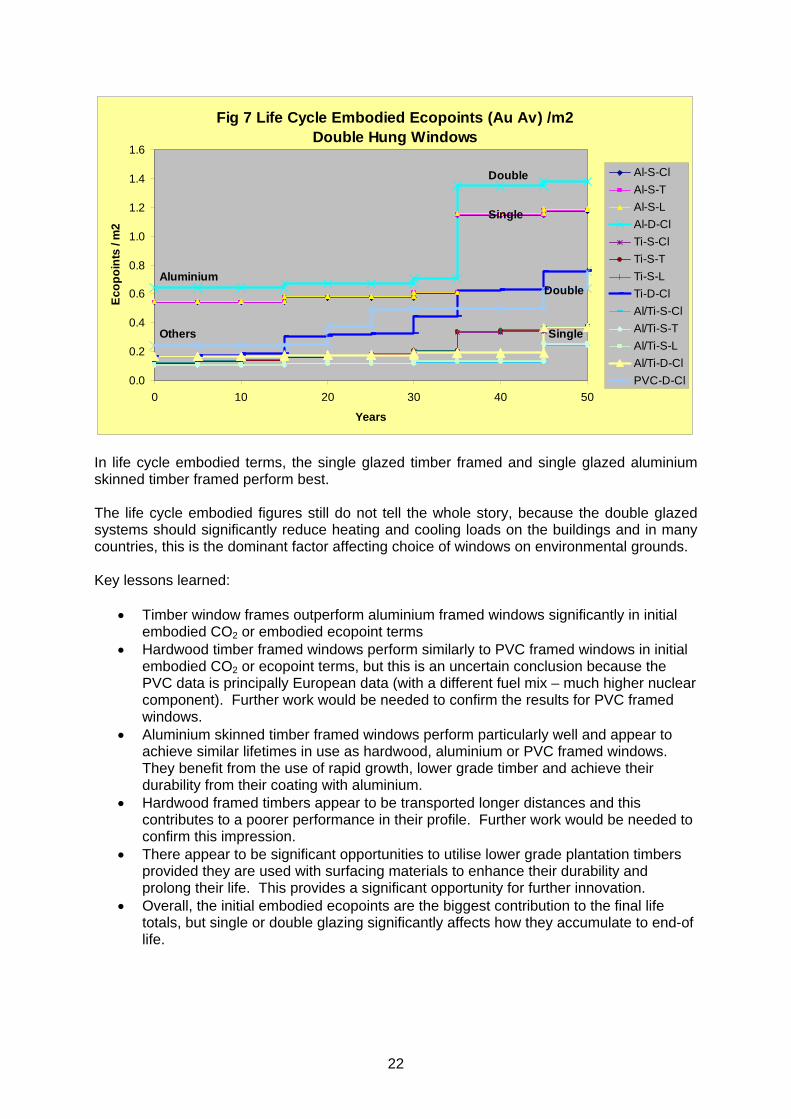
Using double hung windows as an example, Figure 7 shows how the embodied ecopoints accumulate over an assumed 50 year life for the windows as different parts are renewed. The aluminium framed windows start off with the highest impact overall, with the others performing more similarly, the timber framed windows performing best. As the IGUs are replaced on the double glazed windows, so these cause a step in the life cycle embodied profile. The replacement components for single glazed units contribute far less over the life cycle, hence the lower gradient of increase. The largest step increases arise at the end of the life of each window.
22
Fig 7 Life Cycle Embodied Ecopoints (Au Av) /m2Double Hung Windows
0.0
0.2
0.4
0.6
0.8
1.0
1.2
1.4
1.6
0 10 20 30 40 50
Years
Ecop
oint
s / m
2
Al-S-ClAl-S-TAl-S-LAl-D-ClTi-S-ClTi-S-TTi-S-LTi-D-ClAl/Ti-S-ClAl/Ti-S-TAl/Ti-S-LAl/Ti-D-ClPVC-D-Cl
Aluminium
Double
Single
Double
SingleOthers
In life cycle embodied terms, the single glazed timber framed and single glazed aluminium skinned timber framed perform best. The life cycle embodied figures still do not tell the whole story, because the double glazed systems should significantly reduce heating and cooling loads on the buildings and in many countries, this is the dominant factor affecting choice of windows on environmental grounds. Key lessons learned:
• Timber window frames outperform aluminium framed windows significantly in initial embodied CO2 or embodied ecopoint terms
• Hardwood timber framed windows perform similarly to PVC framed windows in initial embodied CO2 or ecopoint terms, but this is an uncertain conclusion because the PVC data is principally European data (with a different fuel mix – much higher nuclear component). Further work would be needed to confirm the results for PVC framed windows.
• Aluminium skinned timber framed windows perform particularly well and appear to achieve similar lifetimes in use as hardwood, aluminium or PVC framed windows. They benefit from the use of rapid growth, lower grade timber and achieve their durability from their coating with aluminium.
• Hardwood framed timbers appear to be transported longer distances and this contributes to a poorer performance in their profile. Further work would be needed to confirm this impression.
• There appear to be significant opportunities to utilise lower grade plantation timbers provided they are used with surfacing materials to enhance their durability and prolong their life. This provides a significant opportunity for further innovation.
• Overall, the initial embodied ecopoints are the biggest contribution to the final life totals, but single or double glazing significantly affects how they accumulate to end-of life.

23
7.2.3 Use Phase Results
The CO2-e emission factors used are from the AGO Factors and Methods Workbook, December 2006. The fuel mix chosen for heating and cooling comes from Environmental Issues: Peoples Views and Practices - ABS 4602.0 March 2006.
7.2.3.1 Cooling Figure 8 shows the CO2-E emissions that would arise because of the excess heat entering and retained in buildings due to each of the window archetypes (assuming direct sun is shaded and only diffuse transmitted). This heat would need to be removed by mechanical cooling to maintain comfort conditions within the buildings where they were installed. These figures are based on an average Australian home (assuming that it is equipped with air conditioning). Obviously these figures vary significantly with location and prevailing climate, so the best (Tasmania) and worst (Northern Territories) cases and the Australian average are all shown. Figure 9 on the following page shows the corresponding results in Australian ecopoints Not surprisingly, the CO2-E for cooling correlates precisely with the ecopoints for cooling – both the variation in CO2-E and the variation in ecopoints are a function of the electricity consumption for cooling and the thermal properties of the windows – which will be identical to both. As for the embodied results, window area is the largest factor.
Fig 8 Cooling CO2-E
0
200
400
600
800
1000
1200
1400
1600
1800
2000
51 Archetype Windows
kg C
O2-
E
NTAverageTAS
Doors
Windows

24
Figures 10 and 11 show the CO2-E and ecopoint results expressed per m2 of window area.
Fig 9 Cooling Ecopoints
0.0E+00
5.0E-01
1.0E+00
1.5E+00
2.0E+00
2.5E+00
3.0E+00
3.5E+00
4.0E+00
51 Archetype Windows
Ecop
oint
s
NTAverageVIC
Doors
Windows
Fig 10 Cooling CO2-E per m2
S
D
SSS
D
S
D
SSS
D
SSS
D
SSS
D
SS
DS
D
S
D
S
DD
SSS
D
SSS
D
SSS
D
SSS
D
SSS
DD
SDSSSDSDSSSDSS SDSSSDSSDSDSDSDDSSSDSSSDSSSDSSSDSSSDD
SDSSSDSDSSSDSS SDSSSDSSDSDSDSDDSSSDSSSDSSSDSSSDSSSDD
0
50
100
150
200
250
51 Archetype Windows
kg C
O2-
E / m
2
NTAverageTAS
S Single GlazedD Double Glazed

25
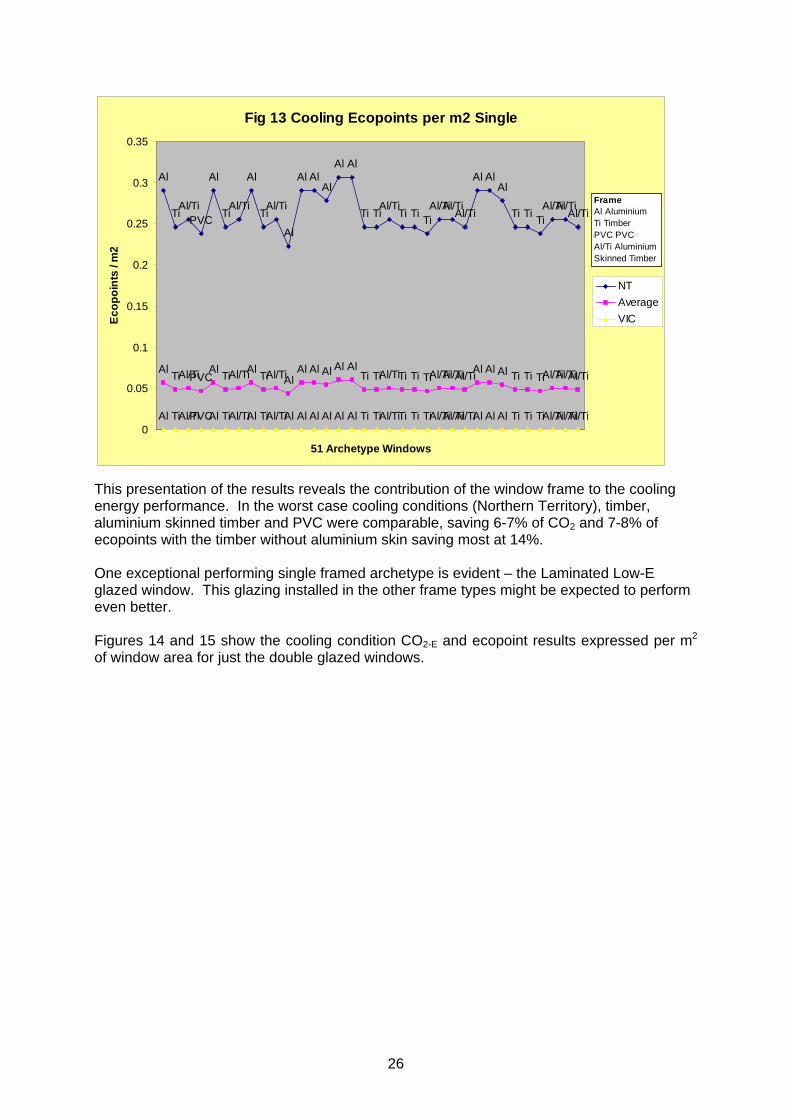
This presentation of the information reveals the significance of double glazing for reducing cooling loads on the buildings compared to the single glazed alternatives, but also reveals that in average or cooler parts of Australia, the benefit of double glazing becomes quite marginal. This was an unexpected result – most other studies find that high performance glazing is almost always justified for both heating and cooling. Figures 12 and 13 show the cooling condition CO2-E and ecopoint results expressed per m2 of window area for just the single glazed windows.
Fig 11 Cooling Ecopoints per m2
D
DDDD
D
D
DDD
D
DDD
DD
DDD
D
DD
DD
D
D
D
D
DD
DDD
D
DDD
D
DDD
DDDD
D
DDD
DD
DDDDDDDDDDDDDD DDDDDDDDDDDDDDDDDDDDDDDDDDDDDDDDDDDDD
DDDDDDDDDDDDDD DDDDDDDDDDDDDDDDDDDDDDDDDDDDDDDDDDDDD
0.0E+00
1.0E-01
2.0E-01
3.0E-01
4.0E-01
5.0E-01
6.0E-01
51 Archetype Windows
Ecop
oint
s / m
2
NTAverageVIC
S Single GlazedD Double Glazed
Fig 12 Cooling CO2-E per m2 Single
Al
TiAl/TiPVC
Al
TiAl/TiAl
TiAl/TiAl
Al Al AlAl Al
Ti TiAl/TiTi Ti TiAl/TiAl/TiAl/Ti
Al Al AlTi Ti Ti
Al/TiAl/TiAl/Ti
Al TiAl/TiPVCAl TiAl/TiAl TiAl/TiAl Al Al Al Al Al Ti TiAl/TiTi Ti TiAl/TiAl/TiAl/TiAl Al Al Ti Ti TiAl/TiAl/TiAl/Ti
Al TiAl/TiPVCAl TiAl/TiAl TiAl/TiAl Al Al Al Al Al Ti TiAl/TiTi Ti TiAl/TiAl/TiAl/TiAl Al Al Ti Ti TiAl/TiAl/TiAl/Ti
0
50
100
150
200
250
51 Archetype Windows
kg C
O2
/ m2
NTAverageVIC
FrameAl AluminiumTi TimberPVC PVCAl/Ti Aluminium Skinned Timber
26
This presentation of the results reveals the contribution of the window frame to the cooling energy performance. In the worst case cooling conditions (Northern Territory), timber, aluminium skinned timber and PVC were comparable, saving 6-7% of CO2 and 7-8% of ecopoints with the timber without aluminium skin saving most at 14%. One exceptional performing single framed archetype is evident – the Laminated Low-E glazed window. This glazing installed in the other frame types might be expected to perform even better. Figures 14 and 15 show the cooling condition CO2-E and ecopoint results expressed per m2 of window area for just the double glazed windows.
Fig 13 Cooling Ecopoints per m2 Single
Al
TiAl/Ti
PVC
Al
TiAl/Ti
Al
TiAl/Ti
Al
Al AlAl
Al Al
Ti TiAl/Ti
Ti Ti TiAl/TiAl/Ti
Al/Ti
Al AlAl
Ti Ti TiAl/TiAl/Ti
Al/Ti
Al TiAl/TiPVCAl TiAl/TiAl TiAl/TiAl
Al Al Al Al AlTi TiAl/TiTi Ti TiAl/TiAl/TiAl/TiAl Al Al Ti Ti TiAl/TiAl/TiAl/Ti
Al TiAl/TiPVCAl TiAl/TiAl TiAl/TiAl Al Al Al Al Al Ti TiAl/TiTi Ti TiAl/TiAl/TiAl/TiAl Al Al Ti Ti TiAl/TiAl/TiAl/Ti0
0.05
0.1
0.15
0.2
0.25
0.3
0.35
51 Archetype Windows
Ecop
oint
s / m
2
NTAverageVIC
FrameAl AluminiumTi TimberPVC PVCAl/Ti Aluminium Skinned Timber

27
For the double glazed versions, the aluminium skinned and aluminium skinned wood and PVC framed windows emitted 6-7% less CO2-E and ecopoints than the aluminium framed. Frame matters marginally less in the double glazed than it does in the single.
7.2.3.2 Heating Figure 16 shows the CO2-E emissions that would arise because of the heat losses from buildings due to heat transmitted and ventilated from each of the window archetypes. Figure 17 shows the corresponding results in Australian ecopoints.
Fig 14 Cooling CO2-E per m2 Double
AlPVC
Al AlAl
Al AlTi Ti Al/Ti PVC Ti Al/Ti
AlTi Al/Ti PVC
Al PVC Al Al Al Al Al Ti Ti Al/Ti PVC Ti Al/Ti Al Ti Al/Ti PVC
Al PVC Al Al Al Al Al Ti Ti Al/Ti PVC Ti Al/Ti Al Ti Al/Ti PVC
0
50
100
150
200
250
51 Archetype Windows
kg C
O2
/ m2
NTAverageTAS
FrameAl AluminiumTi TimberPVC PVCAl/Ti Aluminium Skinned Timber
Fig 15 Cooling Ecopoints per m2 Double
Al
PVC
Al Al
Al
Al Al
Ti Ti Al/Ti PVC Ti Al/Ti
Al
Ti Al/Ti PVC
AlPVC
Al Al Al Al AlTi Ti Al/Ti PVC Ti Al/Ti Al Ti Al/Ti PVC
Al PVC Al Al Al Al Al Ti Ti Al/Ti PVC Ti Al/Ti Al Ti Al/Ti PVC0
0.05
0.1
0.15
0.2
0.25
51 Archetype Windows
Ecop
oint
s / m
2
NTAverageVIC
FrameAl AluminiumTi TimberPVC PVCAl/Ti Aluminium Skinned Timber

28
This heat would need to be provided from a heating system to supplement the diffuse solar gains from the windows to maintain comfort conditions within the buildings. These figures are based on an average Australian home (assuming that it is equipped with heating). Again, these figures vary significantly with location and prevailing climate. Best case is now Northern Territories, needing no heating and worst case is New South Wales - the Australian average is also shown.
Fig 16 Heating CO2-E per m2
D
D
DD
D
D
D
D
DD
D
D
DD
D
D
DD
D
D
DD
D
D
D
D
D
D
DD
DDD
D
DDD
D
DD
D
D
DDD
D
DDD
DD
D
D
DDD
D
D
D
DD
D
D
DD
D
D
DDD
D
DD
D
D
D
D
D
D
DD
DDD
D
DDD
D
DDD
D
DDD
D
DDD
DD
DDDDDDDDDDDDDD DDDDDDDDDDDDDDDDDDDDDDDDDDDDDDDDDDDDD0
20
40
60
80
100
120
140
160
180
200
51 Archetype Windows
kg C
O2
/ m2
NSWAverageNT
S Single GlazedD Double Glazed
S Single GlazedD Double Glazed
Fig 17 Heating Ecopoints per m2
D
D
DD
D
D
D
D
DD
D
D
DD
D
D
DDD
D
DD
D
D
D
D
D
D
DD
DDD
D
DDD
D
DDD
D
DDD
D
DDD
DDD
D
DDD
D
D
D
DD
D
D
DDD
D
DDD
D
DD
D
D
D
D
D
D
DD
DDD
D
DDD
D
DDD
D
DDD
D
DDD
DD
DDDDDDDDDDDDDD DDDDDDDDDDDDDDDDDDDDDDDDDDDDDDDDDDDDD0.0E+00
5.0E-02
1.0E-01
1.5E-01
2.0E-01
2.5E-01
51 Archetype Windows
Ecop
oint
s / m
2
VICAverageNT
S Single GlazedD Double Glazed

29
As for cooling, the CO2-E and ecopoint results correlate precisely. The case for double glazing under heating conditions is much more compelling because in the cooling case, diffuse radiation heat gain must still be removed from the building by the cooling system whereas better retaining that diffuse solar gain with double glazing offsets the need for heating. In the worst case cooling situation (Northern Territories), double glazed windows save 14 % of both CO2-E and ecopoints. In the worst case heating situation, double glazing saves 54% % of both CO2-E and ecopoints. Figures 18 and 19 show the heating condition CO2-E and ecopoint results expressed per m2 of window area for just the single glazed windows.
Fig 18 Heating CO2-E per m2 Single
Al
TiAl/Ti
PVC
Al
TiAl/Ti
Al
TiAl/Ti
Al
Al Al
Al
Al Al
Ti TiAl/Ti
Ti TiTi
Al/TiAl/TiAl/Ti
Al Al
Al
Ti TiTi
Al/TiAl/TiAl/Ti
Al
TiAl/TiPVC
Al
TiAl/Ti
Al
TiAl/Ti
Al
Al AlAl
Al Al
Ti TiAl/TiTi Ti TiAl/TiAl/TiAl/Ti
Al AlAl
Ti Ti TiAl/TiAl/TiAl/Ti
Al TiAl/TiPVCAl TiAl/TiAl TiAl/TiAl Al Al Al Al Al Ti TiAl/TiTi Ti TiAl/TiAl/TiAl/TiAl Al Al Ti Ti TiAl/TiAl/TiAl/Ti0.0
20.0
40.0
60.0
80.0
100.0
120.0
140.0
160.0
180.0
200.0
kg C
O2
/ m2
NSWAverageNT
FrameAl AluminiumTi TimberPVC PVCAl/Ti Aluminium Skinned Timber
Fig 19 Heating Ecopoints per m2 Single
Al
TiAl/TiPVC
Al
TiAl/Ti
Al
TiAl/Ti
Al
Al AlAl
Al Al
Ti TiAl/TiTi Ti TiAl/TiAl/TiAl/Ti
Al AlAl
Ti Ti TiAl/TiAl/TiAl/Ti
AlTiAl/TiPVC
AlTiAl/Ti
AlTiAl/Ti
Al
Al Al AlAl Al
Ti TiAl/TiTi Ti TiAl/TiAl/TiAl/TiAl Al Al
Ti Ti TiAl/TiAl/TiAl/Ti
Al TiAl/TiPVCAl TiAl/TiAl TiAl/TiAl Al Al Al Al Al Ti TiAl/TiTi Ti TiAl/TiAl/TiAl/TiAl Al Al Ti Ti TiAl/TiAl/TiAl/Ti0
0.05
0.1
0.15
0.2
0.25
0.3
0.35
51 Archetype Windows
Ecop
oint
s / m
2
VICAverageNT
FrameAl AluminiumTi TimberPVC PVCAl/Ti Aluminium Skinned Timber

30
This presentation of the results reveals the contribution of the window frame to the heating energy performance. In the worst case heating conditions (NSW for CO2-E and Victoria for ecopoints), timber, aluminium skinned timber and PVC were comparable, saving 28-31% of CO2 and 20-23% of ecopoints. As for the cooling case one exceptional performing single framed archetype is evident – the Laminated Low-E glazed window. This glazing installed in the other frame types might be expected to perform even better. Figures 20 and 21 show the cooling condition CO2-E and ecopoint results expressed per m2 of window area for just the double glazed windows.
Figure 20 Heating CO2-E per m2 Double
Al
PVC
Al Al
Al
AlAl
Ti Ti Al/Ti PVC Ti Al/Ti
Al
Ti Al/Ti PVC
Al
PVC
Al Al
Al
Al Al
Ti Ti Al/Ti PVC Ti Al/Ti
Al
Ti Al/Ti PVC
Al PVC Al Al Al Al Al Ti Ti Al/Ti PVC Ti Al/Ti Al Ti Al/Ti PVC0
10
20
30
40
50
60
70
80
90
51 Archetype Windows
kg C
O2-
E / m
2
NSWAverageNT
FrameAl AluminiumTi TimberPVC PVCAl/Ti Aluminium Skinned Timber
Fig 21 Heating Ecopoints per m2 Double
Al
PVC
Al Al
Al
Al Al
Ti Ti Al/Ti PVC Ti Al/Ti
Al
Ti Al/Ti PVC
AlPVC
Al AlAl
Al Al
Ti Ti Al/Ti PVC Ti Al/TiAl
Ti Al/Ti PVC
Al PVC Al Al Al Al Al Ti Ti Al/Ti PVC Ti Al/Ti Al Ti Al/Ti PVC0
0.05
0.1
0.15
0.2
0.25
51 Archetpe Windows
Ecop
oint
s / m
2
VICAverageNT
FrameAl AluminiumTi TimberPVC PVCAl/Ti Aluminium Skinned Timber

31
For double glazed windows, in the worst case heating conditions (NSW for CO2-E and Victoria for ecopoints), timber, aluminium skinned timber and PVC were comparable, saving 26-28% of CO2 and 26-27% of ecopoints.
7.2.3.3 Cleaning BRANZ have not thoroughly investigated the implications of cleaning. An ad-hoc test cleaning an area of windows demonstrated that the quantities of hot water and detergents used for wet cleaning would not amount to a significant contribution to the impact of the windows over the life cycle – additionally, this would not vary between the different window types assessed. The use of waterless cleaning was similarly assessed for quantities of cleaner consumed. However, since there were no available data for the key active ingredient of these types of cleaner (see data gaps above) BRANZ had no way of estimating the life cycle implications. This remains an area of uncertainty in the assessment but is considered likely to be minor and to not vary between the different archetypes studied.
7.3 Full LCA Results The full LCA story is only told when the initial embodied, life cycle embodied and operational heating and cooling are brought together. Since the most populated areas of Australia benefit from quite benign and comfortable climates, the extent of heating and cooling used is much lower than in most other areas of the world, and especially compared to Northern Europe where most of the previous work has been conducted. In these colder , heating dominated climes, double glazing always rapidly pays back the additional embodied impacts from the energy savings that result and this is the prevailing message from LCA studies from Europe. In the Australian climate, this is not universally the case. Figure 22 uses the example of the PVC framed double hung window to show how the ecopoints (or CO2-E for that matter) accumulate over a 50 year life for a window. The embodied ecopoints arise as steps in the graph every time a major component is replaced – the operational ecopoints arrive continuously through each heating season and accumulate toward the total at the end of the life cycle (50 years assumed). A similar graph can be plotted for any of the combinations of window system with heating or cooling scenario or both. What matters is the final life cycle ecopoint value/m2 of window.

32
Fig 22 Window Double Hung Life Cycle EcopointsPVC/Double - Heating Only Average
0
1
1
2
2
3
0 5 10 15 20 25 30 35 40 45 50
Years
Ecop
oint
s
EnergyEmbodied
Using the double hung windows as a proxy to illustrate the trends, Figures 23, 24 and 25 show the final life cycle ecopoints per m2 of window in cooling conditions only; in heating conditions only; and assuming both heating and cooling. The results are expressed for each of the States and Territories to reveal the significance of location on the results.
Fig 23 50 year Life Cycle Embodied + Operational Cooling OnlyWindow - Double Hung
0.0
5.0
10.0
15.0
20.0
25.0
30.0
ACT NSW NT QLD SA TAS VIC WA
Ecop
oint
s / m
2
Al-SAl-SAl-SAl-DTi-STi-STi-STi-DAl/Ti-SAl/Ti-SAl/Ti-SAl/Ti-DPVC-D

33
Under cooling conditions only, only buildings in the Northern Territory will benefit from the improved thermal performance of double glazed windows – in the other States and Territories, the extra embodied impacts are not paid back from improved operational performance over the life of the windows. Therefore, in all States and Territories except Northern Territories best environmental performance will be achieved with single glazed windows selected for least embodied impacts – this is generally wood or aluminium skinned timber, but PVC may also be competitive.
Fig 24 50 year Life Cycle Embodied + Operational Heating OnlyWindow - Double Hung
0.0
2.0
4.0
6.0
8.0
10.0
12.0
ACT NSW NT QLD SA TAS VIC WA
Ecop
oint
s / m
2
Al-SAl-SAl-SAl-DTi-STi-STi-STi-DAl/Ti-SAl/Ti-SAl/Ti-SAl/Ti-DPVC-D
Under heating conditions, buildings in all States and Territories except Northern Territories and Queensland will benefit from double glazing and optimising the choice of thermal and embodied performance. In Northern Territories and Queensland, operational energy savings are too low to pay back the additional ecopoints embodied in the windows. In Victoria, New South Wales and ACT, the benefits will be greatest because they have the greatest heating need. Tasmania’s modest ecopoint impact compared to its climate appears surprising, but because Tasmania benefits from predominantly hydro-electric power, this scales down its overall impacts compared to other locations.

34
Fig 25 50 year Life Cycle Embodied + Operational Heating and Cooling Window - Double Hung
0.0
5.0
10.0
15.0
20.0
25.0
30.0
ACT NSW NT QLD SA TAS VIC WA
Ecop
oint
s / m
2
Al-SAl-SAl-SAl-DTi-STi-STi-STi-DAl/Ti-SAl/Ti-SAl/Ti-SAl/Ti-DPVC-D
Under combined heating and cooling conditions – fully air-conditioned buildings for example, all States and Territories except Queensland need to select for optimum thermal performance and choose double glazing. The biggest benefits from the higher performance window systems occur in New South Wales, Victoria, Northern Territories and ACT. Timber windows and aluminium skinned timber windows perform similarly overall and best in most situations – whether for heating performance, cooling performance or low embodied impacts. Double glazing is not justified in Queensland or Western Australia under combined heating/cooling conditions, but is justified elsewhere. 7.3.1 Literature Survey Results
A literature and internet survey against a variety of keywords including durability, service life, aged performance, window systems and LCA generated 12 recent (10 years) references that were relevant to the LCA assessment and 16 references that were relevant to the service life performance – some were relevant to both facets of the study – especially where they quoted the life of window systems or components. The LCA references were mainly European and revealed similar performance in terms of the characterised data to those for the Australian context. This is not surprising because of the extent to which Australian data is really data adapted from European work and indigenised. The most useful reference overall was that from Citherlet et al 2000 and concludes that high performance glazing systems are nearly always justified. The research is from Switzerland and therefore has a Northern European and perhaps even an alpine climate assumption embedded. It is not clear from the paper what LCA protocols were used for allocation or what goal and scope are defined for the LCA making direct comparisons difficult.

35
7.4 LCA Conclusions 7.4.1 General
• Little work has been done on the LCA of window systems over the past 10 years and what work has been done relates mostly to European situations and climate.
• Although some LCI/LCA and embodied energy/CO2 data are available for timber from Australian sources – some of the data available (via RMIT/SimaPro) for upstream sources is from European sources, especially the Ecoinvent database (Switzerland – European data). Additional data for the species of timber used is recommended to be gathered.
• Available data needs much adaptation to consistent methodology and indigenised for relevance to Australia
• Although there is data on different modes of freight transport in Australian, transport distances may be uncertain for wood (both indigenous and imported).
• Abiotic depletion factors conventionally used in impact assessment are not considered appropriate for the Australian context, more work is needed to establish appropriate data for Landfill Waste, Water Consumption, Oil & Gas Depletion, Solid Fuel Depletion, Deforestation, Productive Farmland lost, Habitat & Ecosystem. This might be promoted with ALCAS, Industry (BPIC) and Government.
• Weightings data need more development for Australia. • Cleaning has not been fully assessed in this project - wet cleaning should not amount
to a significant contribution to the impact of the windows over the life cycle, but this needs checking – additionally, this would not vary between the different window types assessed. No data were available to assess waterless cleaning.
7.4.2 Initial Embodied
• Window size is the dominant factor for embodied ecopoints, initial and life cycle and for the energy implications of windows. This does not mean that we recommend small windows over large.
• For initial embodied CO2 aluminium skinned timber framed window is best, followed by timber framed window without aluminium skin (40% higher) followed by the PVC framed window (45% higher than aluminium skinned timber) and the aluminium frame worst (147% higher).
• For initial embodied ecopoints hardwood timber framed window is best followed by PVC framed (28% higher) followed by aluminium skinned timber framed (29% higher) and the aluminium framed window worst (197% higher).
• Double glazing adds on average about 25% to the embodied CO2 impacts and about 17% to the embodied ecopoints of the window system.
• Per square metre of door opening, the sliding door consistently gave the lowest embodied CO2 and ecopoints – bi-fold doors were 8-9% higher – double casement doors 26%-28% higher.
• Per square metre of window opening, the casement windows consistently gave the lowest embodied CO2 and ecopoints - double hung windows are next best 26%-32% higher and awning style windows worst overall 35%-43% higher.
• For aluminium framed windows horizontal sliding windows have the lowest CO2 and embodied ecopoint performance.
• Aluminium framed windows have the highest impacts in all impact categories except for ozone depletion potential, where the PVC framed windows are highest.
• The PVC framed window has generally the second highest impacts throughout
36
• The aluminium skinned framed window is higher than PVC in the toxicity categories – human, fresh water and marine and may be vulnerable to changing stakeholder opinion on the relative importance of toxicity issues.
• Embodied impacts show little variation with location, but better data on transport impacts may change this.
7.4.3 Life Cycle Embodied
• For life cycle embodied impacts, the replacement components for single glazed units contribute far less over the life cycle than the double glazed.
• Life cycle embodied ecopoints can amount to double the ecopoints for initial installation
• In life cycle embodied terms, the single glazed timber framed and single glazed aluminium skinned timber framed windows perform best.
• A single glazed PVC framed window might also be competitive with the timber framed versions, but PVC windows are generally provided only as double glazed.
• There is some evidence for PVC framed windows not lasting as long as the aluminium and timber framed windows whilst the aluminium skinned timber windows may last a little longer than the others. This is significant for the embodied energy performance.
• Hardwood framed timbers appear to be transported longer distances and this contributes to a poorer performance in their profile. Further work would be needed to confirm this.
• There appear to be significant opportunities to utilise lower grade plantation timbers provided they are used with surfacing materials to enhance their durability and prolong their life.
• Although the initial embodied ecopoints are the biggest contribution to the final life totals, single or double glazing significantly affects how the effects of repair and maintenance accumulate to end-of life.
7.4.4 Operational Energy Impacts
• Operational energy implications of glazing systems, heating and cooling, are, as expected, highly affected by climate and hence location
• CO2-E for both cooling and heating correlates precisely with ecopoints • Although double glazing reduces cooling loads on buildings compared to single
glazing, in average or cooler parts of Australia, the benefit of double glazing can be marginal.
• In worst case cooling conditions (Northern Territory), timber, aluminium skinned timber and PVC were comparable, saving 6-7% of CO2 and 7-8% of ecopoints with the timber framed window without aluminium skin saving most at 14%.
• Under cooling conditions, double glazed aluminium skinned and timber framed window without aluminium skin and PVC framed windows emitted 6-7% less CO2-E and ecopoints than aluminium framed windows
• Under heating conditions double glazing is more strongly justified because diffuse radiation heat gain increases the cooling load but decreases the heating load.
• In the worst case heating situation, double glazing saves 54% of both CO2-E and ecopoints.
• In worst case heating conditions (NSW for CO2-E and Victoria for ecopoints), timber, aluminium skinned timber and PVC were comparable, saving 28-31% of CO2 and 20-23% of ecopoints.
• For double glazed windows, in the worst case heating conditions (NSW for CO2-E and Victoria for ecopoints), timber, aluminium skinned timber and PVC were comparable, saving 26-28% of CO2 and 26-27% of ecopoints.

37
• Wherever heating or cooling loads justify double glazing, the laminated Low-E single glazed window also performed well environmentally and would probably do so in any frame type.
• Australia differs from Northern Europe - it is not universally true that high performance windows will recover their extra embodied impacts from reduced impacts over the life because most populated areas of Australia have mild climates with low heating and cooling loads.
• Under cooling conditions, only buildings in the Northern Territory will benefit from the improved thermal performance of double glazed windows – in the other States and Territories, the extra embodied impacts are not paid back from improved operational performance over the life of the windows.
• In all States and Territories except Northern Territories where only cooling is used, the best environmental performance will be achieved with single glazed windows selected for least embodied impacts – this is generally timber or aluminium skinned timber, but PVC may also be competitive.
• Under heating conditions, buildings in all States and Territories except Northern Territories and Queensland will benefit from double glazing and optimising the choice of thermal and embodied performance.
• In Victoria, New South Wales and ACT, the benefits will be greatest because they have the greatest heating need. Tasmania’s modest ecopoint impact compared to its climate is due to the predominant use of hydro-electric power.
• Under combined heating and cooling conditions – fully air-conditioned buildings for example, all States and Territories except Queensland need to select for optimum thermal performance and choose double glazing.
• Under combined heating and cooling conditions, the biggest benefits from the higher performance window systems occur in New South Wales, Victoria, Northern Territories and ACT.
• Timber windows and aluminium skinned timber windows perform similarly overall and best in most situations – whether for heating performance, cooling performance or low embodied impacts.
• Double glazing is not justified in Queensland or Western Australia under combined heating/cooling conditions, but is justified elsewhere.
7.5 LCA Recommendations 7.5.1 Marketing Messages
The following messages may be drawn from this work to market timber window frames These messages need to be used with caution because of the large data gaps and the extent to which European data have been adapted for this study.
• Timber framed windows, whether aluminium skinned or without aluminium skin had consistently lower embodied impact per m2 of window expressed either in terms of embodied CO2 or ecopoints - initial, over the life, or for energy implications.
• The best performer for initial embodied CO2 is the aluminium skinned timber framed window, followed by the timber framed window without aluminium skin (40% higher) followed by the PVC framed window (45% higher than aluminium skinned timber) and the aluminium frame worst (147% higher).
• The best performer for initial embodied ecopoints is the window framed in hardwood timber followed by PVC framed (28% higher) followed by aluminium skinned timber framed (29% higher) and the aluminium framed window worst (197% higher).
• Double glazing adds on average about 25% to the embodied CO2 impacts and about 17% to the embodied ecopoints of the window system. This addition varies with

38
window size and frame type ranging from about 10% to 50% extra in CO2 terms or 10% to 40% extra in ecopoint terms.
• Per square metre of door opening, the sliding door consistently gave the lowest embodied CO2 and ecopoints – bi-fold doors were 8-9% higher – double casement doors worst at 26%-28% higher.
• Per square metre of window opening, the casement windows consistently gave the lowest embodied CO2 and ecopoints - double hung windows are next best 26%-32% higher and awning style windows worst overall 35%-43% higher.
Best Life Cycle Environmental Choices
State or Territory
Heating / Cooling
Single / Double
Frame Type
ACT Heating
Cooling
Both
Double
Single
Double
Aluminium skinned Timber, Timber, PVC
Aluminium skinned Timber, Timber, PVC
Aluminium skinned Timber, Timber, PVC
NSW Heating
Cooling
Both
Double
Single
Double
Aluminium skinned Timber, Timber, PVC
Aluminium skinned Timber, Timber, PVC
Aluminium skinned Timber, Timber, PVC
NT Heating
Cooling
Both
Single
Double
Double
Aluminium skinned Timber, Timber
Aluminium skinned Timber, Timber
Aluminium skinned Timber, Timber, PVC
QLD Heating
Cooling
Both
Single
Single
Single
Aluminium skinned Timber, Timber
Aluminium skinned Timber, Timber
Aluminium skinned Timber, Timber, PVC
SA Heating
Cooling
Both
Double
Single
Double
Aluminium skinned Timber, Timber, PVC
Aluminium skinned Timber, Timber, PVC
Aluminium skinned Timber, Timber, PVC
TAS Heating
Cooling
Both
Double
Single
Double
Aluminium skinned Timber, Timber, PVC
Aluminium skinned Timber, Timber, PVC
Aluminium skinned Timber, Timber, PVC
VIC Heating
Cooling
Both
Double
Single
Double
Aluminium skinned Timber, Timber, PVC
Aluminium skinned Timber, Timber, PVC
Aluminium skinned Timber, Timber, PVC
WA Heating
Cooling
Both
Double
Single
Single
Aluminium skinned Timber, Timber, PVC
Aluminium skinned Timber, Timber
Aluminium skinned Timber, Timber

39
In all cases where double glazing is justified, the laminated low-E glazing is also justified and would probably perform well in all frame types. 7.5.2 Innovation to Further Enhance Performance
This study did not throw up any major issues from the LCA of timber framed window systems that needed urgent action to mitigate. The following recommendations represent opportunities for innovation and potential liabilities for the future:
• The industry should conduct LCI/LCA studies and publish more data for Australian timber species. This will enable the industry to refine and improve the marketing messages above. This may highlight the industry’s opportunities for further innovation in its operations, its supply chain and its distribution networks.
• As plantations and natural forest become more and more significant as reservoirs of sequestered carbon, so the industry will come under increasing pressure and scrutiny to divulge and prove its life cycle data.
• The industry should investigate the freight transport of its products – distance and mode (especially hardwood) since this could be an area of vulnerability for wood products (both indigenous and imported/exported).
• Lack of data on abiotic depletion factors could constrain the story for wood – forests conserve water resources, sequester solar energy and provide resources that offset the need to take other resources from nature. This might be promoted with ALCAS, Industry (BPIC) and Government.
• Further work is needed on the weightings used between issues in different States and Territories to better reflect different vulnerabilities to climate and water shortage.
• The aluminium skinned framed window using lower grade, fast growing plantation timbers, provides the biggest opportunity for innovation in the timber industry to produce low impact window systems. Alternatives to aluminium or other types of durable coating system provide many opportunities and can mitigate a potential vulnerability to changing stakeholder concerns about toxicity issues.
• The industry should explore the benefits of laminated low-E glass in timber or aluminium skinned timber frames – this combination could be particularly beneficial environmentally.
• This report should encourage the uptake of higher performance glazing systems and increased rates of refurbishment using these products. The mechanisms for failure of double glazed units relate to the way the IGU’s are held within their frames and how the seal around the unit is protected from standing water by drainage and ventilation channels. PVC and aluminium frames can be easily designed to meet this requirement which may be more challenging for wood.
• One paper discovered in the literature survey (Asif) gave replacement lives of windows which vary by frame type, with aluminium skinned timber lasting longest and PVC least. Research to improve the durability of window systems may contribute significantly to further improving the timber window system’s life cycle story.
• Timber window manufacturers may be vulnerable to competition from PVC window frames. A single glazed PVC framed window might be particularly competitive with the timber framed versions in climates requiring minimal heating. These performed almost as well as the timber archetypes in many/most situations. PVC windows may be vulnerable on durability and service life grounds.
• The timber framed window industry is encouraged to publish and promote these findings to the industry and to the trade press.
• The timber framed window industry is encouraged to use this report to seek recognition for the environmental benefits of timber framed window systems with buildings rating organisations – USGBC (Green Star), NABERS, BASIX…etc.
• The timber framed window industry is encouraged to promote this report to the Ecospecifier database or as a reference source.
40
• The timber framed window industry is encouraged to promote this report to organisations developing environmental labels or environmental product declarations as the basis for developing standards for the environmental labelling of window systems. BRANZ may wish to initiate such an ecolabel.
7.6 LCA References 17 Howard N, Edwards S, Anderson J, 1999, BRE Methodology for Environmental
Profiles of Consruction Materials, Components and Buildings, BR 370, CRC Garston, Watford, UK
18 Richter K, Sell J, 1993, "Wood-Design-Focus" 19 Anderson J, Shiers D, 2002, "The Green Guide to Specification", Edition 3, Blackwell,
Garston, Watford, UK 20 Howard N, Anderson J, 2000, "The Green Guide to Housing Specification", BR 390,
CRC, 2000, Garston, Watford, UK 21 Weinberg E, 1987, Glaswelt, 40(9):.76-78, 80 , 22 Citherlet S, Di Guglielmo F, Gay J-B, 2000, Energy and Buildings 32 (2000) 225-234,
ElseveirScience 23 Eggers H-H, 2000, bau-zeitung , 54(3): 50-52, 24 Ruske W, 1995, DBZ-Deutsche-Bauzeitschrift , 43 (3): 103-111, 25 Weir GF, Muneer T, 1998, Energy Conservation and Management. , 39(3/4): 243-
256, 26 Weir G, Muneer T, 1997, Building-Services-Engineering-Research-and-Technology,
18(2): 125-127 , 27 Brown AW, Allwinkle A.J, Weir GF, 1999, Durability of Building Materials and
Components 8, Institute for Research in Construction, Ottawa ON, KIA 0R6, Canada, :1973 - 1982,
28 Weir GF, 1998, PhD thesis, School of Engineering, Napier University, 10 Colinton Road, Edinburgh, EH10 5DT, UK,
29 Asif M, Davidson A, Muneer T, , , School of Engineering, Napier University, 10 Colinton Road, Edinburgh, EH10 5DT, UK,

41
APPENDIX.A DEGREE DAYS
A.1 Calculation method: Transmitted heating required Th = U x A x DDh x 86400 GJ/m2/yr t x 1000000000 x COPh Transmitted cooling required Tc = U x A x DDc x 86400 GJ/m2/yr t x 1000000000 x COPc Air Leakage heating required Ah = L x H x D x DDh x 86400 GJ/m2/yr 1000 x 1000000 x COPh Air Leakage cooling required Ac = L x H x D x DDc x 86400 GJ/m2/yr 1000 x 1000000 x COPc Solar Gain Diffuse heating Sh = Idh x Sg x 86400 x 365 GJ/m2/yr 1000000000 x COPh Solar Gain Diffuse cooling Sc = Idc x Sg x 86400 x 365 GJ/m2/yr 1000000000 x COPc H = Th + Ah – S GJ/m2/yr C = Tc + Ac – S GJ/m2/yr H Total heating required GJ/m2/yr C Total cooling required GJ/m2/yr Th Transmitted heating required GJ/m2/yr Tc Transmitted heating required GJ/m2/yr U Thermal transmittance value W/m/K t Thickness m DDh Heating degree days (days.K/yr) DDc Cooling degree days (days.K/yr) COPh Coefficient of performance heating system % COPc Coefficient of performance cooling system % Ah Air leakage heating required GJ/m2/yr Ac Air leakage cooling required GJ/m2/yr L Air leakage rate dm3/s H Heat capacity of air kJ/kg/K D Density of air kg/m3 Sh Solar gain diffuse heating GJ/m2/yr Sc Solar gain diffuse cooling GJ/m2/yr Idh Mean annual solar incident radiation diffuse for heating season W/m2 Idc Mean annual solar incident radiation diffuse for cooling season W/m2 Sg Solar gain coefficent for glazing system % 86400 Unit conversion s/day 365 Unit conversion days/yr

42
A.2 Degree Day Data

43
Acknowledgments
This work was funded by the Forest and Wood Products Research and Development Corporation with in-kind contributions from the Project Advisory Group members. BRANZ wish to thank the FWPRDC for sponsoring this work together with the Project Advisory Group members: Mr Ian Frame Executive Director Australian Window Association
(AWA)
Mr James Bradley General Manager Window and Door Industry Council (WADIC)
Mr A Dunn General Manager Timber Development Association NSW
Mr Murray Hall Research Scientist Future Cities CSIRO Manufacturing Infrastructure and Technology
Mr Tim Grant Assistant Director RMIT
Mr Neil Evans National Technical Director Master Builders Association (MBA)
Paul Armstrong National Sales Manager Canterbury Windows
Kristin Tomkins* Executive Director, Building Policy
Housing Industry Association(HIA)
* Corresponding member only In addition, BRANZ wish to thank Mr Chris Barker of Pilkingtons for his assistance.

![thomas & deborai thomas & debora] thomas & deborai contractor iverson, po box 2212, po box 2212, po box 2212, applicant owner p1506-023 $183,148.65 applicant owner pi 506-032 $21,328.08](https://img.pdfslide.us/doc/110x75/5eca3f7cce74ca60fc41cd93/-thomas-deborai-thomas-debora-thomas-deborai-contractor-iverson.jpg)


![[XLS]mmsaproviders.momentum.co.zammsaproviders.momentum.co.za/pdfs/2011_Associated_list... · Web view113 JAN HOFMEYR ROAD HOWLETT PO BOX 1003 WANDSBECK VAWDA PO BOX 1469 SHAIKH PO](https://img.pdfslide.us/doc/110x75/5b26a7fb7f8b9a121b8b45fe/xls-web-view113-jan-hofmeyr-road-howlett-po-box-1003-wandsbeck-vawda-po-box.jpg)