Embed Size (px)
Citation preview
Shop On-Line at www.store.rasc.caSend cheque or money order to: RASC, 136 Dupont St, Toronto ON M5R 1V2 Canada
Please allow 6-8 weeks for delivery. Orders outside Canada please remit in US Funds. Major credit cards accepted. Call the National Office toll-free at 1-888-924-7272 to place your order.
(These products may also be available directly from your local Centre)
The Beginner’s Observing GuideExtensively revised and now in its fifth edition, The Beginner’s Observing Guide is for a variety ofobservers, from the beginner with no experience to the intermediate who would appreciate the clear,helpful guidance here available on an expanded variety of topics: constellations, bright stars, themotions of the heavens, lunar features, the aurora, and the zodiacal light. New sections include: lunarand planetary data through 2010, variable-star observing, telescope information, beginningastrophotography, a non-technical glossary of astronomical terms, and directions for building a properlyscaled model of the solar system.
Written by astronomy author and educator, Leo Enright; 200 pages, 6 colour star maps, 16 photographs,otabinding.
Price: $19.95 plus shipping & handling.
Publications and Products ofT h e R o y a l A s t r o n o m i c a l S o c i e t y o f C a n a d a
Skyways: Astronomy Handbook for Teachers Teaching Astronomy? Skyways Makes it Easy!
Written by a Canadian for Canadian teachers and astronomy educators, Skyways is Canadiancurriculum-specific; pre-tested by Canadian teachers; hands-on; interactive; geared for upperelementary, middle school, and junior-high grades; fun and easy to use; cost-effective.
Skyways is complete with conceptual background; teacher information; student worksheets;resource lists; Canadian contributions to astronomy section FAQs; and more. Written by Canadianauthor and RASC member, Mary Lou Whitehorne.
Price: $16.95 Cdn (members); $19.95 Cdn (non-members)(includes postage and handling; add GST for Canadian orders)
Observer’s Calendar — 2005The award-winning RASC Observer's Calendar is your annual guide
Created by the Royal Astronomical Society of Canada and richly illustrated byphotographs from leading amateur astronomers, the calendar pages are packedwith detailed information including major lunar and planetary conjunctions,meteor showers, eclipses, lunar phases, and daily Moonrise and Moonset times.Canadian and US holidays are highlighted. Perfect for home, office, orobservatory.
Individual Order Prices:$16.95 Cdn/ $13.95 US
RASC members receive a $3.00 discountShipping and handling not included.
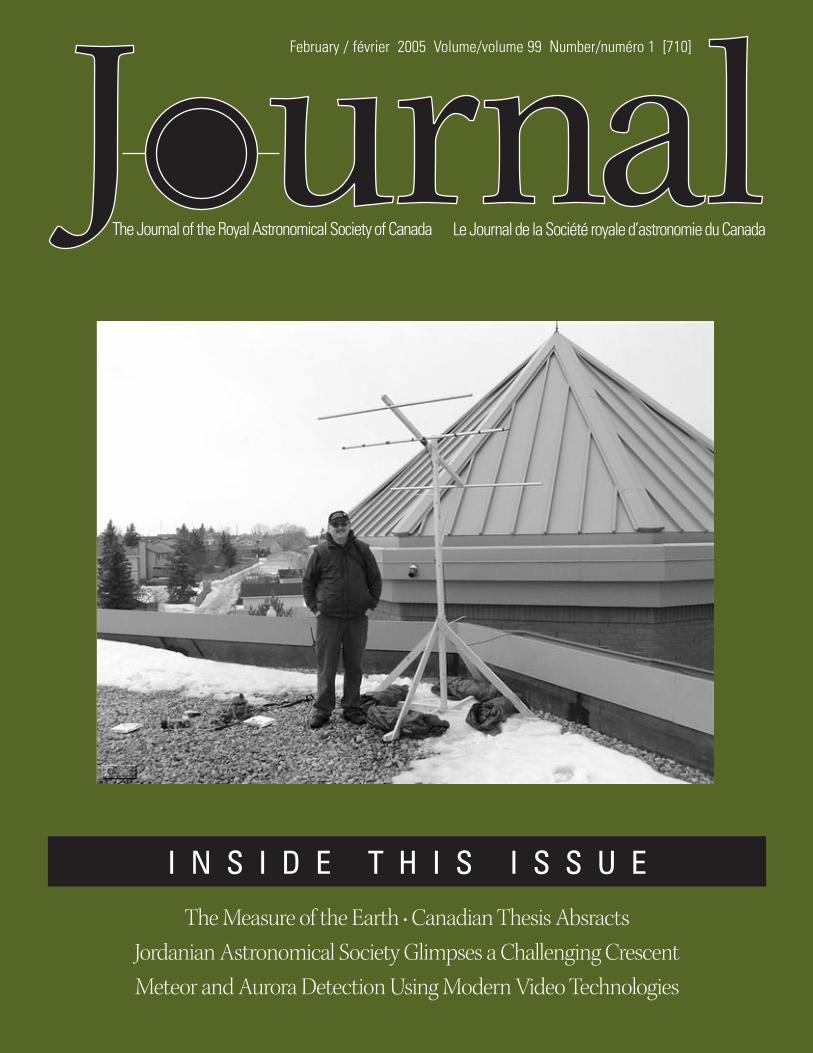
I N S I D E T H I S I S S U E
The Measure of the Earth • Canadian Thesis Absracts
Jordanian Astronomical Society Glimpses a Challenging Crescent
Meteor and Aurora Detection Using Modern Video Technologies
The Journal of the Royal Astronomical Society of Canada Le Journal de la Société royale d’astronomie du Canada
February / février 2005 Volume/volume 99 Number/numéro 1 [710]
February / février 2005
COLUMNS/RUBRIQUES
10 Reflections: Percival Lowell, LowellObservatory, and Plutoby David M.F. Chapman
12 Second Light: Weighing the Lowest MassStarsby Leslie J. Sage
35 Orbital Oddities: Sky ScanTeaching Radio Astronomy in Alberta Schoolsby Bruce McCurdy
40 A Moment With… Dr. Douglas Giesby Philip Mozel
Vol. 99, No. 1 Whole Number 710
The Journal of the Royal Astronomical Society of Canada Le Journal de la Société royale d’astronomie du Canada
contentstab le des mat iè res
T H E R O YA L A S T R O N O M I C A L S O C I E T Y O F C A N A D ANATIONAL OFFICERS AND COUNCIL FOR 2004-2005/CONSEIL ET ADMINISTRATEURS NATIONAUX
Honorary President Roy Bishop, Ph.D., HalifaxPresident Peter Jedicke, M.A., London1st Vice-President Scott Young, B.Sc., Winnipeg2nd Vice-President Dave Lane, HalifaxSecretary Kim Hay, KingstonTreasurer David Clark, LondonRecorderLibrarian Robert Garrison, Ph.D., TorontoPast Presidents Rajiv Gupta, Ph.D., Vancouver and Robert Garrison, Ph.D., TorontoEditor of Journal Wayne Barkhouse, Ph.D., HalifaxEditor of Observer’s Handbook Rajiv Gupta, Ph.D., VancouverEditor of Beginner’s Observing Guide Leo Enright, KingstonEditor of Observer’s Calendar Rajiv Gupta, Ph.D., Vancouver
Executive Secretary Bonnie Bird, M.L.Sc., 136 Dupont Street, Toronto ON M5R 1V2 Telephone: (416) 924-7973
Belleville Centre9 South Park Street, Belleville ON K8P 2W9
Calgary CentreC/O Calgary Science Centre, PO Box 2100 Station “M”, Calgary AB T2P 2M5
Charlottetown CentreC/O 316 N. Queen Elizabeth Drive, Charlottetown PE C1A 3B5
Edmonton CentreC/O Edmonton Space & Science Centre, 11211 – 142 StreetEdmonton AB T5M 4A1
Halifax CentrePO Box 31011, Halifax NS B3K 5T9
Hamilton CentrePO Box 1223, Waterdown ON L0R 2H0
Kingston CentrePO Box 1793, Kingston ON K7L 5J6
Kitchener-Waterloo CentreC/O John Beingessner, 479 Cabot Trail, Waterloo ON N2K 3Y3
London CentrePO Box 842 Station B, London ON N6A 4Z3
Moncton CentreC/O Dr. Francis LeBlanc, Département de physique et d’astronomie,Université de Moncton, Moncton NB E1A 3E9
Centre francophone de MontréalCasier postal 206 Station St-Michel, Montréal QC H2A 3L9
Montreal CentrePO Box 1752 Station B, Montreal QC H3B 3L3
Niagara CentrePO Box 4040, St Catharines ON L2R 7S3
Okanagan CentrePO Box 20119 TCM, Kelowna BC V1Y 9H2
Ottawa CentrePO Box 33012, 1363 Woodroffe Ave, Ottawa ON K2C 3Y9
Prince George Centre7365 Tedford Road, Prince George BC V2N 6S2
Centre de Québec2000 boul Montmorency, Québec QC G1J 5E7
Regina CentrePO Box 20014 Cornwall Centre, Regina SK S4P 4J7
St. John’s CentreC/O Randy Dodge, 206 Frecker Dr, St. John’s NL A1E 5H9
Sarnia CentreC/O Paul Bessonette, 160 George Street, Sarnia ON N7T 7V4
Saskatoon CentrePO Box 317 RPO University, Saskatoon SK S7N 4J8
Thunder Bay Centre286 Trinity Crescent, Thunder Bay ON P7C 5V6
Toronto CentreC/O Ontario Science Centre, 770 Don Mills Road, Toronto ON M3C 1T3
Vancouver CentreC/O The HR Macmillan Space Centre, 1100 Chestnut StreetVancouver BC V6J 3J9
Victoria CentreC/O Lauri Roche, 912-6880 Wallace Drive, Brentwood Bay BC V8M 1N8
Windsor CentreC/O Ken Garber, 2831 Alexandra Avenue, Windsor ON N9E 2J8
Winnipeg CentrePO Box 2694, Winnipeg MB R3C 4B3
CENTRE ADDRESSES/ADRESSES DES CENTRESThe most current contact information and Web site addresses for all Centres are available at the Society’s Web site: www.rasc.ca
RESEARCH PAPERS/ARTICLES DE RECHERCHE
14 Meteor and Aurora Detection UsingModern Video Technologiesby Martin Connors, Mikko Syrjäsuo, Peter Brown,
and Eric Donovan
23 Canadian Thesis Abstracts by Melvin Blake
EDUCATION NOTES
14 Exploring the Astronomy of Ancient Egyptwith Simulations I: The Sun, Moon, andMilky Wayby William Dodd
FEATURE ARTICLES/ARTICLES DE FOND
7 The Measure of the Earth — A SaskatchewanDiaryby Martin Beech
33 Jordanian Astronomical Society Glimpseda Challenging Crescentby Mohammad Odeh
A Moment With…Dr. Douglas Gies
p. 40
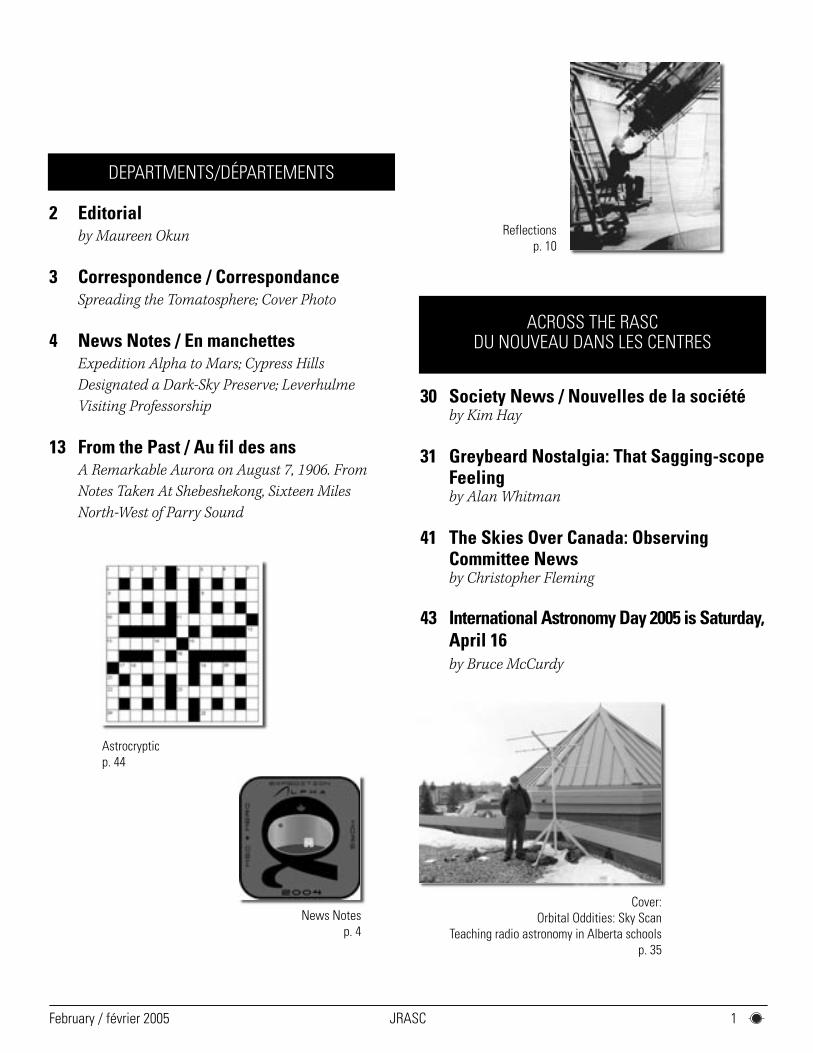
Meteor and Aurora Detection Using Modern VideoTechnologies
p. 14
JRASCFebruary / février 2005 1
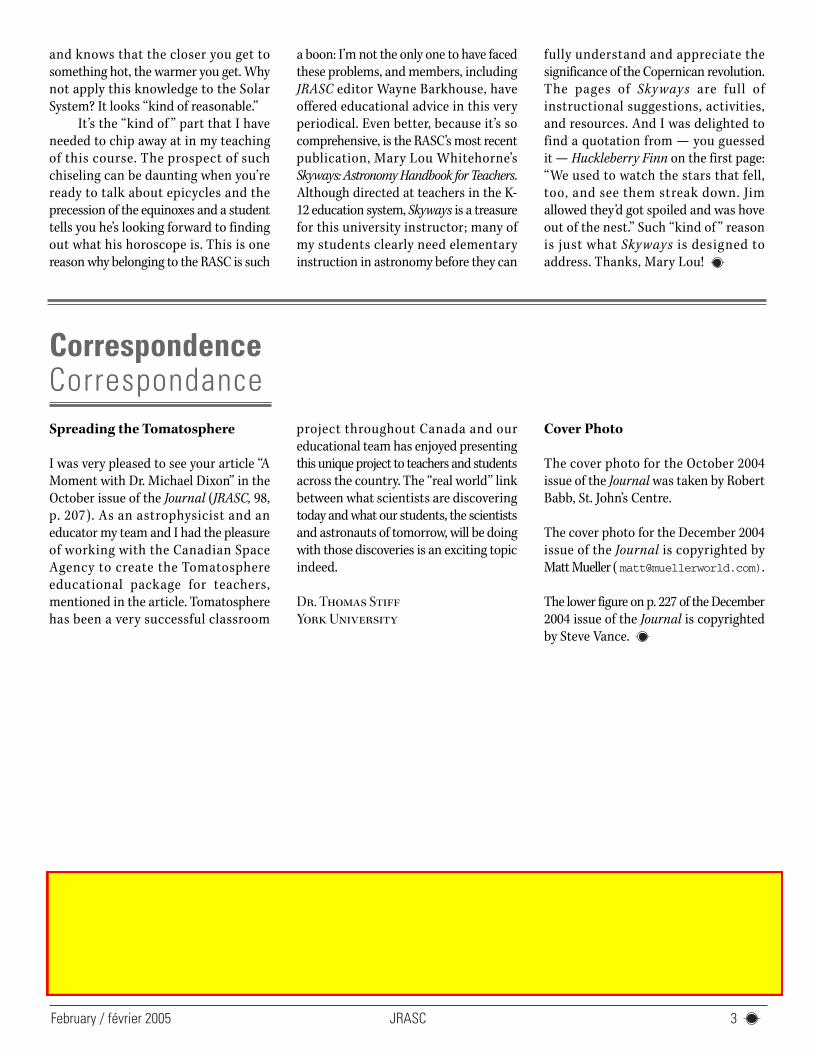
Cover:Orbital Oddities: Sky Scan
Teaching radio astronomy in Alberta schoolsp. 35
DEPARTMENTS/DÉPARTEMENTS
2 Editorial by Maureen Okun
3 Correspondence / CorrespondanceSpreading the Tomatosphere; Cover Photo
4 News Notes / En manchettesExpedition Alpha to Mars; Cypress Hills
Designated a Dark-Sky Preserve; Leverhulme
Visiting Professorship
13 From the Past / Au fil des ansA Remarkable Aurora on August 7, 1906. From
Notes Taken At Shebeshekong, Sixteen Miles
North-West of Parry Sound
Astrocrypticp. 44
ACROSS THE RASCDU NOUVEAU DANS LES CENTRES
30 Society News / Nouvelles de la sociétéby Kim Hay
31 Greybeard Nostalgia: That Sagging-scopeFeelingby Alan Whitman
41 The Skies Over Canada: ObservingCommittee News by Christopher Fleming
43 International Astronomy Day 2005 is Saturday,April 16by Bruce McCurdy
News Notesp. 4
Reflectionsp. 10
The Journal is a bi-monthly publication of the Royal Astronomical Society of Canada and is
devoted to the advancement of astronomy and allied sciences. It contains articles on Canadian
astronomers and current activities of the RASC and its Centres, research and review papers
by professional and amateur astronomers, and articles of a historical, biographical, or
educational nature of general interest to the astronomical community. All contributions are
welcome, but the editors reserve the right to edit material prior to publication. Research
papers are reviewed prior to publication, and professional astronomers with institutional
affiliations are asked to pay publication charges of $100 per page. Such charges are waived
for RASC members who do not have access to professional funds as well as for solicited
articles. Manuscripts and other submitted material may be in English or French, and should
be sent to the Editor-in-Chief.
The Journal of The Royal Astronomical Society of Canada is published at an annual subscription
rate of $80.00 by The Royal Astronomical Society of Canada. Membership, which includes
the publications (for personal use), is open to anyone interested in astronomy. Annual fees
for 2005, $50.00; life membership is $1,000. Applications for subscriptions to the Journal or
membership in the RASC, and information on how to acquire back issues of the Journal can
be obtained from:
The Royal Astronomical Society of Canada
136 Dupont Street
Toronto ON M5R 1V2, Canada
Internet: [email protected]
Web site: www.rasc.ca
Telephone: (416) 924-7973
Fax: (416) 924-2911
Canadian Publications Mail Registration No. 09818
Canada Post: Send address changes to 136 Dupont St, Toronto ON M5R 1V2
Canada Post Publication Agreement No. 40069313
We acknowledge the financial support of the Government of Canada, through the Publications
Assistance Program (PAP), toward our mailing costs.
U.S. POSTMASTER: Send address changes to IMS of NY, PO Box 1518, Champlain NY 12919.
U.S. Periodicals Registration Number 010-751.
Periodicals postage paid at Champlain NY and additional mailing offices.
© 2005 The Royal Astronomical Society of Canada. All rights reserved. ISSN 0035-872X
by Maureen Okun ([email protected])
In a well-known passage from Mark Twain’s Adventures of
Huckleberry Finn, Huck and Jim gaze at the sky one night
from their raft on the Mississippi and try to figure out
whether the stars “was made, or only just happened.” Huck is
skeptical about their having been made because “it would have
took too long to make so many.” But Jim’s rejoinder makes Huck
doubt the validity of his own position: “Jim said the moon could
a laid them; well, that looked kind of reasonable, so I didn’t say
nothing against it, because I’ve seen a frog lay most as many,
so of course it could be done.”
This segment is one of my favourite parts of the novel; I
find our heroes’ ingenuous ruminations charming and amusing.
I’m less charmed and amused, though, when the same kind of
thinking shows up in my classroom. True, none of my students
has come up with anything quite like Jim’s cosmology, I’m happy
to say, but several have nonetheless used reasoning strategies
similar to those exemplified by Huck and Jim’s conversation.
I teach in the Liberal Studies program at Malaspina
University-College on Vancouver Island. Our program takes
students on a multidisciplinary excursion through the major
works of Western culture. One component of that journey is a
module on astronomy, in which we read works by Aristotle,
Ptolemy, Copernicus, Galileo, and Newton. Our goals include
enabling students to understand how methods of scientific
inquiry have changed over time and how changing models of
the Cosmos have had an impact on Western thought. But an
impassable chasm opens up on the road to these intellectual
destinations when students don’t know or understand the basics
of our current model of the Universe. I soon realized I’d have to
change my approach to this module when some of my students
told me, with confidence, that the Moon’s phases are caused by
the Earth’s shadow and that the seasons vary as the distance
between the Earth and the Sun varies. When, after some patient
explaining on my part, one student asked, “If that way’s south,
which way is east?” I knew we had some backtracking to do.
Confusion about the cardinal directions is one issue; at
least there’s an uncertainty to work with. Mistaken assumptions
about the workings of the world, however, are in some ways
more serious because those who hold these assumptions often
know they’re right. A cup full of error must be emptied before
it can be refilled with clear thought. I realized that these students,
with their how-can-you-argue-with-it explanations of Moon
phases and seasons, were, like Huck and Jim, reasoning by
analogy. Without the means or motivation to embark on a long
program of empirical study, Twain’s heroes use their common
sense to figure out what they don’t know by drawing on their
experience with what they do know: birds, frogs, and eggs, hence
the logic of a star-laying Moon. Everyone has seen shadows fall
Editor-in-Chief
Wayne A. Barkhouse
136 Dupont Street
Toronto ON M5R 1V2, Canada
Internet: [email protected]
Web site: www.rasc.ca
Telephone: (416) 924-7973
Fax: (416) 924-2911
Associate Editor, Research
Douglas Hube
Internet: [email protected]
Associate Editor, General
Michael Attas
Internet: [email protected]
Assistant Editors
Michael Allen
Martin Beech
Pierre Boulos
Ralph Chou
Patrick Kelly
Daniel Hudon
Editorial Assistant
Suzanne E. Moreau
Internet: [email protected]
Production Manager
David Garner
Internet: [email protected]
Contributing Editors
Martin Beech (News Notes)
David Chapman (Reflections)
William Dodd (Education Notes)
Kim Hay (Society News)
Bruce McCurdy (Orbital Oddities)
Philip Mozel (A Moment With…)
Leslie Sage (Second Light)
Russell Sampson (News Notes)
David Turner (Reviews)
Proofreaders
James Edgar
Maureen Okun
Suzanne Moreau
Design/Production
Brian G. Segal, Redgull Incorporated
Advertising
Isaac McGillis
Telephone: (416) 924-7973
Printing
Print Atlantic Ltd.
JRASC February / février 20052
Editorial
JRASCFebruary / février 2005 3
and knows that the closer you get to
something hot, the warmer you get. Why
not apply this knowledge to the Solar
System? It looks “kind of reasonable.”
It’s the “kind of ” part that I have
needed to chip away at in my teaching
of this course. The prospect of such
chiseling can be daunting when you’re
ready to talk about epicycles and the
precession of the equinoxes and a student
tells you he’s looking forward to finding
out what his horoscope is. This is one
reason why belonging to the RASC is such
a boon: I’m not the only one to have faced
these problems, and members, including
JRASC editor Wayne Barkhouse, have
offered educational advice in this very
periodical. Even better, because it’s so
comprehensive, is the RASC’s most recent
publication, Mary Lou Whitehorne’s
Skyways: Astronomy Handbook for Teachers.
Although directed at teachers in the K-
12 education system, Skyways is a treasure
for this university instructor; many of
my students clearly need elementary
instruction in astronomy before they can
fully understand and appreciate the
significance of the Copernican revolution.
The pages of Skyways are full of
instructional suggestions, activities,
and resources. And I was delighted to
find a quotation from — you guessed
it — Huckleberry Finn on the first page:
“We used to watch the stars that fell,
too, and see them streak down. Jim
allowed they’d got spoiled and was hove
out of the nest.” Such “kind of ” reason
is just what Skyways is designed to
address. Thanks, Mary Lou!
CorrespondenceCorrespondanceSpreading the Tomatosphere
I was very pleased to see your article “A
Moment with Dr. Michael Dixon” in the
October issue of the Journal (JRASC, 98,
p. 207). As an astrophysicist and an
educator my team and I had the pleasure
of working with the Canadian Space
Agency to create the Tomatosphere
educational package for teachers,
mentioned in the article. Tomatosphere
has been a very successful classroom
project throughout Canada and our
educational team has enjoyed presenting
this unique project to teachers and students
across the country. The “real world” link
between what scientists are discovering
today and what our students, the scientists
and astronauts of tomorrow, will be doing
with those discoveries is an exciting topic
indeed.
Dr. Thomas StiffYork University
Cover Photo
The cover photo for the October 2004
issue of the Journal was taken by Robert
Babb, St. John’s Centre.
The cover photo for the December 2004
issue of the Journal is copyrighted by
Matt Mueller ( [email protected]).
The lower figure on p. 227 of the December
2004 issue of the Journal is copyrighted
by Steve Vance.
WEB ACCESS TO APRIL 2005 ISSUE
The April 2005 issue of the Journal can be accessed from the RASC Web site at www.rasc.ca/currentjrasc
This issue will be posted immediately after the final production version is complete (approximately April
10, 2005) and removed from the Web once the issue begins arriving by mail.
JRASC February / février 2005 4
News NotesEn Manchettes
Over an intensive two-week period from
November 27 to December 12, 2004, the
Mars Society of Canada (MSC) recently
conducted Expedition Alpha (ExAlpha)
at the Mars Desert Research Station
(MDRS) in Utah, USA.
The ExAlpha crew consisted of six
trainees and three instructors. The trainees
were doctoral candidate Ken Pizzolitto
from the University of Waterloo’s
Kinesiology program, and the Waterloo
chapter of MSC; graduate student Nick
Wilkinson from the University of British
Columbia’s Mining Engineering program,
and the Vancouver chapter of MSC, Randy
Shelaga, aerospace engineering consultant,
from Moose Jaw, Saskatchewan, Peter
Reinwald, a machinist and trained EVA
field work measurement observer from
the Alberta Chapter of MSC; Graylan
Vincent, graduate of University of
Washington with dual B.Sc. degrees in
Aerospace Engineering and Geology (the
sole American on the crew); and Dustin
Freeman, undergraduate aerospace
engineering student at Queen’s University
in Kingston, Ontario, and founder of our
new Kingston MSC chapter. The instructors
on ExAlpha were veterans from earlier
expeditions: Jean Lagarde, Mars Society
founding member, served as commander
for the first week (Phase One); Matt
Bamsey, President of MSC and graduate
student in aerospace engineering at CU-
Boulder, also helped with training during
the first weekend; and Melissa Battler,
planetary geology graduate student at
University of New Brunswick, and MSC
Director of Events, joined the crew in the
second week (Phase Two) as Research
Program Manager.
Expedition Alpha was designed to
train the crew in basic exploration
EXPEDITION ALPHA TO MARStechniques using the Scouting Exploration
Methodology Study (SEMS) developed
by Stacy Sklar and Rocky Persaud. SEMS
is conducted with MSC’s three Astronaut
EVA Dataloggers. Training will also be
given in work measurement techniques
adapted from industrial settings by John
Roesch of MSC Alberta Chapter to measure
field science operational metrics; traverse
path optimization; logistics and teamwork.
The research program of ExAlpha consists
of a scouting campaign of the MDRS area
in search of biological concretions, as
first discovered by Melissa Battler on
Expedition One. These concretions are
of similar size and characteristics to the
“blueberries” concretions found by the
Opportunity Rover on Meridiani Planum
on Mars. The research program also aims
to measure the operational modes of the
scouting EVAs and physical work
expenditure by the crew, as well as to
optimize traverse paths for the given
scouting campaign. This information will
serve as a baseline set of exploration
metrics tied to specific science goals (and
thus to specific modes of investigation)
that in the long term can allow expedition
planning of science campaigns for Mars
once similar metrics are measured for
other science goals on our future research
expeditions.
The ExAlpha Remote Science Team
will consist of Rocky Persaud, a graduate
student in planetary geology at the
University of Toronto, founder of the MSC
Expedition series, and MSC Vice-President
of Research, Stacy Sklar, geology student
at Northern Arizona University, Veronica
Ann Zabala, geology student at Arizona
State University, and Melissa Battler for
the week before she joins the crew for
ExAlpha Phase Two. Stacy, Veronica, and
Melissa have in the past or are currently
researching concretions at their respective
universities.
ExAlpha will eventually be followed
by future training expeditions (ExBeta,
ExGamma, and so on). The goals of this
series of expeditions is to develop a corps
of skilled researchers and research assistants
familiar with the basic field operations
program from our research expedition
series to allow MSC to conduct a long
term program in field science operations
studies; and provide the opportunity for
more Canadians to experience what an
MSC-run expedition is like. The field
training program and the field research
program of Expedition Alpha are described
at the Expedition Mars www.expedition-
mars.org web site. More information
about Mars Society Canada is available
at marssociety.ca.
The Cypress Hills Interprovincial Park is the
first provincial park in both Saskatchewan
and Alberta to be officially recognized as a
Dark-Sky Preserve. This designation
announced this past October acknowledges
and protects the nocturnal environment, a
part of the natural heritage of the provinces.
CYPRESS HILLS DESIGNATED A DARK-SKY PRESERVE
Figure 1 — Expedition Alpha logo
JRASCFebruary / février 2005 5
The declaration was made by the
governments of Saskatchewan and Alberta,
responsible for managing Cypress Hills
Interprovincial Park, and by Fort Walsh
National Historic Site of Canada, in
partnership with the Royal Astronomical
Society of Canada (Calgary, Regina, and
Saskatoon Centres) at a recent Canadian
Parks Council meeting held in the park.
Establishing Cypress Hills
Interprovincial Park as a Dark-Sky Preserve
will be accomplished by using responsible
lighting practices, including the use of
fully-shielded luminaires, minimum light
levels, energy-efficient lamps, aiming
lights downward, and reducing lighting
during nighttime hours.
“We are pleased to participate in
this designation with the Government of
Alberta, Parks Canada, and the Royal
Astronomical Society of Canada, which
will help to ensure the protection of
nighttime darkness, an essential element
of the ecosystem,” Saskatchewan
Environment Minister David Forbes said.
“Our continuing partnership with
Saskatchewan and Fort Walsh will provide
opportunities for the public to appreciate
a starry sky, which is also an important
aspect of our natural heritage, including
the First Nations heritage surrounding
constellations and related mythology,”
Minister of Alberta Community Development
with responsibility for parks and protected
areas Gene Zwozdesky said.
The designation will help to
enhance visitors’ appreciation of Cypress
Hills Interprovincial Park with the night
sky as part of the natural, historical,
and cultural experience. It will also
provide opportunities for new
interpretive and educational programs,
attracting more visitors, and adding
economic benefits to the respective
provincial and local tourism industries.
Saskatchewan and Alberta both plan
to work toward expanding the Dark-
Sky Preserve program within their
respective jurisdictions.
University of Victoria Cosmologist, Dr.
Arif Babul, has been awarded a prestigious
Leverhulme Visiting Professorship to be
held jointly at the University of Oxford
and the University of Durham in the UK.
“I am thrilled and honoured to be
awarded the Leverhulme Professorship,”
says Babul, who in the early 90’s held a
NATO Science Fellowship at the University
of Cambridge. “I am very excited to have
the opportunity to renew my collaborations
with colleagues in the UK and especially
at Oxford and Durham, which are home
to two of the top cosmology groups in
the world.”
A highly accomplished scientist, Dr.
Arif Babul’s innovative research and
distinguished record of highly insightful
publications have had a significant impact
on recent developments in astrophysics.
Babul studies how the Universe, emerging
from the “fires” of the Big Bang in an
exceedingly smooth state, evolved into
the present richly structured network of
galaxies that he poetically compares to
“a 3-D sculpture of glistening spider webs
strung with sparkling beads of morning
dew.” Of the myriads of cosmic forms and
features, he is especially fascinated with
the colossal cosmic entities known as
clusters of galaxies. First discovered as
gigantic swarms of galaxies held together
by gravity, these systems are now recognized
as huge reservoirs of super-heated X-ray
emitting gas, and among the most massive
— a mind-boggling equivalent of up to
a million billion suns — concentrations
of matter with gravity so strong that it
can bend and distort light from distant
background objects. A computer-generated
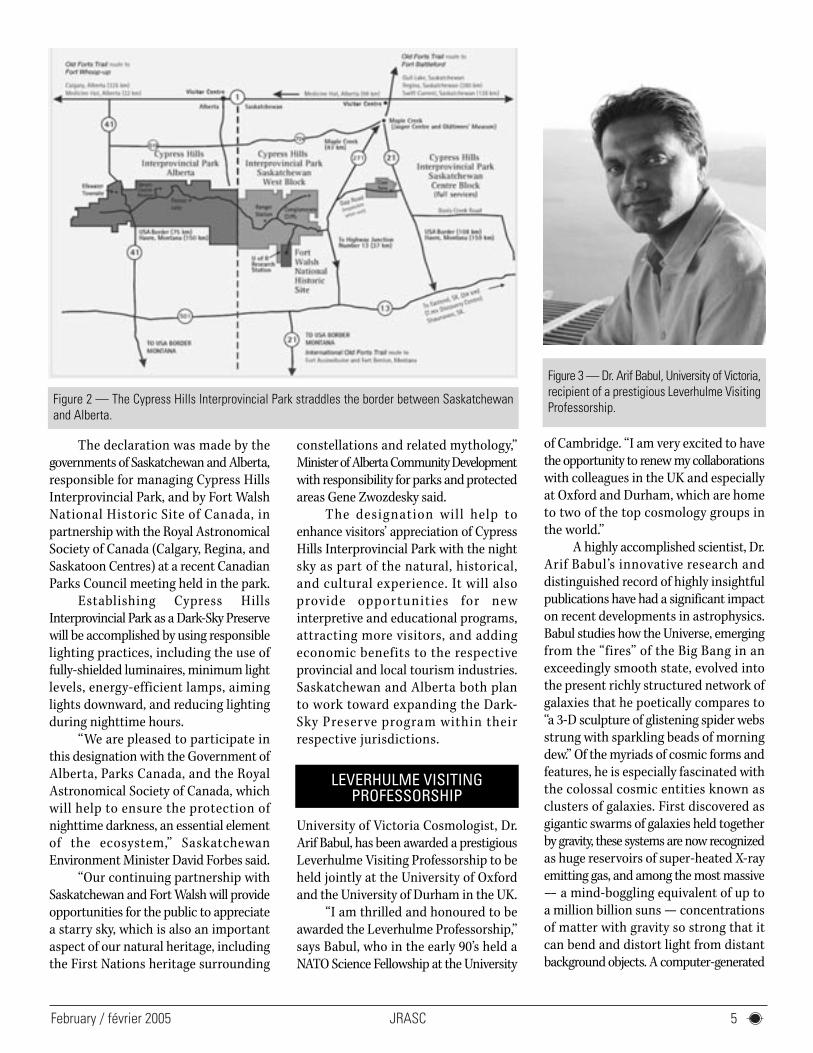
Figure 2 — The Cypress Hills Interprovincial Park straddles the border between Saskatchewanand Alberta.
LEVERHULME VISITINGPROFESSORSHIP
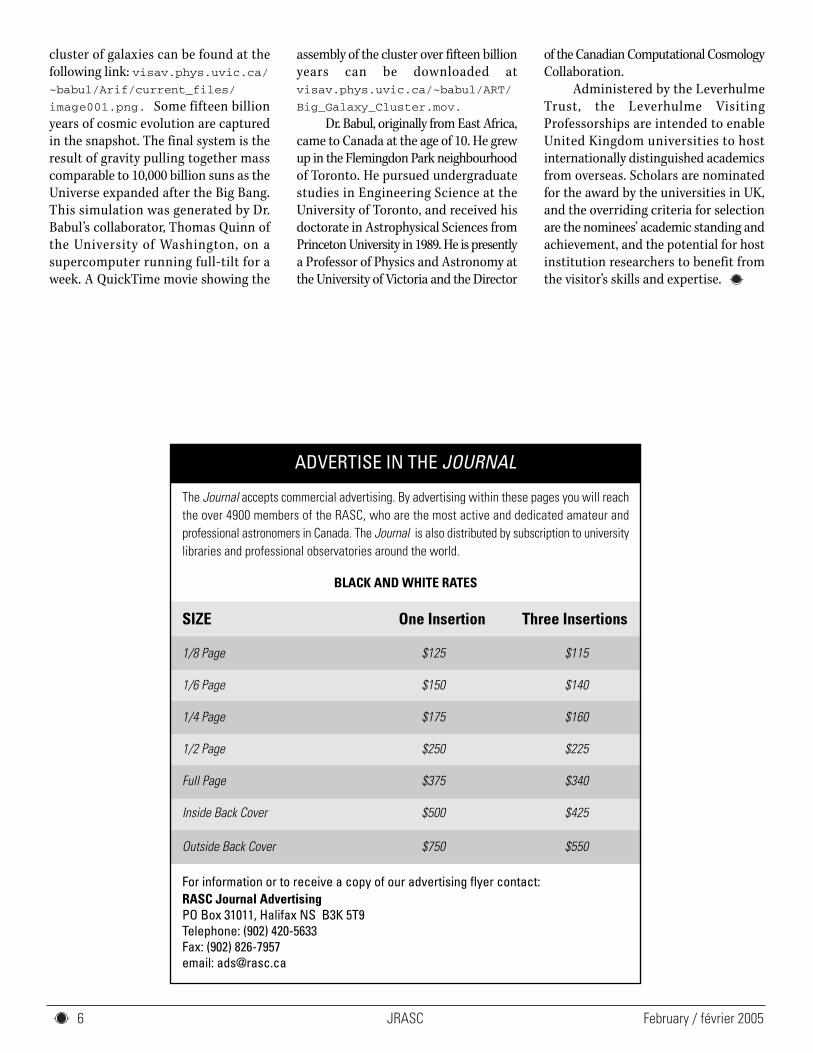
Figure 3 — Dr. Arif Babul, University of Victoria,recipient of a prestigious Leverhulme VisitingProfessorship.
JRASC February / février 2005 6
cluster of galaxies can be found at the
following link: visav.phys.uvic.ca/
~babul/Arif/current_files/
image001.png. Some fifteen billion
years of cosmic evolution are captured
in the snapshot. The final system is the
result of gravity pulling together mass
comparable to 10,000 billion suns as the
Universe expanded after the Big Bang.
This simulation was generated by Dr.
Babul’s collaborator, Thomas Quinn of
the University of Washington, on a
supercomputer running full-tilt for a
week. A QuickTime movie showing the
assembly of the cluster over fifteen billion
years can be downloaded at
visav.phys.uvic.ca/~babul/ART/
Big_Galaxy_Cluster.mov.
Dr. Babul, originally from East Africa,
came to Canada at the age of 10. He grew
up in the Flemingdon Park neighbourhood
of Toronto. He pursued undergraduate
studies in Engineering Science at the
University of Toronto, and received his
doctorate in Astrophysical Sciences from
Princeton University in 1989. He is presently
a Professor of Physics and Astronomy at
the University of Victoria and the Director
of the Canadian Computational Cosmology
Collaboration.
Administered by the Leverhulme
Trust, the Leverhulme Visiting
Professorships are intended to enable
United Kingdom universities to host
internationally distinguished academics
from overseas. Scholars are nominated
for the award by the universities in UK,
and the overriding criteria for selection
are the nominees’ academic standing and
achievement, and the potential for host
institution researchers to benefit from
the visitor’s skills and expertise.
ADVERTISE IN THE JOURNAL
The Journal accepts commercial advertising. By advertising within these pages you will reachthe over 4900 members of the RASC, who are the most active and dedicated amateur andprofessional astronomers in Canada. The Journal is also distributed by subscription to universitylibraries and professional observatories around the world.
BLACK AND WHITE RATES
SIZE One Insertion Three Insertions
1/8 Page $125 $115
1/6 Page $150 $140
1/4 Page $175 $160
1/2 Page $250 $225
Full Page $375 $340
Inside Back Cover $500 $425
Outside Back Cover $750 $550
For information or to receive a copy of our advertising flyer contact: RASC Journal AdvertisingPO Box 31011, Halifax NS B3K 5T9Telephone: (902) 420-5633Fax: (902) 826-7957email: [email protected]
JRASCFebruary / février 2005 7
Feature ArticlesArticles de Fond
Sunday, June 20, 2004. Regina. It is 6
a.m. I am up and awake and ready
to measure the world — literally.
Today is a day for old daydreams to be
made true, and it is a day for retracing
shadows of the ancient past.
When I first learned as a young schoolboy
how Eratosthenes had determined the
size of the Earth by comparing the length
of shadows cast at two different locations,
I was enthralled. The concept was so very,
very simple (as, indeed, are all leaps of
genius, once explained) and yet it was
also so powerful. I reveled in the shear
audacity of the idea — from shadow
lengths to the circumference of the Earth.
Here was the stamp of human imagination,
and here was the “measure in all things”
as espoused by Horace.
It is 6:20 a.m. The weather, as per usual
in Saskatchewan, is not cooperating; the
sky is a uniform gray. The forecast, however,
is for intermittent clear spells with perhaps
an occasional shower. I have set up the
first of the sundials in our back garden
and Georgette (my wife) will make one
set of observations from there.
The clock has just rounded 7 a.m.
and I am traveling north out of Regina,
heading for Star City, on highway number
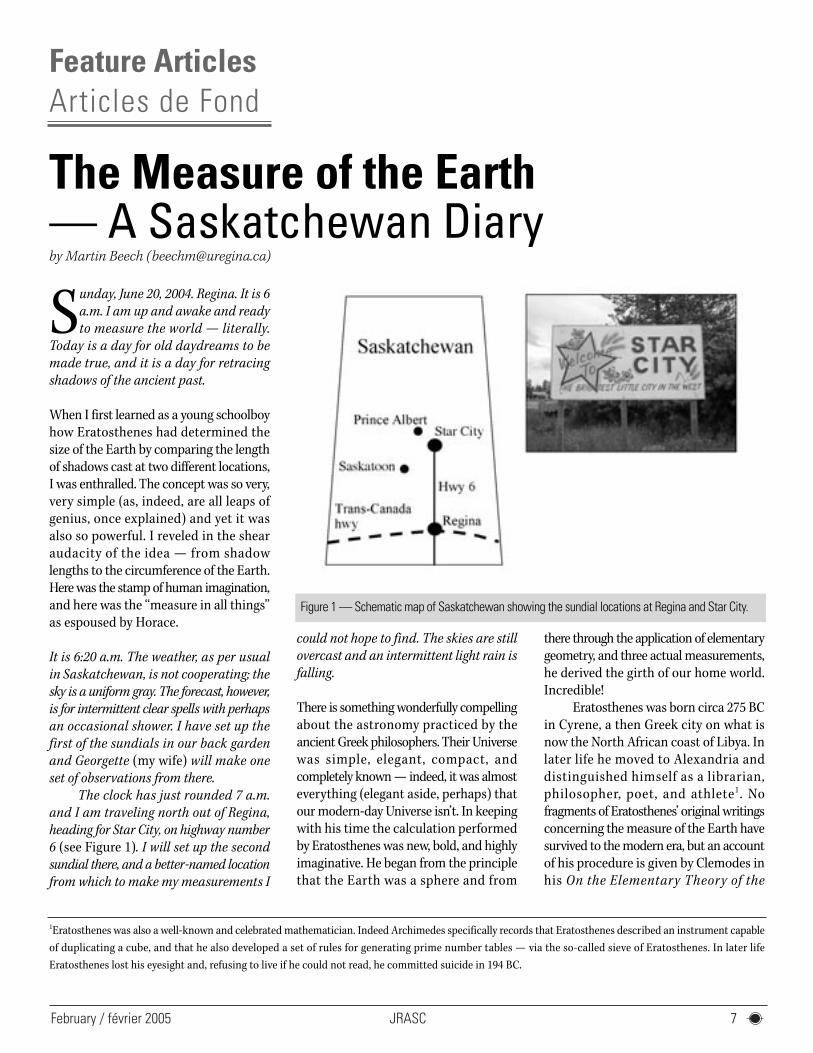
6 (see Figure 1). I will set up the second
sundial there, and a better-named location
from which to make my measurements I
could not hope to find. The skies are still
overcast and an intermittent light rain is
falling.
There is something wonderfully compelling
about the astronomy practiced by the
ancient Greek philosophers. Their Universe
was simple, elegant, compact, and
completely known — indeed, it was almost
everything (elegant aside, perhaps) that
our modern-day Universe isn’t. In keeping
with his time the calculation performed
by Eratosthenes was new, bold, and highly
imaginative. He began from the principle
that the Earth was a sphere and from
there through the application of elementary
geometry, and three actual measurements,
he derived the girth of our home world.
Incredible!
Eratosthenes was born circa 275 BC
in Cyrene, a then Greek city on what is
now the North African coast of Libya. In
later life he moved to Alexandria and
distinguished himself as a librarian,
philosopher, poet, and athlete1. No
fragments of Eratosthenes’ original writings
concerning the measure of the Earth have
survived to the modern era, but an account
of his procedure is given by Clemodes in
his On the Elementary Theory of the
The Measure of the Earth — A Saskatchewan Diaryby Martin Beech ([email protected])
Figure 1 — Schematic map of Saskatchewan showing the sundial locations at Regina and Star City.
1Eratosthenes was also a well-known and celebrated mathematician. Indeed Archimedes specifically records that Eratosthenes described an instrument capable
of duplicating a cube, and that he also developed a set of rules for generating prime number tables — via the so-called sieve of Eratosthenes. In later life
Eratosthenes lost his eyesight and, refusing to live if he could not read, he committed suicide in 194 BC.
JRASC February / février 2005 8
Heavenly Bodies. Clemodes explains that
Eratosthenes’ method made specific use
of observations relating to the altitude
of the Sun2. In particular Eratosthenes
noted that in Syene (now the city of Aswan)
the Sun was directly overhead at noon
on the day of the summer solstice, while
in Alexandria, some 5000 stades to the
north, the Sun was 1/50 of a circle away
from the zenith3. With these pieces of
information, admittedly none of which,
as far as we know, were actually measured
by Eratosthenes, he was able to determine
that the Earth had a circumference of
252,000 stades4.
It is 9:34 a.m. I have just arrived in Watson,
over half way to Star City. The weather is
beginning to improve. I can at last see
clear breaks of blue sky.
It is 10:33 a.m. and I have stopped
for coffee at Melfort. I am now just a few
tens of kilometres from Star City, and the
wind is howling. Dirty-gray and ominous
heaps of cumulus clouds cover most of the
sky — but clear breaks are visible. During
the past hour the Sun has occasionally
blazed out from between clouds, but typically
for just a few tens of minutes. The weather
isn’t perfect, but we should be able to work
around it. Cell phone contact with Regina
indicates that it is clear and sunny there.
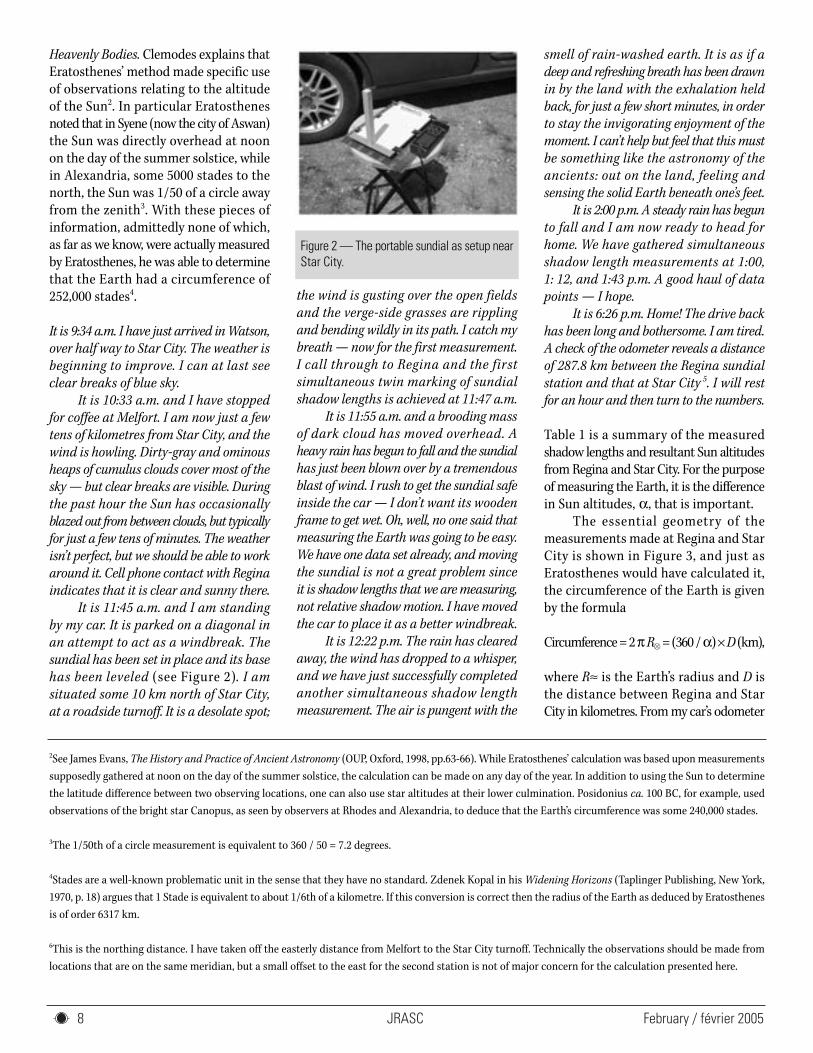
It is 11:45 a.m. and I am standing
by my car. It is parked on a diagonal in
an attempt to act as a windbreak. The
sundial has been set in place and its base
has been leveled (see Figure 2). I am
situated some 10 km north of Star City,
at a roadside turnoff. It is a desolate spot;
the wind is gusting over the open fields
and the verge-side grasses are rippling
and bending wildly in its path. I catch my
breath — now for the first measurement.
I call through to Regina and the first
simultaneous twin marking of sundial
shadow lengths is achieved at 11:47 a.m.
It is 11:55 a.m. and a brooding mass
of dark cloud has moved overhead. A
heavy rain has begun to fall and the sundial
has just been blown over by a tremendous
blast of wind. I rush to get the sundial safe
inside the car — I don’t want its wooden
frame to get wet. Oh, well, no one said that
measuring the Earth was going to be easy.
We have one data set already, and moving
the sundial is not a great problem since
it is shadow lengths that we are measuring,
not relative shadow motion. I have moved
the car to place it as a better windbreak.
It is 12:22 p.m. The rain has cleared
away, the wind has dropped to a whisper,
and we have just successfully completed
another simultaneous shadow length
measurement. The air is pungent with the
smell of rain-washed earth. It is as if a
deep and refreshing breath has been drawn
in by the land with the exhalation held
back, for just a few short minutes, in order
to stay the invigorating enjoyment of the
moment. I can’t help but feel that this must
be something like the astronomy of the
ancients: out on the land, feeling and
sensing the solid Earth beneath one’s feet.
It is 2:00 p.m. A steady rain has begun
to fall and I am now ready to head for
home. We have gathered simultaneous
shadow length measurements at 1:00,
1: 12, and 1:43 p.m. A good haul of data
points — I hope.
It is 6:26 p.m. Home! The drive back
has been long and bothersome. I am tired.
A check of the odometer reveals a distance
of 287.8 km between the Regina sundial
station and that at Star City 5. I will rest
for an hour and then turn to the numbers.
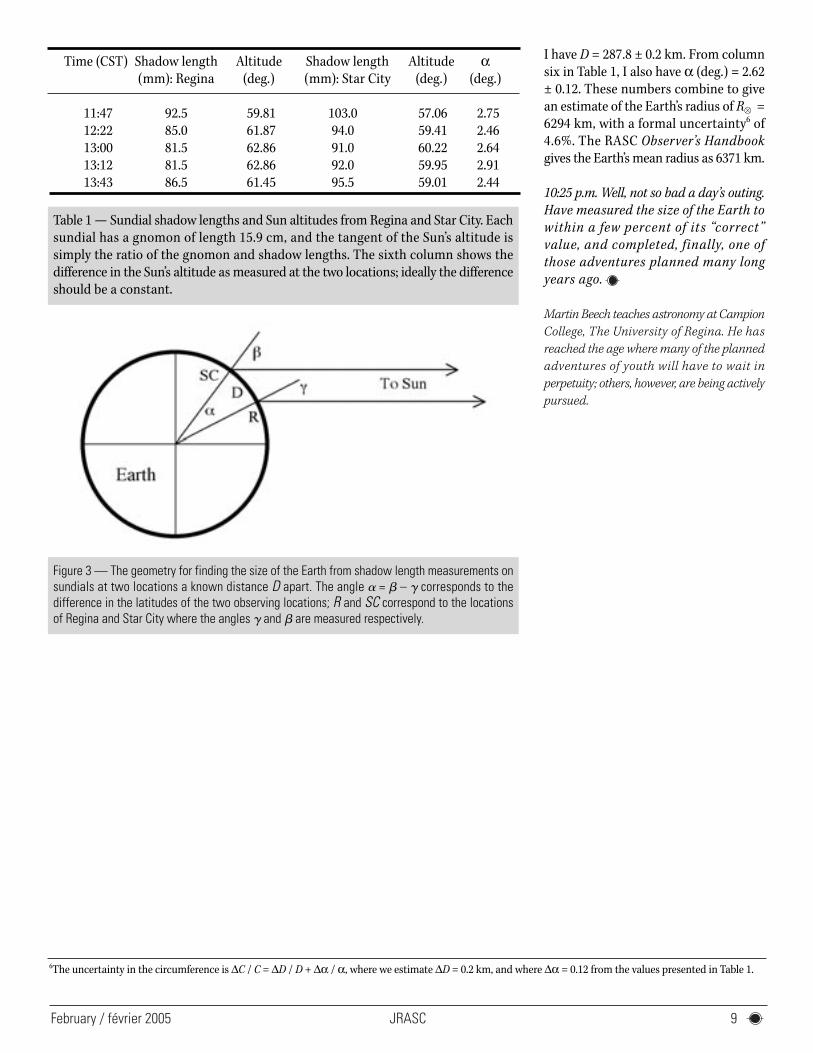
Table 1 is a summary of the measured
shadow lengths and resultant Sun altitudes
from Regina and Star City. For the purpose
of measuring the Earth, it is the difference
in Sun altitudes, α, that is important.
The essential geometry of the
measurements made at Regina and Star
City is shown in Figure 3, and just as
Eratosthenes would have calculated it,
the circumference of the Earth is given
by the formula
Circumference = 2 πR = (360 / α) × D (km),
where R≈ is the Earth’s radius and D is
the distance between Regina and Star
City in kilometres. From my car’s odometer
2See James Evans, The History and Practice of Ancient Astronomy (OUP, Oxford, 1998, pp.63-66). While Eratosthenes’ calculation was based upon measurements
supposedly gathered at noon on the day of the summer solstice, the calculation can be made on any day of the year. In addition to using the Sun to determine
the latitude difference between two observing locations, one can also use star altitudes at their lower culmination. Posidonius ca. 100 BC, for example, used
observations of the bright star Canopus, as seen by observers at Rhodes and Alexandria, to deduce that the Earth’s circumference was some 240,000 stades.
3The 1/50th of a circle measurement is equivalent to 360 / 50 = 7.2 degrees.
4Stades are a well-known problematic unit in the sense that they have no standard. Zdenek Kopal in his Widening Horizons (Taplinger Publishing, New York,
1970, p. 18) argues that 1 Stade is equivalent to about 1/6th of a kilometre. If this conversion is correct then the radius of the Earth as deduced by Eratosthenes
is of order 6317 km.
6This is the northing distance. I have taken off the easterly distance from Melfort to the Star City turnoff. Technically the observations should be made from
locations that are on the same meridian, but a small offset to the east for the second station is not of major concern for the calculation presented here.
Figure 2 — The portable sundial as setup nearStar City.
JRASCFebruary / février 2005 9
I have D = 287.8 ± 0.2 km. From column
six in Table 1, I also have α (deg.) = 2.62
± 0.12. These numbers combine to give
an estimate of the Earth’s radius of R =
6294 km, with a formal uncertainty6 of
4.6%. The RASC Observer’s Handbook
gives the Earth’s mean radius as 6371 km.
10:25 p.m. Well, not so bad a day’s outing.
Have measured the size of the Earth to
within a few percent of its “correct”
value, and completed, finally, one of
those adventures planned many long
years ago.
Martin Beech teaches astronomy at Campion
College, The University of Regina. He has
reached the age where many of the planned
adventures of youth will have to wait in
perpetuity; others, however, are being actively
pursued.
Time (CST) Shadow length Altitude Shadow length Altitude α(mm): Regina (deg.) (mm): Star City (deg.) (deg.)
11:47 92.5 59.81 103.0 57.06 2.75
12:22 85.0 61.87 94.0 59.41 2.46
13:00 81.5 62.86 91.0 60.22 2.64
13:12 81.5 62.86 92.0 59.95 2.91
13:43 86.5 61.45 95.5 59.01 2.44
Table 1 — Sundial shadow lengths and Sun altitudes from Regina and Star City. Each
sundial has a gnomon of length 15.9 cm, and the tangent of the Sun’s altitude is
simply the ratio of the gnomon and shadow lengths. The sixth column shows the
difference in the Sun’s altitude as measured at the two locations; ideally the difference
should be a constant.
Figure 3 — The geometry for finding the size of the Earth from shadow length measurements onsundials at two locations a known distance D apart. The angle = – corresponds to thedifference in the latitudes of the two observing locations; R and SC correspond to the locationsof Regina and Star City where the angles and are measured respectively.
6The uncertainty in the circumference is ∆C / C = ∆D / D + ∆α / α, where we estimate ∆D = 0.2 km, and where ∆α = 0.12 from the values presented in Table 1.
JRASC February / février 2005 10
Reflections
This issue we have an interestingpair of anniversaries: February 18is the 75th anniversary of Clyde
Tombaugh’s discovery of the planet Plutoat Lowell Observatory in 1930; and March13 is the 150th anniversary of the birthof the founder of that observatory, PercivalLowell, almost exactly 75 years earlierin 1855.
Percival Lowell
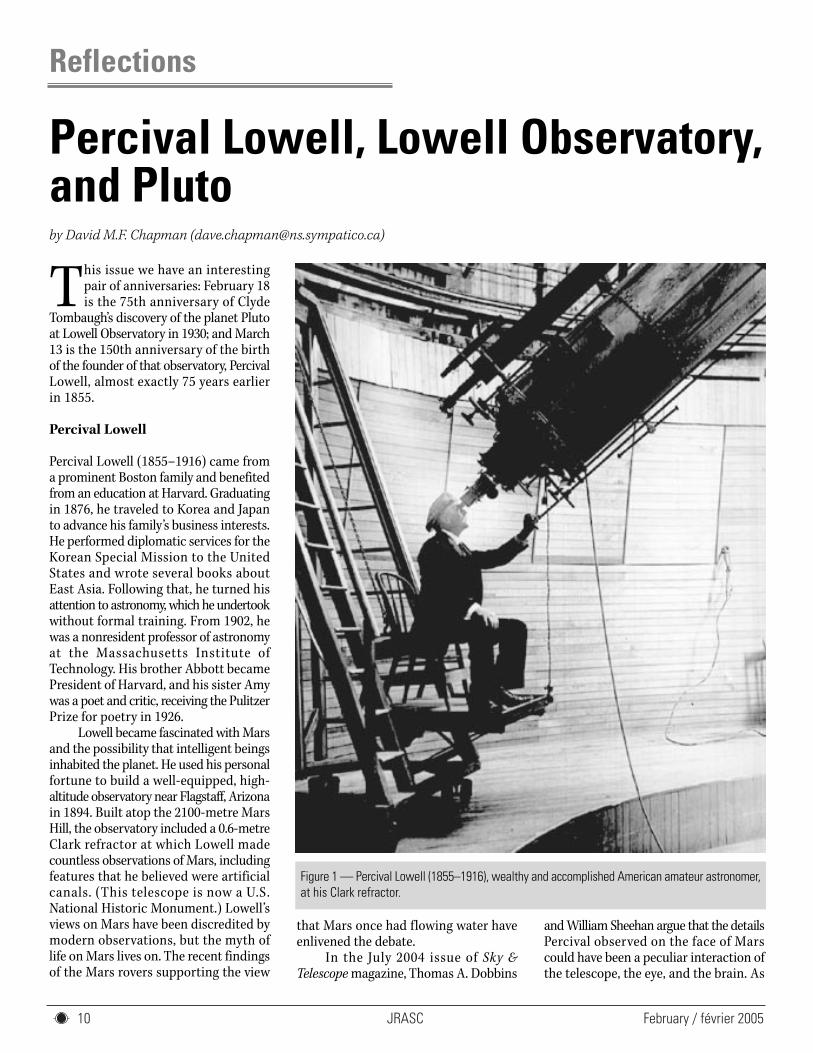
Percival Lowell (1855–1916) came froma prominent Boston family and benefitedfrom an education at Harvard. Graduatingin 1876, he traveled to Korea and Japanto advance his family’s business interests.He performed diplomatic services for theKorean Special Mission to the UnitedStates and wrote several books aboutEast Asia. Following that, he turned hisattention to astronomy, which he undertookwithout formal training. From 1902, hewas a nonresident professor of astronomyat the Massachusetts Institute ofTechnology. His brother Abbott becamePresident of Harvard, and his sister Amywas a poet and critic, receiving the PulitzerPrize for poetry in 1926.
Lowell became fascinated with Marsand the possibility that intelligent beingsinhabited the planet. He used his personalfortune to build a well-equipped, high-altitude observatory near Flagstaff, Arizonain 1894. Built atop the 2100-metre MarsHill, the observatory included a 0.6-metreClark refractor at which Lowell madecountless observations of Mars, includingfeatures that he believed were artificialcanals. (This telescope is now a U.S.National Historic Monument.) Lowell’sviews on Mars have been discredited bymodern observations, but the myth oflife on Mars lives on. The recent findingsof the Mars rovers supporting the view
that Mars once had flowing water haveenlivened the debate.
In the July 2004 issue of Sky &Telescope magazine, Thomas A. Dobbins
and William Sheehan argue that the detailsPercival observed on the face of Marscould have been a peculiar interaction ofthe telescope, the eye, and the brain. As
Percival Lowell, Lowell Observatory,and Plutoby David M.F. Chapman ([email protected])
Figure 1 — Percival Lowell (1855–1916), wealthy and accomplished American amateur astronomer,at his Clark refractor.
JRASCFebruary / février 2005 11
a result of image-enhancing algorithms,similar features are evident in some recentdigital images of Mars. Although the canalfeatures are not physical, they arereproducible visual effects that Lowelldutifully recorded in his notes and sketches.(See the August 2003 issue of JRASC foran example of Lowell’s findings.)
The Discovery of Pluto
Another favorite project of Lowell wasthe search for Planet X. He was trainedas a mathematician, and he was convincedthat the motion of Neptune indicated theexistence of a trans-Neptunian planet.The searches began in 1905. Lowell himselfwas unsuccessful in locating the planethe believed to exist: the honour went toClyde Tombaugh (1906–1997), a youngself-taught astronomer who came to workas an assistant at Lowell’s observatory in1929. After about a year of painstakingeffort, Tombaugh discovered Pluto as amagnitude 15 speck on a pair ofphotographic plates on February 18, 1930,fourteen years after Lowell’s death.
Tombaugh actually exposed thediscovery plates on January 23 and 29,but he discovered the apparent motionof Pluto among the stars of Gemini over
the 6-day interval by carefully aligningthe plates in an optical viewing deviceknown as a “blink comparator.” By rapidlyalternating the view between the plates,the tiny star-like speck that was Plutoappeared to jump back and forth betweenits positions on those dates. Thephotographic search was alwaysconducted in the region of the skyopposite the Sun, to maximize theapparent retrograde motion of anyplanetary object against the distantbackground stars. From its rate of angularmotion, Tombaugh was certain that thenew object was beyond the orbit ofNeptune. He continued to makeobservations for about a month, andthe discovery of PLuto (capitalizationintentional!) was announced on March13, the 75th anniversary of Lowell’s birth.
Ironically, the mass of Pluto turnedout to be less than 1/5 that of the Moon,too small to have the desiredgravitational effect on Neptune. AlthoughTombaugh’s search strategy wassuccessful, the discovery was somewhataccidental. After the discovery of Pluto,Tombaugh received a scholarship tothe University of Kansas, earning abachelor’s degree in 1936 and a master’sdegree in 1939.
Lowell Observatory Today
Other achievements at Lowell Observatoryinclude: discovery of the expansion ofthe Universe; co-discovery of the rings ofUranus; and the continuing search anddiscovery of numerous near-Earth asteroids,comets, Kuiper Belt Objects (KBOs), andextra-solar planets. Observatoryastronomers are conducting an extensivestudy of the photometric stability of theSun, which is relevant to the global-warming debate. (For those who keepback issues of JRASC, there is more toread on this in the August 1999 SecondLight and December 2001 Reflectionscolumns.)
The latest educational project is the4.3-metre Discovery Channel telescope(DCT), to be operated in partnership withthe Discovery Channel. The DCT will beused primarily to accelerate the discoveryof KBOs that orbit the Sun beyond Pluto.Find out more at www.lowell.edu/.
David (Dave XVII) Chapman is a Life Member
of the RASC and a past President of the Halifax
Centre. By day, he is a Defence Scientist at
Defence R&D Canada–Atlantic. Visit his
astronomy page at www3.ns.sympatico.
ca/dave.chapman/astronomy_page.
RASC INTERNET RESOURCES
Visit the RASC Web site Renew your Membership Contact the National Officewww.rasc.ca www.store.rasc.ca [email protected]
Join the RASC’s email Discussion ListThe RASCals list is a forum for discussion among members of the RASC. The forum encourages communication among members across the countryand beyond. It began in November 1995 and currently has about 300 members.
To join the list, send an email to [email protected] with the words “subscribe rascals Your Name (Your Centre)” as the first line of themessage. For further information see: www.rasc.ca/computer/rasclist.htm
JRASC February / février 2005 12
Second Light
The most important property of a
star is its mass, yet that often is
very difficult to measure directly.
Its luminosity can be determined by
measuring the brightness and knowing
the distance, but unless a star has a
companion, its mass usually is estimated
through a device known as the “mass-
luminosity” relation. This is a fancy term
for the rough relationship between a star’s
mass and luminosity. Now Laird Close,
of Steward Observatory at the University
of Arizona (originally from Ottawa), and
his colleagues there, in Germany, Spain,
and Chile, have measured the mass of a
very-low-mass star. They find that the
standard mass-luminosity relation
overestimates the mass of such objects
by a factor of about 2.5, at least when the
star is young. This also means that some
of the young, cool objects previously
identified as brown dwarfs are more
massive, and therefore the frequency of
brown dwarfs and giant planets in clusters
has been overestimated.
The mass-luminosity relation has
its origins in the Hertzsprung-Russell
diagram. This diagram plots stars’ spectral
type (or equivalently, their surface
temperatures) against its luminosity. The
“main sequence” is a band of normal —
not giant — stars stretching from the
brightest and hottest to the dimmest and
coolest. The H-R diagram has been a very
useful tool for professional astronomers
for almost 100 years, because — once it
has been calibrated with some known
masses — it can be used to estimate
masses of other stars, and their distances,
from just a picture and a spectrum. The
low-luminosity end of the H-R diagram
has been very poorly calibrated, because
of the difficulty in observing those stars,
so it is constrained only by the theory of
stellar structure.
Mass is the single most important
quantity for most stars because that
determines the temperature and pressure
of the gas at the centre, through the self-
gravity of all the hydrogen in the star. The
temperature and pressure regulate the
rate at which energy is generated, as
hydrogen fuses to form helium. The end
of the main sequence is determined by
the point at which hydrogen can no longer
fuse, although in young low-mass objects,
known as brown dwarfs, deuterium fuses
down to lower temperatures. Deuterium
is hydrogen with a neutron in the nucleus,
and it fuses more readily than normal
hydrogen.
The physics of fusion is quite well
understood, the central temperature and
pressure fairly well understood, but the
atmospheres of low-mass stars are very
poorly understood indeed, which allows
for a lot of uncertainty in the mass-
luminosity relation. Hot stars have only
ionized elements in their atmospheres,
which are not particularly efficient at
absorbing photons from the surface. What
astronomers call the “radiative transfer”
problem is quite simple to resolve.
When a star becomes very cool,
however, molecules and even dust can
form in its atmosphere, enormously
complicating the job of figuring out what
its true total (bolometric) luminosity is.
An everyday analogy to illustrate the
problem can be seen looking at our Sun
through the atmosphere. When the Sun
is high in the sky, some of the blue photons
are scattered out of the line of sight (enough
to make the sky blue), but the Sun appears
white. When it is setting, the light has to
travel a much longer path through the
atmosphere, encountering many more
molecules and dust grains, which effectively
remove all of the blue photons — therefore
the Sun appears red. The Sun itself is the
same, but what we see has changed. A
related process happens to the low-mass
stars. We know approximately how much
total energy has to come out (from theory),
but the wavelengths at which it comes
out varies dramatically according to what
is in the atmosphere.
This is why an absolute calibration
of the mass-luminosity relation is so
important. I mentioned earlier that the
only time astronomers can measure
directly a star’s mass is when it has a
companion, like in a binary star system.
Close and his companions have developed
a new adaptive-optics camera that, when
mounted on the Very Large Telescope in
Chile, enabled them to find a very-low-
mass star orbiting the star AB Doradus.
The companion (AB Dor C) is more than
100 times fainter than AB Dor A, and only
0.156 arcseconds away. At the distance
of AB Dor, that’s just 2.3 AU from the star
(about the distance of the asteroid Vesta
from the Sun). An interesting sideline to
the main story is that the Hubble Space
Telescope tried — but failed — to detect
the companion, whose presence was
expected based on tiny wobbles in AB
Dor’s position on the sky. This underscores
the power of adaptive optics and large
ground-based telescopes!
Using the published data on AB
Dor’s wobbles, the observed position
of the companion, and the mass of AB
Dor, Close was able to determine that
the companion’s mass is a tiny 0.09
solar mass, or about 94 Jupiter masses,
which is just above the level of a brown
dwarf. He then obtained a spectrum
Weighing the Lowest Mass Starsby Leslie J. Sage ([email protected])
JRASCFebruary / février 2005 13
to determine very precisely the star’s
spectral class, which turns out to be
M8. Through a rather complicated
process, he finds that the predicted
mass for such a star with the age of AB
Dor C is a factor of 2 lower than its
measured mass. This means that the
heavily hyped free-f loating cluster
planets may well be misidentified low-
mass brown dwarfs.
The final conclusion drawn by
Close is that his work illustrates the
danger of using theory that has not
been calibrated by observation — a
lesson that should be learned by one
and all, whatever your field.
Leslie J. Sage is Senior Editor, Physical Sciences,
for Nature Magazine and a Research Associate
in the Astronomy Department at the University
of Maryland. He grew up in Burlington, Ontario,
where even the bright lights of Toronto did not
dim his enthusiasm for astronomy. Currently
he studies molecular gas and star formation
in galaxies, particularly interacting ones.
A REMARKABLE AURORA ON AUGUST 7, 1906.FROM NOTES TAKEN AT SHEBESHEKONG, SIXTEEN MILES NORTH-WEST OF PARRY SOUND
While watching the sky this evening a brilliant display of Aurora took place, beginning at 8.50. Streamers of beautiful light green shotup to about 40°. At first they changed rapidly, flashing up occasionally to a point near the zenith, no color but green being visible, butafter a time they settled down to a large arch of glowing light without any visible motion. The arch extended from north-west to north-east, and at its centre was about 20° above the horizon. At 10.30 it was still visible. At the time the Aurora began, a large bow oflight appeared in the north-east, seeming to spring up from the Aurora, and gradually but slowly extended upwards across the sky tothe zenith and down to the west until it reached the horizon. It was from 3 to 4 degrees in width, came up in the north-east throughthe Dolphin, crossed the Milky Way at about right angles slightly south of the zenith, and slightly south of the head of Cygnus, coveredCorona Borealis and Arcturus and extended westward to where Venus had been two hours before in the ecliptic.
When it began in the north-east it had the appearance of a bright tail of a comet but much wider. It looked like a long extendedcloud lighted up by the Sun, very much brighter than the Milky Way. It had no motion, but remained in the same position all the time.It arched the whole sky without a break. Breaking up first in the zenith it gradually but slowly dissolved, and at 10.30 had disappeared.
Whether this phenomenon had any connection with the weather or not I cannot say, but it rained all night on the 9th and all thenext day, the 10th.
by J. McEachrenfrom Journal, Vol. 1, p. 42, January-February 1907.
FROM THE PAST AU FIL DES ANS
February / février 200514
Research PapersArticles de recherche
1. Introduction
Meteor observing with automated cameras has a long history in
Canada. MORP (Meteorite Observation and Recovery Project; Halliday
et al. 1978) used sophisticated film-based cameras to determine orbits
of meteors and to aid in finding meteorites. Similarly, aurora photography
and motion picture recording has been in use for a long time with
custom built (Brown et al. 1976) or specialized image intensifier
cameras (Trondsen & Cogger 1998). Simple tape-based video recording
equipment for the purpose of studying bright meteors was recently
METEOR AND AURORA DETECTION USING
MODERN VIDEO TECHNOLOGIES
by
Martin ConnorsAthabasca University
Electronic Mail: [email protected]
Mikko SyrjäsuoUniversity of Calgary
Electronic Mail: [email protected]
Peter BrownUniversity of Western Ontario
Electronic Mail: [email protected]
and Eric DonovanUniversity of Calgary
Electronic Mail: [email protected]
(Received June 4, 2004; revised November 15, 2004)
Abstract. It is now possible to inexpensively monitor the night sky using video technologies, and both amateurs and professionals can
contribute to science by doing so. Two night-sky events that illustrate this were detected from Athabasca, Alberta, and coincidentally
took place at local times on October 1 of the years 2002 and 2003. The 2002 event was a bright aurora detected by a “meteor” camera,
which we describe in terms of current auroral theory. The 2003 event was an unusual fireball recorded both by the automated meteor
camera and by a new auroral camera. We suspect that this was a rare Earth-grazing fireball, but the position in the sky and lack of other
instrumental records do not allow us to determine this or the orbital parameters with great accuracy. The planned THEMIS research
network of auroral cameras should secondarily contribute to bolide research, and gaps in its coverage could be filled by amateurs.
Equipment used for automated detection of meteors is described in sufficient detail that others could build it.
Résumé. La technologie actuelle des caméras vidéo permet de surveiller le ciel nocturne de façon continue à des prix modiques. Ceci
permet aux amateurs comme aux professionnels de contribuer à la science. La nuit du 1er octobre nous a livré des surprises les deux
années consécutives de 2002 et 2003. En 2002 une aurore boréale intense a été detectée par une caméra d’observations des météores.
Nous expliquons ce phénomène suivant la théorie actuelle des aurores. En 2003 un bolide extraordinaire a été enregistré par cette même
caméra (à Athabasca, en Alberta) et par une nouvelle caméra d’observations des aurores. En ce cas il s’agissait probablement d’un bolide
frôlant l’atmosphère sans tomber, mais d’après les données disponibles il n’est pas possible d’en être certain, ni de déterminer avec précision
son orbite. Nous concluons néanmoins qu’un réseau de caméras pour la recherche des aurores boréales serait utile aussi pour localiser
des bolides. Nous donnons ici suffisamment de détails sur nos caméras de détection automatisée des bolides pour que ceux qui désirent
entreprendre des recherches sur les bolides ou tout simplement enregistrer les phénomènes du ciel nocturne puissent les construire eux-
mêmes.
Journal of the Royal Astronomical Society of Canada, 99: 14 – 22, 2005 February
JRASCFebruary / février 2005 15
discussed in this Journal (Connors et al. 2003). We have found that
the low-cost equipment used in those meteor cameras was also
excellent for monitoring bright aurorae. Overall, the cost of monitoring
the night sky has dramatically declined over the decades, due largely
to improvements in technology. Specifically, low-powered, sensitive
detectors are commercially available and inexpensive lenses allow a
wide field of view. We will show here that use of computers and digital
video further decreases the cost, and importantly also the effort, of
running a sky monitoring network. Video techniques at various levels
of sophistication can be used for monitoring meteors and aurorae,
blurring the distinction between amateur and professional efforts.
The scientific motivations for bolide and for auroral observing
differ. Bolides are of interest largely since they may produce meteorites.
Good observations from the ground can allow the fall zone to be
accurately determined, facilitating finding them. The observations
also allow the orbit to be determined, giving valuable information
about the origin of these rare samples from space (Wasson 1985).
The recent Neuschwanstein fireball and meteorites are a good example,
with intriguing questions raised by the orbit’s similarity to that of the
well-known Pribram meteorite (Spurny et al. 2003). While bolides
are rare, aurorae are commonly seen in the large part of Canada lying
in the auroral zone. However, many fundamental facts about the
physics behind the aurora remain mysterious (McPherron 1995).
Questions yet to be answered include the origin of the auroral arc
itself and the larger framework in which aurorae occur, particularly
the most active and dramatic ones associated with the auroral
“substorm.”
We illustrate the various detection methods by discussion of
an auroral event detected by meteor cameras, and of a meteor event
detected by both a meteor camera and an auroral camera. These
events each took place on October 1, MST. The auroral event took
place in 2002, while the meteor was detected in 2003. We will first
give a brief discussion of the aurora relative to the current knowledge
of auroral phenomena and theory. Analysis of the meteor event, to
the extent possible based on images from only one location, follows.
2. October 1-2, 2002: Aurora Detected with a Meteor Camera
Auroral activity is the indirect result of energy injected into near-
Earth space by the solar wind. This thin gas typically carries about
20 particles cm–3, of which half are electrons and half protons (hydrogen
ions). Usually some other elements are also present. It flows past Earth
at speeds typically approaching 500 km s–1. The interaction with Earth
is partly due to the fact that the solar wind also carries a magnetic
field, and this interaction is strongest when that field at least partly
points southward. Much of the energy is stored in a comet-like magnetic
tail, the magnetotail, on the opposite side of Earth from the Sun (see
Figure 1). Changes in the magnetic configuration can result in energy
flowing into the near-polar regions, producing aurora. Often this
takes place in a process known as a substorm. The exact details of
substorms are not understood; however, they are usually divided into
growth, expansive, and recovery phases. These correspond respectively
to periods of storage of energy, its explosive release, and subsequent
reconfiguration.
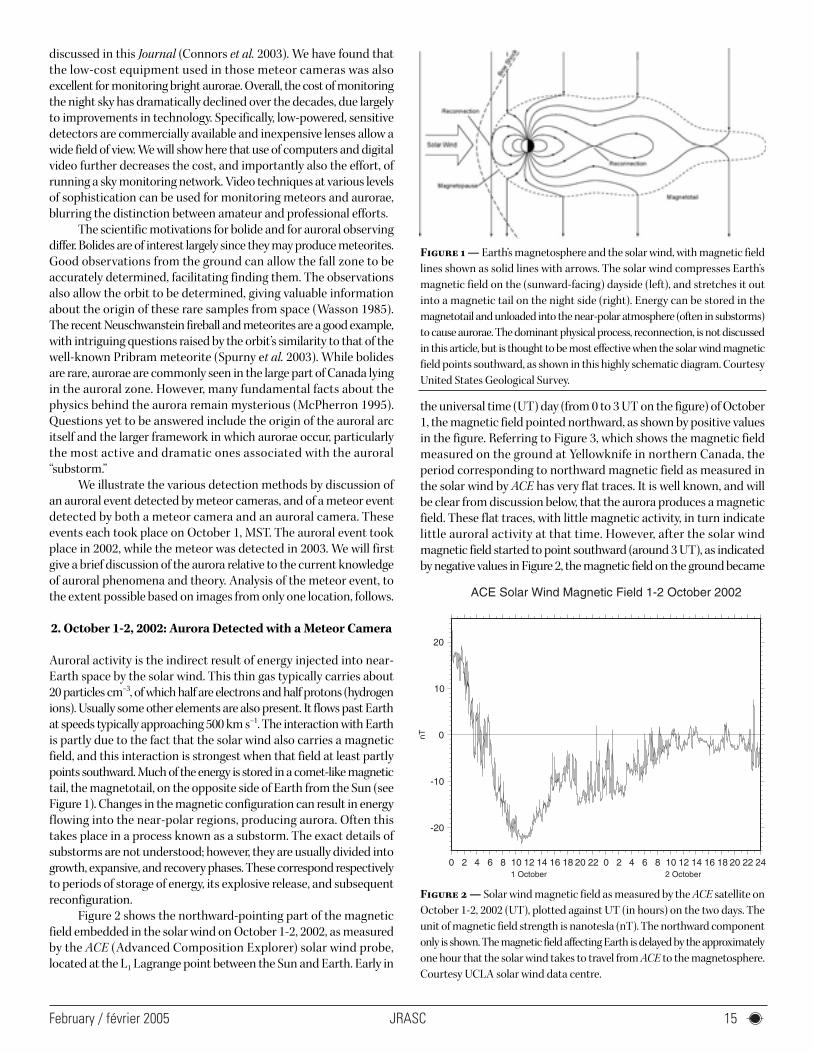
Figure 2 shows the northward-pointing part of the magnetic
field embedded in the solar wind on October 1-2, 2002, as measured
by the ACE (Advanced Composition Explorer) solar wind probe,
located at the L1 Lagrange point between the Sun and Earth. Early in
the universal time (UT) day (from 0 to 3 UT on the figure) of October
1, the magnetic field pointed northward, as shown by positive values
in the figure. Referring to Figure 3, which shows the magnetic field
measured on the ground at Yellowknife in northern Canada, the
period corresponding to northward magnetic field as measured in
the solar wind by ACE has very flat traces. It is well known, and will
be clear from discussion below, that the aurora produces a magnetic
field. These flat traces, with little magnetic activity, in turn indicate
little auroral activity at that time. However, after the solar wind
magnetic field started to point southward (around 3 UT), as indicated
by negative values in Figure 2, the magnetic field on the ground became
Figure 1 — Earth’s magnetosphere and the solar wind, with magnetic field
lines shown as solid lines with arrows. The solar wind compresses Earth’s
magnetic field on the (sunward-facing) dayside (left), and stretches it out
into a magnetic tail on the night side (right). Energy can be stored in the
magnetotail and unloaded into the near-polar atmosphere (often in substorms)
to cause aurorae. The dominant physical process, reconnection, is not discussed
in this article, but is thought to be most effective when the solar wind magnetic
field points southward, as shown in this highly schematic diagram. Courtesy
United States Geological Survey.
Figure 2 — Solar wind magnetic field as measured by the ACE satellite on
October 1-2, 2002 (UT), plotted against UT (in hours) on the two days. The
unit of magnetic field strength is nanotesla (nT). The northward component
only is shown. The magnetic field affecting Earth is delayed by the approximately
one hour that the solar wind takes to travel from ACE to the magnetosphere.
Courtesy UCLA solar wind data centre.
JRASC February / février 200516
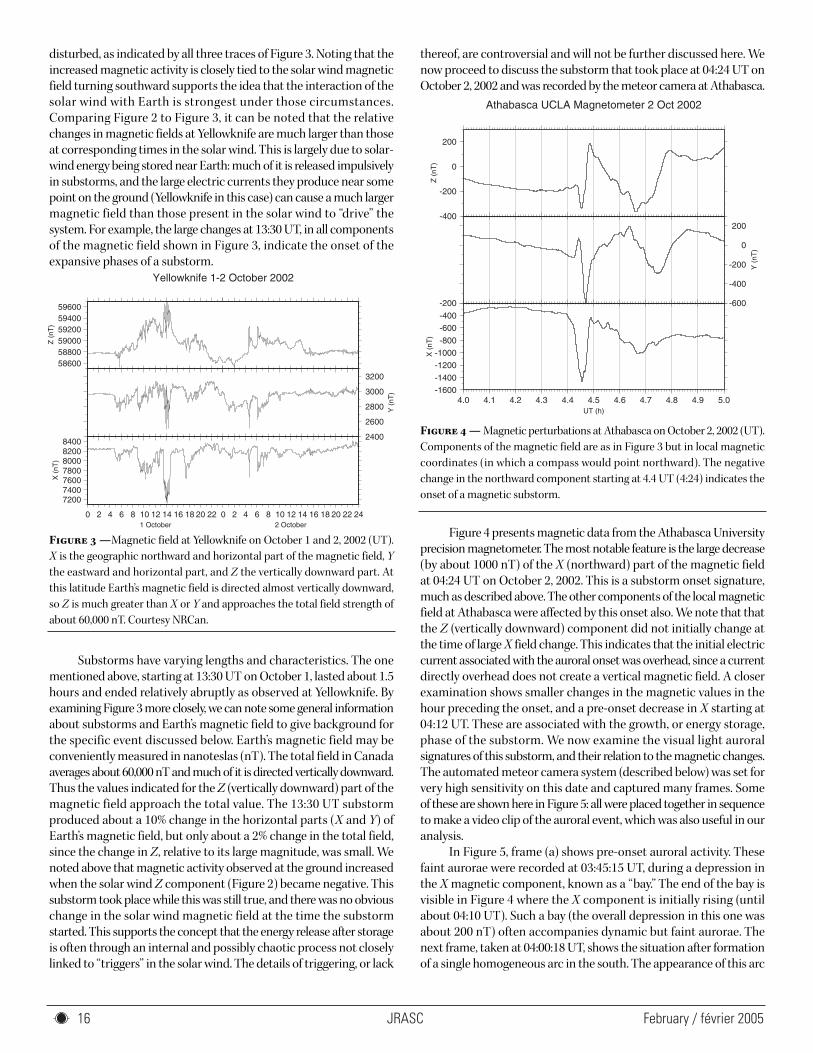
disturbed, as indicated by all three traces of Figure 3. Noting that the
increased magnetic activity is closely tied to the solar wind magnetic
field turning southward supports the idea that the interaction of the
solar wind with Earth is strongest under those circumstances.
Comparing Figure 2 to Figure 3, it can be noted that the relative
changes in magnetic fields at Yellowknife are much larger than those
at corresponding times in the solar wind. This is largely due to solar-
wind energy being stored near Earth: much of it is released impulsively
in substorms, and the large electric currents they produce near some
point on the ground (Yellowknife in this case) can cause a much larger
magnetic field than those present in the solar wind to “drive” the
system. For example, the large changes at 13:30 UT, in all components
of the magnetic field shown in Figure 3, indicate the onset of the
expansive phases of a substorm.
Substorms have varying lengths and characteristics. The one
mentioned above, starting at 13:30 UT on October 1, lasted about 1.5
hours and ended relatively abruptly as observed at Yellowknife. By
examining Figure 3 more closely, we can note some general information
about substorms and Earth’s magnetic field to give background for
the specific event discussed below. Earth’s magnetic field may be
conveniently measured in nanoteslas (nT). The total field in Canada
averages about 60,000 nT and much of it is directed vertically downward.
Thus the values indicated for the Z (vertically downward) part of the
magnetic field approach the total value. The 13:30 UT substorm
produced about a 10% change in the horizontal parts (X and Y) of
Earth’s magnetic field, but only about a 2% change in the total field,
since the change in Z, relative to its large magnitude, was small. We
noted above that magnetic activity observed at the ground increased
when the solar wind Z component (Figure 2) became negative. This
substorm took place while this was still true, and there was no obvious
change in the solar wind magnetic field at the time the substorm
started. This supports the concept that the energy release after storage
is often through an internal and possibly chaotic process not closely
linked to “triggers” in the solar wind. The details of triggering, or lack
thereof, are controversial and will not be further discussed here. We
now proceed to discuss the substorm that took place at 04:24 UT on
October 2, 2002 and was recorded by the meteor camera at Athabasca.
Figure 4 presents magnetic data from the Athabasca University
precision magnetometer. The most notable feature is the large decrease
(by about 1000 nT) of the X (northward) part of the magnetic field
at 04:24 UT on October 2, 2002. This is a substorm onset signature,
much as described above. The other components of the local magnetic
field at Athabasca were affected by this onset also. We note that that
the Z (vertically downward) component did not initially change at
the time of large X field change. This indicates that the initial electric
current associated with the auroral onset was overhead, since a current
directly overhead does not create a vertical magnetic field. A closer
examination shows smaller changes in the magnetic values in the
hour preceding the onset, and a pre-onset decrease in X starting at
04:12 UT. These are associated with the growth, or energy storage,
phase of the substorm. We now examine the visual light auroral
signatures of this substorm, and their relation to the magnetic changes.
The automated meteor camera system (described below) was set for
very high sensitivity on this date and captured many frames. Some
of these are shown here in Figure 5: all were placed together in sequence
to make a video clip of the auroral event, which was also useful in our
analysis.
In Figure 5, frame (a) shows pre-onset auroral activity. These
faint aurorae were recorded at 03:45:15 UT, during a depression in
the X magnetic component, known as a “bay.” The end of the bay is
visible in Figure 4 where the X component is initially rising (until
about 04:10 UT). Such a bay (the overall depression in this one was
about 200 nT) often accompanies dynamic but faint aurorae. The
next frame, taken at 04:00:18 UT, shows the situation after formation
of a single homogeneous arc in the south. The appearance of this arc
Figure 3 —Magnetic field at Yellowknife on October 1 and 2, 2002 (UT).
X is the geographic northward and horizontal part of the magnetic field, Y
the eastward and horizontal part, and Z the vertically downward part. At
this latitude Earth’s magnetic field is directed almost vertically downward,
so Z is much greater than X or Y and approaches the total field strength of
about 60,000 nT. Courtesy NRCan.
Figure 4 — Magnetic perturbations at Athabasca on October 2, 2002 (UT).
Components of the magnetic field are as in Figure 3 but in local magnetic
coordinates (in which a compass would point northward). The negative
change in the northward component starting at 4.4 UT (4:24) indicates the
onset of a magnetic substorm.
JRASCFebruary / février 2005 17
coincided with the magnetic bay starting to decrease in strength. In
the next frame (c), taken at 04:13:39 UT, the homogenous arc has
moved further south but become fainter. Aurora also is seen to the
north of the arc and is brighter in the east. The next frame (d), taken
at 04:25:46 UT, shows the initial brightening associated with the
expansive phase of this substorm. This brightening started up to two
minutes after the start of the steep decline in magnetic field marking
onset. Substorm timing is very controversial (Liou et al. 2002; Baker
et al. 2002) and plagued by “aliasing” effects, often due to images
being taken less frequently than the timescales in the events they are
meant to depict. In this case we can claim that the intelligent camera
actually caught the exact moment of the breakup arc. In the worst
case, we find that the breakup arc was not present in the previous
image, taken at 04:24:58 UT, while this image was taken at exactly
04:25:46 UT. Close examination of Figure 4 leads us to claim that the
magnetic onset was very close to 04:24:00 UT. Clocks for the camera
were set using Network Time Protocol (NTP), accurate to much better
than a second. Those for the magnetometer were set using continuous
Global Positioning System (GPS) monitoring, with even better precision.
Thus the observation of a difference in onset time is not likely due
to clock error.
The location of the breakup arc also tells a lot about the substorm
process. It is in the southeast. This indicates, first, that the auroral
activity was concentrated east of the meridian of Athabasca, a
conclusion supported by noting that magnetic stations to the east
recorded a longer-duration magnetic event. Indeed, this is expected,
since it is known that substorm onsets result from energy stored in
the magnetotail of Earth, and this region is overhead roughly at
midnight. This event took place in the late evening hours at Athabasca,
thus midnight would have been toward the east. A further implication
of the southerly location of the brightening, relative to Athabasca, is
that the initiation of onset was very close to Earth. Magnetic field
lines from Athabasca can be traced out into the magnetosphere and
get to be only about five Earth radii away. Thus the earliest stages of
this substorm expansion took place even closer to Earth than this.
The fifth selected frame, Figure 5(e), shows how the initial
brightened region has traveled westward, passing south of Athabasca.
This frame was exposed at 04:27:00 UT and many intervening frames
allow verification that the bright region moved smoothly westward.
This leads to identification with the “westward traveling surge”
(Marklund et al. 1998). That feature has been identified with strong
upward electric currents moving along magnetic field lines. The
evidence of this can be seen in the Y component negative perturbation
near this time in Figure 4. If a near-vertical, upward flowing electric
current is south of the magnetic detection station, a negative (westward)
perturbation is expected, as seen there. This frame also features a
new auroral arc system intruding from the east. This appears to be
associated with the northern border of the aurorae. Inspection of
intervening frames indicates that it moved smoothly northward. Such
expansion is typical of the “bulge” region of an auroral substorm
expansive phase as seen from satellite images (Liou et al. 2002), with
the direction of motion as expected when west of the main activity.
The satellite images are usually not spaced closely enough in time to
allow verification that the motion is smooth. While we cannot see
the entire picture with our limited field of view, our rapid exposure
rate allows us to see the smoothness of the motion, using frames not
shown here.
Frame (f) was taken only 30 seconds after frame (e), yet the
aurorae appear very different. The surge feature in the southwest has
dimmed and the southerly arcs are now in three distinct bands. A
possible new westward traveling surge is coming in from the east.
This is the brightest feature, and the motion-detection system has
drawn a box around it to indicate so. This very active time was also
that of the most extreme magnetic perturbation. The poleward border-
arc system has steadily yet rapidly moved northward, with some
westerly motion as well.
Another 40 seconds later, as shown in frame (g), there has again
been dramatic change in the auroral configuration. The magnetic
perturbations were already decreasing at this time, yet the southern
aurorae remained bright and active. An interesting feature is the bulge
in the rather distinct northern arc system. This may be identified as
a poleward border intensification (PBI), a relatively recently recognized
form of auroral activity. In this frame it is located slightly east of north.
Rostoker (2002) noted a tendency for PBIs to follow substorm onset.
The last frame (h) was exposed only another 20 seconds later, and
the PBI has now moved to west of north. Intervening frames (not
shown) allow us to know that the motion across the north was smooth.
A second PBI is apparent in the northeast. Figure 3 shows that
Yellowknife, 900 km north, had a similar magnetic X perturbation to
that observed at Athabasca, but at 04:30, several minutes later. Since
we have shown, and it is well known, that polar expansion takes place,
one might conclude that the same current system had moved north
and crossed over Yellowknife. This is known to happen (Connors
1998) but did not in this case. The auroral video, with its range of view
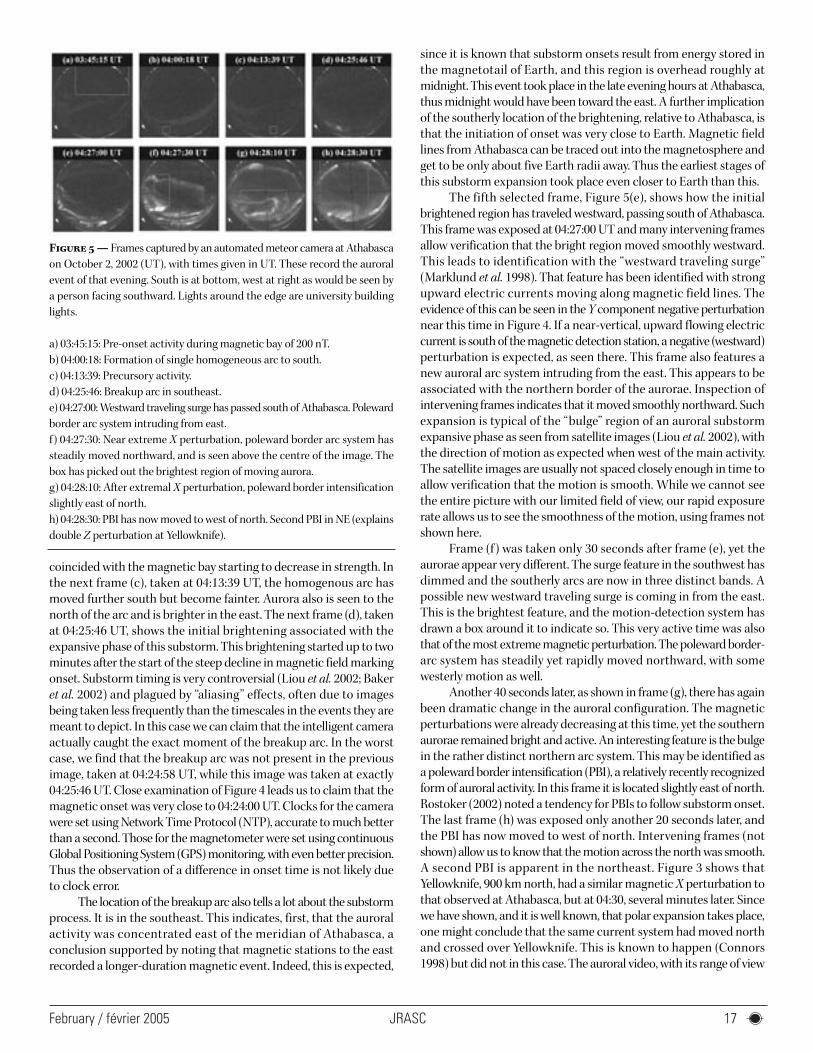
Figure 5 — Frames captured by an automated meteor camera at Athabasca
on October 2, 2002 (UT), with times given in UT. These record the auroral
event of that evening. South is at bottom, west at right as would be seen by
a person facing southward. Lights around the edge are university building
lights.
a) 03:45:15: Pre-onset activity during magnetic bay of 200 nT.
b) 04:00:18: Formation of single homogeneous arc to south.
c) 04:13:39: Precursory activity.
d) 04:25:46: Breakup arc in southeast.
e) 04:27:00: Westward traveling surge has passed south of Athabasca. Poleward
border arc system intruding from east.
f) 04:27:30: Near extreme X perturbation, poleward border arc system has
steadily moved northward, and is seen above the centre of the image. The
box has picked out the brightest region of moving aurora.
g) 04:28:10: After extremal X perturbation, poleward border intensification
slightly east of north.
h) 04:28:30: PBI has now moved to west of north. Second PBI in NE (explains
double Z perturbation at Yellowknife).
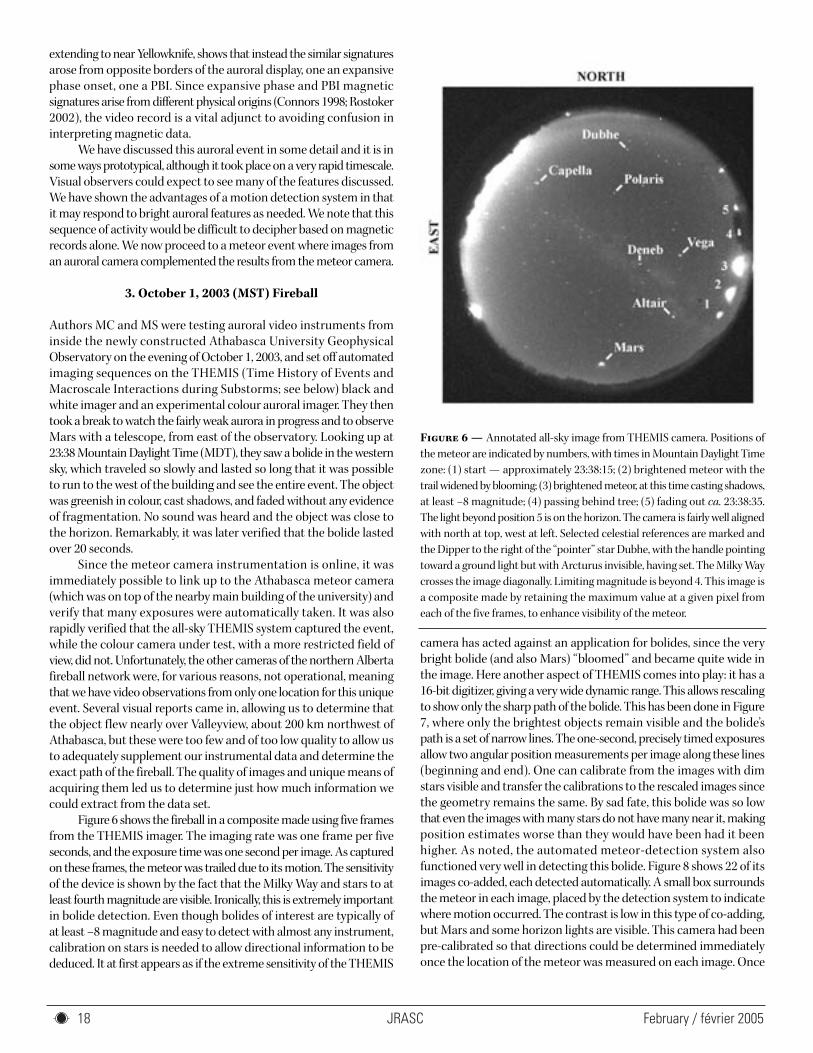
JRASC February / février 200518
extending to near Yellowknife, shows that instead the similar signatures
arose from opposite borders of the auroral display, one an expansive
phase onset, one a PBI. Since expansive phase and PBI magnetic
signatures arise from different physical origins (Connors 1998; Rostoker
2002), the video record is a vital adjunct to avoiding confusion in
interpreting magnetic data.
We have discussed this auroral event in some detail and it is in
some ways prototypical, although it took place on a very rapid timescale.
Visual observers could expect to see many of the features discussed.
We have shown the advantages of a motion detection system in that
it may respond to bright auroral features as needed. We note that this
sequence of activity would be difficult to decipher based on magnetic
records alone. We now proceed to a meteor event where images from
an auroral camera complemented the results from the meteor camera.
3. October 1, 2003 (MST) Fireball
Authors MC and MS were testing auroral video instruments from
inside the newly constructed Athabasca University Geophysical
Observatory on the evening of October 1, 2003, and set off automated
imaging sequences on the THEMIS (Time History of Events and
Macroscale Interactions during Substorms; see below) black and
white imager and an experimental colour auroral imager. They then
took a break to watch the fairly weak aurora in progress and to observe
Mars with a telescope, from east of the observatory. Looking up at
23:38 Mountain Daylight Time (MDT), they saw a bolide in the western
sky, which traveled so slowly and lasted so long that it was possible
to run to the west of the building and see the entire event. The object
was greenish in colour, cast shadows, and faded without any evidence
of fragmentation. No sound was heard and the object was close to
the horizon. Remarkably, it was later verified that the bolide lasted
over 20 seconds.
Since the meteor camera instrumentation is online, it was
immediately possible to link up to the Athabasca meteor camera
(which was on top of the nearby main building of the university) and
verify that many exposures were automatically taken. It was also
rapidly verified that the all-sky THEMIS system captured the event,
while the colour camera under test, with a more restricted field of
view, did not. Unfortunately, the other cameras of the northern Alberta
fireball network were, for various reasons, not operational, meaning
that we have video observations from only one location for this unique
event. Several visual reports came in, allowing us to determine that
the object flew nearly over Valleyview, about 200 km northwest of
Athabasca, but these were too few and of too low quality to allow us
to adequately supplement our instrumental data and determine the
exact path of the fireball. The quality of images and unique means of
acquiring them led us to determine just how much information we
could extract from the data set.
Figure 6 shows the fireball in a composite made using five frames
from the THEMIS imager. The imaging rate was one frame per five
seconds, and the exposure time was one second per image. As captured
on these frames, the meteor was trailed due to its motion. The sensitivity
of the device is shown by the fact that the Milky Way and stars to at
least fourth magnitude are visible. Ironically, this is extremely important
in bolide detection. Even though bolides of interest are typically of
at least –8 magnitude and easy to detect with almost any instrument,
calibration on stars is needed to allow directional information to be
deduced. It at first appears as if the extreme sensitivity of the THEMIS
camera has acted against an application for bolides, since the very
bright bolide (and also Mars) “bloomed” and became quite wide in
the image. Here another aspect of THEMIS comes into play: it has a
16-bit digitizer, giving a very wide dynamic range. This allows rescaling
to show only the sharp path of the bolide. This has been done in Figure
7, where only the brightest objects remain visible and the bolide’s
path is a set of narrow lines. The one-second, precisely timed exposures
allow two angular position measurements per image along these lines
(beginning and end). One can calibrate from the images with dim
stars visible and transfer the calibrations to the rescaled images since
the geometry remains the same. By sad fate, this bolide was so low
that even the images with many stars do not have many near it, making
position estimates worse than they would have been had it been
higher. As noted, the automated meteor-detection system also
functioned very well in detecting this bolide. Figure 8 shows 22 of its
images co-added, each detected automatically. A small box surrounds
the meteor in each image, placed by the detection system to indicate
where motion occurred. The contrast is low in this type of co-adding,
but Mars and some horizon lights are visible. This camera had been
pre-calibrated so that directions could be determined immediately
once the location of the meteor was measured on each image. Once
Figure 6 — Annotated all-sky image from THEMIS camera. Positions of
the meteor are indicated by numbers, with times in Mountain Daylight Time
zone: (1) start — approximately 23:38:15; (2) brightened meteor with the
trail widened by blooming; (3) brightened meteor, at this time casting shadows,
at least –8 magnitude; (4) passing behind tree; (5) fading out ca. 23:38:35.
The light beyond position 5 is on the horizon. The camera is fairly well aligned
with north at top, west at left. Selected celestial references are marked and
the Dipper to the right of the “pointer” star Dubhe, with the handle pointing
toward a ground light but with Arcturus invisible, having set. The Milky Way
crosses the image diagonally. Limiting magnitude is beyond 4. This image is
a composite made by retaining the maximum value at a given pixel from
each of the five frames, to enhance visibility of the meteor.
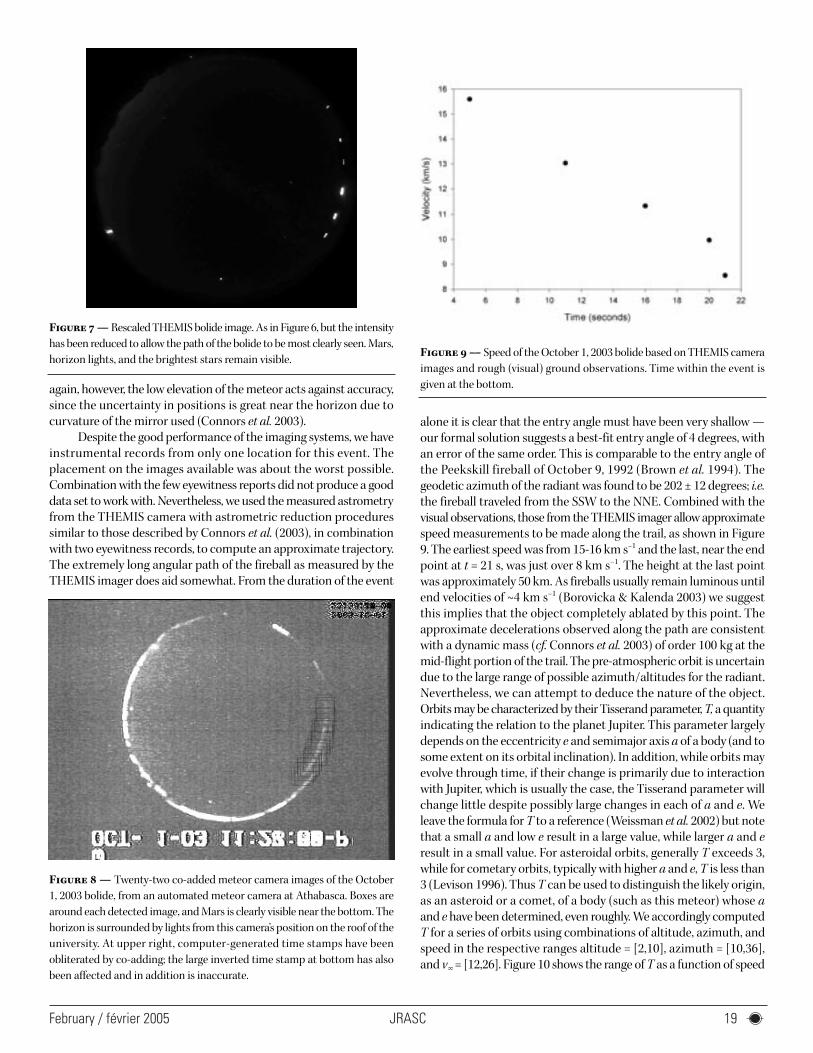
JRASCFebruary / février 2005 19
again, however, the low elevation of the meteor acts against accuracy,
since the uncertainty in positions is great near the horizon due to
curvature of the mirror used (Connors et al. 2003).
Despite the good performance of the imaging systems, we have
instrumental records from only one location for this event. The
placement on the images available was about the worst possible.
Combination with the few eyewitness reports did not produce a good
data set to work with. Nevertheless, we used the measured astrometry
from the THEMIS camera with astrometric reduction procedures
similar to those described by Connors et al. (2003), in combination
with two eyewitness records, to compute an approximate trajectory.
The extremely long angular path of the fireball as measured by the
THEMIS imager does aid somewhat. From the duration of the event
alone it is clear that the entry angle must have been very shallow —
our formal solution suggests a best-fit entry angle of 4 degrees, with
an error of the same order. This is comparable to the entry angle of
the Peekskill fireball of October 9, 1992 (Brown et al. 1994). The
geodetic azimuth of the radiant was found to be 202 ± 12 degrees; i.e.
the fireball traveled from the SSW to the NNE. Combined with the
visual observations, those from the THEMIS imager allow approximate
speed measurements to be made along the trail, as shown in Figure
9. The earliest speed was from 15-16 km s–1 and the last, near the end
point at t = 21 s, was just over 8 km s–1. The height at the last point
was approximately 50 km. As fireballs usually remain luminous until
end velocities of ~4 km s–1 (Borovicka & Kalenda 2003) we suggest
this implies that the object completely ablated by this point. The
approximate decelerations observed along the path are consistent
with a dynamic mass (cf. Connors et al. 2003) of order 100 kg at the
mid-flight portion of the trail. The pre-atmospheric orbit is uncertain
due to the large range of possible azimuth/altitudes for the radiant.
Nevertheless, we can attempt to deduce the nature of the object.
Orbits may be characterized by their Tisserand parameter, T, a quantity
indicating the relation to the planet Jupiter. This parameter largely
depends on the eccentricity e and semimajor axis a of a body (and to
some extent on its orbital inclination). In addition, while orbits may
evolve through time, if their change is primarily due to interaction
with Jupiter, which is usually the case, the Tisserand parameter will
change little despite possibly large changes in each of a and e. We
leave the formula for T to a reference (Weissman et al. 2002) but note
that a small a and low e result in a large value, while larger a and e
result in a small value. For asteroidal orbits, generally T exceeds 3,
while for cometary orbits, typically with higher a and e, T is less than
3 (Levison 1996). Thus T can be used to distinguish the likely origin,
as an asteroid or a comet, of a body (such as this meteor) whose a
and e have been determined, even roughly. We accordingly computed
T for a series of orbits using combinations of altitude, azimuth, and
speed in the respective ranges altitude = [2,10], azimuth = [10,36],
and v = [12,26]. Figure 10 shows the range of T as a function of speed
Figure 7 — Rescaled THEMIS bolide image. As in Figure 6, but the intensity
has been reduced to allow the path of the bolide to be most clearly seen. Mars,
horizon lights, and the brightest stars remain visible.
Figure 8 — Twenty-two co-added meteor camera images of the October
1, 2003 bolide, from an automated meteor camera at Athabasca. Boxes are
around each detected image, and Mars is clearly visible near the bottom. The
horizon is surrounded by lights from this camera’s position on the roof of the
university. At upper right, computer-generated time stamps have been
obliterated by co-adding; the large inverted time stamp at bottom has also
been affected and in addition is inaccurate.
Figure 9 — Speed of the October 1, 2003 bolide based on THEMIS camera
images and rough (visual) ground observations. Time within the event is
given at the bottom.
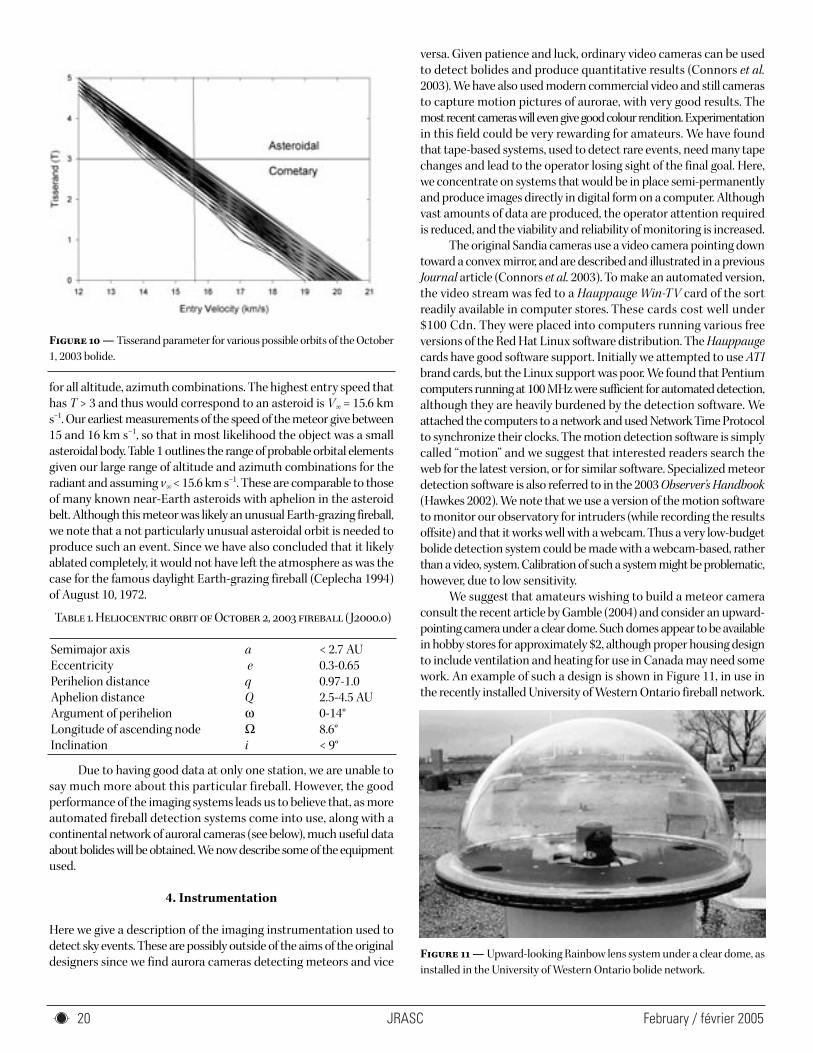
JRASC February / février 200520
for all altitude, azimuth combinations. The highest entry speed that
has T > 3 and thus would correspond to an asteroid is V = 15.6 km
s–1. Our earliest measurements of the speed of the meteor give between
15 and 16 km s–1, so that in most likelihood the object was a small
asteroidal body. Table 1 outlines the range of probable orbital elements
given our large range of altitude and azimuth combinations for the
radiant and assuming v < 15.6 km s–1. These are comparable to those
of many known near-Earth asteroids with aphelion in the asteroid
belt. Although this meteor was likely an unusual Earth-grazing fireball,
we note that a not particularly unusual asteroidal orbit is needed to
produce such an event. Since we have also concluded that it likely
ablated completely, it would not have left the atmosphere as was the
case for the famous daylight Earth-grazing fireball (Ceplecha 1994)
of August 10, 1972.
Due to having good data at only one station, we are unable to
say much more about this particular fireball. However, the good
performance of the imaging systems leads us to believe that, as more
automated fireball detection systems come into use, along with a
continental network of auroral cameras (see below), much useful data
about bolides will be obtained. We now describe some of the equipment
used.
4. Instrumentation
Here we give a description of the imaging instrumentation used to
detect sky events. These are possibly outside of the aims of the original
designers since we find aurora cameras detecting meteors and vice
versa. Given patience and luck, ordinary video cameras can be used
to detect bolides and produce quantitative results (Connors et al.
2003). We have also used modern commercial video and still cameras
to capture motion pictures of aurorae, with very good results. The
most recent cameras will even give good colour rendition. Experimentation
in this field could be very rewarding for amateurs. We have found
that tape-based systems, used to detect rare events, need many tape
changes and lead to the operator losing sight of the final goal. Here,
we concentrate on systems that would be in place semi-permanently
and produce images directly in digital form on a computer. Although
vast amounts of data are produced, the operator attention required
is reduced, and the viability and reliability of monitoring is increased.
The original Sandia cameras use a video camera pointing down
toward a convex mirror, and are described and illustrated in a previous
Journal article (Connors et al. 2003). To make an automated version,
the video stream was fed to a Hauppauge Win-TV card of the sort
readily available in computer stores. These cards cost well under
$100 Cdn. They were placed into computers running various free
versions of the Red Hat Linux software distribution. The Hauppauge
cards have good software support. Initially we attempted to use ATI
brand cards, but the Linux support was poor. We found that Pentium
computers running at 100 MHz were sufficient for automated detection,
although they are heavily burdened by the detection software. We
attached the computers to a network and used Network Time Protocol
to synchronize their clocks. The motion detection software is simply
called “motion” and we suggest that interested readers search the
web for the latest version, or for similar software. Specialized meteor
detection software is also referred to in the 2003 Observer’s Handbook
(Hawkes 2002). We note that we use a version of the motion software
to monitor our observatory for intruders (while recording the results
offsite) and that it works well with a webcam. Thus a very low-budget
bolide detection system could be made with a webcam-based, rather
than a video, system. Calibration of such a system might be problematic,
however, due to low sensitivity.
We suggest that amateurs wishing to build a meteor camera
consult the recent article by Gamble (2004) and consider an upward-
pointing camera under a clear dome. Such domes appear to be available
in hobby stores for approximately $2, although proper housing design
to include ventilation and heating for use in Canada may need some
work. An example of such a design is shown in Figure 11, in use in
the recently installed University of Western Ontario fireball network.
Table 1. Heliocentric orbit of October 2, 2003 fireball (J2000.0)
Semimajor axis a < 2.7 AU
Eccentricity e 0.3-0.65
Perihelion distance q 0.97-1.0
Aphelion distance Q 2.5-4.5 AU
Argument of perihelion ω 0-14°
Longitude of ascending node Ω 8.6°
Inclination i < 9°
Figure 10 — Tisserand parameter for various possible orbits of the October
1, 2003 bolide.
Figure 11 — Upward-looking Rainbow lens system under a clear dome, as
installed in the University of Western Ontario bolide network.
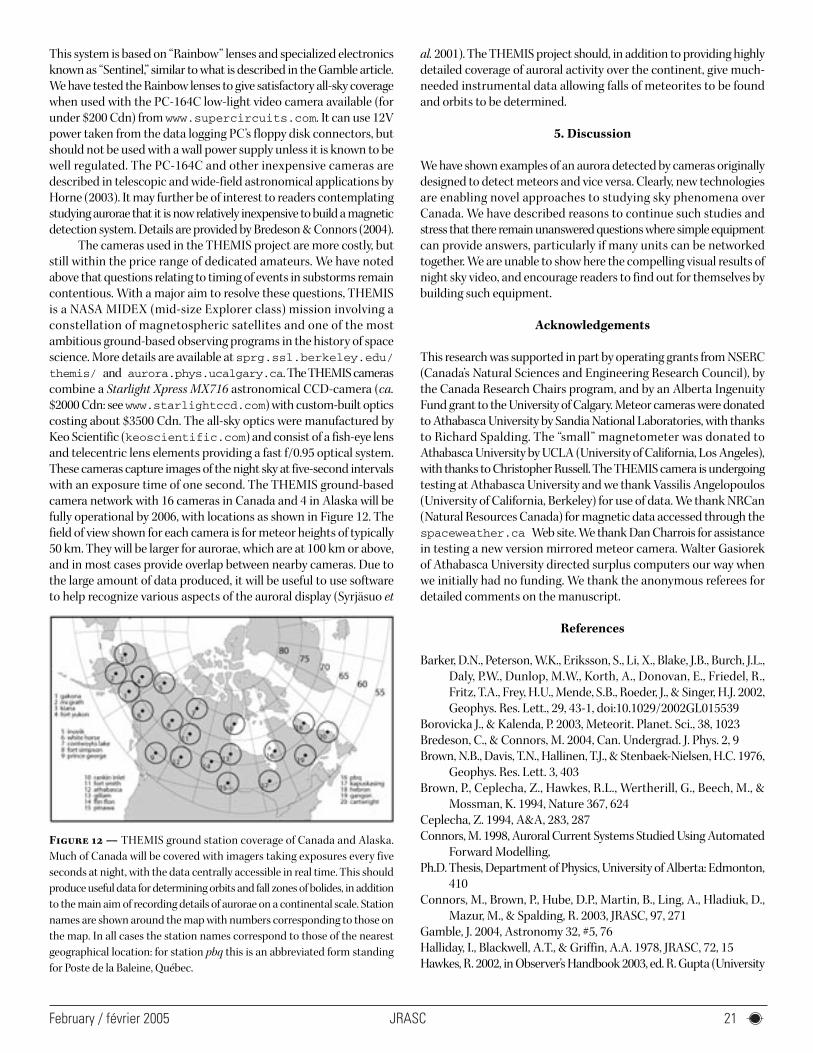
JRASCFebruary / février 2005 21
This system is based on “Rainbow” lenses and specialized electronics
known as “Sentinel,” similar to what is described in the Gamble article.
We have tested the Rainbow lenses to give satisfactory all-sky coverage
when used with the PC-164C low-light video camera available (for
under $200 Cdn) from www.supercircuits.com. It can use 12V
power taken from the data logging PC’s floppy disk connectors, but
should not be used with a wall power supply unless it is known to be
well regulated. The PC-164C and other inexpensive cameras are
described in telescopic and wide-field astronomical applications by
Horne (2003). It may further be of interest to readers contemplating
studying aurorae that it is now relatively inexpensive to build a magnetic
detection system. Details are provided by Bredeson & Connors (2004).
The cameras used in the THEMIS project are more costly, but
still within the price range of dedicated amateurs. We have noted
above that questions relating to timing of events in substorms remain
contentious. With a major aim to resolve these questions, THEMIS
is a NASA MIDEX (mid-size Explorer class) mission involving a
constellation of magnetospheric satellites and one of the most
ambitious ground-based observing programs in the history of space
science. More details are available at sprg.ssl.berkeley.edu/
themis/ and aurora.phys.ucalgary.ca. The THEMIS cameras
combine a Starlight Xpress MX716 astronomical CCD-camera (ca.
$2000 Cdn: see www.starlightccd.com) with custom-built optics
costing about $3500 Cdn. The all-sky optics were manufactured by
Keo Scientific (keoscientific.com) and consist of a fish-eye lens
and telecentric lens elements providing a fast f/0.95 optical system.
These cameras capture images of the night sky at five-second intervals
with an exposure time of one second. The THEMIS ground-based
camera network with 16 cameras in Canada and 4 in Alaska will be
fully operational by 2006, with locations as shown in Figure 12. The
field of view shown for each camera is for meteor heights of typically
50 km. They will be larger for aurorae, which are at 100 km or above,
and in most cases provide overlap between nearby cameras. Due to
the large amount of data produced, it will be useful to use software
to help recognize various aspects of the auroral display (Syrjäsuo et
al. 2001). The THEMIS project should, in addition to providing highly
detailed coverage of auroral activity over the continent, give much-
needed instrumental data allowing falls of meteorites to be found
and orbits to be determined.
5. Discussion
We have shown examples of an aurora detected by cameras originally
designed to detect meteors and vice versa. Clearly, new technologies
are enabling novel approaches to studying sky phenomena over
Canada. We have described reasons to continue such studies and
stress that there remain unanswered questions where simple equipment
can provide answers, particularly if many units can be networked
together. We are unable to show here the compelling visual results of
night sky video, and encourage readers to find out for themselves by
building such equipment.
Acknowledgements
This research was supported in part by operating grants from NSERC
(Canada’s Natural Sciences and Engineering Research Council), by
the Canada Research Chairs program, and by an Alberta Ingenuity
Fund grant to the University of Calgary. Meteor cameras were donated
to Athabasca University by Sandia National Laboratories, with thanks
to Richard Spalding. The “small” magnetometer was donated to
Athabasca University by UCLA (University of California, Los Angeles),
with thanks to Christopher Russell. The THEMIS camera is undergoing
testing at Athabasca University and we thank Vassilis Angelopoulos
(University of California, Berkeley) for use of data. We thank NRCan
(Natural Resources Canada) for magnetic data accessed through the
spaceweather.ca Web site. We thank Dan Charrois for assistance
in testing a new version mirrored meteor camera. Walter Gasiorek
of Athabasca University directed surplus computers our way when
we initially had no funding. We thank the anonymous referees for
detailed comments on the manuscript.
References
Barker, D.N., Peterson, W.K., Eriksson, S., Li, X., Blake, J.B., Burch, J.L.,
Daly, P.W., Dunlop, M.W., Korth, A., Donovan, E., Friedel, R.,
Fritz, T.A., Frey, H.U., Mende, S.B., Roeder, J., & Singer, H.J. 2002,
Geophys. Res. Lett., 29, 43-1, doi:10.1029/2002GL015539
Borovicka J., & Kalenda, P. 2003, Meteorit. Planet. Sci., 38, 1023
Bredeson, C., & Connors, M. 2004, Can. Undergrad. J. Phys. 2, 9
Brown, N.B., Davis, T.N., Hallinen, T.J., & Stenbaek-Nielsen, H.C. 1976,
Geophys. Res. Lett. 3, 403
Brown, P., Ceplecha, Z., Hawkes, R.L., Wertherill, G., Beech, M., &
Mossman, K. 1994, Nature 367, 624
Ceplecha, Z. 1994, A&A, 283, 287
Connors, M. 1998, Auroral Current Systems Studied Using Automated
Forward Modelling,
Ph.D. Thesis, Department of Physics, University of Alberta: Edmonton,
410
Connors, M., Brown, P., Hube, D.P., Martin, B., Ling, A., Hladiuk, D.,
Mazur, M., & Spalding, R. 2003, JRASC, 97, 271
Gamble, J. 2004, Astronomy 32, #5, 76
Halliday, I., Blackwell, A.T., & Griffin, A.A. 1978, JRASC, 72, 15
Hawkes, R. 2002, in Observer’s Handbook 2003, ed. R. Gupta (University
Figure 12 — THEMIS ground station coverage of Canada and Alaska.
Much of Canada will be covered with imagers taking exposures every five
seconds at night, with the data centrally accessible in real time. This should
produce useful data for determining orbits and fall zones of bolides, in addition
to the main aim of recording details of aurorae on a continental scale. Station
names are shown around the map with numbers corresponding to those on
the map. In all cases the station names correspond to those of the nearest
geographical location: for station pbq this is an abbreviated form standing
for Poste de la Baleine, Québec.
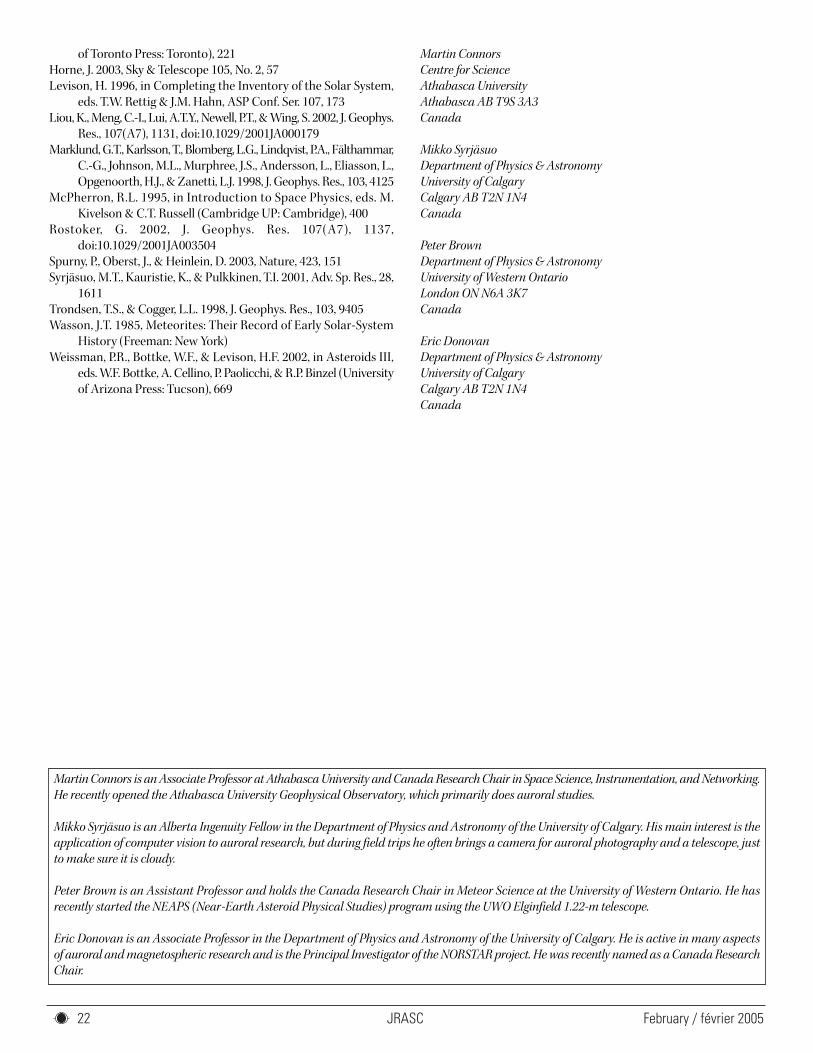
JRASC February / février 200522
of Toronto Press: Toronto), 221
Horne, J. 2003, Sky & Telescope 105, No. 2, 57
Levison, H. 1996, in Completing the Inventory of the Solar System,
eds. T.W. Rettig & J.M. Hahn, ASP Conf. Ser. 107, 173
Liou, K., Meng, C.-I., Lui, A.T.Y., Newell, P.T., & Wing, S. 2002, J. Geophys.
Res., 107(A7), 1131, doi:10.1029/2001JA000179
Marklund, G.T., Karlsson, T., Blomberg, L.G., Lindqvist, P.A., Fälthammar,
C.-G., Johnson, M.L., Murphree, J.S., Andersson, L., Eliasson, L.,
Opgenoorth, H.J., & Zanetti, L.J. 1998, J. Geophys. Res., 103, 4125
McPherron, R.L. 1995, in Introduction to Space Physics, eds. M.
Kivelson & C.T. Russell (Cambridge UP: Cambridge), 400
Rostoker, G. 2002, J. Geophys. Res. 107(A7), 1137,
doi:10.1029/2001JA003504
Spurny, P., Oberst, J., & Heinlein, D. 2003, Nature, 423, 151
Syrjäsuo, M.T., Kauristie, K., & Pulkkinen, T.I. 2001, Adv. Sp. Res., 28,
1611
Trondsen, T.S., & Cogger, L.L. 1998, J. Geophys. Res., 103, 9405
Wasson, J.T. 1985, Meteorites: Their Record of Early Solar-System
History (Freeman: New York)
Weissman, P.R., Bottke, W.F., & Levison, H.F. 2002, in Asteroids III,
eds. W.F. Bottke, A. Cellino, P. Paolicchi, & R.P. Binzel (University
of Arizona Press: Tucson), 669
Martin Connors
Centre for Science
Athabasca University
Athabasca AB T9S 3A3
Canada
Mikko Syrjäsuo
Department of Physics & Astronomy
University of Calgary
Calgary AB T2N 1N4
Canada
Peter Brown
Department of Physics & Astronomy
University of Western Ontario
London ON N6A 3K7
Canada
Eric Donovan
Department of Physics & Astronomy
University of Calgary
Calgary AB T2N 1N4
Canada
Martin Connors is an Associate Professor at Athabasca University and Canada Research Chair in Space Science, Instrumentation, and Networking.
He recently opened the Athabasca University Geophysical Observatory, which primarily does auroral studies.
Mikko Syrjäsuo is an Alberta Ingenuity Fellow in the Department of Physics and Astronomy of the University of Calgary. His main interest is the
application of computer vision to auroral research, but during field trips he often brings a camera for auroral photography and a telescope, just
to make sure it is cloudy.
Peter Brown is an Assistant Professor and holds the Canada Research Chair in Meteor Science at the University of Western Ontario. He has
recently started the NEAPS (Near-Earth Asteroid Physical Studies) program using the UWO Elginfield 1.22-m telescope.
Eric Donovan is an Associate Professor in the Department of Physics and Astronomy of the University of Calgary. He is active in many aspects
of auroral and magnetospheric research and is the Principal Investigator of the NORSTAR project. He was recently named as a Canada Research
Chair.
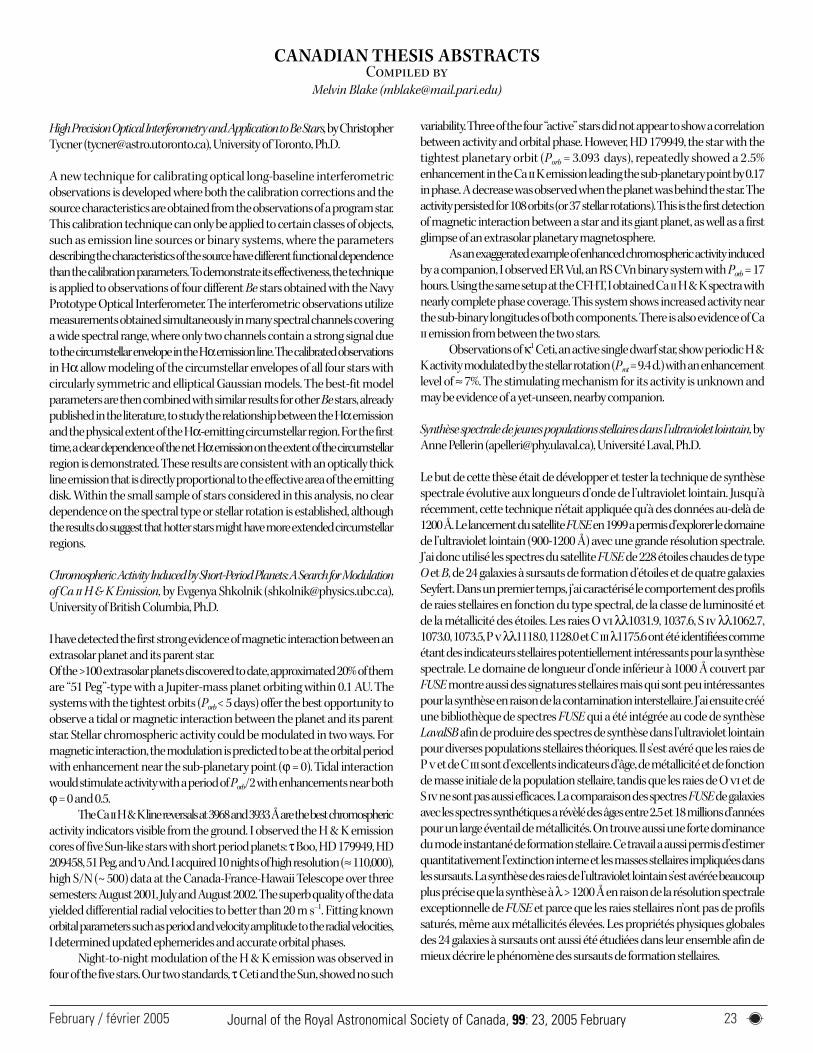
February / février 2005 23
High Precision Optical Interferometry and Application to Be Stars, by Christopher
Tycner ([email protected]), University of Toronto, Ph.D.
A new technique for calibrating optical long-baseline interferometric
observations is developed where both the calibration corrections and the
source characteristics are obtained from the observations of a program star.
This calibration technique can only be applied to certain classes of objects,
such as emission line sources or binary systems, where the parameters
describing the characteristics of the source have different functional dependence
than the calibration parameters. To demonstrate its effectiveness, the technique
is applied to observations of four different Be stars obtained with the Navy
Prototype Optical Interferometer. The interferometric observations utilize
measurements obtained simultaneously in many spectral channels covering
a wide spectral range, where only two channels contain a strong signal due
to the circumstellar envelope in the Hαemission line. The calibrated observations
in Hα allow modeling of the circumstellar envelopes of all four stars with
circularly symmetric and elliptical Gaussian models. The best-fit model
parameters are then combined with similar results for other Bestars, already
published in the literature, to study the relationship between the Hαemission
and the physical extent of the Hα-emitting circumstellar region. For the first
time, a clear dependence of the net Hαemission on the extent of the circumstellar
region is demonstrated. These results are consistent with an optically thick
line emission that is directly proportional to the effective area of the emitting
disk. Within the small sample of stars considered in this analysis, no clear
dependence on the spectral type or stellar rotation is established, although
the results do suggest that hotter stars might have more extended circumstellar
regions.
Chromospheric Activity Induced by Short-Period Planets: A Search for Modulation
of Ca ii H & K Emission, by Evgenya Shkolnik ([email protected]),
University of British Columbia, Ph.D.
I have detected the first strong evidence of magnetic interaction between an
extrasolar planet and its parent star.
Of the >100 extrasolar planets discovered to date, approximated 20% of them
are “51 Peg”-type with a Jupiter-mass planet orbiting within 0.1 AU. The
systems with the tightest orbits (Porb < 5 days) offer the best opportunity to
observe a tidal or magnetic interaction between the planet and its parent
star. Stellar chromospheric activity could be modulated in two ways. For
magnetic interaction, the modulation is predicted to be at the orbital period
with enhancement near the sub-planetary point (ϕ = 0). Tidal interaction
would stimulate activity with a period of Porb/2 with enhancements near both
ϕ = 0 and 0.5.
The Ca iiH & Kline reversals at 3968 and 3933 Å are the best chromospheric
activity indicators visible from the ground. I observed the H & K emission
cores of five Sun-like stars with short period planets: τBoo, HD 179949, HD
209458, 51 Peg, and υAnd. I acquired 10 nights of high resolution (≈110,000),
high S/N (~ 500) data at the Canada-France-Hawaii Telescope over three
semesters: August 2001, July and August 2002. The superb quality of the data
yielded differential radial velocities to better than 20 m s–1. Fitting known
orbital parameters such as period and velocity amplitude to the radial velocities,
I determined updated ephemerides and accurate orbital phases.
Night-to-night modulation of the H & K emission was observed in
four of the five stars. Our two standards, τ Ceti and the Sun, showed no such
CANADIAN THESIS ABSTRACTSCompiled by
Melvin Blake ([email protected])
variability. Three of the four “active” stars did not appear to show a correlation
between activity and orbital phase. However, HD 179949, the star with the
tightest planetary orbit (Porb = 3.093 days), repeatedly showed a 2.5%
enhancement in the Ca iiKemission leading the sub-planetary point by 0.17
in phase. Adecrease was observed when the planet was behind the star. The
activity persisted for 108 orbits (or 37 stellar rotations). This is the first detection
of magnetic interaction between a star and its giant planet, as well as a first
glimpse of an extrasolar planetary magnetosphere.
As an exaggerated example of enhanced chromospheric activity induced
by a companion, I observed ER Vul, an RS CVn binary system with Porb = 17
hours. Using the same setup at the CFHT, I obtained Ca ii H & Kspectra with
nearly complete phase coverage. This system shows increased activity near
the sub-binary longitudes of both components. There is also evidence of Ca
ii emission from between the two stars.
Observations of κ1 Ceti, an active single dwarf star, show periodic H &
Kactivity modulated by the stellar rotation (Prot = 9.4 d.) with an enhancement
level of ≈ 7%. The stimulating mechanism for its activity is unknown and
may be evidence of a yet-unseen, nearby companion.
Synthèse spectrale de jeunes populations stellaires dans l’ultraviolet lointain,by
Anne Pellerin ([email protected]), Université Laval, Ph.D.
Le but de cette thèse était de développer et tester la technique de synthèse
spectrale évolutive aux longueurs d’onde de l’ultraviolet lointain. Jusqu’à
récemment, cette technique n’était appliquée qu’à des données au-delà de
1200 Å. Le lancement du satellite FUSEen 1999 a permis d’explorer le domaine
de l’ultraviolet lointain (900-1200 Å) avec une grande résolution spectrale.
J’ai donc utilisé les spectres du satellite FUSE de 228 étoiles chaudes de type
O et B, de 24 galaxies à sursauts de formation d’étoiles et de quatre galaxies
Seyfert. Dans un premier temps, j’ai caractérisé le comportement des profils
de raies stellaires en fonction du type spectral, de la classe de luminosité et
de la métallicité des étoiles. Les raies O vi λλ1031.9, 1037.6, S iv λλ1062.7,
1073.0, 1073.5, P vλλ1118.0, 1128.0 et C iii λ1175.6 ont été identifiées comme
étant des indicateurs stellaires potentiellement intéressants pour la synthèse
spectrale. Le domaine de longueur d’onde inférieur à 1000 Å couvert par
FUSE montre aussi des signatures stellaires mais qui sont peu intéressantes
pour la synthèse en raison de la contamination interstellaire. J’ai ensuite créé
une bibliothèque de spectres FUSE qui a été intégrée au code de synthèse
LavalSB afin de produire des spectres de synthèse dans l’ultraviolet lointain
pour diverses populations stellaires théoriques. Il s’est avéré que les raies de
P vet de C iii sont d’excellents indicateurs d’âge, de métallicité et de fonction
de masse initiale de la population stellaire, tandis que les raies de O vi et de
S ivne sont pas aussi efficaces. La comparaison des spectres FUSEde galaxies
avec les spectres synthétiques a révèlé des âges entre 2.5 et 18 millions d’années
pour un large éventail de métallicités. On trouve aussi une forte dominance
du mode instantané de formation stellaire. Ce travail a aussi permis d’estimer
quantitativement l’extinction interne et les masses stellaires impliquées dans
les sursauts. La synthèse des raies de l’ultraviolet lointain s’est avérée beaucoup
plus précise que la synthèse à λ> 1200 Å en raison de la résolution spectrale
exceptionnelle de FUSE et parce que les raies stellaires n’ont pas de profils
saturés, même aux métallicités élevées. Les propriétés physiques globales
des 24 galaxies à sursauts ont aussi été étudiées dans leur ensemble afin de
mieux décrire le phénomène des sursauts de formation stellaires.
Journal of the Royal Astronomical Society of Canada, 99: 23, 2005 February
February / février 200524
Education NotesRubriques pédagogiques
Many of the creation myths and religious concepts of ancient Egypt
are related to the cycles of celestial objects. While there are few original
sources that describe the techniques or the observational results of
Egyptian astronomy, the Egyptians did follow a lunar calendar at
least as early as 3000 BC. From about 2800 BC onwards they also
made systematic use of a yearly cycle of 365 days. They carefully
monitored the heliacal rising of Sirius. They divided the night into 12
equal parts with “hours” that varied in length with the seasons.
The goal of this article is to investigate aspects of Egyptian
astronomy by combining the available archeological information
with a variety of computer simulations of the Egyptian sky in the
third millennium BC. If we could travel back in time and look over
the shoulder of an Egyptian priest as he made his observations, we
might be able to gain a better understanding of the fundamentals of
Egyptian astronomy. The article is divided into two parts. Part I
includes simulations to investigate Egyptian observations of the myth
of Nut and the rebirth of Ra, winter solstices, the beginning a lunar
month, and the 25-year lunar cycle. Part II includes simulations to
investigate characteristics of the heliacal rise of Sirius, and the use of
decans to mark the hours of the night.
Simulations and Ancient Astronomical Practices
Astronomical events can be accurately simulated with relative ease,
using low-cost planetarium programs such as Starry Night1 . With
such programs, complex mathematical calculations2 are carried out
automatically and results are displayed graphically. Simulations allow
you to view a virtual sky in any particular direction, at any particular
time, in any particular geographical location. In addition, simulations
of ancient astronomical events can:
• provide insights into the methods employed by ancient astronomers,
• provide useful data about the events that were observed,
• provide the ability to make sets of virtual observations that can
stretch over hundreds, or even thousands, of years.
A Brief Introduction to Ancient Egypt
Egyptian astronomy was closely tied to the religious and social life
of their civilization. A review of the basic characteristics of this
civilization provides a background for exploring their astronomical
EXPLORING THE ASTRONOMY OF ANCIENT EGYPT WITH
SIMULATIONS I: THE SUN, MOON, AND MILKY WAYby
William Dodd, Toronto Centre ([email protected])
techniques and observations.
The Egyptian civilization prospered from at least 3500 BC until
55 BC, when Egypt became a Roman province. The ancient Egyptians
created public monuments and temple complexes. They created
works of art and complex tomb structures. They recorded many of
their thoughts and actions in hieroglyphic script on papyrus scrolls.
Unfortunately, most of these works have been lost through the ravages
of time: decay and erosion, vandalism, religious and political cleansing,
and looting. Fortunately, Egypt’s dry climate has helped to preserve
some of these structures, artifacts, and scripts. Archeologists and
scholars have analyzed surviving material to construct political, social,
economic, and technological models of life in ancient Egypt.
The scripts and artifacts related directly to astronomy are scarce
and often fragmentary. Most of our knowledge of Egyptian astronomy
is derived from about two-dozen sources, as summarized by von
Bombhard (1999). The available evidence suggests that Egyptian
astronomical knowledge was based on relatively simple, but systematic
observations. Much of this knowledge was integrated into the social
and religious life of ancient Egypt.
The Geographical Setting
The Egyptian civilization flourished along the Nile River valley.
The Nile and its tributaries form one of the world’s longest river
systems. However, it is the last 1200 km, from the first cataract
at Aswan (24°N) to the Nile delta (31°N) that formed the heart
of ancient Egypt. In this region, the Nile f lows basically from
south to north. Annual floods of the Nile brought sediments from
the interior of Africa that left fertile mud flats for farming along
the valley and across the Nile delta. The surface of the Nile provided
a natural highway from one end of Egypt to the other. Prevailing
winds drove sailboats towards the south, while river currents
carried boats north again.
The annual flooding of the Nile was a major event in Egypt,
until the construction of the Aswan dam across the Nile in 1970.
Monsoon winds from the Atlantic swept across Africa in early
spring and deposited vast amounts of water in the mountains of
Ethiopia. This water collected in the headwaters of the Nile and
by midsummer floods began in the Nile valley. In a typical year,
the flood crested about eight metres above the low water mark
Journal of the Royal Astronomical Society of Canada, 99: 24 – 29, 2005 February
1Starry Night is a computer program produced by Imaginova Canada Ltd., www.starrynight.com. 2Such as those included in Astronomical Algorithms, by J. Meeus, 1991.
JRASCFebruary / février 2005 25
as it flowed by Cairo in late August. Typically, the flooding lasted
through September ( James 1979).
The Political Background
The economy of Egypt was based on agriculture and new wealth
gained through trading and conquest in Nubia to the south, and in
Palestine and Syria in the northeast. Pre-dynastic Egypt consisted of
the separate states of Upper Egypt (south) and Lower Egypt (north).
The earliest records suggest that Upper and Lower Egypt were first
united about 3050 BC under the rule of King Narmer. The politics
during the next 3000 years did not flow smoothly. There were palace
intrigues with new dynasties replacing the old approximately once
every 100 years. There were internal revolts and invasions from without.
However, a religious social class and the temple complexes they
administered were more stable, and many survived for thousands of
years, such as those at Aswan, Thebes, and Heliopolis.
The Religious Background
“…the world began as a watery chaos called Nun, from
which the Sun-god Ra emerged on a mound. By his own
power he engendered the twin deities Shu [air] and Tefnut
[moisture], who in turn bore Geb [earth] and Nut [sky].
Geb and Nut finally produced Osiris [god of the underworld],
Isis [wife of Osiris and mother of Horus] and Seth [brother
of Osiris and god of violence], and Nephthys [sister of Isis].
…the universe [is] represented as a figure of the air-god
Shu standing and supporting with his hands the out-
stretched body of the sky-goddess Nut, with Geb the earth-
god lying at his feet” (James 1979, p. 145)3.
The religious beliefs and practices of ancient Egypt were complex,
and varied from place to place, and from one era to another. The
following concepts were usually involved:
• a pantheon of gods led by Ra, the powerful Sun god, was represented
by celestial objects,
• cycles of birth and death were represented by the rising of celestial
objects in the east and the setting of celestial objects in the west,
• it was possible for mortal souls to join the gods among the stars,
• the gods followed a perilous nightly journey through the
underworld, or Duat, from the region of death at the western
horizon towards the region of rebirth at the eastern horizon.
Some Basic Concepts in Egyptian Astronomy
The association of celestial objects with gods, and the cyclic behaviour
of celestial objects, formed the basis for Egyptian astronomy.
• The Egyptians preferred to make observations on the eastern
horizon, the region of rebirth.
• The year was divided into three seasons based on the activity
of the Nile river: four months of inundation, four months of
planting and growth, and four months of harvest.
• Ancient calendars were based on the cycles of the Moon and
were used to determine the dates of important festivals and to
determine dates within a particular annual cycle. Historical
dates were defined by the number of the year in the reign of the
current Pharaoh.
• The heliacal rise4 of Sirius in July was an important annual event.
It marked the beginning of another cycle in the flooding of the
Nile.
Simulations with Starry Night
The specific procedures for using the Starry Night program to create
each of the following simulations are provided in the appendix.
Simulation I: Nut and the Birth of Ra
One of the oldest Egyptian myths describes the beginning of Nut’s
pregnancy at the vernal equinox and rebirth of Ra at the winter solstice.
Wells (1996) contends that this myth has an astronomical foundation.
Nut, the sky goddess, is associated with the Milky Way. At the vernal
equinox, the Egyptians would have seen Ra set in the west and as the
sky darkened, the mouth of Nut would be briefly visible before it
followed Ra over the horizon. The consumption of Ra would have
occurred below the horizon. Nine months later, near the winter solstice,
the figure of Nut rises feet-first in the east a few hours before dawn,
and as the Sun rises Ra is reborn. Wells also claims that this association
was most pronounced at about 4500 BC, suggesting that this may be
the date of origin for this myth.
The astronomical conditions related to this myth can be simulated
using the steps provided in Simulation I, in the appendix. After following
these steps, the western horizon is seen, just before sunset near the
date of the vernal equinox in 3000 BC. The Sun can be seen near the
intersection of the ecliptic and the celstial equator. The Milky Way
forms the body of Nut, and the constellation of Gemini marks her
mouth. At the vernal equinox her arms are stretched over her head
towards the western horizon.
In the Time Bar step [forward] 10 minutes at a time to observe
Ra setting in the west followed by the upturned mouth of Nut. Below
the horizon, according to the myth, Nut swallowed Ra and was thus
impregnated. To observe how this annual event changed over the
centuries reset the time to 6:50 p.m. and change the date first to April
18, 3500 BC; then to April 22, 4000 BC; and finally to April 26, 4500
BC. As you move to vernal equinoxes further back in time, the Sun
can be seen to move a little closer to Gemini just before sunset.
To view a simulation of the birth of Ra at a winter solstice shift
the date to January 6, 2999 BC; set the time to 6:50 a.m.; and in the
Button Bar switch the view to the East. Above the horizon at the left
of your screen the figure of Nut can be seen rising feet first. The
constellation of Cygnus marks the pelvic region. At the bottom right,
the Sun is just below the horizon. Step [forward] 10 minutes at a time.
The Egyptians would have seen the legs of Nut rising upward in the
eastern sky, and then fade as Ra rose above the horizon a little further
to the south.
To observe how the appearance of the celestial birth of Ra changed
over the centuries: reset the date first to January 6, 3500 BC; then to January
6, 4000 BC; and finally to January 6, 4500 BC. At earlier winter solstices
the legs of Nut can be seen to move to a more vertical position.
3The italics and contents of the square brackets have been added for clarification and emphasis.4The heliacal rising of a star is the annual date on which the star can first be seen again in the east, just before sunrise.
JRASC February / février 200526
Assuming, as Wells explains, that the Egyptians had a flexible
approach to the concept of insemination, then the Egyptian creation
myth can be represented by correlations between the positions of the
Milky Way and the Sun. The Egyptians saw Ra reborn in a yearly cycle,
as well as in the daily cycle of night and day. There is some indication
that the myth and astronomical events were more closely aligned at
dates earlier than 3000 BC. However, on the basis of these simulations
it would be difficult to assign a specific date for the origin of the myth.
Simulation II: Observing the Winter Solstice
In theory, determining the date of a winter solstice from horizon
measurements is a simple procedure. All you need is a fixed observation
post, a level wall facing east, and an assistant. To make an observation,
you ask your assistant to move a marker along the top of the wall
until it corresponds with the position of the rising Sun. When the day
arrives that the southernmost position of the marker has been reached,
you have determined the date of the winter solstice. The date of an
ancient Egyptian winter solstice can be determined in a similar manner
by observing the simulated sunrise on successive mornings.
Follow these steps to become familiar with the Sun’s annual
motion along the eastern horizon:
• Use the setup procedure outlined in Simulation II in the appendix.
• Play time [forward] in the Time Bar to observe a time-lapse
movie showing the rising Sun on successive days, on the eastern
horizon at Thebes during 3000 BC.
• Watch the movie through the equivalent of several years as the
Sun cycles from north to south, and back again. With the time
set at 6:00 a.m. each day, the Sun also cycles above the horizon
during the longer summer days and below the horizon during
the shorter winter days, as the Earth follows its elliptical orbit
around the Sun. Combining these two motions, the Sun’s position
traces out the shape of an analemma on the celestial sphere.
• Note also that the Sun rises due east about the time of the
equinoxes.
The date of an ancient winter solstice can be determined as follows:
• [Stop] the action as the Sun approaches its southernmost
position.
• From the Time Bar select Sunrise, point at the Sun, push [control],
and record the Sun’s azimuth.
• [Step forward] another day, select Sunrise and record the Sun’s
azimuth again.
• Repeat this process, day-by-day until the Sun’s azimuth reaches
a maximum value for that year.
For the year 3000 BC, this procedure leads to January 5 as the likely
date for the winter solstice.
Notice that near the date of the solstice, the azimuth angle of
the Sun changes less than 0.01° a day. An Egyptian priest might have
anticipated the date of the winter solstice and announced it on a
given day, but observationally the priest would have been unable to
confirm that the winter solstice had been reached until several days
after the event had occurred. Also notice that this is a YES/NO
observation; a priest would either declare that the Sun had risen at
its southernmost position on a given day, or that it had not. In the
above simulation, there is no attempt to determine the hour of the
day when the solstice was reached. If the Egyptians had counted the
number of days between successive winter solstices they could have
estimated the length of the year to be approximately 365 days. However,
since it is difficult to determine the precise day of a solstice with this
technique, there would have been some uncertainty associated with
this estimate.
Using horizon measurements to determine the date of a solstice
contains a systematic factor involving the latitude of the observer. At
the latitude of Luxor, 26°N, the date of a winter solstice obtained using
horizon measurements is about seven days earlier than the date of
the true solstice.
Pebble-in-a-Jar Technique
Counting the number of days between celestial events would have
required a procedure for recording dates and the counts of days. A
pebble-in-a-jar technique is proposed as one of the simplest possible
counting procedures. Using this technique, an Egyptian priest would
have placed a pebble in an empty jar on the day an event, such as a
winter solstice, was observed. A pebble would be added each day until
the next occurrence of the event. The jar would be labeled with a date
such as “year 5 in the reign of Cheop.” Counting the number of pebbles
in the jar would have provided a measure of the length of time between
the events. Saving the jar of pebbles would preserve the count for
future reference. If pebble-in-a-jar counts were continued for tens,
or even hundreds, of years, the results could be averaged to obtain a
more accurate estimate of the number of days between celestial events.
This type of averaging would be very effective since observing errors
would tend to cancel rather than accumulate over time.
Lunar Calendars
“Like all ancient peoples, the proto-dynastic Egyptians
used a lunar calendar, but unlike their neighbours they
began their lunar month, not with the first appearance of
the new crescent in the west at sunset, but rather with the
morning when the old crescent of the waning moon could
no longer be seen just before sunrise in the east” (Parker
1974, p. 52)
The lunar year consisted of 12 lunar months. Since 12 lunar months
average just 354 days, at two-or-three-year intervals an extra month
was inserted to keep the seasons and feasts in place. Evidence for this
type of calendar suggests that it was in use in Egypt before 3000 BC.
The Lunar Calendar in Upper Egypt
In Upper Egypt, the annual flood of the Nile was regarded as the most
vital natural event and the helical rising of Sirius was used to regulate
the insertion of the extra lunar month. The twelfth month was named
for the rising of Sirius. Whenever the heliacal rising of Sirius occurred
during the last 11 days of its month, an extra month was added to
the year. The cult centre for Sirius was on the island of Elephantine,
near the first cataract of the Nile at Aswan.
The Lunar Calendar in Lower Egypt
The ancient lunar calendar in Lower Egypt was keyed to the ceremony
celebrating the rebirth of Ra, at the winter solstice. The chief cult
JRASCFebruary / février 2005 27
centre for Ra was established at Heliopolis, just north of modern
Cairo. (Wells 1996, p. 34)
Simulation III: The Beginning of the Lunar Month
The Egyptians marked the beginning of the lunar month on the
morning when the old crescent of the waning moon could no longer
be seen in the east, just before sunrise. This moment might be considered
the beginning of the regular celestial union of the Sun and the Moon
before the start of the next lunar cycle.
The observational task of the Egyptians was straightforward:
“On this day, is the Moon observable before sunrise, or not?” Each
morning, the waning Moon moves closer to the Sun, has a narrower
crescent, and is more likely to be lost in the glare of the Sun. The
optimal condition for viewing the last remnant of the waning
Moon occurs when the Moon is just above the eastern horizon,
with the Sun just below the horizon. Morning civil twilight lasts
until the Sun is within 6° of the horizon (Observer’s Handbook
2004, p. 113). A typical celestial object needs to be at least 5°
above the horizon to be visible (Schafer 2000). A difference in
altitude of 11° between the Sun and the Moon corresponds to a
lunar illumination of about 2% and occurs about 1.5 days before
a new Moon. For the purpose of this simulation, the beginning
of a new lunar month is declared on the first morning that the
separation between the altitudes of the Sun and the waning Moon
falls below 11°. Since the Moon moves about 12° a day relative to
the Sun, this date can be clearly defined on most occasions.
Choosing an altitude-separation standard of 11° facilitates the
search for simulated dates for the beginning of Egyptian lunar
months. The only ambiguity occurs when the difference in altitudes
is close to 11° just before sunrise. If the actual Egyptian altitude-
separation standard was the equivalent of a few degrees larger
or smaller, then for ambiguous cases, their dates would have
tended to be one day earlier, or one day later.
Refer to the setup for Simulation III in the appendix. Check
the altitude5 of the Sun and Moon for January 27, 3000 BC at 8:20
a.m. Would a new lunar month begin on this day, the previous
day, or the next day? To answer that question, [Step forward] in
time until the Sun is just more than 6° below the horizon. If at
that moment the altitude of the Moon is more than 5°, then the
new lunar month has not yet begun. Continue to advance the
date by one day and repeat the altitude checks. In this case, the
Moon is just outside the 11° altitude-separation standard on
January 29, but is clearly inside it on January 30. In this simulation,
the new lunar month would have begun on January 30.
Skip ahead 28 days to February 27, 3000 BC and determine
the date for the beginning of the next lunar month. You may have
to step forward or backward a day or two. And you may have to
run Time [forward], or [backward], a few minutes until the Sun
is just more than 6° below the horizon.
The Egyptians could have estimated the average length of
the lunar cycle using the pebble-in-a-jar technique and then
averaged the results over a number of cycles. Again, any errors
would tend to cancel out rather than accumulate.
Simulation IV: The 25-Year Lunar Cycle
The Egyptians made systematic lunar observations over extended
periods of time and discovered an intriguing 25-year lunar cycle.
From modern observations it is known that one lunar cycle lasts
29.530,589 days (Observer’s Handbook 2004, p. 28). Multiplying, one
finds that 309 lunar cycles last 9124.952 days. If it is assumed that a
solar year has exactly 365 days, then 25 solar years consist of 9125.000
days. The difference between 309 lunar cycles and 25 solar cycles of
365 days is less than an hour and ten minutes. This means that every
25 years the Moon will be in the same phase, at the same time of day,
on the same day of the year, in the same part of the sky, with the same
stellar background!
One might think that extensive observations would be required
to detect such a cycle. However, the observations the Egyptians made
to detect the beginning of a new lunar month provided most of the
needed information. The last remnant of a waning Moon fixes the
phase, the moment before sunrise fixes the time of day, the eastern
horizon fixes the location in the sky. The only extra information
needed is the day of the year on which a new Moon occurs, within a
365-day calendar. There is clear evidence that the Egyptians used a
365-day calendar for civil functions (Depuydt 1997). The Egyptian
year also included a number of annual festivals. Suppose that during
one year a particular festival happened to occur on the same day as
a new Moon, and that this coincidence was recorded. The next year,
on the day of the same festival there would not be another new Moon.
Nor would there be the next year, nor the next year after that. But 25
years later, there would again be a new Moon on the same day as the
original festival. If records were kept for more than 25 years, then it
would have been possible for an astute ancient Egyptian archivist to
discover that a new Moon had also occurred on the same day in the
calendar, 25 years previously. With a little more research the archivist
would have discovered a 25-year cycle for new Moons at other festivals.
One can try to imagine the excitement that would have accompanied
this discovery of a new 25-year cycle, within the other celestial cycles
of the gods.
The setup for Simulation IV is provided in the appendix. The
date of January 30, 3000 BC has been chosen to display the beginning
of a new lunar month. Note that the Moon is in the constellation of
Aquarius. To test the reality of the 25-year cycle, advance the Julian
Day by 9125 days (from JD 625701.68055 to JD 634826.68055)6. After
this jump in time, note that the Sun and the Moon are still in essentially
the same positions. You can use the Forward and Back buttons at the
left of the Button Bar to cycle back and forth between these two dates.
The 25-year cycle is impressive, but not perfect. Each time that you
jump forward or backward 9125 days, the stellar background does
shift a few degrees.
Summary
The four simulations described above provide insights into possible
ancient astronomical practices. In Simulation I, the myth of Nut and
the annual rebirth of Ra was illustrated using the annual motion of
the Milky Way across the sky. The simulation can also be used to
5An accurate measure of the altitude of an object can be found by placing the cursor on the object, and pushing the [control] key. The difference in altitude
between two objects can be estimated using the angle separation cursor.60.68055 is the fraction of a day that corresponds to 7:20 a.m. in Egypt.
JRASC February / février 200528
examine Wells’ contention that this myth originated about 4500 BC.
Egyptian observations of solar and lunar cycles were probably based
on simple YES/NO observations. In Simulation II, the counting of
whole days between winter solstices, and the averaging of results over
several years, would have led to an estimate of 365 days for a solar
year. Simulations III and IV illustrate how Egyptian observations of
the new Moon, combined with records of feast days over several
decades, could have led to the discovery of a 25-year lunar cycle,
within a 365-day calendar system.
If you have access to a planetarium program such as Starry
Night, you are encouraged to work though these simulations. Take
your time. Repeat a simulation several times and experiment with
variations. Try to visualize yourself observing the crisp desert sky in
ancient Egypt while pondering the cycles within cycles that were
created at the beginning of time.
Part II includes simulations of the heliacal rise of Sirius, and of
measuring the hours of the night with the “decans.”
Appendix
The Starry Night Pro 5.0 program used in these simulations has many
options that let users customize its features. The options suggested
below have been selected to facilitate investigations of the astronomy
of ancient Egypt. Similar options can be implemented with other
planetarium programs. In Starry Night, the Tool Bar refers to the
uppermost horizontal tool bar. Just below that is the Time Bar. The
Button Bar is a third tool bar that can be displayed just under the
Time Bar. The Side Pane is a vertical set of option menus that can be
accessed down the left side of the screen.
General Settings for Simulations in Ancient Egypt
From the Tool Bar select:
• File > Preferences > Number Formats: Change all the positional
angles to dd.ddd° format to simplify the comparison of angle
sizes.
• File > Preferences > Cursor Tracking: Check Show info in upper
left and When the control key is down. These choices will minimize
unwanted pop-up information. If do you point at an object with
the cursor and at the same time push the [control] key, a listing
of that object’s properties are shown in the upper left of the screen.
This information includes the object’s altitude and azimuth.
View: Check Hide Horizon.
View > Alt/Az Guides > Options: Check Local equator (horizon line)
and set the colour to red. Check Background grid, set the colour
to pink and the Spacing to Medium (the altitude grid lines are
then 20° apart, starting at ± 10°).
View > Celestial Guides > Options: Check Celestial equator and set
the colour to green. Do not check any other items.
View > Ecliptic Guides > Options: Check The Ecliptic and set the
colour to blue. Do not check any other items.
View > Solar System: Check Planets-Moons.
View: Select Show Button Bar and then select E for East.
Options > Viewing Location > Latitude/Longitude: Set Latitude to
26°N, Longitude to 33°E, Time Zone to +3h, and DST off. Then
Add Location to List as Thebes, Egypt.
Options > Viewing Location > List: Select Thebes and push Set
Location.
From the Time Bar select:
• The Hand tool and use it to move the red horizon line so that
it is about a third of the way up the screen.
• Set the Time and Date to 6:00 a.m., January 1, 3000 BC.
• Set the Time Flow Rate to 1 minute.
Under File > Save as => Save all the above settings as ANCIENT EGYPT.
Simulation I: Nut and the Birth of the Sun
Open the file for ANCIENT EGYPT.
From the Tool Bar select:
• Options > Stars > Milky Way: Set the brightness to maximum
and select Visible Spectrum for a realistic portrayal of the Milky
Way. Selecting Molecular Hydrogen will make it easier to locate
the Milky Way, but the correlation with the figure of Nut is made
more obscure.
From the Button Bar select: Constellations.
In the Time Bar:
• Set the Time and Date to 6:50 p.m., April 15, 3000 BC (close to
the vernal equinox). Note that at the time of the equinox the
Sun is at the intersection of the green celestial equator and the
blue ecliptic plane.
• Set the Time Flow Rate to 10 minutes.
Simulation II: Observing the Winter Solstice
Open the file for ANCIENT EGYPT.
In the Time Bar set the Time Flow Rate to 1 day.
Simulation III: The Beginning of the Lunar Month
Open the file for ANCIENT EGYPT.
In the Tool Bar: View > Solar System: Select Planets-Moons.
In the Side Panel: Find: the Moon. This step labels the Moon and
makes the new Moon much easier to locate.
In the Time Bar:
• Set the Time and Date to January 27, 3000 BC at 7:00 a.m.
• Set the Time Flow Rate to 1 minute.
Use the Hand cursor to raise the horizon to about a third of the way
up from the bottom.
Simulation IV: The 25-Year Lunar Cycle
Repeat the setup for Simulation III, but set the Date to January 30,
3000 BC and from the Button Bar select: Constellations.
Note that at the right of the Time and Date window there is a
pop-up menu with an item Set Julian Day. Selecting this item allows
the user to change the Julian Day . Changing the Julian Day7 produces
corresponding changes in the Time and Date window.
7See the Observer’s Handbook 2004, p. 52, for a definition of Julian Dates.
JRASCFebruary / février 2005 29
References
Depuydt, L. 1997, Civil Calendar and Lunar Calendar in Ancient
Egypt, Uitgeverij Peeters en Departement Oosterse Studies
Leuven
James, T.G.H. 1979, An Introduction to Ancient Egypt (Harper and
Row: New York)
Parker, R.A. 1974, Phi. Trans. R. Soc. Lond. A, 276, 51
Schaefer, B.E. 2000, Journal for the History of Astronomy, 21, 149
Von Bomhard, A.S. 1999, The Egyptian Calendar — A Work for Eternity,
(Periplus: London)
Wells, R.A. 1996, Astronomy in Egypt, in Astronomy Before the
Telescope, ed. C. Walker (British Museum Press: London)
William Dodd has a M.Sc. in astronomy and a D.Ed. in computer applications. He is a retired mathematics teacher with a particular interest
in the fundamental and historical aspects of astronomy.
JRASC February / février 2005 30
Across the RASCdu nouveau dans les Centres
National Council Meetings & RASC
Happenings
A New Year, and new beginnings! I trust
that everyone got all their astronomical
presents they asked for and if not, well
there is always next year!
Since our last exchange in news, we
have had one National Council meeting
on October 30, 2004 in Toronto. At this
meeting it was announced that Ms. Heide
Debond, National Recorder, was stepping
down from this position. At the meeting,
Mr. Peter Jedicke, (President) thanked
Ms. Debond for all the hard work she has
done for the Society and wished her well
for all her future endeavours. A round of
applause was given for her.
Ms. Debond also wrote a note to the
members of Council and thanked them
all for letting her have the opportunity
to work with a great group of astronomers
and friends.
The Nominating Committee has
asked that anyone who wishes to take on
the job of National Recorder contact them.
There is also a job description located on
the Society Web site in the Private section.
The Society presently finds itself in
a significant deficit situation, and there
is no simple solution to this problem that
will restore long-term financial health,
but also allow the Society to undertake
worthwhile initiatives that support its
mandate. It is not the intent that the
Finance Committee takes over the usual
responsibilities of other Society Committees,
but that this committee will consult
extensively with the appropriate
Committees.
A new Special Committee, called
Task Force 21, was formed from Motion
NC04402 for the purpose to study, to
develop, and to propose options for
Council's consideration to help to ensure
the long-term financial security of the
Society given the reality of the current
annual deficit; taking the Society's current
revenue model into account, suggest
changes to improve the Society's financial
outlook including ways to give Council
the flexibility to fund projects and initiatives
in addition to services to individual
members, including (but not limited to)
the following:
• Study and propose ways to reduce
the cost of delivering current member
services.
• Study the cost/benefit of delivering
more member services via the Internet.
• Study ways to market our current
products and publications better.
• Investigate new sources of on-going
revenue.
• Study and, if necessary, propose
changes to make the Society's
governance model more effective.
The committee is comprised of: the
President (Chair), Chairs (or committee
member designated by the Chair of each
Committee) of Constitution, Education,
Finance, Information Technology,
Membership and Promotion, Observing,
and Publications Committees, members
of Executive Committee, three others
appointed by Council, and two others
appointed by the committee. Its mandate
will be for one year, and extended by
Council, if need be. For more information
on this issue, please go to
www.rasc.ca/membersonly.htm.
We have another National Council
meeting coming up on February 26, 2005
again in Toronto. All reports for the
meeting will be placed on the National
Web site, www.rasc.ca in the Private
members’ section for you to read on the
Society’s affairs.
International Astronomy Day is
coming up in April where Centres celebrate
with mall displays and public events. The
International Astronomy Week is from
April 11-17; for more information visit,
www.rasc.ca/ctivities.htm or
contact Bruce McCurdy, the RASC
Ast ronomy Day Co ordinator, at
Our next big event will be the 2005
General Assembly being held on May
20-23, 2005 weekend. It will be held in
beautiful Kelowna, British Columbia,
and hosted by the Okanagan Centre.
You can be kept up to date by visiting
www.ocrasc.ca/ga.html. If you have
never been to a General Assembly, it
is a wonderful way to meet fellow
members, talk astronomy, learn about
the National Society itself, and take in
the local sights of the area.
Sad News
On a sad note, the Executive and
members of the RASC wish to extend
to Mr. James Edgar (publications
proofreader, and Regina Centre Member)
our sympathies on the loss of his mother
in late November 2004.
Society News/Nouvelles de la sociétéby Kim Hay, National Secretary ([email protected])
JRASCFebruary / février 2005 31
Here is an extreme example of that
sagging-scope feeling. My first
telescope was a refractor with a
one-inch non-achromatic f/30 objective
lens (I kid you not) that I bought at the
age of 14 from an ad in a comic book.
There were five telescoping cardboard
tubes — the refractor looked like a
cartoonist’s idea of a telescope! The
cardboard tubes sagged in an arc, so I
fastened wooden rods to the 30-inch long
tube to stiffen it. (I should have become
a urologist.) Despite the extreme focal
ratio, there was still a lot of false colour
with that single lens f/30 objective, so I
wrote back to the US comicbook ad and
included my hard-earned $8 or $10 for
the optional achromatic objective “for
those who demand exceptional
performance.”
With my new 1-inch f/30 achromatic
objective, my stiffened tube, and the single
eyepiece provided (25× according to my
logbook) the scope worked pretty well on
the Moon, revealing many, many lunar
craters and mountains. (Old Galileo would
have died from envy to have had such a
fine scope!!) But balancing a 30-inch long
tube on the porch railing didn’t work very
well for the planets (Saturn was only
elliptical at 25× when the planet dashed
through the shaking tube’s small field of
view) and I was vaguely aware that even-
more-expensive telescopes than mine had
mountings to hold them steady. So one
afternoon I independently invented the
alt-azimuth mount, with a clamp to hold
it to the porch railing. The handmade
mount worked pretty well except that
when the straight-through refractor was
aimed too high, my head was on the porch
floor. Even for an enthusiastic 14-year-
old who had just discovered the Universe,
that position cramped my style, not to
mention my neck.
Do you remember those solid ditch-
crossings that driveways used to have,
made out of 8 × 8 timbers? I spiked a 2 ×4 to the crossing’s timbers and clamped
my handmade alt-azimuth mount to the
top of the 2 × 4. The whole apparatus took
only a couple of afternoons of trial and
error to perfect. Decades later I had a
strong sense of deja vu when I saw a
photograph of the mount that a teenage
Leslie Peltier had crafted for his first scope,
“The Strawberry Refractor.” (I have never
understood why the owners of department
store scopes on shaky mounts don’t just
fix the problems, instead of giving up so
easily.) With my new rock-solid mount
(dampened by a ton of driveway gravel!)
the 1-inch showed me Saturn’s ring
(singular) and one Jovian belt at 25×.
Captivated, I sketched the changing
positions of Jupiter’s Galilean moons
nightly for a year or more. The 1-inch
refractor found Uranus and shortly
afterwards I saw Uranus with the unaided
eye from my first dark site, an Albert
County, New Brunswick maple sugar camp
that I worked at over Easter vacation (free
in exchange for unlimited sampling of the
maple products).
The 1-inch found Vesta, Ceres, and
a sunspot, unfiltered on the setting Sun.
(Don’t try that at home! The after-image
was a tad bright and long-lasting and I
tried solar projection the next day.) That
first scope split seventeen double stars
(the closest being beautiful gamma
Andromedae and gamma Delphini), and
revealed four open clusters, one globular
(M13 of course), one nebula (the Great
Orion Nebula), and one galaxy (M31). Its
field of view was too tiny to show M33,
but I did see the Triangulum Galaxy with
my Dad’s simple 4× field glasses.
After six months of observing with
the 1-inch refractor, aperture fever struck
when I happened upon the Moncton public
library’s copy of Sky & Telescope magazine
and drooled over the Unitron ads. The
Unitron on the back cover of Sky & Telescope
that Johnny’s parents bought him to keep
him away from the television was way
beyond a young Canadian paper-boy’s
yearly income, but I began purchasing an
alt-azimuth mounted 60-mm Tasco
refractor that was featured in a little one-
eighth page ad. This was on the lay-away
plan, so every couple of months I would
mail my paper-route earnings off to a
friendly lady in San Diego and each time
she would write me a short but encouraging
note acknowledging receipt of my funds
and advising the size of the ever-decreasing
balance (not that I didn’t know the sum
to a penny) that stood between me and
The Cure for Aperture Fever.
A 60-mm f/12 Tasco achromatic
refractor was a quality telescope in 1962
(after I added a sock full of weights to the
front end of the tube to balance it properly).
The new trophies now mounted quickly
in my logbook.
In the fall of 1963 Jupiter’s disk reached
50 in diameter at that perihelic opposition.
The area of Jupiter’s disk in October 1963
was about 125 percent of the area that
Jupiter’s disk will reach at its mediocre
opposition this year. I was now 17 years
old, was the only serious amateur
astronomer in New Brunswick as far as I
knew, and I had my prized 60-mm
achromat. There were no larger telescopes
available to me to observe with.
All of the authorities (Sky & Telescope,
the Observer’s Handbook, etc) said that at
Greybeard Nostalgia: That Sagging-scope Feelingby Alan Whitman ([email protected])
JRASC February / février 2005 32
least a 3-inch refractor was needed to see
shadow transits of the Jovian moons. I
didn’t have a 3-inch refractor, nor did I
know anyone who owned such a wonderful
scope. I did have a good 2.4-inch refractor
that had split mis-matched alpha Piscium
at 2.0˝, almost at Dawe’s Limit, and split
Castor, then near periastron and at only
1.9˝, right at Dawe’s Limit. And I had read
that the 1963 opposition of Jupiter was
the closest for many decades to come.
There were probably an unusual
number of nights of superb seeing that
autumn in Atlantic Canada. (I don’t know
because my logbook back then just recorded
what I saw, not the seeing and transparency.)
Anyways, my 60-mm Tasco refractor at
117× showed Ganymede’s shadow in transit
on Oct 5/63 and Nov 17/63, Io’s shadow
in transit on Oct 18/63 and Nov 19/63
(the latter event was seen without
foreknowledge), and even Europa’s small
shadow on Dec 2/63 and also at the next
opposition on Jan 28/65.
On Oct 18/63 I followed Io as it
approached Jupiter and could still see Io
as a bright point against Jupiter’s dark
limb for several minutes after transit
ingress. My logbook was full of doubt
about this observation because the
authorities of the day said that a 4-inch
refractor was needed to see Jovian satellites
in transit. But, of course, none of these
adult experts had ever seriously observed
Jupiter with a 2.4-inch refractor at a perihelic
opposition — why would they waste a
superb night doing that since they owned
4-inch and larger refractors? I didn’t have
access to a larger scope, but I was an
experienced observer by the fall of 1963.
When Io’s shadow followed Io that
night I could see the shadow in transit at
55× in addition to 117×. Detail on Jupiter
was the NPR, NEBn, NEBs, STB, and SPR.
(The SEB was not visible in my scope that
autumn — the planet was dominated by
an unusually wide NEB, which was doubled
in some longitudes, and the NEB had
darker patches within it on some nights.)
At the next opposition in 1964-65 I
was seeing bays and projections on the
equatorward-side of the NEB and SEB
with the little refractor. The Great Red
Spot was much more obvious in those
years than it is today, although in appeared
brown instead of red in the 60-mm scope.
In 1964, when I reported my
observations of shadow transits with a
2.4-inch refractor during the recent perihelic
opposition of Jupiter to the editor of the
Observer’s Handbook, I was ignored. The
Handbook continued to say that a 3-inch
refractor was needed.
In the early or mid-’80s I reported
my 1963 observations to the Handbook’s
editor again and this time the section on
Jupiter was amended to say something
wishy-washy like “some observers have
reported seeing shadow transits with a
60-mm refractor.”
About 1996 I wrote Roy Bishop, then-
editor of the Observer’s Handbook. The
Handbook was then finally revised to say
“The tiny black shadow can be particularly
evident if it is cast on one of the bright
zones of Jupiter. This phenomenon
sometimes is evident in a good 60-mm
refractor under good seeing conditions.”
(The quote is from the 1997 Handbook.)
Perehelic oppositions effectively
increase your telescope’s aperture. Combine
that with an upgrade from a “comic book
scope” to a “department store scope” and
my Tasco earned a place in my heart,
perhaps enhanced by its sad ending in a
little flood (just deep enough to drown
my loyal observing companion) in a
Vancouver basement apartment a few
years later.
Forty years on, Alan Whitman is convinced
that a 1-metre scope would cure his
aperture fever.
now i feel better:it turns out thateven einstein didn’t understand einstein,!
see, i told youuncle ernie’s brainproves that black
holes exist!
awesome!
ANOTHER S
IDE O
F R
ELATIVITY
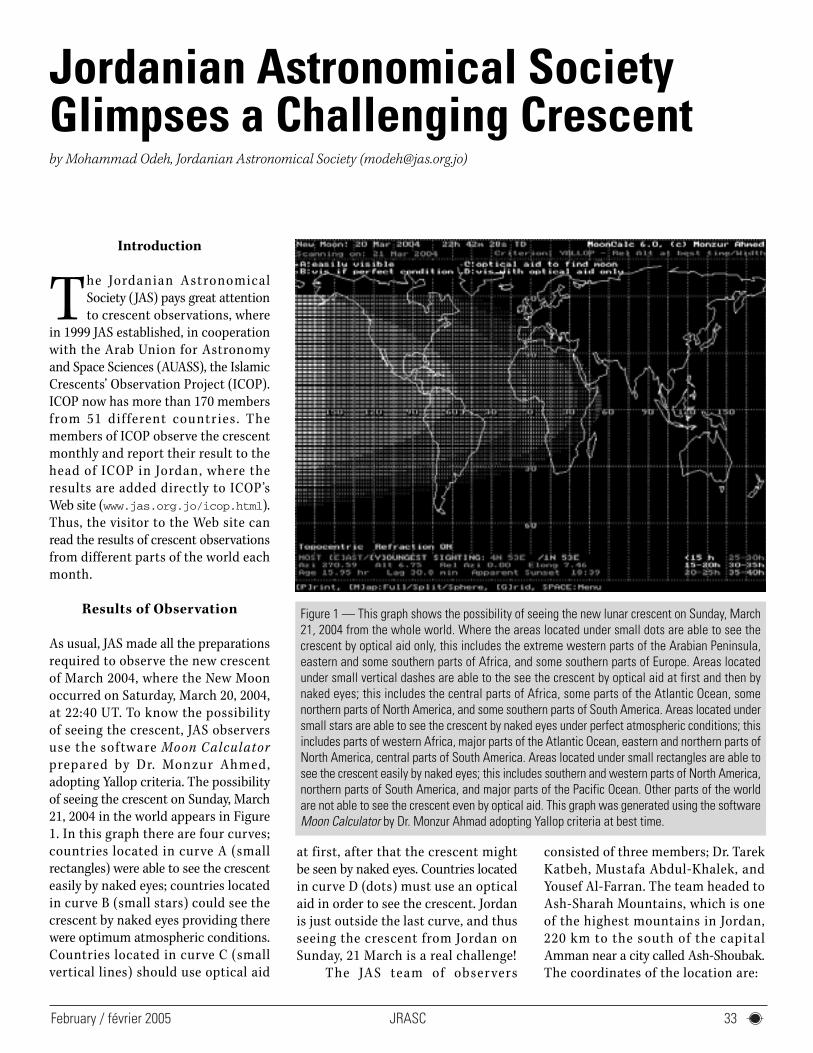
JRASCFebruary / février 2005 33
Introduction
The Jordanian Astronomical
Society (JAS) pays great attention
to crescent observations, where
in 1999 JAS established, in cooperation
with the Arab Union for Astronomy
and Space Sciences (AUASS), the Islamic
Crescents’ Observation Project (ICOP).
ICOP now has more than 170 members
from 51 different countries. The
members of ICOP observe the crescent
monthly and report their result to the
head of ICOP in Jordan, where the
results are added directly to ICOP’s
Web site (www.jas.org.jo/icop.html).
Thus, the visitor to the Web site can
read the results of crescent observations
from different parts of the world each
month.
Results of Observation
As usual, JAS made all the preparations
required to observe the new crescent
of March 2004, where the New Moon
occurred on Saturday, March 20, 2004,
at 22:40 UT. To know the possibility
of seeing the crescent, JAS observers
use the software Moon Calculator
prepared by Dr. Monzur Ahmed,
adopting Yallop criteria. The possibility
of seeing the crescent on Sunday, March
21, 2004 in the world appears in Figure
1. In this graph there are four curves;
countries located in curve A (small
rectangles) were able to see the crescent
easily by naked eyes; countries located
in curve B (small stars) could see the
crescent by naked eyes providing there
were optimum atmospheric conditions.
Countries located in curve C (small
vertical lines) should use optical aid
at first, after that the crescent might
be seen by naked eyes. Countries located
in curve D (dots) must use an optical
aid in order to see the crescent. Jordan
is just outside the last curve, and thus
seeing the crescent from Jordan on
Sunday, 21 March is a real challenge!
The JAS team of obser vers
consisted of three members; Dr. Tarek
Katbeh, Mustafa Abdul-Khalek, and
Yousef Al-Farran. The team headed to
Ash-Sharah Mountains, which is one
of the highest mountains in Jordan,
220 km to the south of the capital
Amman near a city called Ash-Shoubak.
The coordinates of the location are:
Figure 1 — This graph shows the possibility of seeing the new lunar crescent on Sunday, March21, 2004 from the whole world. Where the areas located under small dots are able to see thecrescent by optical aid only, this includes the extreme western parts of the Arabian Peninsula,eastern and some southern parts of Africa, and some southern parts of Europe. Areas locatedunder small vertical dashes are able to the see the crescent by optical aid at first and then bynaked eyes; this includes the central parts of Africa, some parts of the Atlantic Ocean, somenorthern parts of North America, and some southern parts of South America. Areas located undersmall stars are able to see the crescent by naked eyes under perfect atmospheric conditions; thisincludes parts of western Africa, major parts of the Atlantic Ocean, eastern and northern parts ofNorth America, central parts of South America. Areas located under small rectangles are able tosee the crescent easily by naked eyes; this includes southern and western parts of North America,northern parts of South America, and major parts of the Pacific Ocean. Other parts of the worldare not able to see the crescent even by optical aid. This graph was generated using the softwareMoon Calculator by Dr. Monzur Ahmad adopting Yallop criteria at best time.
Jordanian Astronomical SocietyGlimpses a Challenging Crescentby Mohammad Odeh, Jordanian Astronomical Society ([email protected])
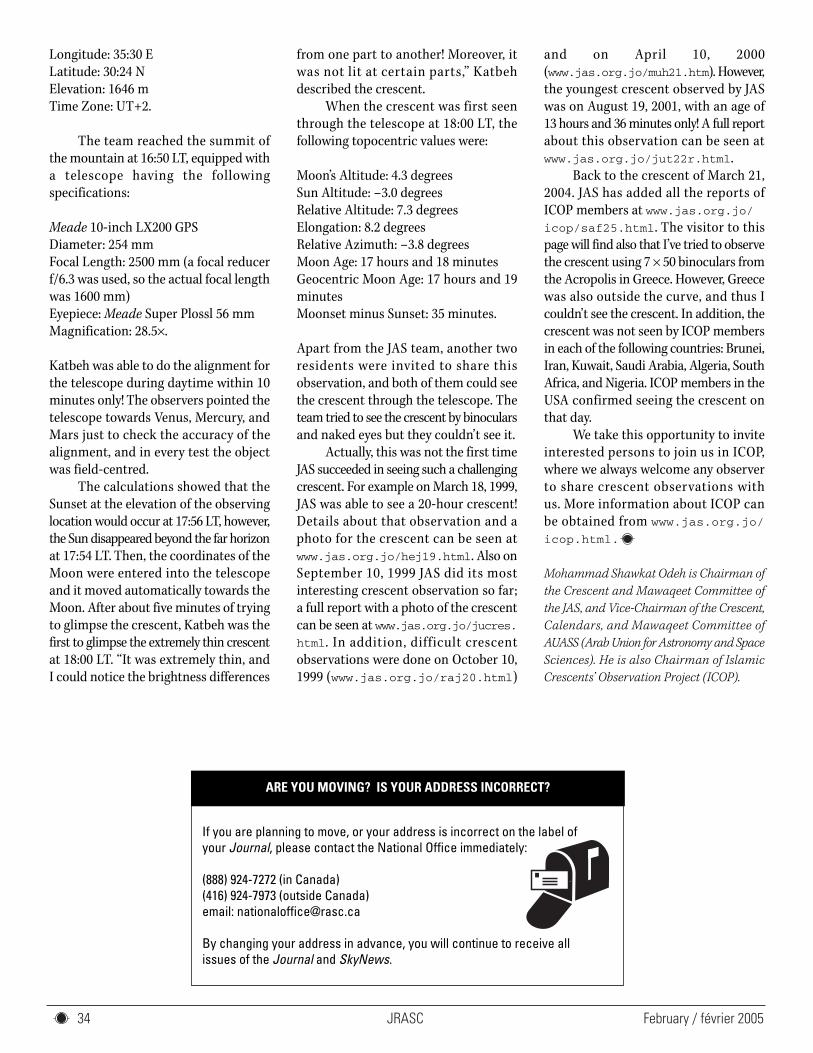
JRASC February / février 2005 34
Longitude: 35:30 E
Latitude: 30:24 N
Elevation: 1646 m
Time Zone: UT+2.
The team reached the summit of
the mountain at 16:50 LT, equipped with
a telescope having the following
specifications:
Meade 10-inch LX200 GPS
Diameter: 254 mm
Focal Length: 2500 mm (a focal reducer
f/6.3 was used, so the actual focal length
was 1600 mm)
Eyepiece: Meade Super Plossl 56 mm
Magnification: 28.5×.
Katbeh was able to do the alignment for
the telescope during daytime within 10
minutes only! The observers pointed the
telescope towards Venus, Mercury, and
Mars just to check the accuracy of the
alignment, and in every test the object
was field-centred.
The calculations showed that the
Sunset at the elevation of the observing
location would occur at 17:56 LT, however,
the Sun disappeared beyond the far horizon
at 17:54 LT. Then, the coordinates of the
Moon were entered into the telescope
and it moved automatically towards the
Moon. After about five minutes of trying
to glimpse the crescent, Katbeh was the
first to glimpse the extremely thin crescent
at 18:00 LT. “It was extremely thin, and
I could notice the brightness differences
from one part to another! Moreover, it
was not lit at certain parts,” Katbeh
described the crescent.
When the crescent was first seen
through the telescope at 18:00 LT, the
following topocentric values were:
Moon’s Altitude: 4.3 degrees
Sun Altitude: –3.0 degrees
Relative Altitude: 7.3 degrees
Elongation: 8.2 degrees
Relative Azimuth: –3.8 degrees
Moon Age: 17 hours and 18 minutes
Geocentric Moon Age: 17 hours and 19
minutes
Moonset minus Sunset: 35 minutes.
Apart from the JAS team, another two
residents were invited to share this
observation, and both of them could see
the crescent through the telescope. The
team tried to see the crescent by binoculars
and naked eyes but they couldn’t see it.
Actually, this was not the first time
JAS succeeded in seeing such a challenging
crescent. For example on March 18, 1999,
JAS was able to see a 20-hour crescent!
Details about that observation and a
photo for the crescent can be seen at
www.jas.org.jo/hej19.html. Also on
September 10, 1999 JAS did its most
interesting crescent observation so far;
a full report with a photo of the crescent
can be seen at www.jas.org.jo/jucres.
html. In addition, difficult crescent
observations were done on October 10,
1999 (www.jas.org.jo/raj20.html)
and on April 10, 2000
(www.jas.org.jo/muh21.htm). However,
the youngest crescent observed by JAS
was on August 19, 2001, with an age of
13 hours and 36 minutes only! A full report
about this observation can be seen at
www.jas.org.jo/jut22r.html.
Back to the crescent of March 21,
2004. JAS has added all the reports of
ICOP members at www.jas.org.jo/
icop/saf25.html. The visitor to this
page will find also that I’ve tried to observe
the crescent using 7 × 50 binoculars from
the Acropolis in Greece. However, Greece
was also outside the curve, and thus I
couldn’t see the crescent. In addition, the
crescent was not seen by ICOP members
in each of the following countries: Brunei,
Iran, Kuwait, Saudi Arabia, Algeria, South
Africa, and Nigeria. ICOP members in the
USA confirmed seeing the crescent on
that day.
We take this opportunity to invite
interested persons to join us in ICOP,
where we always welcome any observer
to share crescent observations with
us. More information about ICOP can
be obtained from www.jas.org.jo/
icop.html.
Mohammad Shawkat Odeh is Chairman of
the Crescent and Mawaqeet Committee of
the JAS, and Vice-Chairman of the Crescent,
Calendars, and Mawaqeet Committee of
AUASS (Arab Union for Astronomy and Space
Sciences). He is also Chairman of Islamic
Crescents’ Observation Project (ICOP).
If you are planning to move, or your address is incorrect on the label ofyour Journal, please contact the National Office immediately:
(888) 924-7272 (in Canada)(416) 924-7973 (outside Canada)email: [email protected]
By changing your address in advance, you will continue to receive allissues of the Journal and SkyNews.
ARE YOU MOVING? IS YOUR ADDRESS INCORRECT?
JRASCFebruary / février 2005 35
Karma police
Arrest this man
He talks in maths
He buzzes like a fridge
He’s like a detuned radio
Radiohead — Karma Police
I told you they were out to get me.
I’m not being paranoid (this time);
they actually were out to get me. The story
from my perspective began in late 2001,
with a phone call from Dave Cleary, then
a rising star in the Edmonton Centre
executive and our most, uh, visible radio
astronomy buff. Dave’s brainchild, the
Sky Scan Science Awareness Project, was
a plan to share this under-appreciated
branch of our science with a much broader
audience. He had already assembled a
volunteer steering committee (see Figure
1), obtained seed money of $5000 from
the RASC Edmonton Centre, arranged
program and infrastructure sponsorship
from the University of Alberta’s Department
of Physics, and acquired a small three-
year grant from the Natural Science and
Research Council of Canada (NSERC).
The next step was to hire a part-time
educator to actively spread the word. The
committee wanted somebody with an
astronomy and public education
background who was available to do
contract work, and for better or worse I
was their first choice. The school-year
project would nicely complement my
summer contract at Odyssium Observatory,
and I was happy to take on the new
challenge of talking radiohead.
After some research on where to focus
our limited resources, we soon found an
excellent fit between what we could deliver
and the requirements of the new Grade 9
science curriculum. Inspired by the Pan
Canadian Science Project and introduced
in the fall of 2002, the new curriculum has
as its general theme “Science, Technology,
& Society” (Dodd 2002). A key upgrade
was a new unit called Space Exploration,
a long-overdue second astronomy unit
being introduced into the Alberta
curriculum, and one with considerably
more teeth than the existing Grade Six
Sky Science unit. One of its components
is astronomy across the electromagnetic
spectrum. Indeed, the cover of one of the
new textbooks features the Parkes Radio
Observatory in Australia, recently
immortalized by the movie “The Dish.”
If astronomy can be a difficult subject
to teach because it’s not “hands-on,” radio
astronomy is doubly so because it’s not
even “eyes-on.” At our initial workshops
and in-services, we quickly found that
many Science 9 teachers were apprehensive
about presenting this unit due to negligible
personal expertise in these areas. So we
in Sky Scan resolved to present them with
a helpful resource. Given the precarious
state of school finances in supposedly
rich Alberta, this had to be offered at no
cost.
Our approach was to provide
participating schools with a low-tech
radio observatory, capable of making
Orbital Oddities
Sky Scanby Bruce McCurdy, Edmonton Centre ([email protected])
Figure 1 — Sky Scan key personnel. Although formally at arm’s length from the Society, the projectrelies heavily on RASC members. Here from L to R, Dave Cleary, Project Leader; Robert Rolf,Technical Adviser; Dr. Doug Hube, Science Advisor; Bruce McCurdy, Education DevelopmentCoordinator. Steering committee members not shown include Sid Shugarman, Science Consultantto Edmonton Public School Board, and Guy Almberg, Antenna Guy.
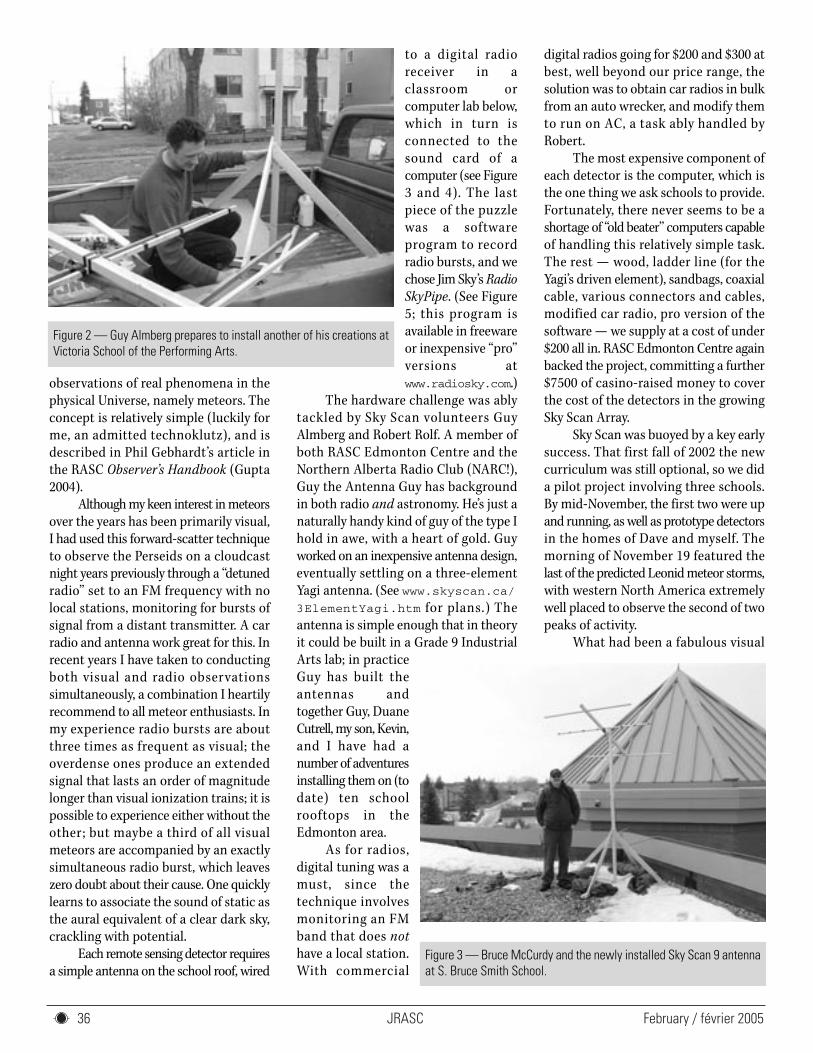
JRASC February / février 2005 36
observations of real phenomena in the
physical Universe, namely meteors. The
concept is relatively simple (luckily for
me, an admitted technoklutz), and is
described in Phil Gebhardt’s article in
the RASC Observer’s Handbook (Gupta
2004).
Although my keen interest in meteors
over the years has been primarily visual,
I had used this forward-scatter technique
to observe the Perseids on a cloudcast
night years previously through a “detuned
radio” set to an FM frequency with no
local stations, monitoring for bursts of
signal from a distant transmitter. A car
radio and antenna work great for this. In
recent years I have taken to conducting
both visual and radio observations
simultaneously, a combination I heartily
recommend to all meteor enthusiasts. In
my experience radio bursts are about
three times as frequent as visual; the
overdense ones produce an extended
signal that lasts an order of magnitude
longer than visual ionization trains; it is
possible to experience either without the
other; but maybe a third of all visual
meteors are accompanied by an exactly
simultaneous radio burst, which leaves
zero doubt about their cause. One quickly
learns to associate the sound of static as
the aural equivalent of a clear dark sky,
crackling with potential.
Each remote sensing detector requires
a simple antenna on the school roof, wired
to a digital radio
receiver in a
classroom or
computer lab below,
which in turn is
connected to the
sound card of a
computer (see Figure
3 and 4). The last
piece of the puzzle
was a software
program to record
radio bursts, and we
chose Jim Sky’s Radio
SkyPipe. (See Figure
5; this program is
available in freeware
or inexpensive “pro”
versions at
www.radiosky.com.)
The hardware challenge was ably
tackled by Sky Scan volunteers Guy
Almberg and Robert Rolf. A member of
both RASC Edmonton Centre and the
Northern Alberta Radio Club (NARC!),
Guy the Antenna Guy has background
in both radio and astronomy. He’s just a
naturally handy kind of guy of the type I
hold in awe, with a heart of gold. Guy
worked on an inexpensive antenna design,
eventually settling on a three-element
Yagi antenna. (See www.skyscan.ca/
3ElementYagi.htm for plans.) The
antenna is simple enough that in theory
it could be built in a Grade 9 Industrial
Arts lab; in practice
Guy has built the
antennas and
together Guy, Duane
Cutrell, my son, Kevin,
and I have had a
number of adventures
installing them on (to
date) ten school
rooftops in the
Edmonton area.
As for radios,
digital tuning was a
must, since the
technique involves
monitoring an FM
band that does not
have a local station.
With commercial
digital radios going for $200 and $300 at
best, well beyond our price range, the
solution was to obtain car radios in bulk
from an auto wrecker, and modify them
to run on AC, a task ably handled by
Robert.
The most expensive component of
each detector is the computer, which is
the one thing we ask schools to provide.
Fortunately, there never seems to be a
shortage of “old beater” computers capable
of handling this relatively simple task.
The rest — wood, ladder line (for the
Yagi’s driven element), sandbags, coaxial
cable, various connectors and cables,
modified car radio, pro version of the
software — we supply at a cost of under
$200 all in. RASC Edmonton Centre again
backed the project, committing a further
$7500 of casino-raised money to cover
the cost of the detectors in the growing
Sky Scan Array.
Sky Scan was buoyed by a key early
success. That first fall of 2002 the new
curriculum was still optional, so we did
a pilot project involving three schools.
By mid-November, the first two were up
and running, as well as prototype detectors
in the homes of Dave and myself. The
morning of November 19 featured the
last of the predicted Leonid meteor storms,
with western North America extremely
well placed to observe the second of two
peaks of activity.
What had been a fabulous visual
Figure 2 — Guy Almberg prepares to install another of his creations atVictoria School of the Performing Arts.
Figure 3 — Bruce McCurdy and the newly installed Sky Scan 9 antennaat S. Bruce Smith School.
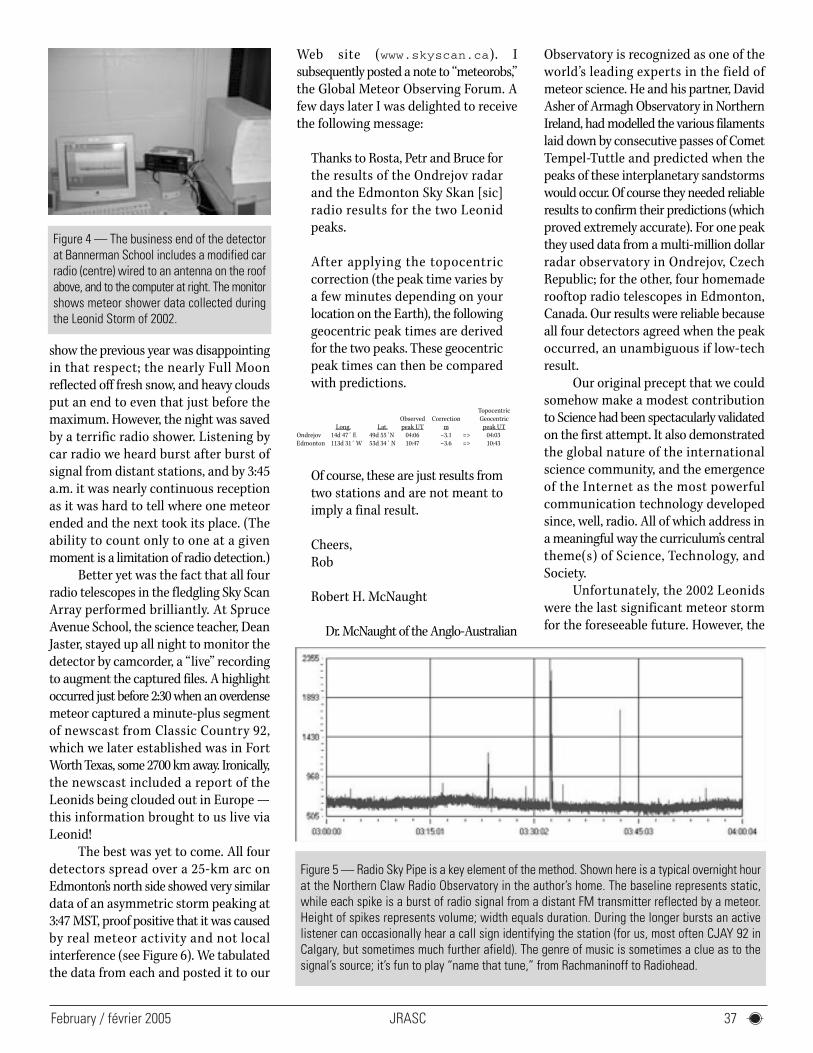
JRASCFebruary / février 2005 37
show the previous year was disappointing
in that respect; the nearly Full Moon
reflected off fresh snow, and heavy clouds
put an end to even that just before the
maximum. However, the night was saved
by a terrific radio shower. Listening by
car radio we heard burst after burst of
signal from distant stations, and by 3:45
a.m. it was nearly continuous reception
as it was hard to tell where one meteor
ended and the next took its place. (The
ability to count only to one at a given
moment is a limitation of radio detection.)
Better yet was the fact that all four
radio telescopes in the fledgling Sky Scan
Array performed brilliantly. At Spruce
Avenue School, the science teacher, Dean
Jaster, stayed up all night to monitor the
detector by camcorder, a “live” recording
to augment the captured files. A highlight
occurred just before 2:30 when an overdense
meteor captured a minute-plus segment
of newscast from Classic Country 92,
which we later established was in Fort
Worth Texas, some 2700 km away. Ironically,
the newscast included a report of the
Leonids being clouded out in Europe —
this information brought to us live via
Leonid!
The best was yet to come. All four
detectors spread over a 25-km arc on
Edmonton’s north side showed very similar
data of an asymmetric storm peaking at
3:47 MST, proof positive that it was caused
by real meteor activity and not local
interference (see Figure 6). We tabulated
the data from each and posted it to our
Web site (www.skyscan.ca). I
subsequently posted a note to “meteorobs,”
the Global Meteor Observing Forum. A
few days later I was delighted to receive
the following message:
Thanks to Rosta, Petr and Bruce for
the results of the Ondrejov radar
and the Edmonton Sky Skan [sic]
radio results for the two Leonid
peaks.
After applying the topocentric
correction (the peak time varies by
a few minutes depending on your
location on the Earth), the following
geocentric peak times are derived
for the two peaks. These geocentric
peak times can then be compared
with predictions.
Topocentric
Observed Correction Geocentric
Long. Lat. peak UT m peak UT
Ondrejov 14d 47´ E 49d 55´N 04:06 –3.1 => 04:03
Edmonton 113d 31´ W 53d 34´ N 10:47 –3.6 => 10:43
Of course, these are just results from
two stations and are not meant to
imply a final result.
Cheers,
Rob
Robert H. McNaught
Dr. McNaught of the Anglo-Australian
Observatory is recognized as one of the
world’s leading experts in the field of
meteor science. He and his partner, David
Asher of Armagh Observatory in Northern
Ireland, had modelled the various filaments
laid down by consecutive passes of Comet
Tempel-Tuttle and predicted when the
peaks of these interplanetary sandstorms
would occur. Of course they needed reliable
results to confirm their predictions (which
proved extremely accurate). For one peak
they used data from a multi-million dollar
radar observatory in Ondrejov, Czech
Republic; for the other, four homemade
rooftop radio telescopes in Edmonton,
Canada. Our results were reliable because
all four detectors agreed when the peak
occurred, an unambiguous if low-tech
result.
Our original precept that we could
somehow make a modest contribution
to Science had been spectacularly validated
on the first attempt. It also demonstrated
the global nature of the international
science community, and the emergence
of the Internet as the most powerful
communication technology developed
since, well, radio. All of which address in
a meaningful way the curriculum’s central
theme(s) of Science, Technology, and
Society.
Unfortunately, the 2002 Leonids
were the last significant meteor storm
for the foreseeable future. However, the
Figure 4 — The business end of the detectorat Bannerman School includes a modified carradio (centre) wired to an antenna on the roofabove, and to the computer at right. The monitorshows meteor shower data collected duringthe Leonid Storm of 2002.
Figure 5 — Radio Sky Pipe is a key element of the method. Shown here is a typical overnight hourat the Northern Claw Radio Observatory in the author’s home. The baseline represents static,while each spike is a burst of radio signal from a distant FM transmitter reflected by a meteor.Height of spikes represents volume; width equals duration. During the longer bursts an activelistener can occasionally hear a call sign identifying the station (for us, most often CJAY 92 inCalgary, but sometimes much further afield). The genre of music is sometimes a clue as to thesignal’s source; it’s fun to play “name that tune,” from Rachmaninoff to Radiohead.
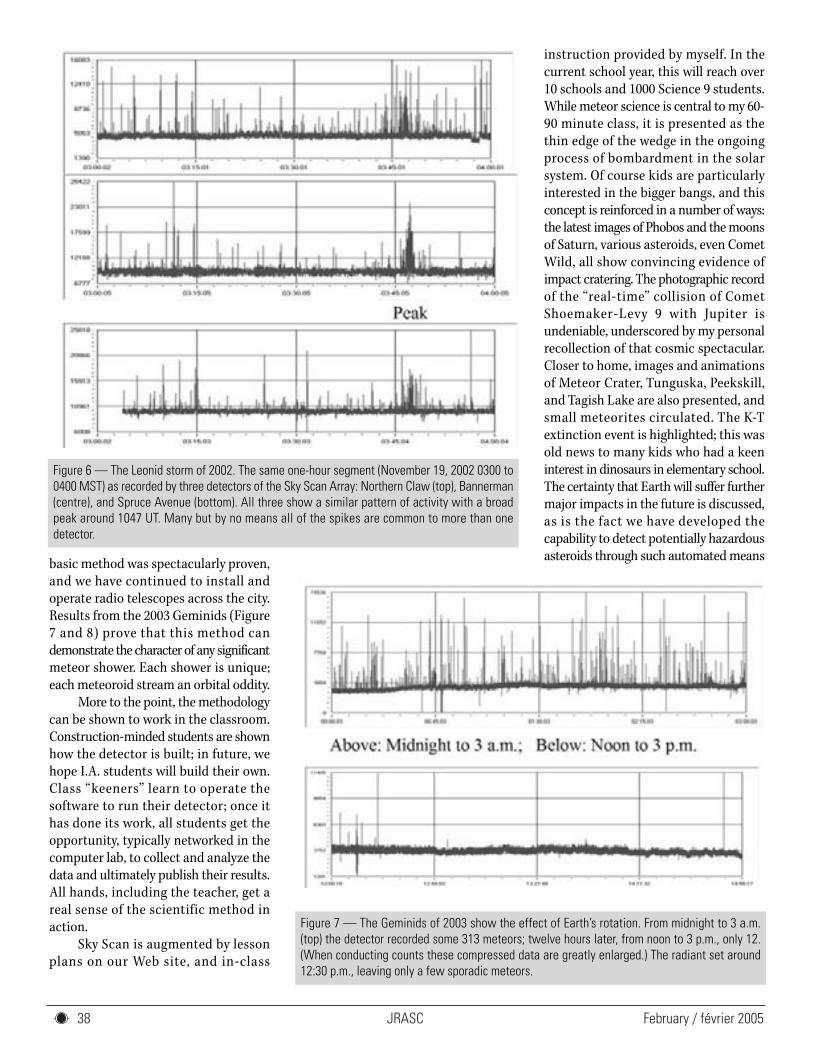
JRASC February / février 2005 38
basic method was spectacularly proven,
and we have continued to install and
operate radio telescopes across the city.
Results from the 2003 Geminids (Figure
7 and 8) prove that this method can
demonstrate the character of any significant
meteor shower. Each shower is unique;
each meteoroid stream an orbital oddity.
More to the point, the methodology
can be shown to work in the classroom.
Construction-minded students are shown
how the detector is built; in future, we
hope I.A. students will build their own.
Class “keeners” learn to operate the
software to run their detector; once it
has done its work, all students get the
opportunity, typically networked in the
computer lab, to collect and analyze the
data and ultimately publish their results.
All hands, including the teacher, get a
real sense of the scientific method in
action.
Sky Scan is augmented by lesson
plans on our Web site, and in-class
instruction provided by myself. In the
current school year, this will reach over
10 schools and 1000 Science 9 students.
While meteor science is central to my 60-
90 minute class, it is presented as the
thin edge of the wedge in the ongoing
process of bombardment in the solar
system. Of course kids are particularly
interested in the bigger bangs, and this
concept is reinforced in a number of ways:
the latest images of Phobos and the moons
of Saturn, various asteroids, even Comet
Wild, all show convincing evidence of
impact cratering. The photographic record
of the “real-time” collision of Comet
Shoemaker-Levy 9 with Jupiter is
undeniable, underscored by my personal
recollection of that cosmic spectacular.
Closer to home, images and animations
of Meteor Crater, Tunguska, Peekskill,
and Tagish Lake are also presented, and
small meteorites circulated. The K-T
extinction event is highlighted; this was
old news to many kids who had a keen
interest in dinosaurs in elementary school.
The certainty that Earth will suffer further
major impacts in the future is discussed,
as is the fact we have developed the
capability to detect potentially hazardous
asteroids through such automated means
Figure 6 — The Leonid storm of 2002. The same one-hour segment (November 19, 2002 0300 to0400 MST) as recorded by three detectors of the Sky Scan Array: Northern Claw (top), Bannerman(centre), and Spruce Avenue (bottom). All three show a similar pattern of activity with a broadpeak around 1047 UT. Many but by no means all of the spikes are common to more than onedetector.
Figure 7 — The Geminids of 2003 show the effect of Earth’s rotation. From midnight to 3 a.m.(top) the detector recorded some 313 meteors; twelve hours later, from noon to 3 p.m., only 12.(When conducting counts these compressed data are greatly enlarged.) The radiant set around12:30 p.m., leaving only a few sporadic meteors.
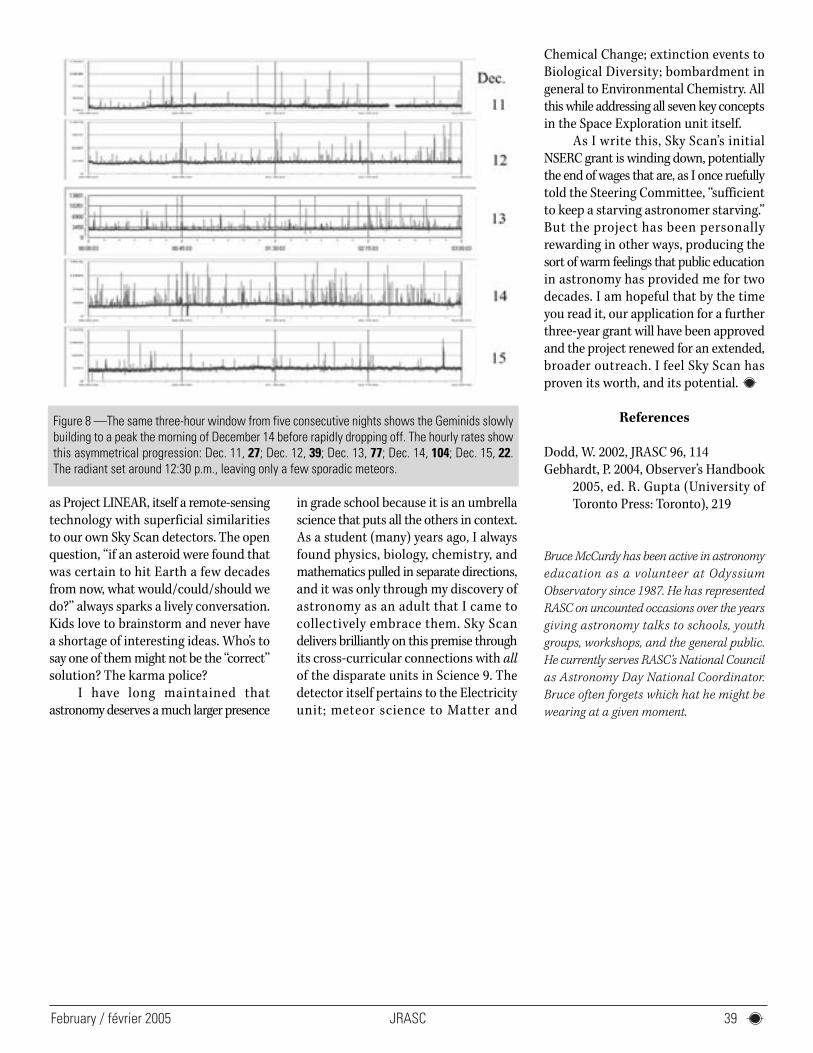
JRASCFebruary / février 2005 39
as Project LINEAR, itself a remote-sensing
technology with superficial similarities
to our own Sky Scan detectors. The open
question, “if an asteroid were found that
was certain to hit Earth a few decades
from now, what would/could/should we
do?” always sparks a lively conversation.
Kids love to brainstorm and never have
a shortage of interesting ideas. Who’s to
say one of them might not be the “correct”
solution? The karma police?
I have long maintained that
astronomy deserves a much larger presence
in grade school because it is an umbrella
science that puts all the others in context.
As a student (many) years ago, I always
found physics, biology, chemistry, and
mathematics pulled in separate directions,
and it was only through my discovery of
astronomy as an adult that I came to
collectively embrace them. Sky Scan
delivers brilliantly on this premise through
its cross-curricular connections with all
of the disparate units in Science 9. The
detector itself pertains to the Electricity
unit; meteor science to Matter and
Chemical Change; extinction events to
Biological Diversity; bombardment in
general to Environmental Chemistry. All
this while addressing all seven key concepts
in the Space Exploration unit itself.
As I write this, Sky Scan’s initial
NSERC grant is winding down, potentially
the end of wages that are, as I once ruefully
told the Steering Committee, “sufficient
to keep a starving astronomer starving.”
But the project has been personally
rewarding in other ways, producing the
sort of warm feelings that public education
in astronomy has provided me for two
decades. I am hopeful that by the time
you read it, our application for a further
three-year grant will have been approved
and the project renewed for an extended,
broader outreach. I feel Sky Scan has
proven its worth, and its potential.
References
Dodd, W. 2002, JRASC 96, 114
Gebhardt, P. 2004, Observer’s Handbook
2005, ed. R. Gupta (University of
Toronto Press: Toronto), 219
Bruce McCurdy has been active in astronomy
education as a volunteer at Odyssium
Observatory since 1987. He has represented
RASC on uncounted occasions over the years
giving astronomy talks to schools, youth
groups, workshops, and the general public.
He currently serves RASC’s National Council
as Astronomy Day National Coordinator.
Bruce often forgets which hat he might be
wearing at a given moment.
Figure 8 —The same three-hour window from five consecutive nights shows the Geminids slowlybuilding to a peak the morning of December 14 before rapidly dropping off. The hourly rates showthis asymmetrical progression: Dec. 11, 27; Dec. 12, 39; Dec. 13, 77; Dec. 14, 104; Dec. 15, 22.The radiant set around 12:30 p.m., leaving only a few sporadic meteors.
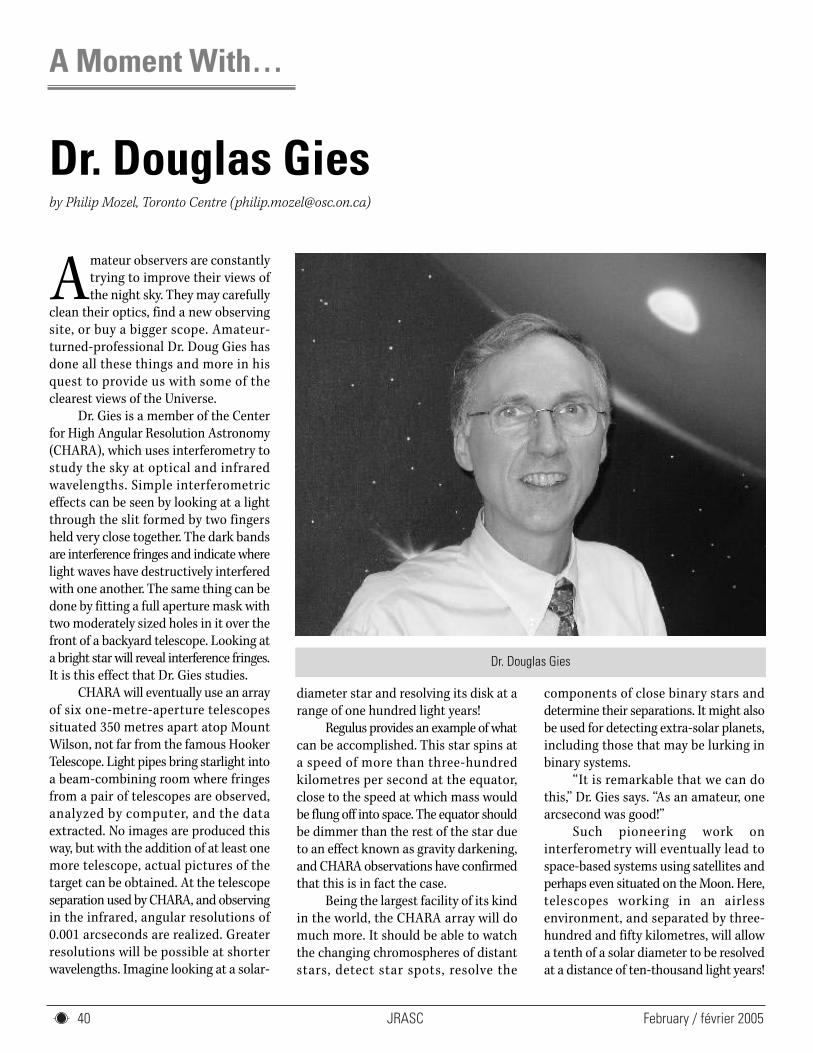
JRASC February / février 2005 40
A Moment With…
Amateur observers are constantly
trying to improve their views of
the night sky. They may carefully
clean their optics, find a new observing
site, or buy a bigger scope. Amateur-
turned-professional Dr. Doug Gies has
done all these things and more in his
quest to provide us with some of the
clearest views of the Universe.
Dr. Gies is a member of the Center
for High Angular Resolution Astronomy
(CHARA), which uses interferometry to
study the sky at optical and infrared
wavelengths. Simple interferometric
effects can be seen by looking at a light
through the slit formed by two fingers
held very close together. The dark bands
are interference fringes and indicate where
light waves have destructively interfered
with one another. The same thing can be
done by fitting a full aperture mask with
two moderately sized holes in it over the
front of a backyard telescope. Looking at
a bright star will reveal interference fringes.
It is this effect that Dr. Gies studies.
CHARA will eventually use an array
of six one-metre-aperture telescopes
situated 350 metres apart atop Mount
Wilson, not far from the famous Hooker
Telescope. Light pipes bring starlight into
a beam-combining room where fringes
from a pair of telescopes are observed,
analyzed by computer, and the data
extracted. No images are produced this
way, but with the addition of at least one
more telescope, actual pictures of the
target can be obtained. At the telescope
separation used by CHARA, and observing
in the infrared, angular resolutions of
0.001 arcseconds are realized. Greater
resolutions will be possible at shorter
wavelengths. Imagine looking at a solar-
diameter star and resolving its disk at a
range of one hundred light years!
Regulus provides an example of what
can be accomplished. This star spins at
a speed of more than three-hundred
kilometres per second at the equator,
close to the speed at which mass would
be flung off into space. The equator should
be dimmer than the rest of the star due
to an effect known as gravity darkening,
and CHARA observations have confirmed
that this is in fact the case.
Being the largest facility of its kind
in the world, the CHARA array will do
much more. It should be able to watch
the changing chromospheres of distant
stars, detect star spots, resolve the
components of close binary stars and
determine their separations. It might also
be used for detecting extra-solar planets,
including those that may be lurking in
binary systems.
“It is remarkable that we can do
this,” Dr. Gies says. “As an amateur, one
arcsecond was good!”
Such pioneering work on
interferometry will eventually lead to
space-based systems using satellites and
perhaps even situated on the Moon. Here,
telescopes working in an airless
environment, and separated by three-
hundred and fifty kilometres, will allow
a tenth of a solar diameter to be resolved
at a distance of ten-thousand light years!
Dr. Douglas Giesby Philip Mozel, Toronto Centre ([email protected])
Dr. Douglas Gies
JRASCFebruary / février 2005 41
A particular object of longstanding
interest for Dr. Gies is SS433, a microquasar.
For many years, this object has been
known to be a large star and a compact
object orbiting one another. Mass from
the star flows toward its companion where
it forms a fiercely hot, glowing accretion
disk. For reasons not fully understood,
energetic jets of material then corkscrew
away from the companion in opposite
directions at a quarter the speed of light.
A team of astronomers led, in part,
by Dr. Gies, has looked at the optical and
X-ray spectra of this system to more
precisely characterize its components.
The glare of the incredibly bright accretion
disk makes this difficult, so the astronomers
had to wait until the system’s orbital
precession moved the disk behind the
star (which happens every 162 days). The
observations suggest that the latter weighs
in between eight and eleven solar masses
while its companion, a supernova remnant,
is around two or three solar masses. This
suggests it is a black hole. Work such as
this may help determine the nature of
SS433’s larger cousins, the multi-million
solar-mass quasars lurking in the hearts
of many galaxies.
Dr. Gies’ interest in SS433 arose
during his time at the University of Toronto
where he obtained his undergraduate and
Ph.D. degrees. There, astronomers inspired
him with their work on SS433 and black
holes. However, his interest in astronomy
dates back much further. RASC member
Richard McWatters introduced Dr. Gies
to the subject while they were in junior
high school. Dr. Gies soon persuaded his
mother to buy him a life membership in
the Society. He became an active member,
attending telescope-making workshops
at the McLaughlin Planetarium, becoming
involved in Toronto Centre meetings and
General Assemblies, going on eclipse trips
to the Gaspé and Gimli, and participating
in astronomical events at the Ontario
Science Centre.
It’s a long road from one arcsecond
to one milli-arcsecond, and Dr. Gies enjoys
forging the way ahead. “It’s been a lot of
fun,” he admits. “The next few years should
be exciting!”
Philip Mozel is past-National Librarian of
the Society and was the Producer/Educator
of the McLaughlin Planetarium. He is currently
an Educator at the Ontario Science Centre.
Amajor project that we have been
working on for a few years is
nearing completion and should
be available to everyone in the spring of
2005. It is a comprehensive lunar observing
certificate program that will be named
in honour of legendary astronomer Isabel
Williamson of the Montreal Centre. Isabel
was an enthusiastic promoter of
observational astronomy, and she devised
innovative observing projects that helped
RASC members to develop quality
observing skills. One of those projects is
very well known today as the Messier list
and was officially adopted as a national
certificate program in 1981.
It has been said that Isabel promoted
participation in the Messier list so that
observers could learn the night sky well
enough to apply those skills to variable
star observing. What a great idea that
was, since finding deep-sky objects requires
many of the same techniques as those
needed for finding remote variable stars.
In those days, there was no such thing as
“Go-To” telescopes, so an observer would
have to learn star-hopping skills in order
to find objects on the Messier list, and in
the process would gain the ability to
correctly identify the star-field of any
object, including a variable star.
Another project that she challenged
observers to try was to identify 300 features
as listed on a map of the Moon that was
published early in the twentieth century.
It was a reasonably good map for its time
(still available from Sky Publishing), and
some well-known observers, such as David
Levy, took up the challenge. Today we
have much better charts (such as Antonìn
Rükl’s Atlas of the Moon) and equipment
to explore our near neighbor with, and
the observing committee would like to
encourage RASC members to take
advantage of this wealth of information,
charts, hardware, and software. The Moon
is by far the most detailed celestial object
visible from Earth and offers a complete
range of observing targets, from unaided
eye features, to binocular and small-
telescope objects, as well as challenging
features requiring high magnification
through larger telescopes.
To enhance the Isabel Williamson
lunar program we have plans to include
a significant amount of lunar geology via
an overview of the history of the Moon,
and by including key observing notes for
most objects. These handy notes will
explain the origin, age, chemistry, and so
on of the current observation. We also
plan to include a preliminary introduction
to the major features of the Moon as well
The Skies over CanadaObserving Committee Newsby Christopher Fleming ([email protected])
JRASC February / février 2005 42
as templates for making drawings and a
list of several challenge objects that will
cover the outer regions of the lunar disc,
where the effects of libration can be
observed.
When designing the Isabel
Williamson lunar program we decided
that, in order to provide a complete tour
of the Moon, it would be necessary to
include a greater number of required
objects than other currently available
programs of this type. To accomplish this
we first chose the most important key
features, and then added nearby “must
see” objects that are highlighted in the
accompanying observing notes. Many of
these additional objects, referred to in
the notes, will be required observations.
This means that the total number of
mandatory observations will be significantly
greater than the apparent number featured
as titled objects. To make this as clear as
possible, each titled feature will be referred
to as an objective, and not as a single
observation. In addition there will be
optional or challenge observations (not
required) included where appropriate.
The Explore the Universe Certificate
program contains an excellent introductory
lunar observing list, and we recommend
that observers try this first before delving
into the more advanced Isabel Williamson
program. We are also planning to provide,
in the not-too-distant future, a number
of intermediate-level programs for binocular
and small telescope users that will bridge
the gap between the Explore the Universe
program and more advanced programs
like the Messier list, the Finest NGC list,
and the upcoming Isabel Williamson list.
There have been three Explore the
Universe Certificates awarded since our
last report and they are listed in Table 1.
There have been six Messier
Certificates awarded since our last report
and, they are listed in Table 2.
Congratulations to all!
The Asteroids Section features charts
containing the orbital position of several
bright asteroids that will be visible in
2005, and during March and April you
will be able to print charts for the asteroids
(1) Ceres, (2) Pallas, (6) Hebe, (10) Hygiea,
(14) Irene, (15) Eunomia, and (29)
Amphitrite. Those asteroids will all be
brighter than tenth magnitude at that
time, and the charts will display nearby
stars to tenth magnitude on a five-degree
vertical field layout. Dates for the position
of each asteroid will be listed at three-
day intervals, and nearby bright “finder
stars” will be highlighted. In many cases
the finder stars are bright enough to be
seen visually and therefore a Telerad or
similar pointing device can be used to
target the field printed on the charts.
Otherwise a typical finder-scope or
binoculars will be sufficient to find the
brightest star in the field.
The Variable Stars Section features
direct links to genuine American
Association of Variable Stars Observer’s
(AAVSO) magnitude estimate charts for
Mira-type Long-Period Variables that will
reach maxima in 2005, and that will be
brighter than magnitude 8.0. For March
and April 2005, you will be able to print
charts for R Leporis, R Canis Minoris, R
Triangulum, T Hydrae, R Virginis, V Canes
Venaticorum, R Canes Venaticorum, R
Bootis, V Coronae Borealis, RS Herculis,
X Ophiuchi, R Aquilae, T Sagittarii, and
T Aquarii. We also have direct links to
charts for several other variable star types,
and you will find them on the Sample
Charts 2 page. Many of the most interesting
variable stars in the night sky are listed
there as well as the positions of possible
nova outbursts.
The Special Projects Section regularly
posts Web pages containing information
about upcoming, noteworthy astronomical
events, and we plan to enhance that section
with additional content and links provided
by various members across the RASC. If
you have a project you are working on
that you would like to share with other
RASCals, you are invited to send us
information about it or a URL link to your
Web site. Our email address is
Our new Comets Section is now
fully operational and features
information and finder charts for comets
that are currently visible. It also contains
a comprehensive overview of the history
of comets, a frequently asked questions
page, observing tips, observation forms,
images, recommended books, links to
related sites, and suggestions for comet
observing or imaging projects. You can
find the Comets Section at
www.rasc.ca/observing/comets or
from links in the observing area of the
national site.
Christopher Fleming is Chair of the RASC
Observing Committee and Observers’ Chair
in the London Centre. He enjoys all types of
observing, especially deep-sky, lunar, double
stars, and variable stars. Chris is also a
musician and Webmaster of the London Jazz
Society’s Web site.
Table 1. Explore the Universe Certificate Recipients.
Name Centre Date Awarded
Robert Lavoie Ottawa, Ont Oct. 2004
Arlyne Gillespie Kingston, Ont. Oct. 2004
Adam Clayson Toronto, Ont. Nov. 2004
Table 2. Messier Certificate Recipients
Name Centre Date Awarded
Roy Ramdeen Edmonton, Alta. Oct. 2004
Trent Bjorndahl Edmonton, Alta. Oct. 2004
Jnani Cewel Edmonton, Alta. Oct. 2004
Bob Crossman Moncton, N.B. Oct. 2004
Leo Brodeur Kingston, Ont. Oct. 2004
Philip Downey Niagara Falls, Ont. Nov. 2004
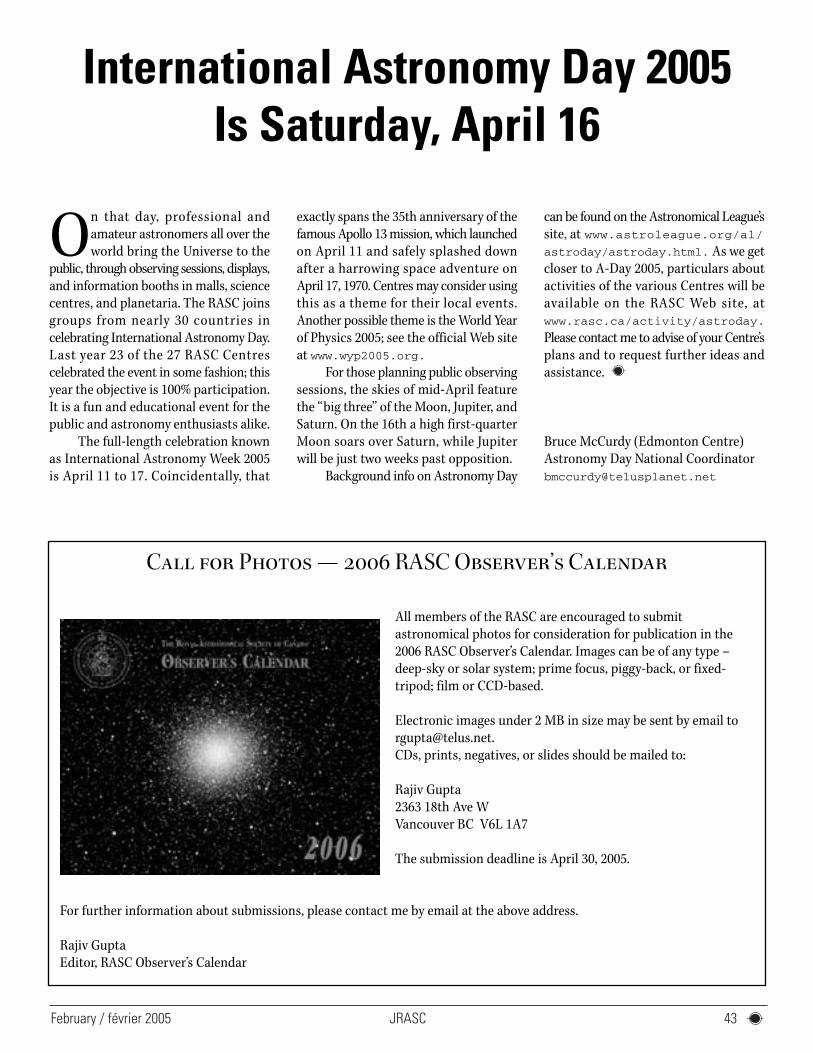
JRASCFebruary / février 2005 43
On that day, professional and
amateur astronomers all over the
world bring the Universe to the
public, through observing sessions, displays,
and information booths in malls, science
centres, and planetaria. The RASC joins
groups from nearly 30 countries in
celebrating International Astronomy Day.
Last year 23 of the 27 RASC Centres
celebrated the event in some fashion; this
year the objective is 100% participation.
It is a fun and educational event for the
public and astronomy enthusiasts alike.
The full-length celebration known
as International Astronomy Week 2005
is April 11 to 17. Coincidentally, that
exactly spans the 35th anniversary of the
famous Apollo 13 mission, which launched
on April 11 and safely splashed down
after a harrowing space adventure on
April 17, 1970. Centres may consider using
this as a theme for their local events.
Another possible theme is the World Year
of Physics 2005; see the official Web site
at www.wyp2005.org.
For those planning public observing
sessions, the skies of mid-April feature
the “big three” of the Moon, Jupiter, and
Saturn. On the 16th a high first-quarter
Moon soars over Saturn, while Jupiter
will be just two weeks past opposition.
Background info on Astronomy Day
can be found on the Astronomical League’s
site, at www.astroleague.org/al/
astroday/astroday.html. As we get
closer to A-Day 2005, particulars about
activities of the various Centres will be
available on the RASC Web site, at
www.rasc.ca/activity/astroday.
Please contact me to advise of your Centre’s
plans and to request further ideas and
assistance.
Bruce McCurdy (Edmonton Centre)
Astronomy Day National Coordinator
International Astronomy Day 2005 Is Saturday, April 16
Call for Photos — 2006 RASC Observer’s Calendar
All members of the RASC are encouraged to submit
astronomical photos for consideration for publication in the
2006 RASC Observer’s Calendar. Images can be of any type –
deep-sky or solar system; prime focus, piggy-back, or fixed-
tripod; film or CCD-based.
Electronic images under 2 MB in size may be sent by email to
CDs, prints, negatives, or slides should be mailed to:
Rajiv Gupta
2363 18th Ave W
Vancouver BC V6L 1A7
The submission deadline is April 30, 2005.
For further information about submissions, please contact me by email at the above address.
Rajiv Gupta
Editor, RASC Observer’s Calendar
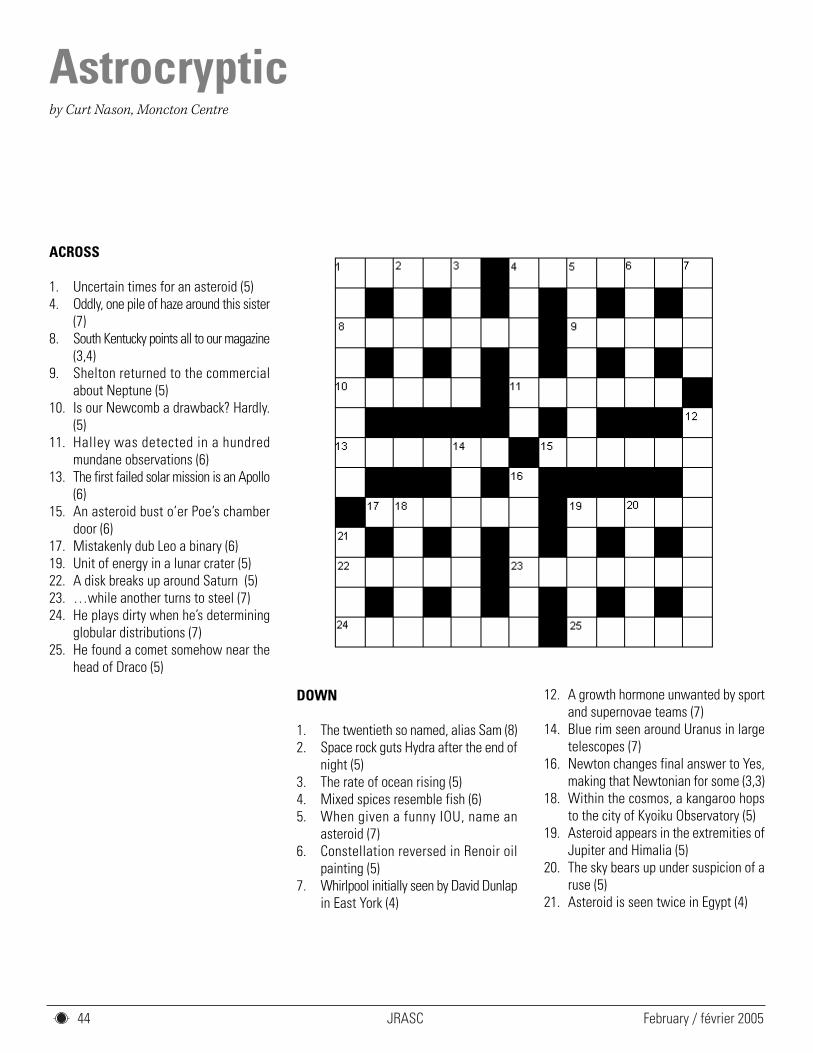
JRASC February / février 2005 44
Astrocrypticby Curt Nason, Moncton Centre
ACROSS
1. Uncertain times for an asteroid (5)4. Oddly, one pile of haze around this sister
(7)8. South Kentucky points all to our magazine
(3,4)9. Shelton returned to the commercial
about Neptune (5)10. Is our Newcomb a drawback? Hardly.
(5)11. Halley was detected in a hundred
mundane observations (6)13. The first failed solar mission is an Apollo
(6)15. An asteroid bust o’er Poe’s chamber
door (6)17. Mistakenly dub Leo a binary (6)19. Unit of energy in a lunar crater (5)22. A disk breaks up around Saturn (5)23. …while another turns to steel (7)24. He plays dirty when he’s determining
globular distributions (7)25. He found a comet somehow near the
head of Draco (5)
DOWN
1. The twentieth so named, alias Sam (8)2. Space rock guts Hydra after the end of
night (5)3. The rate of ocean rising (5)4. Mixed spices resemble fish (6)5. When given a funny IOU, name an
asteroid (7)6. Constellation reversed in Renoir oil
painting (5)7. Whirlpool initially seen by David Dunlap
in East York (4)
12. A growth hormone unwanted by sportand supernovae teams (7)
14. Blue rim seen around Uranus in largetelescopes (7)
16. Newton changes final answer to Yes,making that Newtonian for some (3,3)
18. Within the cosmos, a kangaroo hopsto the city of Kyoiku Observatory (5)
19. Asteroid appears in the extremities ofJupiter and Himalia (5)
20. The sky bears up under suspicion of aruse (5)
21. Asteroid is seen twice in Egypt (4)
February / février 2005
COLUMNS/RUBRIQUES
10 Reflections: Percival Lowell, LowellObservatory, and Plutoby David M.F. Chapman
12 Second Light: Weighing the Lowest MassStarsby Leslie J. Sage
35 Orbital Oddities: Sky ScanTeaching Radio Astronomy in Alberta Schoolsby Bruce McCurdy
40 A Moment With… Dr. Douglas Giesby Philip Mozel
Vol. 99, No. 1 Whole Number 710
The Journal of the Royal Astronomical Society of Canada Le Journal de la Société royale d’astronomie du Canada
contentstab le des mat iè res
T H E R O YA L A S T R O N O M I C A L S O C I E T Y O F C A N A D ANATIONAL OFFICERS AND COUNCIL FOR 2004-2005/CONSEIL ET ADMINISTRATEURS NATIONAUX
Honorary President Roy Bishop, Ph.D., HalifaxPresident Peter Jedicke, M.A., London1st Vice-President Scott Young, B.Sc., Winnipeg2nd Vice-President Dave Lane, HalifaxSecretary Kim Hay, KingstonTreasurer David Clark, LondonRecorderLibrarian Robert Garrison, Ph.D., TorontoPast Presidents Rajiv Gupta, Ph.D., Vancouver and Robert Garrison, Ph.D., TorontoEditor of Journal Wayne Barkhouse, Ph.D., HalifaxEditor of Observer’s Handbook Rajiv Gupta, Ph.D., VancouverEditor of Beginner’s Observing Guide Leo Enright, KingstonEditor of Observer’s Calendar Rajiv Gupta, Ph.D., Vancouver
Executive Secretary Bonnie Bird, M.L.Sc., 136 Dupont Street, Toronto ON M5R 1V2 Telephone: (416) 924-7973
Belleville Centre9 South Park Street, Belleville ON K8P 2W9
Calgary CentreC/O Calgary Science Centre, PO Box 2100 Station “M”, Calgary AB T2P 2M5
Charlottetown CentreC/O 316 N. Queen Elizabeth Drive, Charlottetown PE C1A 3B5
Edmonton CentreC/O Edmonton Space & Science Centre, 11211 – 142 StreetEdmonton AB T5M 4A1
Halifax CentrePO Box 31011, Halifax NS B3K 5T9
Hamilton CentrePO Box 1223, Waterdown ON L0R 2H0
Kingston CentrePO Box 1793, Kingston ON K7L 5J6
Kitchener-Waterloo CentreC/O John Beingessner, 479 Cabot Trail, Waterloo ON N2K 3Y3
London CentrePO Box 842 Station B, London ON N6A 4Z3
Moncton CentreC/O Dr. Francis LeBlanc, Département de physique et d’astronomie,Université de Moncton, Moncton NB E1A 3E9
Centre francophone de MontréalCasier postal 206 Station St-Michel, Montréal QC H2A 3L9
Montreal CentrePO Box 1752 Station B, Montreal QC H3B 3L3
Niagara CentrePO Box 4040, St Catharines ON L2R 7S3
Okanagan CentrePO Box 20119 TCM, Kelowna BC V1Y 9H2
Ottawa CentrePO Box 33012, 1363 Woodroffe Ave, Ottawa ON K2C 3Y9
Prince George Centre7365 Tedford Road, Prince George BC V2N 6S2
Centre de Québec2000 boul Montmorency, Québec QC G1J 5E7
Regina CentrePO Box 20014 Cornwall Centre, Regina SK S4P 4J7
St. John’s CentreC/O Randy Dodge, 206 Frecker Dr, St. John’s NL A1E 5H9
Sarnia CentreC/O Paul Bessonette, 160 George Street, Sarnia ON N7T 7V4
Saskatoon CentrePO Box 317 RPO University, Saskatoon SK S7N 4J8
Thunder Bay Centre286 Trinity Crescent, Thunder Bay ON P7C 5V6
Toronto CentreC/O Ontario Science Centre, 770 Don Mills Road, Toronto ON M3C 1T3
Vancouver CentreC/O The HR Macmillan Space Centre, 1100 Chestnut StreetVancouver BC V6J 3J9
Victoria CentreC/O Lauri Roche, 912-6880 Wallace Drive, Brentwood Bay BC V8M 1N8
Windsor CentreC/O Ken Garber, 2831 Alexandra Avenue, Windsor ON N9E 2J8
Winnipeg CentrePO Box 2694, Winnipeg MB R3C 4B3
CENTRE ADDRESSES/ADRESSES DES CENTRESThe most current contact information and Web site addresses for all Centres are available at the Society’s Web site: www.rasc.ca
RESEARCH PAPERS/ARTICLES DE RECHERCHE
14 Meteor and Aurora Detection UsingModern Video Technologiesby Martin Connors, Mikko Syrjäsuo, Peter Brown,
and Eric Donovan
23 Canadian Thesis Abstracts by Melvin Blake
EDUCATION NOTES
14 Exploring the Astronomy of Ancient Egyptwith Simulations I: The Sun, Moon, andMilky Wayby William Dodd
FEATURE ARTICLES/ARTICLES DE FOND
7 The Measure of the Earth — A SaskatchewanDiaryby Martin Beech
33 Jordanian Astronomical Society Glimpseda Challenging Crescentby Mohammad Odeh
A Moment With…Dr. Douglas Gies
p. 40
Meteor and Aurora Detection Using Modern VideoTechnologies
p. 14
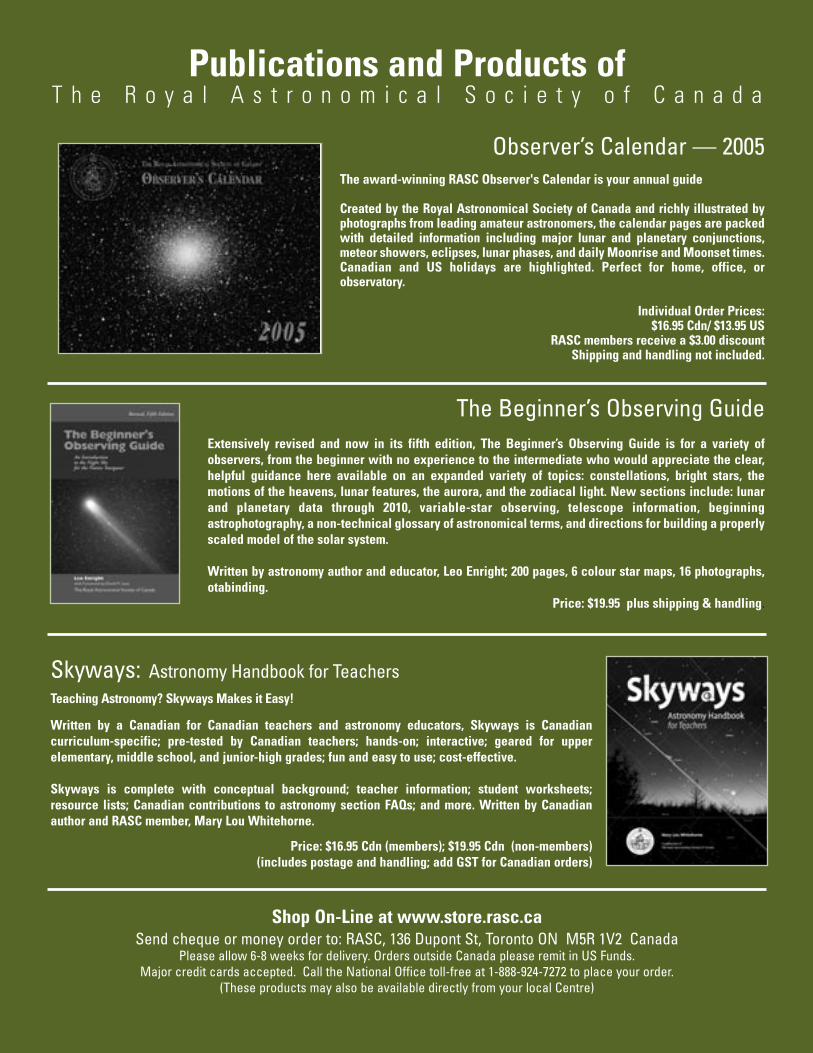
Shop On-Line at www.store.rasc.caSend cheque or money order to: RASC, 136 Dupont St, Toronto ON M5R 1V2 Canada
Please allow 6-8 weeks for delivery. Orders outside Canada please remit in US Funds. Major credit cards accepted. Call the National Office toll-free at 1-888-924-7272 to place your order.
(These products may also be available directly from your local Centre)
The Beginner’s Observing GuideExtensively revised and now in its fifth edition, The Beginner’s Observing Guide is for a variety ofobservers, from the beginner with no experience to the intermediate who would appreciate the clear,helpful guidance here available on an expanded variety of topics: constellations, bright stars, themotions of the heavens, lunar features, the aurora, and the zodiacal light. New sections include: lunarand planetary data through 2010, variable-star observing, telescope information, beginningastrophotography, a non-technical glossary of astronomical terms, and directions for building a properlyscaled model of the solar system.
Written by astronomy author and educator, Leo Enright; 200 pages, 6 colour star maps, 16 photographs,otabinding.
Price: $19.95 plus shipping & handling.
Publications and Products ofT h e R o y a l A s t r o n o m i c a l S o c i e t y o f C a n a d a
Skyways: Astronomy Handbook for Teachers Teaching Astronomy? Skyways Makes it Easy!
Written by a Canadian for Canadian teachers and astronomy educators, Skyways is Canadiancurriculum-specific; pre-tested by Canadian teachers; hands-on; interactive; geared for upperelementary, middle school, and junior-high grades; fun and easy to use; cost-effective.
Skyways is complete with conceptual background; teacher information; student worksheets;resource lists; Canadian contributions to astronomy section FAQs; and more. Written by Canadianauthor and RASC member, Mary Lou Whitehorne.
Price: $16.95 Cdn (members); $19.95 Cdn (non-members)(includes postage and handling; add GST for Canadian orders)
Observer’s Calendar — 2005The award-winning RASC Observer's Calendar is your annual guide
Created by the Royal Astronomical Society of Canada and richly illustrated byphotographs from leading amateur astronomers, the calendar pages are packedwith detailed information including major lunar and planetary conjunctions,meteor showers, eclipses, lunar phases, and daily Moonrise and Moonset times.Canadian and US holidays are highlighted. Perfect for home, office, orobservatory.
Individual Order Prices:$16.95 Cdn/ $13.95 US
RASC members receive a $3.00 discountShipping and handling not included.
I N S I D E T H I S I S S U E
The Measure of the Earth • Canadian Thesis Absracts
Jordanian Astronomical Society Glimpses a Challenging Crescent
Meteor and Aurora Detection Using Modern Video Technologies
The Journal of the Royal Astronomical Society of Canada Le Journal de la Société royale d’astronomie du Canada
February / février 2005 Volume/volume 99 Number/numéro 1 [710]
![[XLS]mmsaproviders.momentum.co.zammsaproviders.momentum.co.za/pdfs/2011_Associated_list... · Web view113 JAN HOFMEYR ROAD HOWLETT PO BOX 1003 WANDSBECK VAWDA PO BOX 1469 SHAIKH PO](https://img.pdfslide.us/doc/110x75/5b26a7fb7f8b9a121b8b45fe/xls-web-view113-jan-hofmeyr-road-howlett-po-box-1003-wandsbeck-vawda-po-box.jpg)
![Carrier Text File...May 30, 2020 · 0288 po box 6392 grand rapids mi 2832 po box 42033 hazelwood mo 5110 po box 624 milwaukee wi 7536 po box 1849 stow oh assurant health [fortis]](https://img.pdfslide.us/doc/110x75/6045b6cae307f02e1f7fcbd2/carrier-text-file-may-30-2020-0288-po-box-6392-grand-rapids-mi-2832-po-box.jpg)


![thomas & deborai thomas & debora] thomas & deborai contractor iverson, po box 2212, po box 2212, po box 2212, applicant owner p1506-023 $183,148.65 applicant owner pi 506-032 $21,328.08](https://img.pdfslide.us/doc/110x75/5eca3f7cce74ca60fc41cd93/-thomas-deborai-thomas-debora-thomas-deborai-contractor-iverson.jpg)