Embed Size (px)
Citation preview
1 23
Mycorrhiza ISSN 0940-6360 MycorrhizaDOI 10.1007/s00572-016-0708-1
Molecular diagnostic toolkit forRhizophagus irregularis isolateDAOM-197198 using quantitative PCRassay targeting the mitochondrial genome
Amine Badri, Franck O. P. Stefani,Geneviève Lachance, Line Roy-Arcand,Denis Beaudet, Agathe Vialle &Mohamed Hijri

1 23
Your article is protected by copyright and
all rights are held exclusively by Springer-
Verlag Berlin Heidelberg. This e-offprint is
for personal use only and shall not be self-
archived in electronic repositories. If you wish
to self-archive your article, please use the
accepted manuscript version for posting on
your own website. You may further deposit
the accepted manuscript version in any
repository, provided it is only made publicly
available 12 months after official publication
or later and provided acknowledgement is
given to the original source of publication
and a link is inserted to the published article
on Springer's website. The link must be
accompanied by the following text: "The final
publication is available at link.springer.com”.
ORIGINAL ARTICLE
Molecular diagnostic toolkit for Rhizophagus irregularis isolateDAOM-197198 using quantitative PCR assay targetingthe mitochondrial genome
Amine Badri1 & Franck O. P. Stefani2 & Geneviève Lachance3 & Line Roy-Arcand3&
Denis Beaudet2 & Agathe Vialle4 & Mohamed Hijri2
Received: 2 February 2016 /Accepted: 9 May 2016# Springer-Verlag Berlin Heidelberg 2016
Abstract Rhizophagus irregularis (previously namedGlomus irregulare) is one of the most widespread and com-mon arbuscular mycorrhizal fungal (AMF) species. It hasbeen recovered worldwide in agricultural and natural soils,and the isolate DAOM-197198 has been utilized as a commer-cial inoculant for two decades. Despite the ecological andeconomical importance of this taxon, specific markers forquantification of propagules by quantitative real-time PCR(qPCR) are extremely limited and none have been rigorouslyvalidated for quality control of manufactured products such asbiofertilizers. From the sequencing of 14 complete AMF mi-tochondrial (mt) genomes, a qPCR assay using a hydrolysisprobe designed in the single copy cox3-rnl intergenic regionwas tested and validated to specifically and accurately quan-tify the spores of R. irregularis isolate DAOM-197198.Specificity tests were performed using standard PCR andqPCR, and results clearly showed that the primers specifically
amplified the isolate DAOM-197198, yielding a PCR productof 106 bp. According to the qPCR analyses on spores pro-duced in vitro, the average copy number of mt genomes perspore was 3172±304 SE (n=6). Quantification assays weresuccessfully undertaken on known and unknown samples inliquid suspensions and commercial dry formulations to showthe accuracy, precision, robustness, and reproducibility of theqPCR assay. This study provides a powerful molecular toolkitspecifically designed to quantify spores of the model AMFisolate DAOM-197198. The approach of molecular toolkitused in our study could be applied to other AMF taxa and willbe useful to research institutions and governmental and indus-trial laboratories running routine quality control of AMF-based products.
Keywords Quantitative real-time PCR . Validation .
Rhizophagus irregularis . Mitochondrial marker . Sporequantification . Biofertilizers . Arbuscular mycorrhizal fungi
Introduction
Arbuscular mycorrhizal fungi (AMF) are a ubiquitous groupof obligate biotrophic soil fungi which are associated withmore than 80 % of terrestrial plants species where they formmycorrhizal symbiosis (Smith and Read 2010). Beneficial ef-fects of this symbiosis on plant fitness include an enhancednutrient uptake, of phosphorus in particular, and an improvedtolerance to biotic and abiotic stress (Koide and Mosse 2004;Smith and Read 2010; Gianinazzi et al. 2010). The use ofAMF in agricultural interventions has the potential to benefitnot only the health of crops but also the health of the soil itself,especially in the context of sustainable agriculture(Podeszfinski et al. 2002). Using 231 field trials on potatoproduction, Hijri (2016) clearly demonstrated that AMF
Amine Badri and Franck O. P. Stefani contributed equally to this work.
Electronic supplementary material The online version of this article(doi:10.1007/s00572-016-0708-1) contains supplementary material,which is available to authorized users.
* Mohamed [email protected]
1 Centre de recherche sur les biotechnologies marines, 2e Rue Est,Rimouski, QC G5L 9H3, Canada
2 Institut de Recherche en Biologie Végétale, Département de SciencesBiologiques, Université de Montréal, 4101 Rue Sherbrooke Est,Montréal, QC H1X 2B2, Canada
3 Premier Tech, 1 avenue Premier, Campus Premier Tech,Rivière-du-Loup, QC G5R 6C1, Canada
4 Biopterre—Centre de développement des bioproduits, 1642, Rue dela Ferme, La Pocatière, Québec G0R 1Z0, Canada
MycorrhizaDOI 10.1007/s00572-016-0708-1
Author's personal copy
inoculation significantly increased crop yield. In Canada, thesurface area of farm fields inoculated in 2015 with AMF-based biofertilizers is expected to double compared to 2014,from 100,000 to 200,000 ha (Fortin et al. 2015).
Arbuscular mycorrhizal fungal species richness and suc-cession are still not well known, and how different assem-blages of AMF species benefit the host plant remains poorlyunderstood. AMF identification has historically relied on theanalysis of spores and the morphology of spore clusters (size,shape, surface ornamentation, color, contents, spore walls,hyphal attachment, and reaction to staining solutions, e.g.,Metzler’s). However, the morphological analysis of AMFspores is time consuming and requires specialized expertisebecause of limited phenotypic differentiation among taxa.Therefore, AMF identification based on morphological andbiochemical characters could either fail to identify species orlead to incorrect identification in some situations. This limita-tion negatively impacts the development of commercialAMF-based biofertilizer inoculants. Indeed, the industrial pro-duction of AMF-based biofertilizers requires standardized di-agnosis toolkits for monitoring product quality control,assessing shelf-life of formulated products and tracing theinoculants in soil and crop roots.
Few studies have attempted to use molecular-basedmethods for detecting and quantifying the abundance ofAMF. Among these methods, the quantitative real-time poly-merase chain reaction (qPCR) has been used in a wide rangeof routine applications, including medical diagnosis, becauseof its accuracy and precision. Recent reports of its applicationin AMF studies have demonstrated its usefulness as a rapidand sensitive technique for the enumeration of fungal propa-gules or gene copy numbers (Filion et al. 2003; Alkan et al.2004; Isayenkov et al. 2004; Kiers et al. 2011, Thonar et al.2012, Couillerot et al. 2013). Several validation steps andimprovements have been made to enhance the qPCR sensitiv-ity (Alkan et al. 2006; Gamper et al. 2008). Until now, most ofthese studies used the ribosomal DNA as a molecular markerin order to quantify AMF by qPCR. However, the geneticvariation of this locus within a single spore, the occurrenceof multiple copies per genome, and the variation of copy num-ber among isolates (Sanders et al. 1995; Giovannetti et al.1999; Redecker et al. 1999; Hijri and Sanders 2005; Corradiet al. 2007; Boon et al. 2010) limit the precision of this quan-tification method and can lead to misestimating the number ofspores in samples. In addition, ribosomal DNA (rDNA) can-not discriminate between isolates for a given AMF species. Incontrast, the mitochondrial (mt) genome appears to behomoplasmic (Lang and Hijri 2009; Lee and Young 2009;Formey et al. 2012). For example, Lee and Young (2009)showed that the mt DNA of Glomus intraradices isolate 494was homoplasmic, although this has been challenged recently(Beaudet et al. 2015). It was also found that the mt largesubunit rDNA gene (mtLSU rDNA, also known as rnl gene)
sequence was not polymorphic within G. intraradices isolatesBEG75 and BEG158 and G. pro l i fe rum i so la teDAOM226389 but varied substantially between isolates(Raab et al. 2005). Thus, the mtLSU rDNA has been sug-gested to be an appropriate marker for studies of diversity inAMF populations (Peyret-Guzzon et al. 2016). The usefulnessof mtLSU rDNA (rnl gene) has been demonstrated by Kierset al. (2011) and Couillerot et al. (2013) where both studieshave developed species-specific qPCR markers forG. intraradices (isolates 09 and JJ291), G. aggregatum, andG. custos. Therefore, targeting AMF mt genomes with qPCRprobes is a promising avenue for developing more sensitive,accurate, and precise AMF quantitative assays.
The aim of this study is to develop and validate a qPCRassay to identify and quantify the spores of the model AMFRhizophagus irregularis isolate DAOM-197198 in variousspore formulations during industrial processes. Using the datafrom 14 complete AMF mitochondrial genomes, a novel hy-drolysis probe-based qPCR assay targeting the cox3-rnlintergenic region was developed to detect and quantify sporesof R. irregularis DAOM-197198. A rigorous validation pro-tocol such as standard curve development and its robustnessevaluation (tests onMaster Mix, primers, and probe variation)of the qPCR assay has been applied to determine the numberof mt genome copies per spore of R. irregularis DAOM-197198 and to assess the accuracy, precision, limit of detec-tion (LOD), and limit of quantification (LOQ) of the method.We also performed tests for spore conservation and DNAstability during storage using our qPCR assay. The rationalfor choosing R. irregularis isolate DAOM-197198 in our in-vestigation is because it has been recovered worldwide inagricultural and natural soils, it has been utilized as bioferilizerinoculant for two decades, and its nuclear and mitochondrialgenomes have been published (Tisserant et al. 2013; Nadimiet al. 2012).
Materials and methods
Fungal strains and commercial formulations
Rhizophagus irregularis isolate DAOM-197198 (synonymGlomus irregulare; formerly G. intraradices) was cultivatedin vitro with Ri T-DNA-transformed carrot (Daucus carota L.)roots in an industrial mycoreactor by Premier TechBiotechnologies. The fungal material was provided in threedifferent formulations: spores in liquid suspension (termed asimple suspension), spores mixed with fragmented carrotroots in liquid formulation (termed a complex liquid suspen-sion), and spores mixed with root fragments in a dry formu-lation (kaolin-based substrate). Both formulations of sporesand spores mixed with fragmented carrot roots in liquid sus-pension contain fragments of hyphae and cell debris. Primers
Mycorrhiza
Author's personal copy
and probe specificity tests were performed on different AMFtaxa including five different isolates of R. irregularis and sixclosely related species to R. irregularis (Table 1). All isolateslisted in Table 1 (except isolate R. irregularis DAOM-197198) were cultivated in vitro with Ri T-DNA-transformed carrot roots in petri dishes containing M mediumin 0.4 % Phytagel (Sigma-Aldrich, Oakville, ON, USA).Spores and hyphae were collected by dissolving Phytagel withcitrate buffer as described in Hijri et al. (2007).
DNA extraction
DNA extraction, particularly for spore lysis steps, is crucialfor quantification of R. irregularis DAOM-197198 usingqPCR method. We have optimized two protocols: one proto-col for DNA isolation from spores in liquid formulations andanother for DNA isolation from spores in dry formulationusing two different kits as described below. However, DNAof AMF isolates used for specificity tests (Table 1) was ex-tracted using DNeasy Plant Mini Kit (Qiagen, Toronto, ON,USA) where spores and hyphae were crushed using pestle anda 1.5-ml microtube.
DNA isolation from spores in liquid formulations
Total genomic DNA (gDNA) of the isolate DAOM-197198 was isolated using the PowerSoil DNA isolationkit (Mo Bio, Carlsbad, CA, USA) according to the man-ufacturer’s instructions. However, the lysis of spores wasoptimized using the following procedure: spore suspen-sions were centrifuged at 11,000g for 10 min at 4 °C ina 1.5-ml tube. The supernatant was removed partiallyleaving approximately 100 μl of the sample solution at
the bottom of the tube in order to not disturb the pellet.Four hundred microliters of buffer contained in thePowerBead tubes was transferred into the 1.5-ml tube.The final volume (500 μl) was then transferred in tubescontaining ceramic bead tubes (1.4 mm diameter, Mo Bio,Carlsbad, CA, USA), 25 mg of Celite 545 (diatomaceousearth, Imerys Filtration Minerals, CA, USA), and 60 μl ofC1 solution (C solutions are provided in the PowerSoilDNA isolation Kit). Samples were homogenized using aPrecellys® 24 homogenizer (Bertin Technologies, France)with three runs performed at 5000 rpm for 15 s each, witha break of 5 s between runs. Five hundred sixty microli-ters of the solution was then transferred to a clean 2-mlcollection tube containing 250 μl of Solution C2.Following incubation at 4 °C for 5 min, the tubes werecentrifuged at 11,000g for 5 min and 750 μl of the solu-tion was transferred into a clean 2-ml collection tube con-taining 200 μL of Solution C3. Following incubation at4 °C for 5 min, the tubes were centrifuged at 11,000g for5 min and the supernatant was transferred to a clean col-lection tube containing 1.2 ml of Solution C4. The re-maining extraction steps followed the manufacturer’sprotocol.
DNA isolation from spores in dry formulation
The NucleoSpin® Soil isolation kit (Macherey-Nagel GmbH&Co. KG, Düren, Germany) was used to isolate the gDNA fromspores contained in dry formulation samples, with the followingmodifications: 100 mg of samples was transferred to aNucleoSpin® Bead Tube containing the ceramic beads fromthe kit, 25 mg of Celite 545 (diatomaceous earth, ImerysFiltration Minerals, CA, USA), and 70 μL of Carnation® in-stant skim milk powder at 100 mg/ml (Takada-Hoshino andMatsumoto 2004). As recommended by the manufacturer’s in-struction, 700 μl of SL1 buffer and 150 μL of Enhancer SXbuffer were added. Samples were homogenized using aPrecellys® 24 homogenizer (Bertin Technologies, France) withthree runs performed at 5000 rpm for 15 s each, with a break of5 s between runs. The remaining extraction steps followed themanufacturer’s protocol.
Primers and probe specific to R. irregularisDAOM-197198
The specific primer set 197198F (5 -CCCACCAGGGCAGATTAATC-3 ) and 197198R (5 -TGGCTTTGTACAGGCAACAG-3 ) and the minor groove binder(MGB) probe (VIC-CCCTGGAGTATCTG-MGB-NFQ)were designed on the mt genome of R. irregularisDAOM-197198 (accession number HQ189519, Fig. 1).Primers and the MGB probe labeled with VIC at 5 andMGB-NFQ quencher at 3 were synthesized and validated
Table 1 Arbuscular mycorrhizal fungal strains included in thespecificity tests
Species Isolates Origin
Rhizophagus irregularis DAOM234179 Canada, Quebec
R. irregularis DAOM240422 Canada, Ontario
R. irregularis DAOM240415 Canada, Manitoba
R. irregularis DAOM234328 Unknown
R. irregularis DAOM240415 Canada, Manitoba
Rhizophagus sp. DAOM229456 Unknown
Rhizophagus fasciculatus DAOM240159 Canada, British Columbia
Rhizophagus clarus DAOM240429 Canada, Ontario
Rhizophagus sp. DAOM240422 Canada, Ontario
Rhizophagus clarus DAOM234281 Cuba, Pinar del Rio
Glomus aggregatuma DAOM240163 Tunisia
aGlomus aggregatum isolate DAOM240163 has been shown to be likelya Rhizophagus irregularis according to its complete mitochondrial ge-nome (Nadimi et al. 2016)
Mycorrhiza
Author's personal copy
by Applied Biosystems (Thermo Fisher, Burlington, ON,USA). Their specificity was first assessed by checking insilico the absence of significant similarity of our primersand probe with other known DNA sequences or with therecently published nuclear genome of R. irregularisDAOM-197198 (accession no. AUPC00000000.1,Tisserant et al. (2013)) using BLAST (Altschul et al.1990) in the NCBI GenBank public database. Tests ofspecificity were performed in qPCR using the gDNA ofvarious AMF taxa as templates, either in separate reac-tions or mixed together in the same reaction with thegDNA of R. irregularis. We mixed the DNA of isolateDAOM-197198 to the DNA of the other isolates in orderto simulate AMF community in roots in nature.Amplifications were performed in volumes of 30 μl con-taining 15 μl of TaqMan Environmental Master Mix 2.0(Applied Biosystems, Thermo Fisher, Burlington, ON,USA), 660 nM of each primer, 83 nM of TaqMan MGBProbe, and 4 μl of template DNA. The reactions werecarried out on an iCycler thermal cycler (Bio-Rad) andconsisted of an initial denaturation step at 95 °C for8 min and 30 s followed by 40 cycles at 95 °C for 15 sand 60 °C for 1 min.
Standard curve development, validation, and robustnessevaluation of the qPCR assay
Absolute quantification of the number of copies of mt ge-nomes per spore was done by standardization with respect totenfold serial dilutions of purified plasmids containing thePCR product of cox3-rnl intergene from R. irregularisDAOM-197198. The PCR product was ligated into theStrataClone™ PCR cloning vector pSC-A and transformedin the StrataClone™ SoloPack® competent cells (Stratagene,La Jolla, CA, USA). Minipreps of isolated plasmid DNAwereprepared using the illustra plasmidPrep Mini Spin Kit (GEHealthcare, Buckinghamshire, UK). Plasmid concentrationswere determined using a NanoDrop ND-1000 spectrophotom-eter (Thermo Fisher, Burlington, ON, USA) as well as Qubitfluorometric quantification using Qubit dsDNA HS Assay Kit(Life Technologies, Thermo Fisher, Burlington, ON, USA)following the manufacturer’s instructions. The purified plas-mid solution was diluted to prepare a serial tenfold standardcurve ranging from 5×10⁷ to 5×10² copies in a volume of4 μl.
The standard curve was validated as per the InternationalConference on Harmonization guideline (ICH, 1995) and the
cox3nad6
nad3nad2
atp6
cox1
nad4
L
nad1
nad4
cob
nad5
rns
atp9
atp8
cox2
rnl R. irregularis
70,800 bp
Open Reading Frames (ORFs)Ribosomal RNAsTransfer RNAsCytochromes oxydases
NADH dehydrogenasesATP synthasesGroup I introns
DNA polymerase genes (dpo)
DAOM-197198
ab
c0 kb
17.7 kb
35.4 kb
53.1 kb
CCCACCAGGGCAGATTAATC-TTCCTTTGTATTTAATTGGTAATAACCCTA
CCCACCAGGGCAAACCAATC-TTCCTTGGTATTTAATTGGTAAGAGACCTACCCTCCTGGACAGATGAGTT-TTCCTTGCCATTTGATTGGTAAAAGTCCCACCCACCAGGGCAAACCAATC-TTCCTTGGTATTTAATTGGTAAGAGACCTACCCACCAGGGCAAACCAATC-TTCCTTGGTATTTAATTGGTAAGAGACCTACCCCCCCGGACAGATTAGTT-TCCCTTGATATTTAATTGGGAGTAGTCCTACCCACCAGGGCAAACCAATC-TTCCTTGGTATTTAATTGGTAAGAGACCTACCCACCAGGGCAAACCAATC-TTCCTTGGTATTTAATTGGTAAGAGACCTACCCACCAGGGCAAACCAATC-TTCCTTGGTATTTAATTGGTAAGAGACCTACCCTCCCGGACAAATCAGTT-TTCCTTGGTGTTTTATTGGAAGAAGTCCTACCCACCAGGGCAAACCAATC-TTCCTTGGTATTTAATTGGTAAGAGACCTACCCACCAGGGCAAACCAATC-TTCCTTGGTATTTAATTGGTAAGAGACCTACCCCCCCGGACAGATTAGTT-TCCCTTGATATTTAATTGGGAGTAGTCCTA
TATATCC-CCCTGGAGTATCTG-GGGCAGGAGCCTTGA-CTGTTGCCTGTA
TATACTC-ATT-------------GGCAGGGGCT-------------TCTACATATTC-CTC-------------AGCAGGAGCTCTTA-CCGTAACCTCAATATACTC-ATT-------------GGCAGGGGCT-------------TCTATATACTC-ATT-------------GGCAGGGGCT-------------TCTATATATTC-TTT-------------GGTAGGAGCTCTCA-CAGTAGCTTGTATATACTC-ATT-------------GGCAGGGGCT-------------TCTATATACTC-ATT-------------GGCAGGGGCT-------------TCTATATACTC-ATT-------------GGCAGGGGCT-------------TCTATGTATTC-ATT-------------TATAGGTGCTTGTA-CCGTTGCTTCAATATACTC-ATT-------------GGCAGGGGCT-------------TCTATATACTC-ATT-------------GGCAGGGGCT-------------TCTATATATTC-TTT-------------GGTAGGAGCTCTCA-CAGTAGCTTGTA
CAAAGCCA
AGAAGCCAGAAACCCAAGAAGCCAAGAAGCCACAAATCCAAGAAGCCAAGAAGCCAAGAAGCCACAAAGCCAAGAAGCCAAGAAGCCACAAATCCA
R. irregularis DAOM-197198R. irregularis DAOM-234179
R. irregularis DAOM-240415R. irregularis DAOM-234328R. irregularis FACE#494R. irregularis MUCL-43204R. irregularis MUCL-46239R. irregularis MUCL-46240R. irregularis MUCL-46241R. fasciculatus DAOM-240159G. aggregatum DAOM-240163Rhizophagus sp. DAOM-240422Rhizophagus sp. DAOM-229456
Forward primer Reverse primerProbe
UFRFC
decart buSeni L
esaBRCP
Cycles0 4 8 12 16 20 24 28 32 36 40
0
50
100
-50
150
200
250
300
350
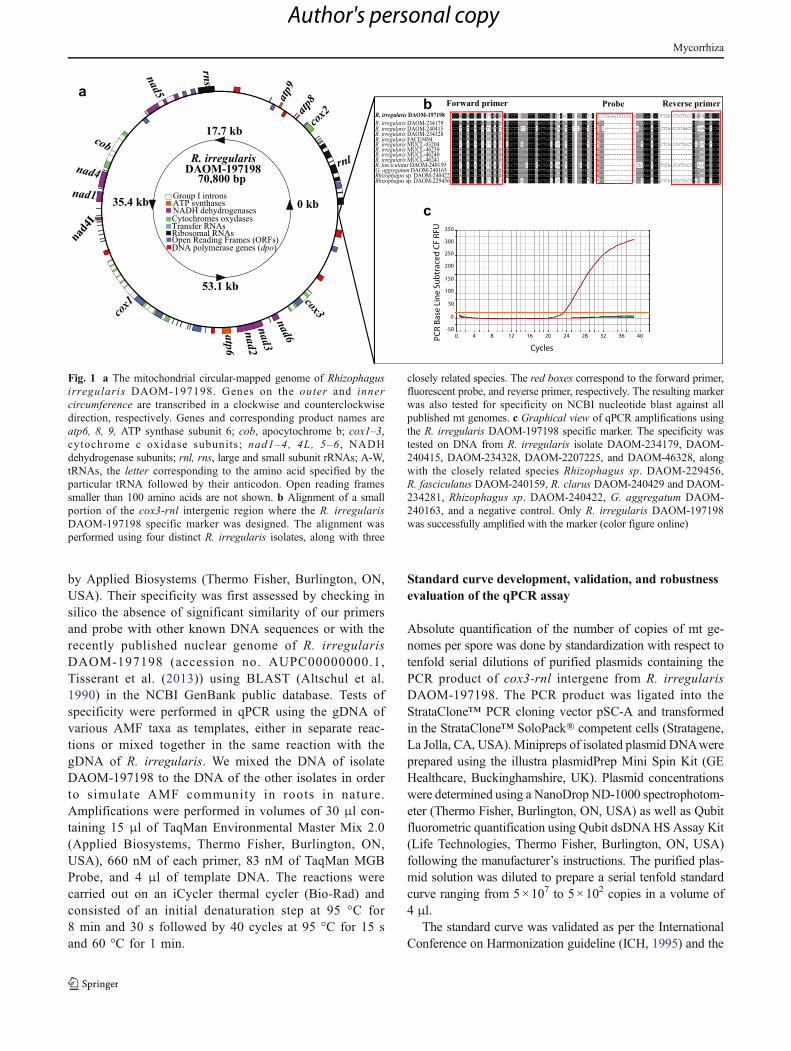
Fig. 1 a The mitochondrial circular-mapped genome of Rhizophagusirregularis DAOM-197198. Genes on the outer and innercircumference are transcribed in a clockwise and counterclockwisedirection, respectively. Genes and corresponding product names areatp6, 8, 9, ATP synthase subunit 6; cob, apocytochrome b; cox1–3,cytochrome c oxidase subunits; nad1–4, 4L, 5–6 , NADHdehydrogenase subunits; rnl, rns, large and small subunit rRNAs; A-W,tRNAs, the letter corresponding to the amino acid specified by theparticular tRNA followed by their anticodon. Open reading framessmaller than 100 amino acids are not shown. b Alignment of a smallportion of the cox3-rnl intergenic region where the R. irregularisDAOM-197198 specific marker was designed. The alignment wasperformed using four distinct R. irregularis isolates, along with three
closely related species. The red boxes correspond to the forward primer,fluorescent probe, and reverse primer, respectively. The resulting markerwas also tested for specificity on NCBI nucleotide blast against allpublished mt genomes. c Graphical view of qPCR amplifications usingthe R. irregularis DAOM-197198 specific marker. The specificity wastested on DNA from R. irregularis isolate DAOM-234179, DAOM-240415, DAOM-234328, DAOM-2207225, and DAOM-46328, alongwith the closely related species Rhizophagus sp. DAOM-229456,R. fasciculatus DAOM-240159, R. clarus DAOM-240429 and DAOM-234281, Rhizophagus sp. DAOM-240422, G. aggregatum DAOM-240163, and a negative control. Only R. irregularis DAOM-197198was successfully amplified with the marker (color figure online)
Mycorrhiza
Author's personal copy
Center for Drug Evaluation and Research (CDER, 2001).Three different tenfold serial dilutions were performed andtested over 3 days. On day 1, tenfold series of six dilutionseach were performed from the stock of plasmid DNA and sixreplications for each dilution were done in qPCR. On day 2,new tenfold serial dilutions were performed using the stock ofplasmid DNA and three replications for each dilution weredone in qPCR. This was repeated on day 3. The standardcurve was validated if the qPCR efficiency was between 90and 110 % and the correlation coefficient greater than 0.995for each real-time PCR performed and if the interassay coef-ficient of variation was lower than 7.5 %. The amplificationefficiency of a qPCR reaction is calculated based on the slopeof the standard curve according to the following formula:Efficiency=−1+10(−1/slope).
The robustness of a qPCR assay is a measure of its capa-bility to remain unaffected by small but deliberate variationsduring the procedure, which highlights its reliability duringroutine usage. The influence of a 10 % variation of MasterMix, primers, and probe in the final reaction volume wasanalyzed to assess the robustness of the qPCR assay.
Determination of mt genome copy number per sporeand its validation
To assess the number of mt genome copies per spore in simpleliquid suspension, we used six (6) qPCR assays on five knownconcentrations of spores that were manually counted: 50, 100,200, 400, and 800 spores. Six qPCR experiments were per-formed over 2 days. To validate the determined mt copy num-ber per spore, three different experiments were performedacross 3 days with known concentrations of spores: day 1,eight replicates of 100, 200, and 400 spores; days 2 and 3,four replicates each, totaling 16 qPCR assays. gDNA wasisolated from each spore suspension of R. irregularisDAOM-197198 using the PowerSoil DNA Isolation Kit, ac-cording to the protocol described above. Three technical rep-licates for each sample were performed in qPCR.
Limit of detection and limit of quantification
The method proposed by Shrivastava and Gupta (2011) wasused to calculate the LOD and LOQ of the qPCR assay. For alinear regression, LOD and LOQ can be expressed asLOD=3Sa / b and LOQ=10Sa / b, where Sa is the standarddeviation of y-intercepts of regression lines and b is the slopeof the calibration curve. LOD and LOQ were calculated basedon the analysis of 0, 5, 25, and 50 spores in triplicate.
Assessing the precision of the qPCR assay
The precision of the qPCR assay was assessed using spores incomplex liquid formulation and in dry formulation. For spores
in complex liquid formulation, total DNA was isolated fromthree samples containing 100, 200, and 400 spores per milli-liter of R. irregularis DAOM-197198 using the PowerSoilDNA Isolation Kit, as described above. Each spore solutionwas sampled on three different days with respectively eight,four, and four replicates. Three technical replicates were per-formed in qPCR. The qPCR reactions were run independentlyfor each assay. The quantification calculation for the threeassays was based on the same standard curve. This experimen-tal design was analyzed with a repeated measures ANOVA.
The same experimental design was applied to assess theprecision of the qPCR assay on spores in dry formulation,except that total DNAwas isolated from two samples contain-ing 3200 and 35,000 spores per gram of R. irregularisDAOM-197198 using the NucleoSpin® Soil Isolation Kit, asdescribed above.
Finally, the quantitative values obtained with the qPCRassay on 20 blind samples (these samples were provided byPremier Tech and their concentration was kept secret) fromcomplex liquid formulations and 20 samples from dry formu-lations were compared with the concentration of viable andtotal spore number determined by MTT (3-(4,5-dimethyl-thiazol-2-yl)-2, 5-diphenyltetrazolium bromide) colorimetricassay (Mosmann, 1983). DNA isolation was performed intriplicate for each sample, and three technical replicates wereused in qPCR. For both formulations, MTT and qPCR resultswere compared using a t test for dependent samples. The nullhypothesis consists in the mean of the differences from thepaired samples being equal to zero.
In order to determine the number of viable and total sporesusing MTT staining of liquid formulations, 0.5 mL of sporesuspensions of 400 spores per milliliter was collected andmixed with 0.5 mL of MTT solution (0.5 %) and incubatedprior to the stereomicroscope observation, while 5 g of solidformulations (PS3) was weighed and passed through a wetsieve using a 38-μm opening sieve. Spores were then collect-ed and resuspended in water to obtain a spore suspension of400 spores per milliliter followed by MTT staining. A deter-mined fraction of MTT-stained spores was manually countedunder a stereomicroscope. MTT-stained spores (red color)were considered to be viable while non-stained spores wereconsidered to be dead spores.
Intermediate precision
According to the ICH (2005), the intermediate precisioncovers the various influences within a laboratory and gives afirst indication of the future transferability of an analyticalmethod. In the present study, two different laboratory opera-tors conducted intermediate precision on three different days.Every day, each operator took three samples from the samebatch of spores in complex liquid formulation and subsequent-ly extracted DNA and performed qPCR using the same
Mycorrhiza
Author's personal copy
procedures described above. Data were analyzed through afactorial design ANOVA.
Tests for spore conservation and DNA stability usingqPCR assay
In order to evaluate the potential of the qPCR assay for qualitycontrol, we performed additional tests in which we simulatedthe impact of the transport conditions on the stability ofspores. We used three different batches of spores in complexliquid formulation that were kept at three temperatures: 4, 22,and 32 °C. Samples of 200 spores were collected at differenttime points, 0, 24, 72, and 168 h, and they were subjected toDNA extraction followed by qPCR assay in three replicates asdescribed above. To assess spore storage conditions, we useda time-frame of 6 months during which 18 aliquots of 200spores each were stored at −20 °C. At each time point (0, 1,3, and 6 months), six aliquots were taken from the freezer andsubjected to DNA extraction and qPCR in three replicates. Wealso used three fresh samples as a control.
For DNA stability, the effect of time and temperature (4 and−20 °C) on the qPCR assay was analyzed. DNA of six sam-ples of 200 spores was extracted. Two extracted DNA sampleswere pooled resulting in three different DNA pools. EachDNA pool was divided in eight aliquots. Four aliquots werekept at 4 °C while the remaining four aliquots were stored at−20 °C for each DNA pool. At different time points, 0, 24, 48,and 72 h, three aliquots of each DNA pool were taken andsubjected to qPCR assay in three replicates each.
Data from the transport condition experiment and stabilityof extracted DNA were analyzed through repeated measuresANOVA, whereas long-term storage of frozen spores wasanalyzed with a one-way ANOVA.
Statistical analysis
Statistical tests described above were performed with Prismversion 5 (GraphPad software, California) and Statistica ver-sion 7 (StatSoft).
Results and discussion
Rhizophagus irregularis DAOM-197198 specific real-timePCR marker
The comparative analyses of mt genomes between closelyrelated isolates and species to R. irregularis DAOM-197198(Formey et al. 2012; Beaudet et al. 2013a, 2013b, Nadimiet al. 2015) showed that most of the differences observed arecaused by the presence of a large number of mobile elementsof different lengths, orientations, and degrees of erosion suchas plasmid-related DNA polymerase, small inverted repeats,
and homing endonuclease genes. Based on the alignment of14 mitochondrial genomes, including numerous R. irregularisisolates and closely related species, primers and probe specificto R. irregularis DAOM-197198 were designed to target thehyper-variable cox3-rnl intergene of the mt genome, which isa large region comprising substantial sequence divergence(Fig. 1a, b). The primer sets 197198F and 197198R amplifieda fragment of 106 bp, and their specificity was assessed insilico using NCBI BLAST on all mt genomes published sofar. No cross-specificity was observed with otherR. irregularis isolates or its closely related species (Table 1),thus confirming its usefulness in detecting and quantifyingR. irregularis DAOM-197198. The primers and probe speci-ficity were also experimentally validated by a quantitativereal-time PCR assay (Fig. 1c). DNA of transformed carrotroots was also used in our specificity tests where no amplifi-cation has been observed. Since mt genomes in AMF areassumed to be homoplasmic (Lee and Young 2009; Formeyet al. 2012; Beaudet et al. 2013a, 2013b; la Providencia et al.2013), a TaqMan assay targeting single-copy mt intergenicregions is expected to be more accurate and precise than quan-tification based on polymorphic and putative tandem-repeatrDNA sequences (Sanders et al. 1995; Clapp et al. 1999;2001) in potentially heterogeneous nuclear genomes.
It has been shown that mitochondrial DNA copies(numts) can be present in the nuclear genome of AMF(Lee and Young 2009; Beaudet et al. 2015), so we per-formed numt searches—no numt of the cox3-rnl regionwere found in the nuclear genome of R. irregularisDAOM-197198 (Lin et al. 2014; Beaudet et al. 2015).Furthermore, it has been shown that compatible AMF iso-lates can perform anastomosis and exchange genetic ma-terial, including mitochondrial DNA (de la Providenciaet al. 2013), giving rise to a heteroplasmic state whererecombination can occur (Beaudet et al. 2013a, 2013b).This process could hamper the detection of the rightfulisolate in natural or agricultural condition if hybrids arecreated through this process, but this heteroplasmic statehas been shown to be rapidly lost in vitro throughsubcultivation (Daubois et al. 2016). The isolate-specificmitochondrial quantification assay presented in this studynot only paves the way to use this methodology in a broadrange of species but will also allow targeting of agricul-turally important AMF families such as the Glomeraceaeby using conserved mt protein-coding genes.
Validation and robustness of standard curve and copynumber determination of mt genome per spore
Standard curve validation was successful since each am-plification of the standard curve had an efficiency rangingfrom 98.32 to 105.74 % and a correlation coefficient of0.999, and the interassay coefficient of variation was lower
Mycorrhiza
Author's personal copy
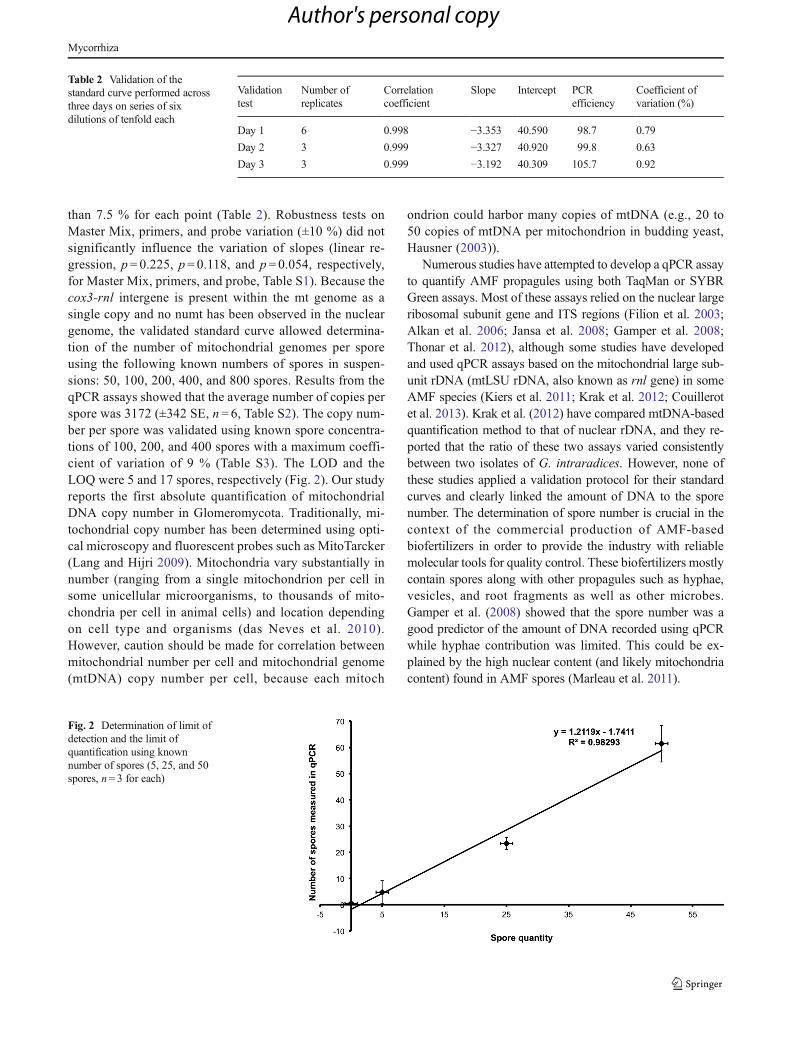
than 7.5 % for each point (Table 2). Robustness tests onMaster Mix, primers, and probe variation (±10 %) did notsignificantly influence the variation of slopes (linear re-gression, p= 0.225, p= 0.118, and p= 0.054, respectively,for Master Mix, primers, and probe, Table S1). Because thecox3-rnl intergene is present within the mt genome as asingle copy and no numt has been observed in the nucleargenome, the validated standard curve allowed determina-tion of the number of mitochondrial genomes per sporeusing the following known numbers of spores in suspen-sions: 50, 100, 200, 400, and 800 spores. Results from theqPCR assays showed that the average number of copies perspore was 3172 (±342 SE, n= 6, Table S2). The copy num-ber per spore was validated using known spore concentra-tions of 100, 200, and 400 spores with a maximum coeffi-cient of variation of 9 % (Table S3). The LOD and theLOQ were 5 and 17 spores, respectively (Fig. 2). Our studyreports the first absolute quantification of mitochondrialDNA copy number in Glomeromycota. Traditionally, mi-tochondrial copy number has been determined using opti-cal microscopy and fluorescent probes such as MitoTarcker(Lang and Hijri 2009). Mitochondria vary substantially innumber (ranging from a single mitochondrion per cell insome unicellular microorganisms, to thousands of mito-chondria per cell in animal cells) and location dependingon cell type and organisms (das Neves et al. 2010).However, caution should be made for correlation betweenmitochondrial number per cell and mitochondrial genome(mtDNA) copy number per cell, because each mitoch
ondrion could harbor many copies of mtDNA (e.g., 20 to50 copies of mtDNA per mitochondrion in budding yeast,Hausner (2003)).
Numerous studies have attempted to develop a qPCR assayto quantify AMF propagules using both TaqMan or SYBRGreen assays. Most of these assays relied on the nuclear largeribosomal subunit gene and ITS regions (Filion et al. 2003;Alkan et al. 2006; Jansa et al. 2008; Gamper et al. 2008;Thonar et al. 2012), although some studies have developedand used qPCR assays based on the mitochondrial large sub-unit rDNA (mtLSU rDNA, also known as rnl gene) in someAMF species (Kiers et al. 2011; Krak et al. 2012; Couillerotet al. 2013). Krak et al. (2012) have compared mtDNA-basedquantification method to that of nuclear rDNA, and they re-ported that the ratio of these two assays varied consistentlybetween two isolates of G. intraradices. However, none ofthese studies applied a validation protocol for their standardcurves and clearly linked the amount of DNA to the sporenumber. The determination of spore number is crucial in thecontext of the commercial production of AMF-basedbiofertilizers in order to provide the industry with reliablemolecular tools for quality control. These biofertilizers mostlycontain spores along with other propagules such as hyphae,vesicles, and root fragments as well as other microbes.Gamper et al. (2008) showed that the spore number was agood predictor of the amount of DNA recorded using qPCRwhile hyphae contribution was limited. This could be ex-plained by the high nuclear content (and likely mitochondriacontent) found in AMF spores (Marleau et al. 2011).
Table 2 Validation of thestandard curve performed acrossthree days on series of sixdilutions of tenfold each
Validationtest
Number ofreplicates
Correlationcoefficient
Slope Intercept PCRefficiency
Coefficient ofvariation (%)
Day 1 6 0.998 −3.353 40.590 98.7 0.79
Day 2 3 0.999 −3.327 40.920 99.8 0.63
Day 3 3 0.999 −3.192 40.309 105.7 0.92
Fig. 2 Determination of limit ofdetection and the limit ofquantification using knownnumber of spores (5, 25, and 50spores, n= 3 for each)
Mycorrhiza
Author's personal copy
Precision and intermediate precision of the qPCR assay
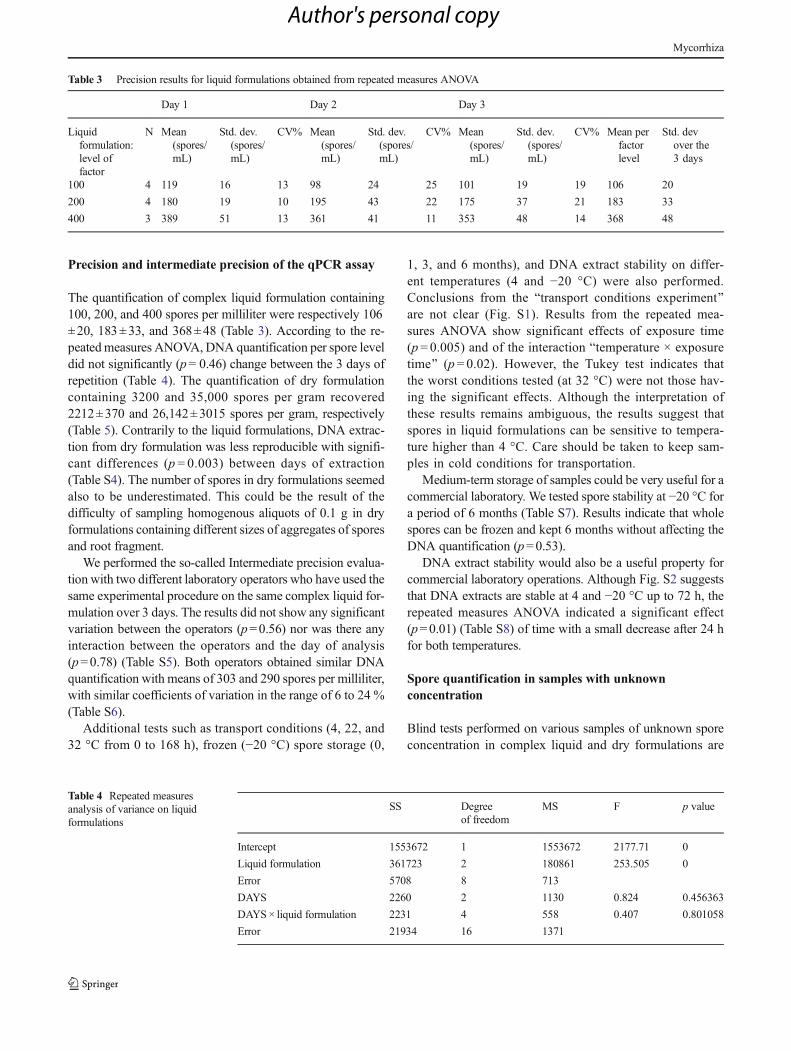
The quantification of complex liquid formulation containing100, 200, and 400 spores per milliliter were respectively 106±20, 183±33, and 368±48 (Table 3). According to the re-peatedmeasures ANOVA, DNA quantification per spore leveldid not significantly (p=0.46) change between the 3 days ofrepetition (Table 4). The quantification of dry formulationcontaining 3200 and 35,000 spores per gram recovered2212±370 and 26,142±3015 spores per gram, respectively(Table 5). Contrarily to the liquid formulations, DNA extrac-tion from dry formulation was less reproducible with signifi-cant differences (p = 0.003) between days of extraction(Table S4). The number of spores in dry formulations seemedalso to be underestimated. This could be the result of thedifficulty of sampling homogenous aliquots of 0.1 g in dryformulations containing different sizes of aggregates of sporesand root fragment.
We performed the so-called Intermediate precision evalua-tion with two different laboratory operators who have used thesame experimental procedure on the same complex liquid for-mulation over 3 days. The results did not show any significantvariation between the operators (p=0.56) nor was there anyinteraction between the operators and the day of analysis(p=0.78) (Table S5). Both operators obtained similar DNAquantification with means of 303 and 290 spores per milliliter,with similar coefficients of variation in the range of 6 to 24 %(Table S6).
Additional tests such as transport conditions (4, 22, and32 °C from 0 to 168 h), frozen (−20 °C) spore storage (0,
1, 3, and 6 months), and DNA extract stability on differ-ent temperatures (4 and −20 °C) were also performed.Conclusions from the Btransport conditions experiment^are not clear (Fig. S1). Results from the repeated mea-sures ANOVA show significant effects of exposure time(p= 0.005) and of the interaction Btemperature × exposuretime^ (p= 0.02). However, the Tukey test indicates thatthe worst conditions tested (at 32 °C) were not those hav-ing the significant effects. Although the interpretation ofthese results remains ambiguous, the results suggest thatspores in liquid formulations can be sensitive to tempera-ture higher than 4 °C. Care should be taken to keep sam-ples in cold conditions for transportation.
Medium-term storage of samples could be very useful for acommercial laboratory. We tested spore stability at −20 °C fora period of 6 months (Table S7). Results indicate that wholespores can be frozen and kept 6 months without affecting theDNA quantification (p=0.53).
DNA extract stability would also be a useful property forcommercial laboratory operations. Although Fig. S2 suggeststhat DNA extracts are stable at 4 and −20 °C up to 72 h, therepeated measures ANOVA indicated a significant effect(p=0.01) (Table S8) of time with a small decrease after 24 hfor both temperatures.
Spore quantification in samples with unknownconcentration
Blind tests performed on various samples of unknown sporeconcentration in complex liquid and dry formulations are
Table 3 Precision results for liquid formulations obtained from repeated measures ANOVA
Day 1 Day 2 Day 3
Liquidformulation:level offactor
N Mean(spores/mL)
Std. dev.(spores/mL)
CV% Mean(spores/mL)
Std. dev.(spores/mL)
CV% Mean(spores/mL)
Std. dev.(spores/mL)
CV% Mean perfactorlevel
Std. devover the3 days
100 4 119 16 13 98 24 25 101 19 19 106 20
200 4 180 19 10 195 43 22 175 37 21 183 33
400 3 389 51 13 361 41 11 353 48 14 368 48
Table 4 Repeated measuresanalysis of variance on liquidformulations
SS Degreeof freedom
MS F p value
Intercept 1553672 1 1553672 2177.71 0
Liquid formulation 361723 2 180861 253.505 0
Error 5708 8 713
DAYS 2260 2 1130 0.824 0.456363
DAYS× liquid formulation 2231 4 558 0.407 0.801058
Error 21934 16 1371
Mycorrhiza
Author's personal copy
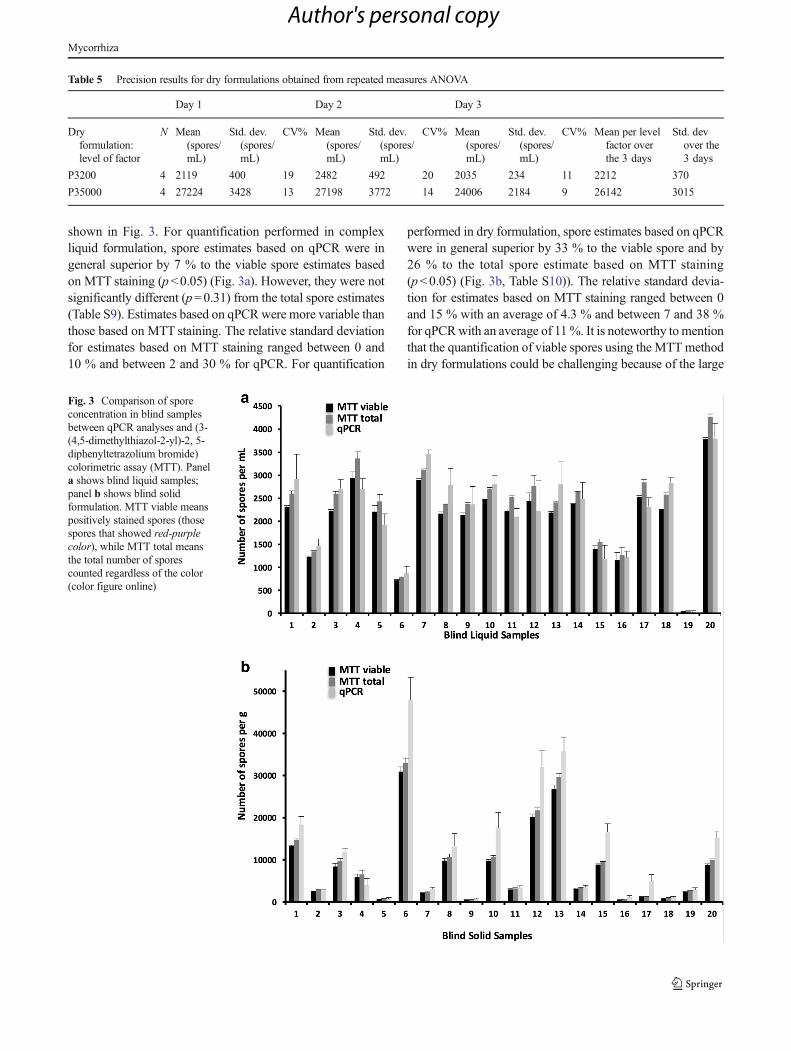
shown in Fig. 3. For quantification performed in complexliquid formulation, spore estimates based on qPCR were ingeneral superior by 7 % to the viable spore estimates basedon MTT staining (p<0.05) (Fig. 3a). However, they were notsignificantly different (p=0.31) from the total spore estimates(Table S9). Estimates based on qPCR were more variable thanthose based on MTT staining. The relative standard deviationfor estimates based on MTT staining ranged between 0 and10 % and between 2 and 30 % for qPCR. For quantification
performed in dry formulation, spore estimates based on qPCRwere in general superior by 33 % to the viable spore and by26 % to the total spore estimate based on MTT staining(p<0.05) (Fig. 3b, Table S10)). The relative standard devia-tion for estimates based on MTT staining ranged between 0and 15 % with an average of 4.3 % and between 7 and 38 %for qPCRwith an average of 11%. It is noteworthy tomentionthat the quantification of viable spores using the MTT methodin dry formulations could be challenging because of the large
Table 5 Precision results for dry formulations obtained from repeated measures ANOVA
Day 1 Day 2 Day 3
Dryformulation:level of factor
N Mean(spores/mL)
Std. dev.(spores/mL)
CV% Mean(spores/mL)
Std. dev.(spores/mL)
CV% Mean(spores/mL)
Std. dev.(spores/mL)
CV% Mean per levelfactor overthe 3 days
Std. devover the3 days
P3200 4 2119 400 19 2482 492 20 2035 234 11 2212 370
P35000 4 27224 3428 13 27198 3772 14 24006 2184 9 26142 3015
Fig. 3 Comparison of sporeconcentration in blind samplesbetween qPCR analyses and (3-(4,5-dimethylthiazol-2-yl)-2, 5-diphenyltetrazolium bromide)colorimetric assay (MTT). Panela shows blind liquid samples;panel b shows blind solidformulation. MTT viable meanspositively stained spores (thosespores that showed red-purplecolor), while MTT total meansthe total number of sporescounted regardless of the color(color figure online)
Mycorrhiza
Author's personal copy
Tab
le6
Workflowandexperimentalp
rocedure
used
todevelopandvalid
atetheqP
CRassayfortheabsolutequantificationof
spores
oftheisolateR.irregularisDAOM-197198
Workflow
Experim
entalp
rocedure
andvariables
Measurement
Passcriterion
Developmentand
specificity
testsof
qPCRassayof
R.irregularisDAOM-197198
Insilicoanalysisof
mtDNAsequences
Alignm
ento
fpublically
availablemtDNAof
AMF;
identificationof
polymorphicregions;design
ofprim
ers
andprobe;comparisonandBLASTsearches
ofsequence
similarity
inpublicdatabases
Percentage
ofnucleotidesequence
similarity
Confirm
ationof
prim
ers
andprobespecificity
insilico
Specificity
testsusingconventionalP
CRandqP
CRof
individualsamples
11non-targetisolates
closelyrelatedto
R.irregularis
DAOM-197198listedin
Table1,andDNAfrom
carrot
roots
PCRandqP
CRsignals
Nodetectablesignal
Specificity
testsin
mixed
reactions
(multiplexesreactions)
inqP
CR
DNAfrom
11non-targetAMF(Table1)
andcarrot
rootsmixed
andused
asatemplatein
qPCR
qPCRsignal
Nodetectablesignal
Standard
curvedevelopm
entand
evaluatio
nValidation
Three
qPCRassays
performed
during
3days
(one
qPCRassayperday)
qPCRefficiency
90–110
%Correlatio
ncoefficient
≤0.995
Interassay
coefficiento
fvariation
≤10%
Robustness
10%
variationof
MasterMix,primers,andprobein
thefinalreaction
volume
qPCRefficiency
90–110
%Correlatio
ncoefficient
≤0.995
Interassay
coefficiento
fvariation
Not
significant
Spores
quantification
Determinationof
mtg
enom
ecopy
numberperspore
Five
know
nconcentrations
ofspores
(manually
counted)
SixqP
CRassays
performed
during
2days
Average
numberof
copies
perspore
Not
applicable
Validationof
thecopy
numberof
mtg
enom
eperspore
Three
know
nconcentrations
ofspores
(theoreticalconcentration,i.e.,obtained
bydilutio
n)SixteenqP
CRassays
performed
during
3days
Interassay
coefficiento
fvariation
≤10%
Performance
ofsporequantification
Lim
itofdetection(LOD)and
limitof
quantification(LOQ)
Four
know
nconcentrations
ofspores
(manually
counted)
Methodproposed
bySh
rivastavaandGupta
(2011)
Not
applicable
Precisionin
liquidform
ulation
Three
know
nconcentrations
ofspores
(theoreticalconcentration,i.e.,
obtained
bydilution)
SixteenqP
CRassays
performed
during
3days
Intra-assayandinterassay
coefficiento
fvariation
Not
significant(p<0.05)
Precisionin
dryform
ulation
Twoknow
nconcentrations
ofspores
(theoreticalconcentration,i.e.,
obtained
bydilutio
n)SixteenqP
CRassays
performed
during
3days
Intra-assayandinterassay
coefficiento
fvariation
Not
significant(p<0.05)
Interm
ediateprecision
Twodifferento
perators
qPCRassays
performed
during
threedifferentd
ays
Interoperatorcoefficiento
fvariation
Not
significant(p<0.05)
Exactitu
dein
liquidanddryform
ulations
Twenty
blindsamples
from
each
form
ulationweretested
Com
parisonof
sporeestim
ates
with
theMTT
staining
method
Not
applicable
Stability
ofanalyzed
samples
inindustrialprocess
Resilience
ofspores
Three
temperaturesweretested;fourtim
epoints;six
replicates
Intra-assayandinterassay
coefficiento
fvariation
Ambiguousresults
Conservationof
spores
at−2
0°C
Four
timepointsover
6months;sixreplicates
Intra-assayandinterassay
coefficiento
fvariation
Not
significant(p=0.53)
DNAstability
Twotemperatures;four
timepoints;three
samples
replicates
Intra-assayandinterassay
coefficiento
fvariation
Significant(p=0.01)
Mycorrhiza
Author's personal copy
amount of root debris and aggregates. Spores are found tocluster in the roots, and this can cause significant variationsbetween estimates from different operators depending on theirlevel of experience. Because of the small amount of materialused for DNA quantification (0.1 g), the qPCR assay wouldalso be affected by spore clustering in the roots. Variation ofthe estimates of qPCR is most likely caused by the difficultyof obtaining consistent weight of 0.1 g per sample of a poten-tially not entirely homogenous material versus 5 g samplesused in MTT staining. In addition, solid formulations can re-sult in the formation of aggregates of propagules, which canintroduce bias.
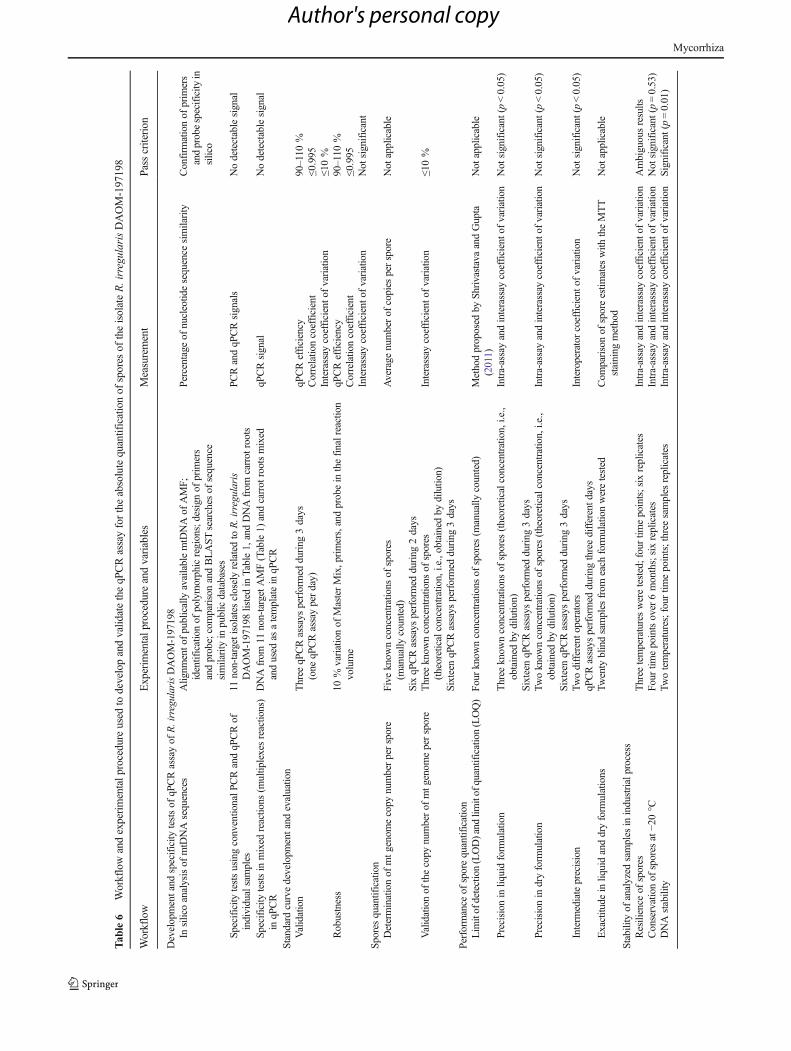
Together, all these tests (summarized in Table 6) demon-strate that our qPCR assay is relatively robust and has thepotential to be used routinely. Commercial laboratories inter-ested to offer the qPCR service for end-users have to validatethe qPCR assay according to their equipment and operators.We are confident that qPCR assay could replace the conven-tional MTT staining method at least when the volume of sam-ples is important, the principal advantage of qPCR being au-tomation of the process and time (qPCR assay can be done inless than 4 h). Of course, conventional methods of numeratingAMF propagules in liquid formulations based on MTT stain-ing and microscopy can give precise results with well-trainedoperators. But when comes numeration in solid formulations,it becomes fastidious, time consuming, and less precise.
Conclusion
We report a new qPCR assay specifically designed to detectand quantify spores of the model AMF R. irregularis isolateDAOM-197198. This strain is of major importance as it hasbeen used worldwide in commercial inoculants since the1990s. We also demonstrate the usefulness of the mitochon-drial genomes in developing efficient biomarkers in AMF.Although repetitions are needed in order to confirm the differ-ent results, we performed numerous validation tests andshowed that our qPCR assay is robust and reliable. qPCRassays, compared with conventional microscopic estimationof AMF spores, have the advantage of quickly and efficientlyidentifying the isolate of interest even if mixed with otherAMF spores or found in a complex matrix, as well as rigor-ously quantifying AMF abundance in a large number of sam-ples. The former advantage is of interest for quality control ofcommercial products using R. irregularis spores. Regardingenvironmental studies focusing on presence and abundance ofAMF in soil samples and plant roots, the assay could be veryattractive although more work is required to demonstrate theabsence of interferences in the extraction of DNA soil sam-ples. Since DNA quantification requires very small samples,the question of the representativeness would also arise quick-ly. Caution should also bemade to interpret the results of spore
quantification of inoculants in which spores could germinate,if not stored adequately because their germination may influ-ence mtDNA copy number per propagule. Further experi-ments are needed to correlate AMF biomass, function, andmtDNA copy number in order to efficiently trace AMF inoc-ulants in crop roots and agricultural soils. Nonetheless, webelieve that our experimental procedure and validation proto-col can be applied to a wide range of AMF taxa as well as toother crop beneficial microorganisms if additional isolate-specific primers and probes were developed.
Acknowledgements This work is a part of a research project organizedand coordinated by Premier Tech. The authors are grateful for financialsupport from NSERC Cooperative Research and Development (grantnumber CRDJP 468828-14), Premier Tech, and CRIBIQ. We would liketo thank Dr. Serge Gagné, Dr. Younes Machrafi, Nicolas Bertrand, ÉricDion, François Gobeil, and Dr Alain Bélanger for recommendations andcomments. We also thank Dr. David Morse and Dr. Karen Fisher-Favretfor English editing and Dr D. Janos and two anonymous reviewers fortheir helpful comments.
References
Alkan N, Gadkar V, Coburn J, Yarden O, Kapulnik Y (2004)Quantification of the arbuscular mycorrhizal fungus Glomusintraradices in host tissue using real-time polymerse chain reaction.New Phytol 161:877–885
Alkan N, Gadkar V, Yarden O, Kapulnik Y (2006) Analysis of quantita-tive interactions between two species of arbuscular mycorrhizal fun-gi, Glomus mosseae and G. intraradices, by real-time PCR. ApplEnviron Microbiola 72:4192–4199
Altschul SF, GishW,MillerW,Myers EW, Lipman DJ (1990) Basic localalignment search tool. J Mol Biol 215:403–410
Beaudet D, de IE l P, Labridy M et al (2015) Intraisolate mitochondrialgenetic polymorphism and gene variants coexpression in arbuscularmycorrhizal fungi. Genome Biol Evol 7:218–227
Beaudet D, Nadimi M, Hijri M (2013a) Rapid mitochondrial genomeevolution through invasion of mobile elements in two closely relatedspecies of arbuscular mycorrhizal fungi. PLoS One 8:e60768
Beaudet D, Terrat Y, Halary S, de la Providencia IE, Hijri M (2013b)Mitochondrial genome rearrangements in Glomus species triggeredby homologous recombination between distinct mtDNA haplotypes.Genome Biol Evol 5:1628–1643
Boon E, Zimmerman E, Lang BF, Hijri M (2010) Intra-isolate genomevariation in arbuscular mycorrhizal fungi persists in the tran-scriptome. J Evol Biol 23:1519–1527
Center for Drug Evaluation and Research (2001) Guidance for IndustryBioanalytical Method Validation. http://www.fda.gov/downloads/Drugs/…/Guidances/ucm070107.pdf. Accessed 22 December 2015.
Clapp J, Fitter AH, Young JP (1999) Ribosomal small subunit sequencevariation within spores of an arbuscular mycorrhizal fungus,Scutellospora sp. Mol Ecol 8:915–921
Clapp J, Rodriguez A, Dodd C (2001) Inter- and intra-isolate rRNA largesubunit variation in Glomus coronatum spores. New Phytol 149:539–554
Corradi N, Croll D, Colard A, Kuhn G, Ehinger M, Sanders IR (2007)Gene copy number polymorphisms in an arbuscular mycorrhizalfungal population. Appl Environ Microbiol 73:366–369
Couillerot O, Ramirez-Trujillo A, Walker V, von Felten A, Jansa J,Maurhofer M, Défago G, Prigent-Combaret C, Comte G,Caballero-Mellado J, Moënne-Loccoz Y (2013) Comparison of
Mycorrhiza
Author's personal copy
prominent Azospirillum strains in Azospirillum-Pseudomonas-Glomus consortia for promotion of maize growth. Appl MicrobiolBiotechnol 97:4639–4649
Daubois L, Beaudet D, Hijri M, de la Providencia IE (2016) Independentmitochondrial and nuclear exchanges arising in Rhizophagusirregularis crossed-isolates support the presence of a mitochondrialsegregation mechanism. BMC Microbiol 16(11)
das Neves RP, Jones NS, Andreu L, Gupta R, Enver T et al (2010)Connecting variability in global transcription rate to mitochondrialvariability. PLoS Biol 8(12):e1000560
de la Providencia IE, Nadimi M, Beaudet D, Morales GR, Hijri M (2013)Detection of a transient mitochondrial DNA heteroplasmy in theprogeny of crossed genetically divergent isolates of arbuscular my-corrhizal fungi. New Phytol 200:211–221
Filion M, St-Arnaud M, Jabaji-Hare SH (2003) Direct quantification offungal DNA from soil substrate using real-time PCR. J MicrobiolMethods 53:67–76
Formey D,MolèsM, Haouy A, Savelli B, Bouchez O, Becard G, Roux C(2012) Comparative analysis of mitochondrial genomes ofRhizophagus irregularis—syn. Glomus irregulare—reveals a poly-morphism induced by variability generating elements. New Phytol196:1217–1227
Fortin JA, Plenchette C, Piché Y (2015) Les mycorhizes, Multimondesth ednGamper HA, Young JPW, Jones DL, HodgeA (2008) Real-time PCR and
microscopy: are the two methods measuring the same unit ofarbuscular mycorrhizal fungal abundance? Fungal Genet Biol 45:581–596
Gianinazzi S, Gollotte A, Binet M-N et al (2010) Agroecology: the keyrole of arbuscular mycorrhizas in ecosystem services. Mycorrhiza20:519–530
Giovannetti M, Azzolini D, Citernesi AS (1999) Anastomosis formationand nuclear and protoplasmic exchange in arbuscular mycorrhizalfungi. Appl Environ Microbiol 65:5571–5575
Hausner G (2003) Fungal mitochondrial genomes, plasmids and introns.Appl Environ Microbiol 3:101–131
Hijri M, Niculita H, Sanders IR (2007) Molecular characterization ofchromosome termini of the arbuscular mycorrhizal fungus Glomusintraradices (Glomeromycota). Fungal Genet Biol 44:1380–1386
Hijri M, Sanders IR (2005) Low gene copy number shows that arbuscularmycorrhizal fungi inherit genetically different nuclei. Nature 433:160–163
Hijri M (2016) Analysis of a large dataset form field mycorrhizal inocu-lation trials on potato showed highly significant increase in yield.Mycorrhiza 26(3):209–214
International Conference on Harmonization guideline (1995) Structureand content of clinical study Reports E3. http://www.ich.org/fileadmin/Public_Web_Site/ICH_Products/Guidelines/Efficacy/E3/E3_Guideline.pdf
International Conference on Harmonization (ICH). Technical require-ments for registration of pharmaceuticals for human use. Topic Q2(R1): Validation of analytical procedures: text and methodology.Geneva, Switzerland, 2005. http://www.ich.org/fileadmin/Public_Web_Site/ICH_Products/Guidelines/Quality/Q2_R1/Step4/Q2_R1__Guideline.pdf Accessed 22 December 2015.
Isayenkov S, Fester T, Hause B (2004) Rapid determination of fungalcolonization and arbuscule formation in roots ofMedicago truncatulausing real-time (RT) PCR. J Plant Physiol 161:1379–1383
Jansa J, Smith FA, Smith SE (2008) Are there benefits of simultaneousroot colonization by different arbuscular mycorrhizal fungi? NewPhytol 177:779–789
Kiers ET, Duhamel M, Beesetty Y, Mensah JA, Franken O, VerbruggenE, Fellbaum CR, Kowalchuk GA, Hart MM, Bago A, Palmer TM,West SA, Vandenkoornhuyse P, Jansa J, Bucking H (2011)Reciprocal rewards stabilize cooperation in the mycorrhizal symbi-osis. Science 333:880–882
Koide RT, Mosse B (2004) A history of research on arbuscular mycor-rhiza. Mycorrhiza 14:145–163
Krak K, Janouskova M, Caklova P, Vosatka M, Storchova H (2012)Intraradical dynamics of two coexisting isolates of the arbuscularmycorrhizal fungus Glomus intraradices sensu lato as estimatedby real-time PCR of mitochondrial DNA. Appl Environ Microbiol78(10):3630–3637
Lang BF, Hijri M (2009) The complete Glomus intraradices mitochon-drial genome sequence—a milestone in mycorrhizal research. NewPhytol 183:3–6
Lee J, Young JPW (2009) The mitochondrial genome sequence of thearbuscular mycorrhizal fungus Glomus intraradices isolate 494 andimplications for the phylogenetic placement ofGlomus. New Phytol183:200–211
Lin K, Limpens E, Zhang Z et al (2014) Single nucleus genome sequenc-ing reveals high similarity among nuclei of an endomycorrhizalfungus. PLoS Genet 10:e1004078
Marleau J, Dalpé Y, St-ArnaudM, HijriM (2011) Spore development andnuclear inheritance in arbuscular mycorrhizal fungi. BMC Evol Biol11:51
Mosmann T (1983) Rapid colorimetric assay for cellular growth andsurvival: application to proliferation and cytotoxicity assays. JImmunol Methods 65(1–2):55–63
Nadimi M, Stefani FOP, Hijri M (2015) Themitochondrial genome of theglomeromycete Rhizophagus sp. DAOM 213198 reveals an unusualorganization consisting of two circular chromosomes. Genome BiolEvol 7(1):96–105
Nadimi M, Daubois L, Hijri M (2016) Mitochondrial comparative geno-mics and phylogenetic signal assessment of mtDNA amongarbuscular mycorrhizal fungi. Mol Phylogenet Evol. doi:10.1016/j.ympev.2016.01.009, In Press
Nadimi M, Beaudet D, Forget L, Hijri M, Lang BF (2012) GroupI intron-mediated trans-splicing in mitochondria of Gigasporarosea and a robust phylogenetic affiliation of arbuscular my-corrhizal fungi with Mortierellales. Mol Biol Evol 29(9):2199–2210
Peyret-Guzzon M, Stockinger H, Bouffaud M-L, Farcy P, Wipf D,Redecker D (2016) Arbuscular mycorrhizal fungal communitiesand Rhizophagus irregularis populations shift in response to short-term ploughing and fertilisation in a buffer strip. Mycorrhiza 26:33–46
Podeszfinski C, Dalpé Y, Charest C (2002) In situ turfgrass establishment:I. Responses to arbuscular mycorrhizae and fertilization. J SustainAgric 20:57–74
Raab PA, BreenwaldA, Redecker D (2005)Mitochondrial large ribosom-al subunit sequences are homogeneous within isolates of Glomus(arbuscular mycorrhizal fungi, Glomeromycota). Mycol Res 109:1315–1322
Redecker D, Hijri M, Dulieu H, Sanders IR (1999) Phylogenetic analysisof a dataset of fungal 5.8S rDNA sequences shows that highly di-vergent copies of internal transcribed spacers reported fromScutellospora castanea are of ascomycete origin. Fungal GenetBiol 28:238–244
Sanders IR, Alt M, Groppe K, Boller T, Wiemken A (1995)Identification of ribosomal DNA polymorphisms among andwithin spores of the Glomales: application to studies on thegenetic diversity of arbuscular mycorrhizal fungal communi-ties. New Phytol 130:419–427
Shrivastava A, Gupta VB (2011) Methods for the determination of limitof detection and limit of quantitation of the analytical methods.Chron Young Sci 2:21–25
Smith SE, Read DJ (2010) Mycorrhizal Symbiosis. Academic,Cambridge
Takada-Hoshino Y, Matsumoto N (2004) An improved DNA extractionmethod using skim milk from soils that strongly adsorb DNA.Microbes Environ 19:13–19
Mycorrhiza
Author's personal copy
Thonar C, Erb A, Jansa J (2012) Real-time PCR to quantify composition ofarbuscular mycorrhizal fungal communities—marker design, verifica-tion, calibration and field validation. Mol Ecol Resour 12:219–232
Tisserant E, Malbreil M, Kuo A et al (2013) Genome of an arbuscularmycorrhizal fungus provides insight into the oldest plant symbiosis.Proc Natl Acad Sci 110:20117–20122
Mycorrhiza
Author's personal copy