Embed Size (px)
Citation preview
Vol.4 No.1 January-June 2016
1 ©2016 J. of TCA All rights reserved
Journal of Thailand Concrete Association
วารสารวิชาการสมาคมคอนกรีตแห่งประเทศไทย
A SIMPLIFIED MODEL FOR PREDICTION OF SHRINKAGE BEHAVIOUR OF HIGH PERFORMANCE CONCRETE CONTAINING SUPPLEMENTARY CEMENTITIOUS MATERIALS Qizhe Hou1 Kejin Wang2* Wanchai Yodsudjai3
1Department of Civil and Environmental Engineering, Iowa State University, Ames, IA, USA
2Department of Civil and Environmental Engineering, Iowa State University, Ames, IA, USA 3Department of Civil Engineering, Faculty of Engineering, Kasetsart University, Bangkok, Thailand ARTICLE INFO:
Received: February 16, 2016 Received Revised Form:
June 17, 2016
Accepted: July 1, 2016
*Corresponding Author, Email address: [email protected]
ABSTRACT :
In this study, autogenous and drying shrinkage of nine high performance concrete (HPC) mixes that are commonly used for bridge decks and bridge
overlays were monitored with time. The mixes contained 10-30% of class C fly
ash (FA) and 25-45% ground granulated blast-furnace slag (GGBFS) replacement for cement. Based on the shrinkage measurements, a statistical
model was developed for describing and predicting shrinkage behaviour of
concrete made with different types and amounts of supplementary cementitious
materials (SCMs). The results indicate that this new simplified, exponential model can well predict shrinkage behavior of concrete and mortar made with
materials similar to those used in the present study. From the newly developed
model, the physical meaning of ultimate shrinkage and rate of shrinkage are further elucidated, and the effects of SCMs on concrete shrinkage behaviour are
clearly expounded..
KEYWORDS: shrinkage, model, fly ash, slag, high performance concrete
1. Introduction
High-performance concrete (HPC) is widely
used for construction of bridge decks and overlays
because of its rapid strength development, low permeability, and excellent durability. However, due
to its high paste content, low water-to-binder ratio
(w/b), and high dosage of chemical admixtures, HPC often displays considerably higher autogenous
shrinkage than normal strength concrete (NSC),
resulting in a significant contribution to the total shrinkage of the concrete.
Due to the environmental, functional, and
economic considerations, supplementary
cementitious materials (SCMs), such as fly ash (FA) and ground granulated blast-furnace slag (GGBFS),
are becoming necessary constituents in concrete.
Researches have shown that fly ash replacement for cement generally reduces both autogenous shrinkage
[1] and drying shrinkage [2] of concrete. However,
GGBFS replacement for cement often leads to different effects on autogenous shrinkage drying
shrinkage of concrete, depending up on the chemical
and physical properties of the slag. As a result, the effect of GGBFS replacement on the total shrinkage
of concrete is often inconsistent [3,4].
Many models have been proposed for
predicting concrete shrinkage behavior. Some numerical models are often complicated due to the
involvements of many factors, such as concrete
surface-to-volume ratio, cementitious material type and content, water-to-cement ratio, aggregate
content, admixtures, and environmental conditions
[5], while other empirical models, such as ACI 209R-92, B3, CEB MC90, CEB MC90-99, and GL2000
models, often fit concrete mixes with little or no
SCMs and chemical admixtures [6].
Vol.4 No.1 January-June 2016
2 ©2016 J. of TCA All rights reserved
In the present study, a set HPC mixes made with different amounts of fly ash and GGBFS
replacement for cement was studied, and the
shrinkage behavior of these concrete mixes was characterized. A statistical analysis conducted to
develop a simple model to predict autogenous and
drying shrinkage of HPC with commonly used SCMs and admixtures.
2. Materials and mix proportions
Type I/II and IP cement, Class C fly ash, and
ground granulated blast furnace slag (GGBFS) that meet ASTM C150, C618 and C989, respectively,
were used. The chemical and physical properties of
these cementitious materials are presented in Table 1.
The fine aggregate used was river sand with specific gravity of 2.64, absorption of 1.4%, and
fineness modulus of 3.13.Nine mix proportions of
mortars, as presented in Table 2, were selected from the HPC mixes that are commonly used for bridge
decks and overlays in Iowa, USA. The mixes had
different cement and sand content and different type and dosage of chemical admixtures. During the data
analysis, the test results from the first seven mixes in
Table 2 were used for the shrinkage model
development, while the last two mixes (Mixes PC’ and 20F’) were designed, as independent samples, for
the validation of the newly-developed shrinkage
model.
Table 1 Properties of cementitious materials
Type Chemical composition (%) Fineness
CaO Al2O3 SiO2 Fe2O3 SO3 MgO Na2O K2O LOI (m2/kg)
I/II 63.1 4.6 20.2 3.2 3.4 2.4 0.09 0.67 1.2 397
IP 48.3 8.9 29.3 4.1 3.1 3.1 0.30 0.70 1.7 490
FA 23.7 22.0 37.3 6.3 1.6 5.3 1.16(Na2O)eq 0.25 15.8%*
GGBFS 37.1 9.2 36.8 0.76 - 9.5 0.34 0.41 - 534
* Fineness of the fly ash expressed as the percentage passing the 45-μm (No. 325) sieve.
Table 2.Mix properties of mortar (per cubic meter)
ID
Cement
type I/II
Fly Ash
(slag) Sand s/b Water w/b AEA
MRWR
(NRWR) Retarder
kg kg kg kg ml ml ml
1-PC 421 - 834 1.98 169 0.4 378 1259 419
2-25S 316 (105) 834 1.98 169 0.4 378 1259 419
3-35S 274 (147) 834 1.98 169 0.4 378 1259 419
4-45S 232 (189) 834 1.98 169 0.4 378 1259 419
5-10F 379 42 834 1.98 169 0.4 378 1259 419
6-20F 337 84 834 1.98 169 0.4 378 1259 419
7-30F 295 127 834 1.98 169 0.4 378 1259 419
8-PC'* 396 - 835 2.11 159 0.4 354 (708) 394
9-20F'* 273 68 883 2.59 143 0.42 378 (610) 348
* Mixes with Type IP cement
3. Experimental work
Autogenous and drying shrinkage of all nine
HPC mortar mixes in Table 2 were monitored with
time. The tests were performed under the standard environmental conditions as described in ASTM
C596 and ACI 209.2R-08. The detailed information
on the tests is provided as below.
3.1 Set time test
According to ASTM C 1698, the first measurement of the autogenous shrinkage of a tested
mortar shall be at the exact moment of the final set time
Vol.4 No.1 January-June 2016
3 ©2016 J. of TCA All rights reserved
of the mortar. Therefore, set time tests were performed for all the 9 mixes studied according to ASTM
C403/C403M. 3.2 Autogenous shrinkage test
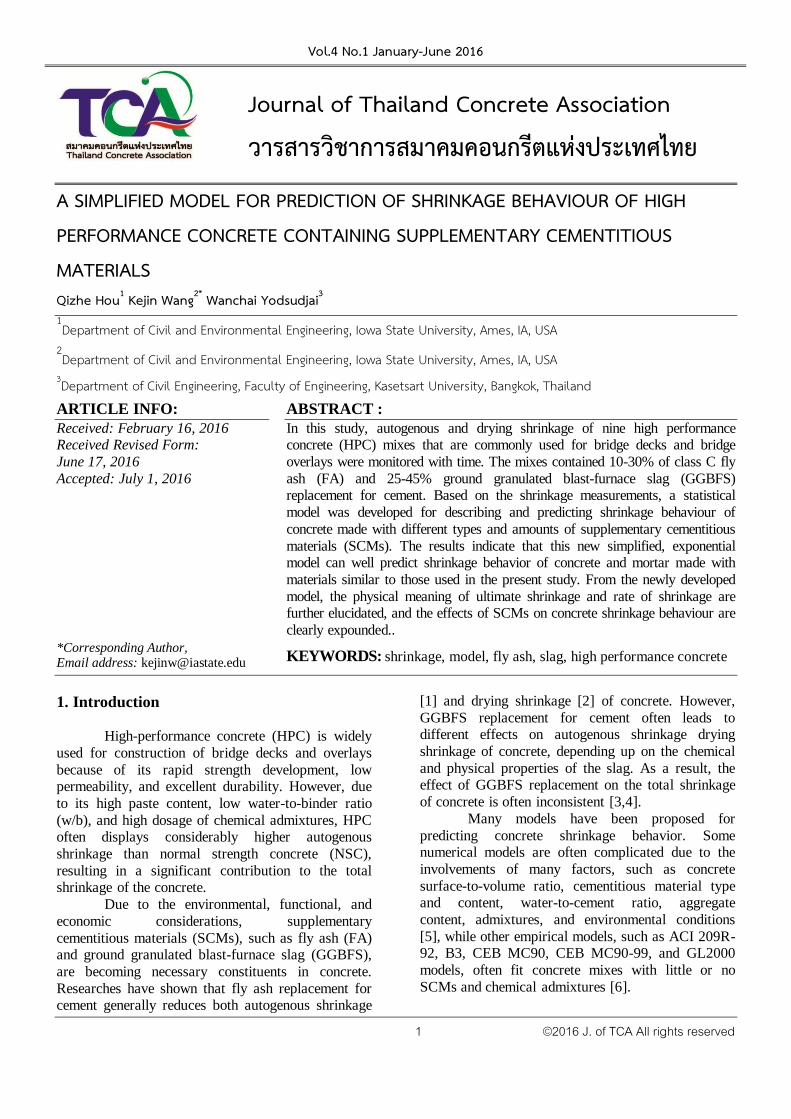
Autogenous shrinkage tests of mortars were
performed according to ASTM C 1698 [7]. For each mortar mix, materials were first mechanically mixed
according to ASTM C305. Three samples were then
cast in 30 mm (diameter) × 300 mm (length)
corrugated polyethylene tubes/molds (Figure 1a). The samples were consolidated with a vibration table with
amplitude of 3,600 VPM for 15 to 30 seconds. After
the ends were properly sealed, the samples were then placed horizontally on a smooth surface to avoid any
unexpected length change due to its gravity and kept
in an environmental chamber with an ambient temperature of 23±1°C (Figure 1b).
(a) Sample casting
(b) Sample storage
(c) Measurement device
Figure 1 Sample preparation for autogenous shrinkage tests
To minimize test errors, the length
measurement device was also kept in the same
environmental chamber where the samples were
stored (Figure 1c).The length measurements of the free drying shrinkage mortar samples were then taken
at 1, 3, 7 days and then once a week up to 56 days.
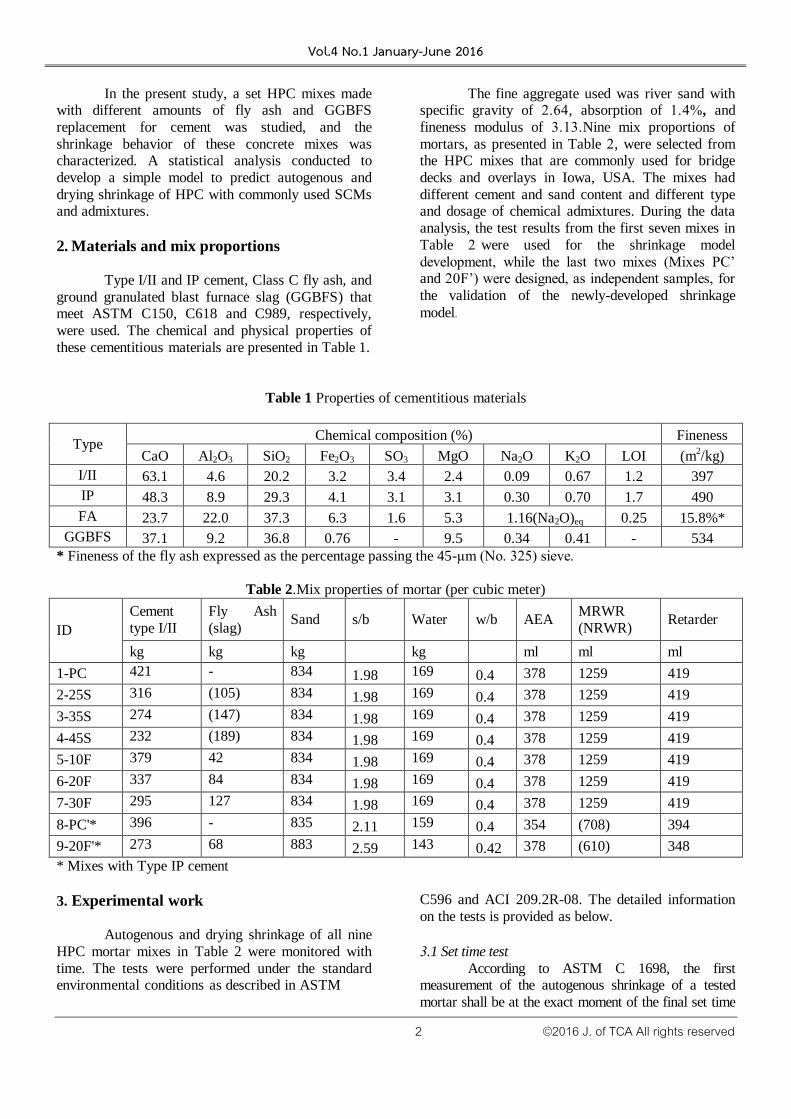
3.3 Autogenous shrinkage test
Drying shrinkage tests were performed for all 9 mortar mixes studied according to ASTM C 596
[8]. For each mortar mix, three prism samples (25 ×
25 × 285 mm, Figure 2a) were made from the same batch used for preparation of the corresponding
autogenous shrinkage test samples. Vibration table
was also applied for consolidation. The samples used
for drying shrinkage tests were first cured in a moist room (23±1°C and 100% RH) for 1 day and then
placed in a lime-saturated water tank at 23±1°C for 2
days. At the age of 72±0.5 hours, the samples were
removed from the water tank and measured for their initial length immediately. They were then placed in
the environment room with 23±1°C and 40% RH for
drying (Figure 2b). The length measurements of the drying shrinkage mortar samples were then taken at
1, 3, 7 days and then once a week up to 56 days
(Figure 2c).
(a) Sample mold
(c) Length
measurement
(b) Sample storage in drying
Figure 2 Test device and specimens of drying
shrinkage of mortar
4. Experimental Results
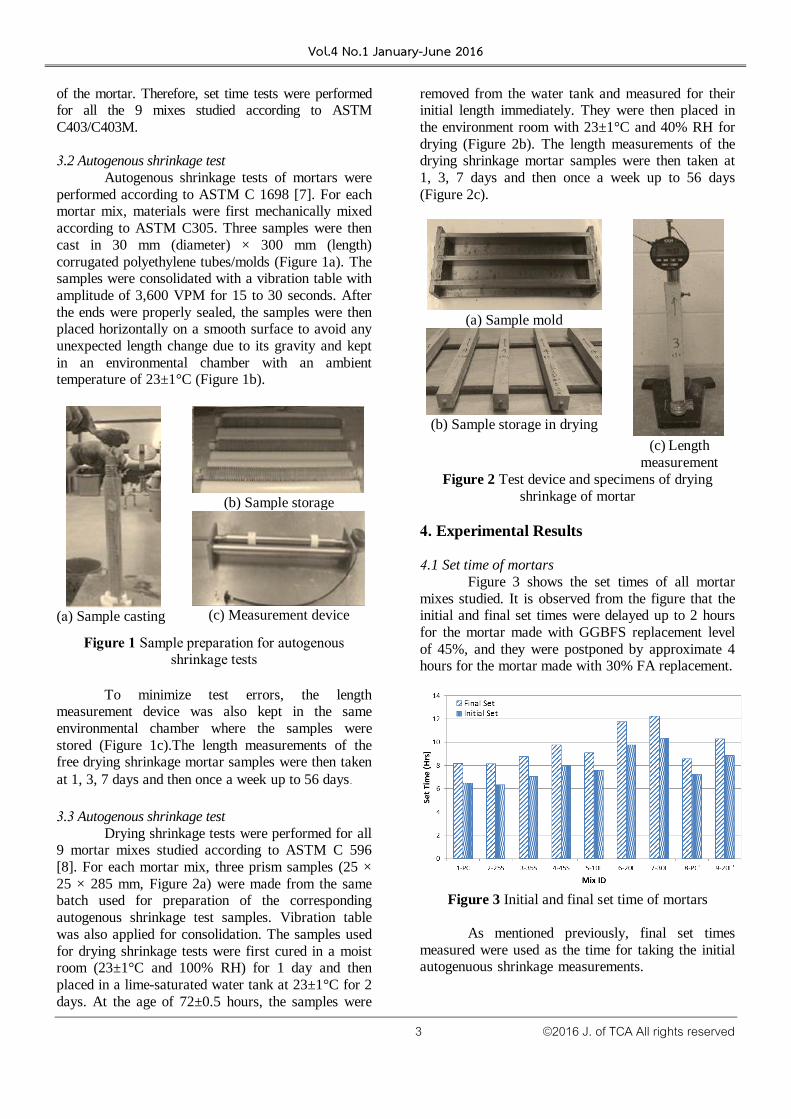
4.1 Set time of mortars
Figure 3 shows the set times of all mortar
mixes studied. It is observed from the figure that the initial and final set times were delayed up to 2 hours
for the mortar made with GGBFS replacement level
of 45%, and they were postponed by approximate 4 hours for the mortar made with 30% FA replacement.
Figure 3 Initial and final set time of mortars
As mentioned previously, final set times
measured were used as the time for taking the initial autogenuous shrinkage measurements.
Vol.4 No.1 January-June 2016
4 ©2016 J. of TCA All rights reserved
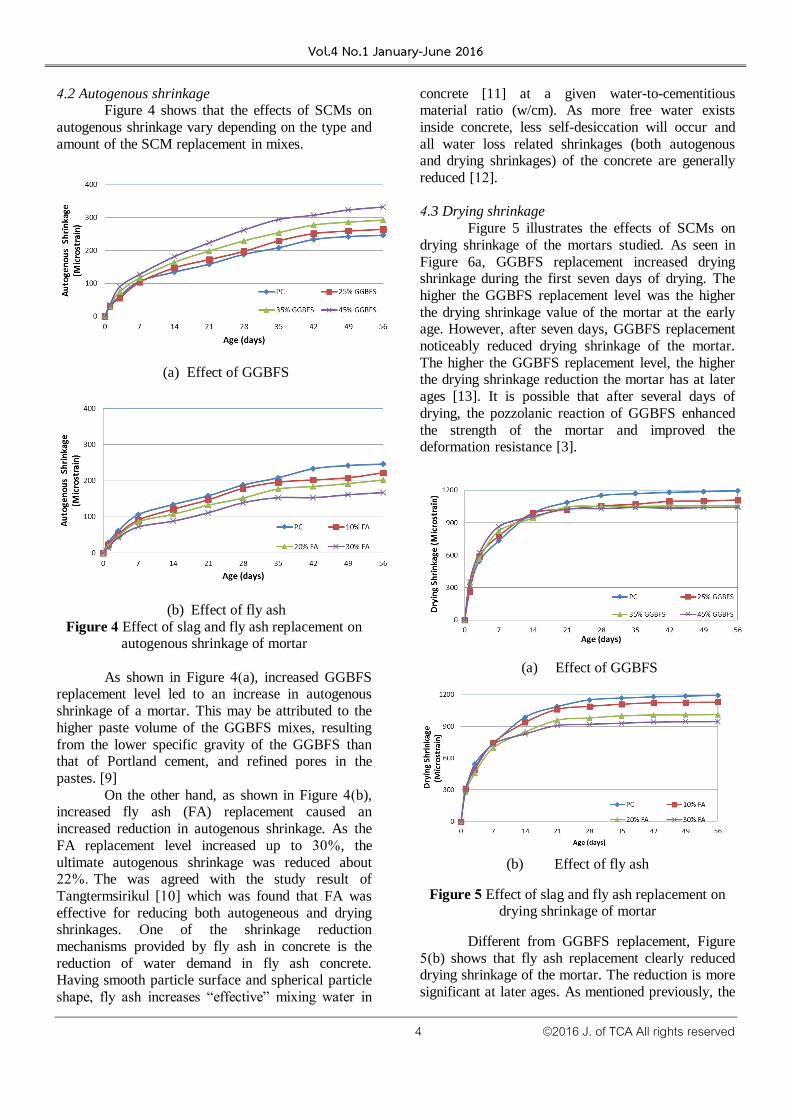
4.2 Autogenous shrinkage Figure 4 shows that the effects of SCMs on
autogenous shrinkage vary depending on the type and
amount of the SCM replacement in mixes.
(a) Effect of GGBFS
(b) Effect of fly ash
Figure 4 Effect of slag and fly ash replacement on autogenous shrinkage of mortar
As shown in Figure 4(a), increased GGBFS replacement level led to an increase in autogenous
shrinkage of a mortar. This may be attributed to the
higher paste volume of the GGBFS mixes, resulting
from the lower specific gravity of the GGBFS than that of Portland cement, and refined pores in the
pastes. [9]
On the other hand, as shown in Figure 4(b), increased fly ash (FA) replacement caused an
increased reduction in autogenous shrinkage. As the
FA replacement level increased up to 30%, the
ultimate autogenous shrinkage was reduced about 22%. The was agreed with the study result of
Tangtermsirikul [10] which was found that FA was
effective for reducing both autogeneous and drying shrinkages. One of the shrinkage reduction
mechanisms provided by fly ash in concrete is the
reduction of water demand in fly ash concrete. Having smooth particle surface and spherical particle
shape, fly ash increases “effective” mixing water in
concrete [11] at a given water-to-cementitious material ratio (w/cm). As more free water exists
inside concrete, less self-desiccation will occur and
all water loss related shrinkages (both autogenous and drying shrinkages) of the concrete are generally
reduced [12].
4.3 Drying shrinkage
Figure 5 illustrates the effects of SCMs on
drying shrinkage of the mortars studied. As seen in
Figure 6a, GGBFS replacement increased drying shrinkage during the first seven days of drying. The
higher the GGBFS replacement level was the higher
the drying shrinkage value of the mortar at the early age. However, after seven days, GGBFS replacement
noticeably reduced drying shrinkage of the mortar.
The higher the GGBFS replacement level, the higher the drying shrinkage reduction the mortar has at later
ages [13]. It is possible that after several days of
drying, the pozzolanic reaction of GGBFS enhanced
the strength of the mortar and improved the deformation resistance [3].
(a) Effect of GGBFS
(b) Effect of fly ash
Figure 5 Effect of slag and fly ash replacement on drying shrinkage of mortar
Different from GGBFS replacement, Figure
5(b) shows that fly ash replacement clearly reduced drying shrinkage of the mortar. The reduction is more
significant at later ages. As mentioned previously, the
Vol.4 No.1 January-June 2016
5 ©2016 J. of TCA All rights reserved
reduction in drying shrinkage may be due to the reduced water demand of fly ash mortar or concrete
[10].
It shall be noted that at the early age (7 or 14
days) of testing, the rates of both autogeneous
shrinkage and drying shrinkage are high, as indicated by the slopes of the curves in Figures 4 and 5. After
14 days, the rates of autogeneous shrinkage of the
tested mortars appeared reduced slightly but were
still very high, while the rates of drying shrinkage of the corresponding mortars were significantly
reduced, evidenced by the plateaus. The high rates of
autogeneous shrinkage of the tested mortars at the later age may be contributed by the long-term self-
desiccation in the HPC mortar, while the significantly
reduced rates of drying shrinkage of the mortar at the later age may result from the improved
microstructure and strength development of the
mortar with time, which enhances deformation
resistance of the mortar.
5. Experimental Results
5.1 Model development
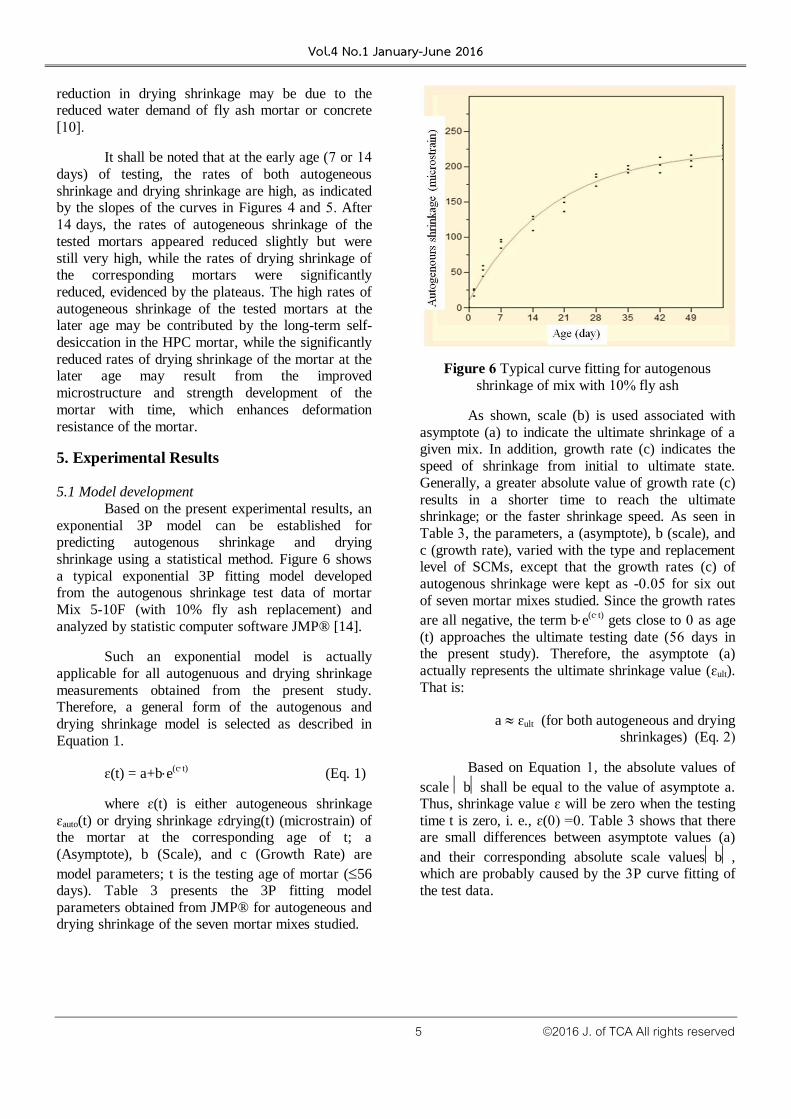
Based on the present experimental results, an
exponential 3P model can be established for predicting autogenous shrinkage and drying
shrinkage using a statistical method. Figure 6 shows
a typical exponential 3P fitting model developed from the autogenous shrinkage test data of mortar
Mix 5-10F (with 10% fly ash replacement) and
analyzed by statistic computer software JMP® [14].
Such an exponential model is actually
applicable for all autogenuous and drying shrinkage
measurements obtained from the present study. Therefore, a general form of the autogenous and
drying shrinkage model is selected as described in
Equation 1.
ɛ(t) = a+be(ct) (Eq. 1)
where ɛ(t) is either autogeneous shrinkage
ɛauto(t) or drying shrinkage ɛdrying(t) (microstrain) of the mortar at the corresponding age of t; a
(Asymptote), b (Scale), and c (Growth Rate) are
model parameters; t is the testing age of mortar (56 days). Table 3 presents the 3P fitting model
parameters obtained from JMP® for autogeneous and drying shrinkage of the seven mortar mixes studied.
Figure 6 Typical curve fitting for autogenous
shrinkage of mix with 10% fly ash
As shown, scale (b) is used associated with
asymptote (a) to indicate the ultimate shrinkage of a given mix. In addition, growth rate (c) indicates the
speed of shrinkage from initial to ultimate state.
Generally, a greater absolute value of growth rate (c)
results in a shorter time to reach the ultimate shrinkage; or the faster shrinkage speed. As seen in
Table 3, the parameters, a (asymptote), b (scale), and
c (growth rate), varied with the type and replacement level of SCMs, except that the growth rates (c) of
autogenous shrinkage were kept as -0.05 for six out
of seven mortar mixes studied. Since the growth rates
are all negative, the term be(ct) gets close to 0 as age
(t) approaches the ultimate testing date (56 days in the present study). Therefore, the asymptote (a)
actually represents the ultimate shrinkage value (ɛult).
That is:
a ɛult (for both autogeneous and drying shrinkages) (Eq. 2)
Based on Equation 1, the absolute values of
scale bshall be equal to the value of asymptote a. Thus, shrinkage value ɛ will be zero when the testing
time t is zero, i. e., ɛ(0) =0. Table 3 shows that there are small differences between asymptote values (a)
and their corresponding absolute scale valuesb, which are probably caused by the 3P curve fitting of
the test data.
Vol.4 No.1 January-June 2016
6 ©2016 J. of TCA All rights reserved
Table 3 Regression coefficients for modeling shrinkage of mortar
Shrinkage Type Model Parameter PC
(Control) 10% FA 20% FA 30% FA 25% Slag 35% Slag 45% Slag
Autogeneous
Asymptote (a) 262 226 222 202 280 290 322
Scale (b) -245 -215 -209 -192 -266 -275 -305
Growth Rate (c) -0.05 -0.05 -0.04 -0.05 -0.05 -0.05 -0.05
Drying
Asymptote (a) 1171 1113 996 924 1072 1042 1024
Scale (b) -1090 -1037 -935 -876 -1031 -984 -986
Growth Rate (c) -0.14 -0.15 -0.17 -0.23 -0.21 -0.24 -0.30
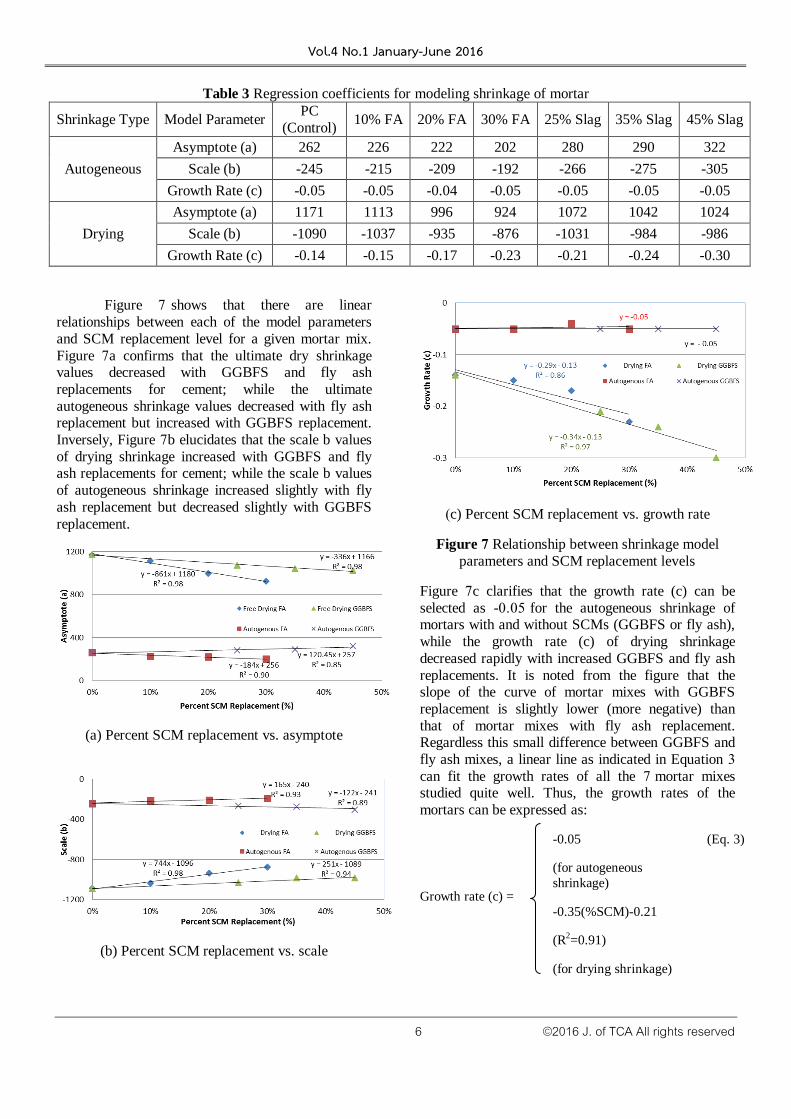
Figure 7 shows that there are linear
relationships between each of the model parameters
and SCM replacement level for a given mortar mix.
Figure 7a confirms that the ultimate dry shrinkage values decreased with GGBFS and fly ash
replacements for cement; while the ultimate
autogeneous shrinkage values decreased with fly ash replacement but increased with GGBFS replacement.
Inversely, Figure 7b elucidates that the scale b values
of drying shrinkage increased with GGBFS and fly ash replacements for cement; while the scale b values
of autogeneous shrinkage increased slightly with fly
ash replacement but decreased slightly with GGBFS
replacement.
(a) Percent SCM replacement vs. asymptote
(b) Percent SCM replacement vs. scale
(c) Percent SCM replacement vs. growth rate
Figure 7 Relationship between shrinkage model
parameters and SCM replacement levels
Figure 7c clarifies that the growth rate (c) can be
selected as -0.05 for the autogeneous shrinkage of mortars with and without SCMs (GGBFS or fly ash),
while the growth rate (c) of drying shrinkage
decreased rapidly with increased GGBFS and fly ash
replacements. It is noted from the figure that the slope of the curve of mortar mixes with GGBFS
replacement is slightly lower (more negative) than
that of mortar mixes with fly ash replacement. Regardless this small difference between GGBFS and
fly ash mixes, a linear line as indicated in Equation 3
can fit the growth rates of all the 7 mortar mixes studied quite well. Thus, the growth rates of the
mortars can be expressed as:
Growth rate (c) =
-0.05
(for autogeneous
shrinkage)
(Eq. 3)
-0.35(%SCM)-0.21
(R2=0.91)
(for drying shrinkage)
Vol.4 No.1 January-June 2016
7 ©2016 J. of TCA All rights reserved
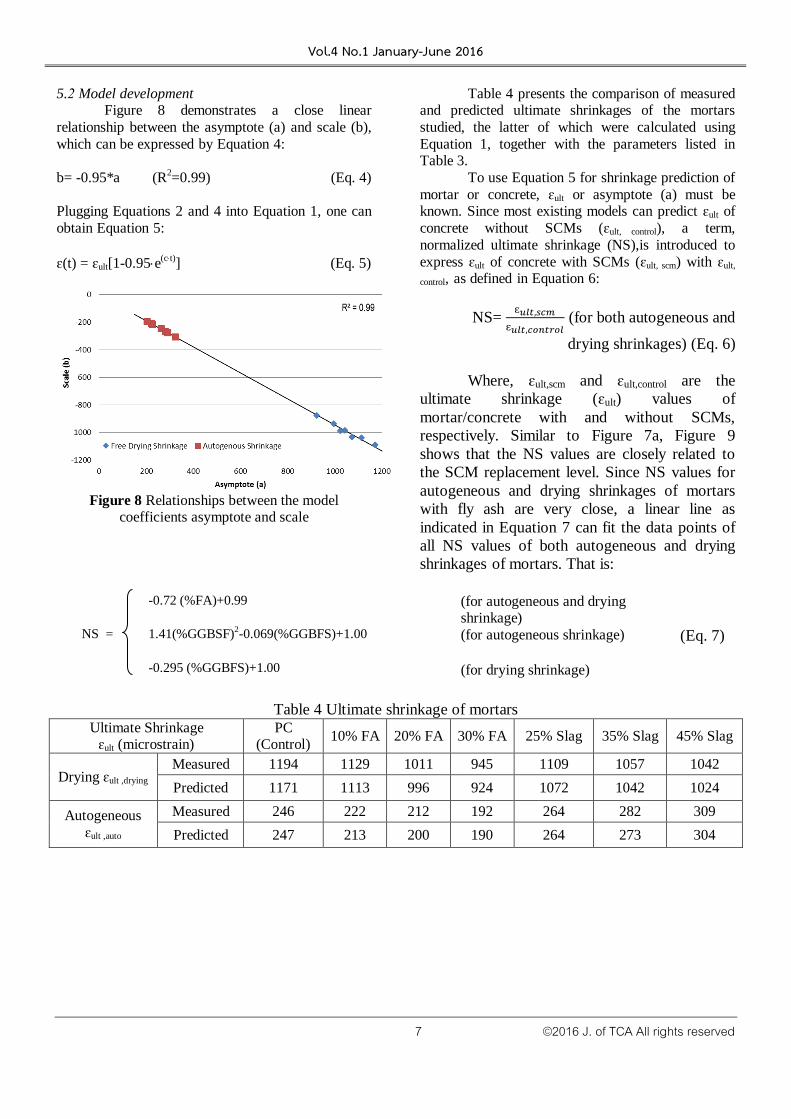
5.2 Model development Figure 8 demonstrates a close linear
relationship between the asymptote (a) and scale (b),
which can be expressed by Equation 4:
b= -0.95*a (R2=0.99) (Eq. 4)
Plugging Equations 2 and 4 into Equation 1, one can
obtain Equation 5:
ɛ(t) = ɛult[1-0.95e(ct)
] (Eq. 5)
Figure 8 Relationships between the model coefficients asymptote and scale
Table 4 presents the comparison of measured and predicted ultimate shrinkages of the mortars
studied, the latter of which were calculated using
Equation 1, together with the parameters listed in Table 3.
To use Equation 5 for shrinkage prediction of
mortar or concrete, ɛult or asymptote (a) must be known. Since most existing models can predict ɛult of
concrete without SCMs (ɛult, control), a term,
normalized ultimate shrinkage (NS),is introduced to
express ɛult of concrete with SCMs (ɛult, scm) with ɛult,
control, as defined in Equation 6:
NS=
(for both autogeneous and
drying shrinkages) (Eq. 6)
Where, ɛult,scm and ɛult,control are the
ultimate shrinkage (ɛult) values of
mortar/concrete with and without SCMs,
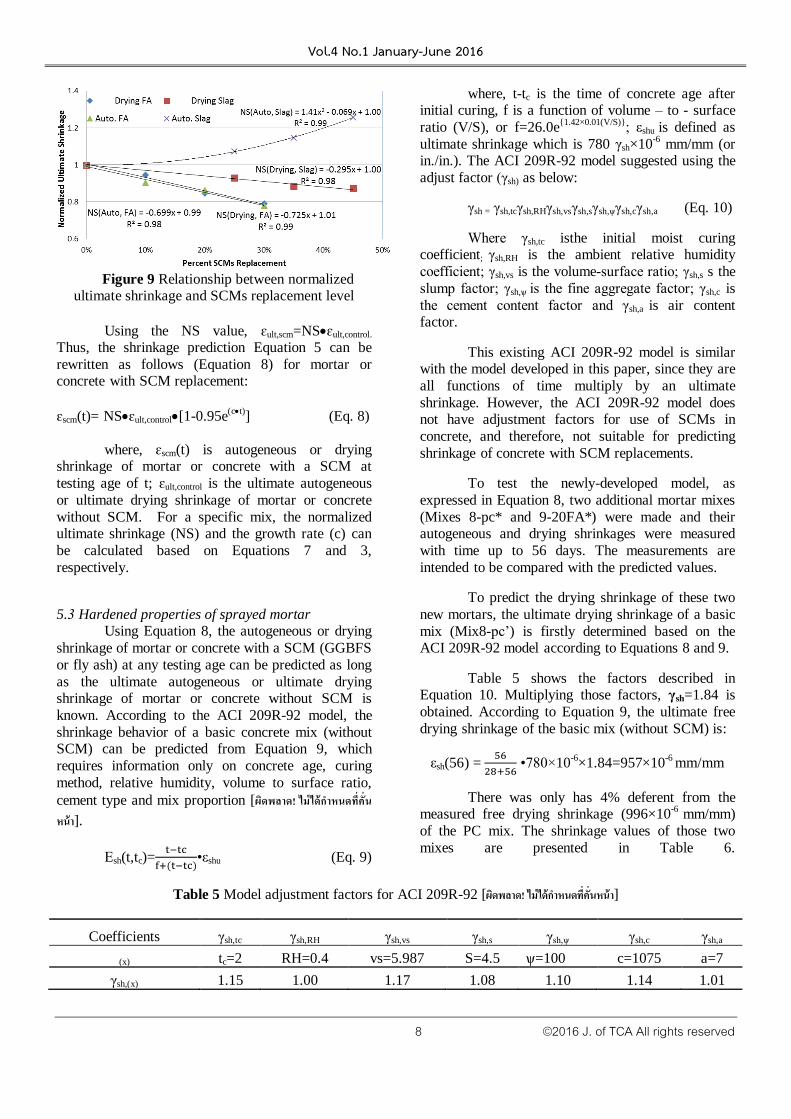
respectively. Similar to Figure 7a, Figure 9
shows that the NS values are closely related to
the SCM replacement level. Since NS values for
autogeneous and drying shrinkages of mortars
with fly ash are very close, a linear line as
indicated in Equation 7 can fit the data points of
all NS values of both autogeneous and drying
shrinkages of mortars. That is:
-0.72 (%FA)+0.99 (for autogeneous and drying shrinkage)
NS = 1.41(%GGBSF)2-0.069(%GGBFS)+1.00 (for autogeneous shrinkage) (Eq. 7)
-0.295 (%GGBFS)+1.00 (for drying shrinkage)
Table 4 Ultimate shrinkage of mortars Ultimate Shrinkage
ɛult (microstrain) PC
(Control) 10% FA 20% FA 30% FA 25% Slag 35% Slag 45% Slag
Drying ɛult ,drying Measured 1194 1129 1011 945 1109 1057 1042
Predicted 1171 1113 996 924 1072 1042 1024
Autogeneous
ɛult ,auto
Measured 246 222 212 192 264 282 309
Predicted 247 213 200 190 264 273 304
Vol.4 No.1 January-June 2016
8 ©2016 J. of TCA All rights reserved
Figure 9 Relationship between normalized
ultimate shrinkage and SCMs replacement level
Using the NS value, ɛult,scm=NSɛult,control.
Thus, the shrinkage prediction Equation 5 can be
rewritten as follows (Equation 8) for mortar or concrete with SCM replacement:
ɛscm(t)= NSɛult,control[1-0.95e(ct)
] (Eq. 8)
where, ɛscm(t) is autogeneous or drying shrinkage of mortar or concrete with a SCM at
testing age of t; ɛult,control is the ultimate autogeneous
or ultimate drying shrinkage of mortar or concrete
without SCM. For a specific mix, the normalized ultimate shrinkage (NS) and the growth rate (c) can
be calculated based on Equations 7 and 3,
respectively.
5.3 Hardened properties of sprayed mortar Using Equation 8, the autogeneous or drying
shrinkage of mortar or concrete with a SCM (GGBFS
or fly ash) at any testing age can be predicted as long
as the ultimate autogeneous or ultimate drying shrinkage of mortar or concrete without SCM is
known. According to the ACI 209R-92 model, the
shrinkage behavior of a basic concrete mix (without SCM) can be predicted from Equation 9, which
requires information only on concrete age, curing
method, relative humidity, volume to surface ratio,
cement type and mix proportion [ผิดพลาด! ไม่ได้ก าหนดที่คั่นหน้า].
Εsh(t,tc)=
•εshu (Eq. 9)
where, t-tc is the time of concrete age after initial curing, f is a function of volume – to - surface
ratio (V/S), or f=26.0e{1.42×0.01(V/S)}
; εshu is defined as
ultimate shrinkage which is 780 γsh×10-6 mm/mm (or
in./in.). The ACI 209R-92 model suggested using the
adjust factor (γsh) as below:
γsh = γsh,tcγsh,RHγsh,vsγsh,sγsh,ѱγsh,cγsh,a (Eq. 10)
Where γsh,tc isthe initial moist curing coefficient; γsh,RH is the ambient relative humidity
coefficient; γsh,vs is the volume-surface ratio; γsh,s s the
slump factor; γsh,ѱ is the fine aggregate factor; γsh,c is
the cement content factor and γsh,a is air content factor.
This existing ACI 209R-92 model is similar with the model developed in this paper, since they are
all functions of time multiply by an ultimate
shrinkage. However, the ACI 209R-92 model does not have adjustment factors for use of SCMs in
concrete, and therefore, not suitable for predicting
shrinkage of concrete with SCM replacements.
To test the newly-developed model, as
expressed in Equation 8, two additional mortar mixes
(Mixes 8-pc* and 9-20FA*) were made and their autogeneous and drying shrinkages were measured
with time up to 56 days. The measurements are
intended to be compared with the predicted values.
To predict the drying shrinkage of these two
new mortars, the ultimate drying shrinkage of a basic
mix (Mix8-pc’) is firstly determined based on the ACI 209R-92 model according to Equations 8 and 9.
Table 5 shows the factors described in Equation 10. Multiplying those factors, γsh=1.84 is
obtained. According to Equation 9, the ultimate free
drying shrinkage of the basic mix (without SCM) is:
εsh(56) =
•780×10
-6×1.84=957×10
-6 mm/mm
There was only has 4% deferent from the measured free drying shrinkage (996×10
-6 mm/mm)
of the PC mix. The shrinkage values of those two
mixes are presented in Table 6.
Table 5 Model adjustment factors for ACI 209R-92 [ผดิพลาด! ไม่ได้ก าหนดที่คั่นหน้า]
Coefficients γsh,tc γsh,RH γsh,vs γsh,s γsh,ѱ γsh,c γsh,a
(x) tc=2 RH=0.4 vs=5.987 S=4.5 ѱ=100 c=1075 a=7
γsh,(x) 1.15 1.00 1.17 1.08 1.10 1.14 1.01
Vol.4 No.1 January-June 2016
9 ©2016 J. of TCA All rights reserved
Table 6 Shrinkage values for Mixes 8 and 9
Age (day)
Drying Autogenous
Micro strain (10-6
mm/mm)
8-PC' 9-20F' 8-PC' 9-20F'
0 0 0 0 0
1 231 131 16 16
3 541 231 49 35
7 793 555 69 49
14 875 677 111 74
21 934 712 136 96
28 954 737 176 148
35 996 765 216 180
42 989 786 233 202
49 985 793 242 220
56 996 800 250 238
Then, other parameters required by Equation 8 are determined, including the normalized ultimate
shrinkage (NS), which was 0.85, according to Equation
7, and the growth rates (c), which were -0.28 and -0.05 for drying and autogenous shrinkage, respectively
according to Equation 3.
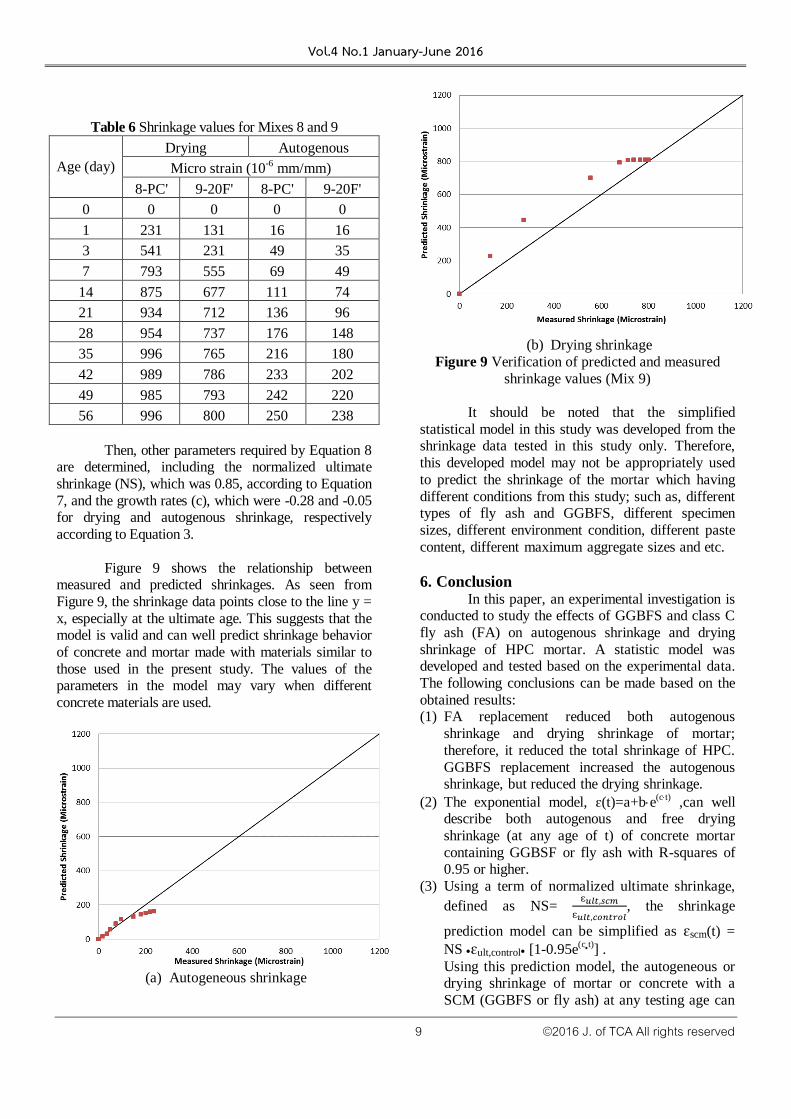
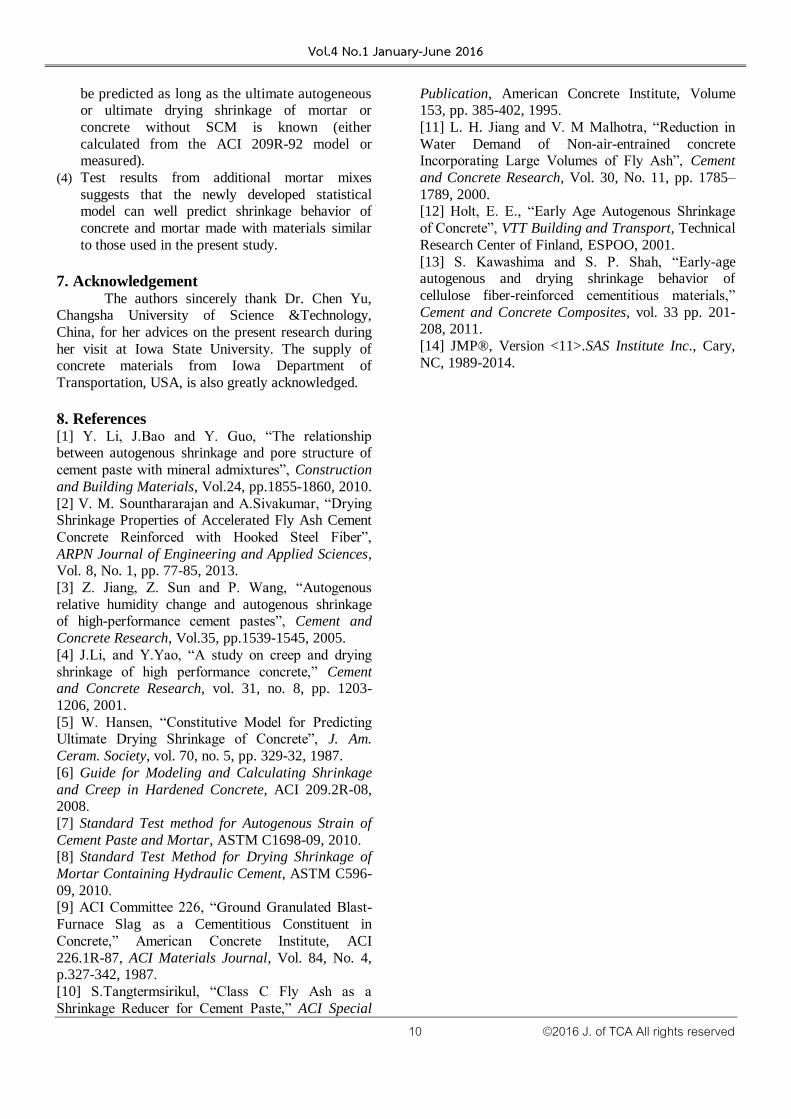
Figure 9 shows the relationship between measured and predicted shrinkages. As seen from
Figure 9, the shrinkage data points close to the line y =
x, especially at the ultimate age. This suggests that the model is valid and can well predict shrinkage behavior
of concrete and mortar made with materials similar to
those used in the present study. The values of the parameters in the model may vary when different
concrete materials are used.
(a) Autogeneous shrinkage
(b) Drying shrinkage
Figure 9 Verification of predicted and measured
shrinkage values (Mix 9)
It should be noted that the simplified
statistical model in this study was developed from the shrinkage data tested in this study only. Therefore,
this developed model may not be appropriately used
to predict the shrinkage of the mortar which having
different conditions from this study; such as, different types of fly ash and GGBFS, different specimen
sizes, different environment condition, different paste
content, different maximum aggregate sizes and etc.
6. Conclusion In this paper, an experimental investigation is
conducted to study the effects of GGBFS and class C
fly ash (FA) on autogenous shrinkage and drying
shrinkage of HPC mortar. A statistic model was developed and tested based on the experimental data.
The following conclusions can be made based on the
obtained results: (1) FA replacement reduced both autogenous
shrinkage and drying shrinkage of mortar;
therefore, it reduced the total shrinkage of HPC.
GGBFS replacement increased the autogenous shrinkage, but reduced the drying shrinkage.
(2) The exponential model, ɛ(t)=a+be(ct)
,can well describe both autogenous and free drying
shrinkage (at any age of t) of concrete mortar
containing GGBSF or fly ash with R-squares of 0.95 or higher.
(3) Using a term of normalized ultimate shrinkage,
defined as NS=
, the shrinkage
prediction model can be simplified as ɛscm(t) =
NS ɛult,control [1-0.95e(ct)] .
Using this prediction model, the autogeneous or drying shrinkage of mortar or concrete with a
SCM (GGBFS or fly ash) at any testing age can
Vol.4 No.1 January-June 2016
10 ©2016 J. of TCA All rights reserved
be predicted as long as the ultimate autogeneous or ultimate drying shrinkage of mortar or
concrete without SCM is known (either
calculated from the ACI 209R-92 model or measured).
(4) Test results from additional mortar mixes
suggests that the newly developed statistical model can well predict shrinkage behavior of
concrete and mortar made with materials similar
to those used in the present study.
7. Acknowledgement The authors sincerely thank Dr. Chen Yu,
Changsha University of Science &Technology,
China, for her advices on the present research during
her visit at Iowa State University. The supply of concrete materials from Iowa Department of
Transportation, USA, is also greatly acknowledged.
8. References [1] Y. Li, J.Bao and Y. Guo, “The relationship between autogenous shrinkage and pore structure of
cement paste with mineral admixtures”, Construction
and Building Materials, Vol.24, pp.1855-1860, 2010.
[2] V. M. Sounthararajan and A.Sivakumar, “Drying Shrinkage Properties of Accelerated Fly Ash Cement
Concrete Reinforced with Hooked Steel Fiber”,
ARPN Journal of Engineering and Applied Sciences, Vol. 8, No. 1, pp. 77-85, 2013.
[3] Z. Jiang, Z. Sun and P. Wang, “Autogenous
relative humidity change and autogenous shrinkage of high-performance cement pastes”, Cement and
Concrete Research, Vol.35, pp.1539-1545, 2005.
[4] J.Li, and Y.Yao, “A study on creep and drying
shrinkage of high performance concrete,” Cement and Concrete Research, vol. 31, no. 8, pp. 1203-
1206, 2001.
[5] W. Hansen, “Constitutive Model for Predicting Ultimate Drying Shrinkage of Concrete”, J. Am.
Ceram. Society, vol. 70, no. 5, pp. 329-32, 1987.
[6] Guide for Modeling and Calculating Shrinkage
and Creep in Hardened Concrete, ACI 209.2R-08, 2008.
[7] Standard Test method for Autogenous Strain of
Cement Paste and Mortar, ASTM C1698-09, 2010. [8] Standard Test Method for Drying Shrinkage of
Mortar Containing Hydraulic Cement, ASTM C596-
09, 2010. [9] ACI Committee 226, “Ground Granulated Blast-
Furnace Slag as a Cementitious Constituent in
Concrete,” American Concrete Institute, ACI
226.1R-87, ACI Materials Journal, Vol. 84, No. 4, p.327-342, 1987.
[10] S.Tangtermsirikul, “Class C Fly Ash as a
Shrinkage Reducer for Cement Paste,” ACI Special
Publication, American Concrete Institute, Volume 153, pp. 385-402, 1995.
[11] L. H. Jiang and V. M Malhotra, “Reduction in
Water Demand of Non-air-entrained concrete Incorporating Large Volumes of Fly Ash”, Cement
and Concrete Research, Vol. 30, No. 11, pp. 1785–
1789, 2000. [12] Holt, E. E., “Early Age Autogenous Shrinkage
of Concrete”, VTT Building and Transport, Technical
Research Center of Finland, ESPOO, 2001.
[13] S. Kawashima and S. P. Shah, “Early-age autogenous and drying shrinkage behavior of
cellulose fiber-reinforced cementitious materials,”
Cement and Concrete Composites, vol. 33 pp. 201-208, 2011.
[14] JMP®, Version <11>.SAS Institute Inc., Cary,
NC, 1989-2014.