Embed Size (px)
Citation preview
Community Needs Evaluation 2011 Update
Metropolitan Social Services Planning & Coordination
Metropolitan Government of Nashville and Davidson County
800 Second Avenue Nor th , Nashv i l l e , Tennessee
615-862-6458/Direct Serv ices 615-862-6494/Planning & Coordinat ion
Metropolitan Social Services
MSS Executive Director
Renee Pratt
Planning & Coordination Staff
Dinah Gregory, Planning & Coordination Director
Abdelghani Barre, Planning Analyst
Lee Stewart, Planning Analyst
Julius Witherspoon, Planning Analyst
Joyce Hillman, Planning Analyst
Board of Commissioners
Dr. Frank Boehm, Chair
Renard Francois
Kristine LaLonde
Marlen Santana Perez
Bishop George Price
Mary Rolando
William Sinclair
SpecialthankstoResearchAdvisorsfortheCommunityNeedsEvaluation
Dan Cornfield, Professor of Sociology, Vanderbilt University
Oscar Miller, Department Head, Department of Sociology, Social Work & Urban Professions Tennessee State University
Acknowledgements
Metropolitan Social Services acknowledges with gratitude the assistance it received from individuals and organizations in the community, including those listed below.
United Way/2‐1‐1 Call Center
Tennessee Department of Human Services
Metropolitan Planning Department
Metropolitan Public Health Department
Metropolitan Nashville Public Schools
Community Food Advocates
Second Harvest Food Bank of Middle Tennessee
Urban Housing Solutions
Nashville Career Advancement Center
Tennessee Department of Labor and Workforce Development
Community Needs Evaluation ‐ 2011 Update Metropolitan Social Services ‐ Planning & Coordination
Metropolitan Government of Nashville and Davidson County
Contents Page Message from Metropolitan Social Services Commission Chairman 1 Overview 2 Key Findings 4 The Status of Davidson County 5 Methodology 6
Secondary Data, Grassroots Community Survey
Demographic and Social Profile of Davidson County 10 Socioeconomic Profile of Davidson County 14 2010 Flood 18 Poverty 19 Poverty Definitions, U. S. Poverty Threshold, Supplemental Poverty
Measure, Income Distribution, Poverty Projections, Children in Poverty, Neighborhoods in Poverty, Social Factors and Death
Evidence‐Based Practice 35 Doing What Works, Collective Impact
Poverty Reduction/Alleviation Initiatives 38 Measuring Human Development 41 United Way 2‐1‐1 Needs 45
Child Care 51
Key Findings, Children Born in Poverty, Grassroots Community Survey, Child Care System and Costs, Tennessee Child Care Certificate Program, Families First/Temporary Assistance to Needy Families, Children and Education, Head Start, Tennessee Pre‐K and Kindergarten Programs, Unmet Needs and Challenges for Children, Child Care Best Practices – Examples
Contents Page Food 71
Key Findings, Hunger in Nashville, Food Assistance, Food Security and Food Hardship, Grassroots Community Survey, 2‐1‐1 Call Center – Requests for Food, Second Harvest Food Bank, Supplemental Nutrition Assistance/SNAP (Food Stamps), Free or Reduced Cost Lunch for Students, Nutrition Program for Women, Infants and Children (WIC) Senior Nutrition Programs, Commodity Supplemental Food Program for Seniors, Food Best Practices ‐ Examples
Health 85
Key Findings, Healthy People 2020, County Health Rankings, Behavioral Risk Factor Surveillance, Health Disparities, Grassroots Community Survey, Underserved and Uninsured, Affordable Care Act Update, Other Emerging Health Issues, Health Best Practices – Examples
Home and Community Based Services – Seniors and Adults 103
Key Findings, Fastest Growing Segment of the Population, Grassroots Community Survey, Increasing Need, Poverty, Aging and Disability, Comparative Cost of Home and Community Based Services and Nursing Home Care, Home and Community Based Care Programs, Transportation, Home and Community Based Services Best Practices – Example
Housing 116
Key Findings, Grassroots Community Survey, 2‐1‐1 Call Center – Calls for Housing & Related Assistance, Multi‐Generational Housing, Foreclosures Fair Market Rent and Cost Burden, Fair Housing, Homelessness, Flood Recovery, Housing Best Practices – Examples
Neighborhood Development 141
Key Findings, Neighborhood and Community Involvement, Grassroots Community Survey, Neighborhood Diversity, Gentrification, Not In My Back Yard (NIMBY), Disadvantaged Neighborhoods, Neighborhood Development Best Practices – Example
Workforce Development and Economic Opportunity 150
Key Findings, Economic Recovery, Unemployment, Leading Sectors, Economic Opportunity, Educational Attainment, Need for Mainstream Financial Transactions, Grassroots Community, Survey, Workforce Development and Economic Opportunity Best Practices – Examples
Grassroots Community Survey (Form) 172
Page1
KARL F. DEAN MAYOR
METROPOLITAN GOVERNMENT OF NASHVILLE AND DAVIDSON COUNTY
METROPOLITAN SOCIAL SERVICES Mailing Address 523 MAINSTREAM DRIVE, SUITE A PO Box 196300 NASHVILLE, TENNESSEE 37228 Nashville, TN 37219-6300
Message from the Metropolitan Social Services Commission
Frank H. Boehm, M.D., Board Chairman
Metropolitan Social Services is pleased to present its 2011 Community Needs Evaluation Update.
When it created its first Community Needs Evaluation in 2009, MSS established a systematic process
for gathering, interpreting, and reporting data about social service needs and gaps in Davidson County.
Metropolitan Social Services’ Planning & Coordination staff produced this third annual report to
provide data and descriptive information about existing and projected unmet social service needs in
Davidson County. The MSS Board of Commissioners determined that the focus of Planning &
Coordination should be data driven as well as evidence based. Much as the practice of medicine is
increasingly utilizing evidence base medicine to help establish appropriate medical treatment, MSS
also believes that evidence based social service data is required to help our community make critical
decisions on how to help the vulnerable among us.
In February of 2010, Mayor Karl Dean acknowledged the work of Metropolitan Social Services and
charged the department to continue “conducting annual community needs assessments and organizing
community‐wide, public‐private partnerships.” The 2011 Community Needs Evaluation includes Child
Care, Food, Health, Housing, Neighborhood Development and Workforce Development & Economic
Opportunity. Because of the increasing number of adults who are disabled or frail elderly, this update
also includes a section on Home & Community Based Services for Seniors/Adults.
Special thanks are due to the work of MSS Executive Director Renee Pratt and Planning & Coordination
Director Dinah Gregory, as well as the entire Planning and Coordination staff of MSS. The MSS Board
of Commissioners is pleased to share this document with Nashville’s social service community.
Questions should be emailed to [email protected].
Sincerely,
Frank H. Boehm
Frank H. Boehm, M.D. Chairman, Board of Commissioners Metropolitan Social Services
Page2
With the publication of the 2009 Community Needs Evaluation, Metropolitan Social Services
initiated a data‐based, replicable process to provide information to the community about the
social/human service needs in Davidson County. Annual updates ensure that data is current and
that changes in the social, cultural and economic environment are reflected.
The updated 2011 Community Needs Evaluation for Davidson County, Tennessee, is a tool that can
enhance the planning, design, coordination, and provision of public and private social services in
Davidson County.
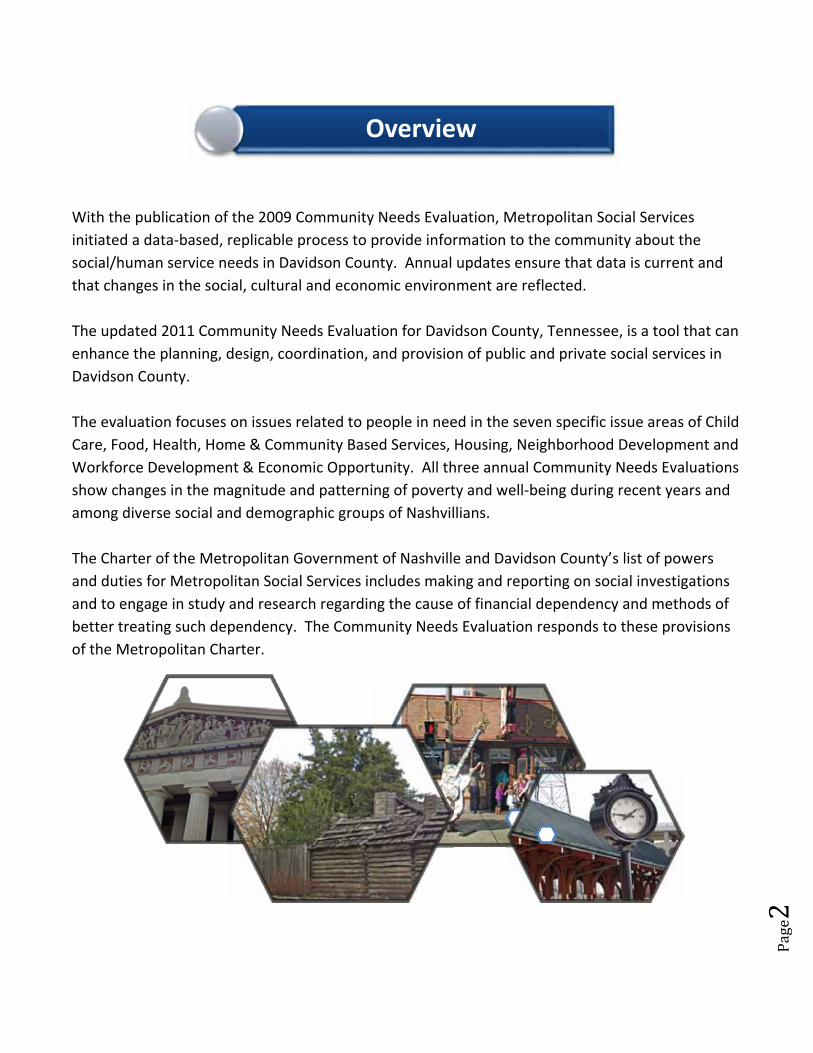
The evaluation focuses on issues related to people in need in the seven specific issue areas of Child
Care, Food, Health, Home & Community Based Services, Housing, Neighborhood Development and
Workforce Development & Economic Opportunity. All three annual Community Needs Evaluations
show changes in the magnitude and patterning of poverty and well‐being during recent years and
among diverse social and demographic groups of Nashvillians.
The Charter of the Metropolitan Government of Nashville and Davidson County’s list of powers
and duties for Metropolitan Social Services includes making and reporting on social investigations
and to engage in study and research regarding the cause of financial dependency and methods of
better treating such dependency. The Community Needs Evaluation responds to these provisions
of the Metropolitan Charter.
Overview
Page3
This report also describes the importance of using evidence‐based practices, through which
programs can be designed to serve both existing and emerging needs by using techniques and
strategies that have been demonstrated to be effective. The 2011 Evaluation includes samples of
best practice techniques in each section. Many, but not all, initiatives in Davidson County use
effective and innovative best practices to maximize effectiveness.
Good quality, relevant data can guide policy makers, advocates, and others toward better
decisions, especially in tight economic times.
The Community Needs Evaluation provides an overview of social service needs; discusses the
public and private resources available to meet the needs; identifies current and anticipated needs
based on trends in the community; provides objective information to help agencies strategically
plan their services; and can be used to align social services and philanthropy with the changing
needs of Nashvillians.
Using limited resources in the most effective and efficient way is even more important now.
Federal, state and local budgets have decreased. In “The 2010 Nonprofit Fundraising Survey,” the
Foundation Center reported that among the 1,845 charitable organizations surveyed in February
2011, 33% experienced declines in overall contributions. In addition, the previous year’s survey
found that 46% had experienced a decline from the previous year.
Persons who have significant social/human service needs often live in poverty, so it is important to
consider the context of poverty and unmet needs together. Identifying and addressing unmet
needs is a long‐term ongoing process. However, short‐term events and situations can affect
efforts dedicated to meeting needs and addressing poverty.
There are many ways to improve the system of service delivery for social/human services.
These include developing and operating programs to meet identified needs by using demonstrated best practice designs and methods.
By combining these strategies with effective coordination among organizations, gaps in services can be filled, duplications can be prevented and cost efficiencies can be achieved.
Page4
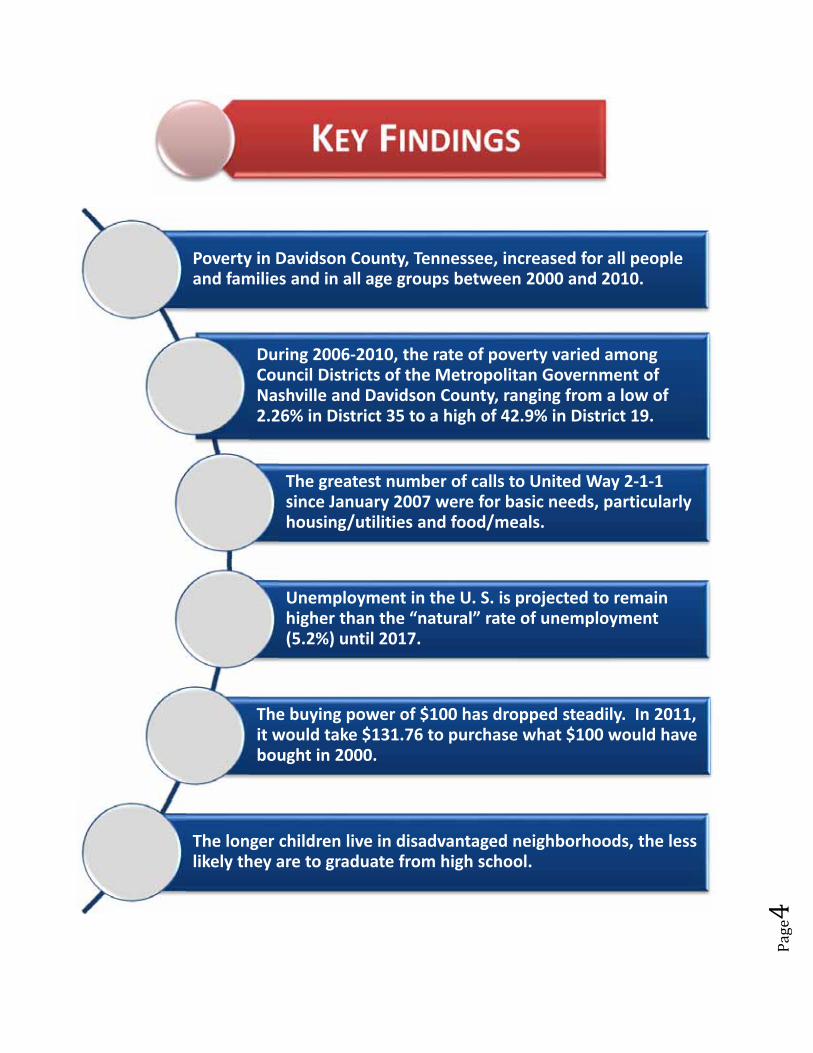
Poverty in Davidson County, Tennessee, increased for all people and families and in all age groups between 2000 and 2010.
During 2006‐2010, the rate of poverty varied among Council Districts of the Metropolitan Government of Nashville and Davidson County, ranging from a low of 2.26% in District 35 to a high of 42.9% in District 19.
The greatest number of calls to United Way 2‐1‐1 since January 2007 were for basic needs, particularly housing/utilities and food/meals.
Unemployment in the U. S. is projected to remain higher than the “natural” rate of unemployment (5.2%) until 2017.
The buying power of $100 has dropped steadily. In 2011, it would take $131.76 to purchase what $100 would have bought in 2000.
The longer children live in disadvantaged neighborhoods, the less likely they are to graduate from high school.
Page5
There is a significant difference in the quality of life and opportunities for Davidson County
residents, often depending on demographic, social and socioeconomic characteristics. Nashville is
regularly ranked highly as a good place to live, but the number of people whose lives are limited by
income and related circumstances increased.
As reported by the U.S. Census Bureau (2000 Census, 2010 American Community Survey):
Davidson County’s poverty rate for all people increased from 13.0% in 2000 to 20.2% in
2010.
During that same time, the poverty rate for persons under age 18 in Davidson County
increased from 19.1% to 32.2%.
The number of families with incomes below $15,000 increased from 15,162 in 2000 to
18,410 in 2010, while the number of families with incomes above $100,000 increased from
20,140 to 30,243.
At 20.2%, the Davidson County poverty rate for all people is
higher than the nationwide rate of 15.3%, with poverty rates
related to factors such as race, ethnicity and location. While this
report primarily focuses broadly on persons in need, there are
demographic, social, and economic factors in our community
that influence poverty.
There are many ways to evaluate the community in terms of its social/human service needs and
services. In taking a comprehensive approach to poverty and human needs, this report presents a
broad demographic, social, and economic profile of Nashvillians. The profile was developed from
primary and secondary data from a variety of identified sources (related to labor market dynamics,
social/human services utilization, and community characteristics).
Primary data was derived from three annual Grassroots Community Surveys. Secondary data
sources are the U.S. Census Bureau, the U.S. Bureau of Labor Statistics, the Tennessee Department
of Labor and Workforce Development, the Tennessee Department of Human Services, United Way
of Metropolitan Nashville 2‐1‐1 and others.
The Status of Davidson County
Page6
The 2011 Community Needs Evaluation Update focuses on the same issue areas as in 2010: Child
Care, Economic Opportunity, Food, Health, Housing, Neighborhood Development and Workforce
Development. There are other issues related to quality of life that are beyond the scope of this
evaluation, including education, transportation, domestic violence, and others.
Secondary Data
Data was compiled from the U.S. Census Bureau, particularly the 2000 Census and American
Community Surveys. Information from the 2010 American Community Survey was used when
available because the 2010 Decennial Census did not contain specific poverty data. American
Community Surveys are based on sample surveys and have varying margins of error.
New data products are regularly released by the U. S. Census Bureau and other agencies, and
future updates of this report will include data as it becomes available. The tables, charts, and
narrative descriptions reflect a wide range of demographic, economic, social, and other
characteristics of Davidson County.
At the end of 2010, for the first time, the U. S. Census Bureau released a five‐year data set covering
the period 2005‐2009. In December 2011, the second set of five‐year data was released for 2006‐
2010. The Bureau indicates that the longer reporting period provides more accurate and reliable
information than the annual information. However, annual data is more useful to demonstrate
trends over time. While much of the data contained is annual, data sets from 3‐year and 5‐year
Census reports were used when appropriate.
Grassroots Community Survey
For the third year, a Grassroots Community Needs Survey was administered in Davidson County, to
customers at specific social/human service programs.
The 2009 Grassroots Survey was conducted with customers of the Tennessee Department
of Human Services (Davidson County Office), Catholic Charities, the Nashville Career
Advancement Center, Second Harvest Food Bank, Siloam Family Health Center, the
Metropolitan Action Commission, and Metropolitan Social Services, with 1,737
respondents.
Methodology
Page7
In 2010, the same Grassroots Community Needs Survey was administered to participants of
the Volunteer Income Tax Assistance sites, operated by the Nashville Alliance for Financial
Independence (an initiative of United Way), with 1,787 respondents. (This survey was
completed prior to Davidson County’s May 2010 flood.)
In 2011, the Grassroots Survey was slightly modified to add questions about Health and
Neighborhood Development. It was conducted primarily with customers of the Tennessee
Department of Human Services (Davidson County Office) and with some residents at Urban
Housing Solutions, with a total of 768 respondents.
The survey asked Davidson County residents to identify the greatest need in each issue (described
later in this document). They also had the opportunity to identify needs other than those included
in the category lists. The last question on each survey asked respondents to identify which issue
had the largest gap between the services now available and what is needed by the community.
The issues in the 2011 Survey were Food & Nutrition, Health, Home & Community Based Services
for Adults/Seniors, Child Care, Housing & Related Assistance, Neighborhood Development,
Transportation and Workforce & Economic Development. Charts that show the types of needs
identified by respondents for each issue area are contained in the relevant sections.
There was also a selection for “Other” so that participants could write in issues that were not
included in the survey. The 2‐page survey is at the end of this document.
In addition to the Grassroots Community Surveys, the 2009 Community Needs Evaluation included
a survey of Professional/Executives and focus groups, with the results available online.
http://www.nashville.gov/sservices/planningcoordination/2009cne.asp
For three years (2009, 2010 and 2011) the greatest needs identified in the Grassroots Community Survey were
Workforce & Economic Opportunity
Housing & Related Assistance

Page8
While other questions asked respondents to identify the most important needs from within issue
groups, one question asked respondents to choose among the seven issue areas and identify the
one with the greatest gap between available services and the needs in the community. Chart 1
below shows that respondents identified the greatest gap in services in Housing & Related
Assistance, with the second greatest gap in Workforce & Economic Opportunity and the third
greatest gap in Food & Nutrition.
As described later in this document, data from 2‐1‐1 shows the greatest number of calls since 2007
were for Housing/Utilities, consistent with the greatest gap identified in the Grassroots Community
Survey for Housing & Related Assistance.
In comparing the results of the 2009, 2010 and 2011 Grassroots Community Surveys, there were
similarities in the gaps and services identified. In 2009 and 2010, Workforce & Economic
Opportunity ranked highest, with Housing & Related Assistance ranking second. However, in the
2011 survey (Chart 1) Housing & Related Assistance ranked higher than Workforce & Economic
Opportunity. Food & Nutrition ranked third in all three years.
Because there were eight choices for greatest gap in services on the 2011 survey, compared to five
in 2009 and 2010, the decrease in Workforce & Economic Opportunity may be related to the
additional choices available in 2011 for Health, which ranked fourth, slightly below Food &
Nutrition. The consistency in the top three greatest gaps in services identified for three
consecutive years suggests reliability of the data.
For all needs, it is important to consider the long‐term implications of unmet needs as well as the
necessity of using demographic projections to plan for emerging trends. Due to the

Page9
interrelatedness of the identified needs, those not among the top three may still be important for
addressing the service gaps.
For example, because early childhood education is closely linked to better outcomes for
employment, income and health, unmet needs for child care will have long‐term implications that
will affect Workforce Development, Economic Opportunity, Housing and Health. Another example
is with Home & Community Based Services for Seniors/Adults, for which the demand for services
will increase in two ways. The number of frail elderly and disabled adults will increase during the
coming decades (due to the aging population, as described in the section on Home and Community
Based Services for Seniors/Adults). The need for services will also increase because of the
increased likelihood of older people having one or more disabilities, increasing their need for
services.
Source: MSS 2011 Grassroots Community Survey
5.2%
17.3%
4.8%
16.5%
24.2%
3.5%
8.1%
20.4%
Chart 1: Greatest Gap Between Available Services and NeedsGrassroots Community Survey 2011
Page10
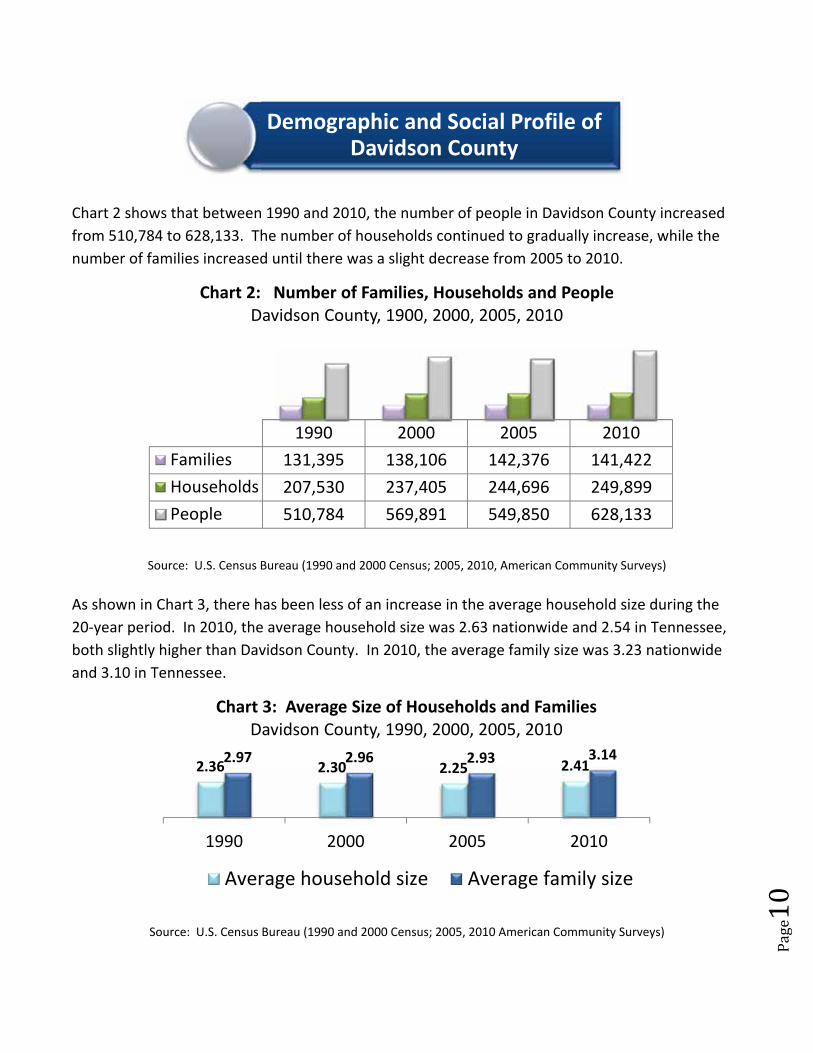
Chart 2 shows that between 1990 and 2010, the number of people in Davidson County increased
from 510,784 to 628,133. The number of households continued to gradually increase, while the
number of families increased until there was a slight decrease from 2005 to 2010.
Source: U.S. Census Bureau (1990 and 2000 Census; 2005, 2010, American Community Surveys)
As shown in Chart 3, there has been less of an increase in the average household size during the
20‐year period. In 2010, the average household size was 2.63 nationwide and 2.54 in Tennessee,
both slightly higher than Davidson County. In 2010, the average family size was 3.23 nationwide
and 3.10 in Tennessee.
Source: U.S. Census Bureau (1990 and 2000 Census; 2005, 2010 American Community Surveys)
Demographic and Social Profile of Davidson County
1990 2000 2005 2010
Families 131,395 138,106 142,376 141,422
Households 207,530 237,405 244,696 249,899
People 510,784 569,891 549,850 628,133
Chart 2: Number of Families, Households and PeopleDavidson County, 1900, 2000, 2005, 2010
2.36 2.30 2.25 2.412.97 2.96 2.93 3.14
1990 2000 2005 2010
Chart 3: Average Size of Households and FamiliesDavidson County, 1990, 2000, 2005, 2010
Average household size Average family size
Page11
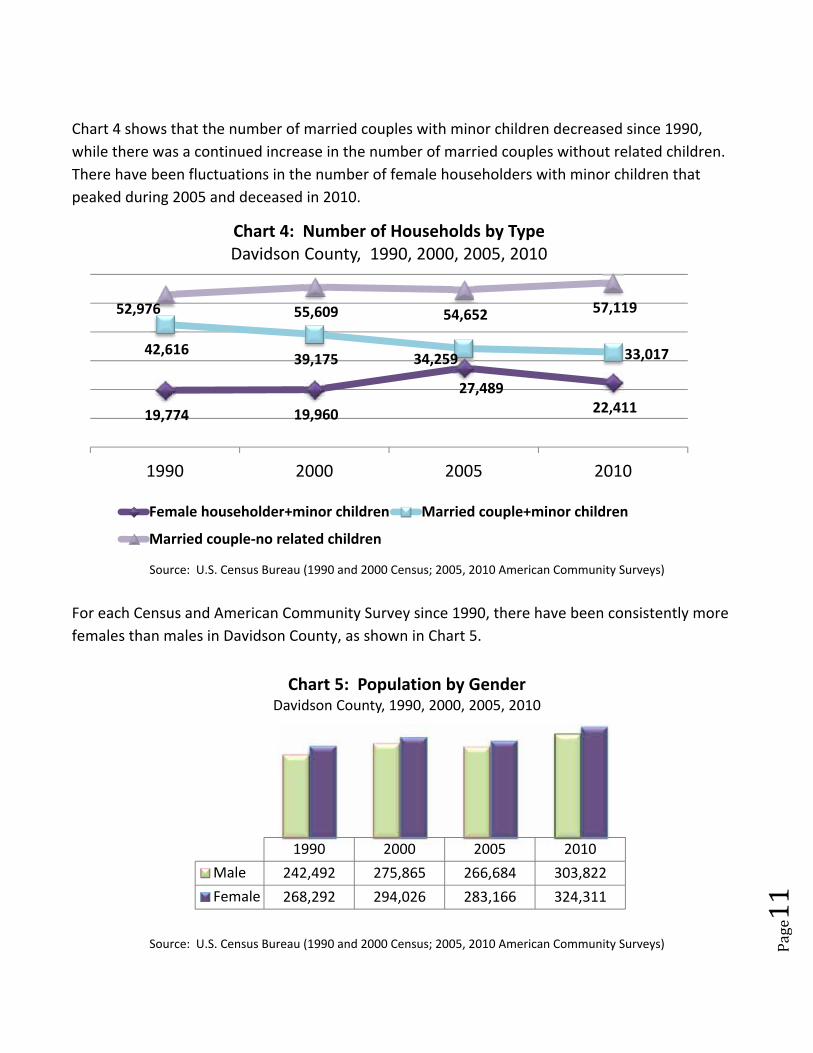
Chart 4 shows that the number of married couples with minor children decreased since 1990,
while there was a continued increase in the number of married couples without related children.
There have been fluctuations in the number of female householders with minor children that
peaked during 2005 and deceased in 2010.
Source: U.S. Census Bureau (1990 and 2000 Census; 2005, 2010 American Community Surveys)
For each Census and American Community Survey since 1990, there have been consistently more
females than males in Davidson County, as shown in Chart 5.
Source: U.S. Census Bureau (1990 and 2000 Census; 2005, 2010 American Community Surveys)
19,774 19,960
27,489 22,411
42,616 39,175 34,259 33,017
52,976 55,609 54,652 57,119
1990 2000 2005 2010
Chart 4: Number of Households by TypeDavidson County, 1990, 2000, 2005, 2010
Female householder+minor children Married couple+minor children
Married couple‐no related children
1990 2000 2005 2010
Male 242,492 275,865 266,684 303,822
Female 268,292 294,026 283,166 324,311
Chart 5: Population by GenderDavidson County, 1990, 2000, 2005, 2010
Page12
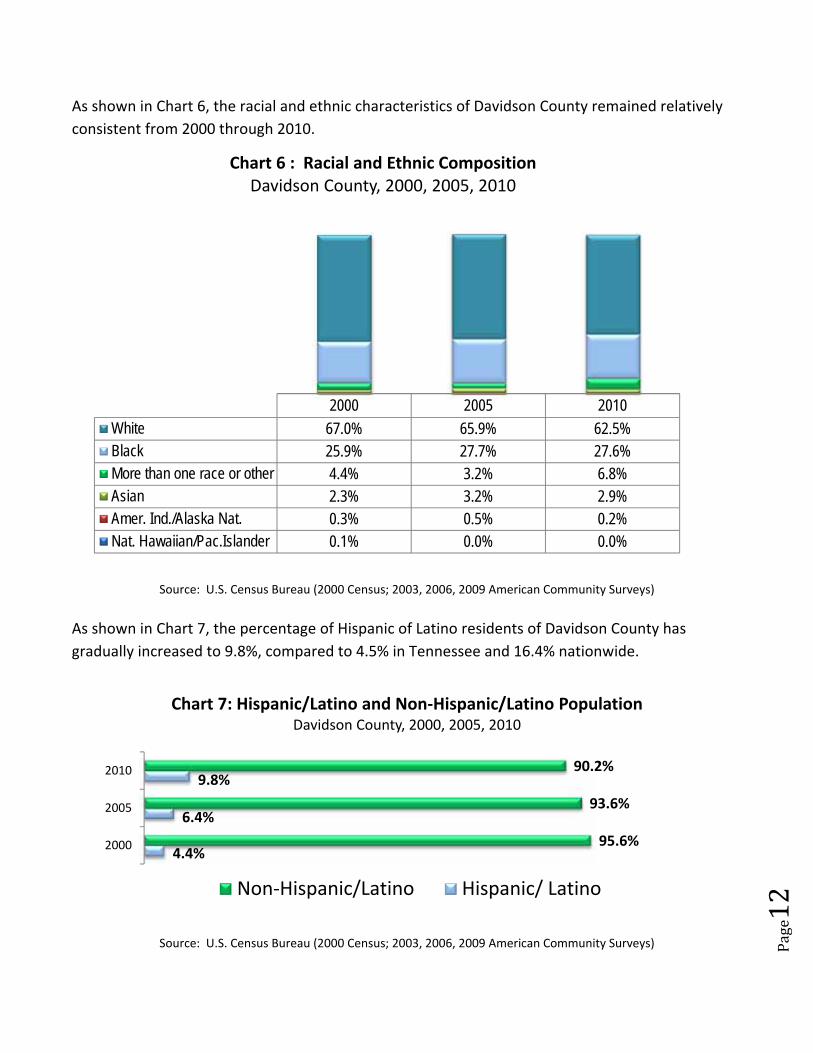
As shown in Chart 6, the racial and ethnic characteristics of Davidson County remained relatively
consistent from 2000 through 2010.
Source: U.S. Census Bureau (2000 Census; 2003, 2006, 2009 American Community Surveys)
As shown in Chart 7, the percentage of Hispanic of Latino residents of Davidson County has
gradually increased to 9.8%, compared to 4.5% in Tennessee and 16.4% nationwide.
Source: U.S. Census Bureau (2000 Census; 2003, 2006, 2009 American Community Surveys)
2000 2005 2010
White 67.0% 65.9% 62.5%Black 25.9% 27.7% 27.6%More than one race or other 4.4% 3.2% 6.8%Asian 2.3% 3.2% 2.9%Amer. Ind./Alaska Nat. 0.3% 0.5% 0.2%Nat. Hawaiian/Pac.Islander 0.1% 0.0% 0.0%
Chart 6 : Racial and Ethnic CompositionDavidson County, 2000, 2005, 2010
4.4%
6.4%
9.8%
95.6%
93.6%
90.2%
2000
2005
2010
Chart 7: Hispanic/Latino and Non‐Hispanic/Latino PopulationDavidson County, 2000, 2005, 2010
Non‐Hispanic/Latino Hispanic/ Latino
Page13
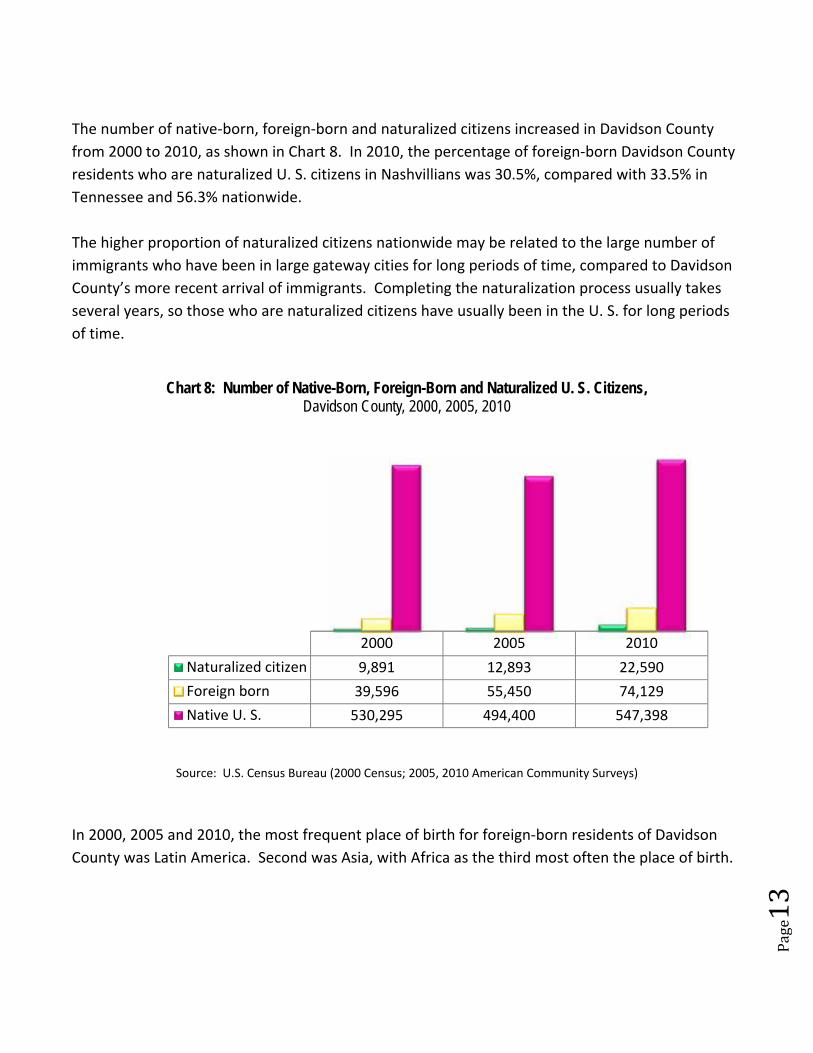
The number of native‐born, foreign‐born and naturalized citizens increased in Davidson County
from 2000 to 2010, as shown in Chart 8. In 2010, the percentage of foreign‐born Davidson County
residents who are naturalized U. S. citizens in Nashvillians was 30.5%, compared with 33.5% in
Tennessee and 56.3% nationwide.
The higher proportion of naturalized citizens nationwide may be related to the large number of
immigrants who have been in large gateway cities for long periods of time, compared to Davidson
County’s more recent arrival of immigrants. Completing the naturalization process usually takes
several years, so those who are naturalized citizens have usually been in the U. S. for long periods
of time.
Source: U.S. Census Bureau (2000 Census; 2005, 2010 American Community Surveys)
In 2000, 2005 and 2010, the most frequent place of birth for foreign‐born residents of Davidson
County was Latin America. Second was Asia, with Africa as the third most often the place of birth.
2000 2005 2010
Naturalized citizen 9,891 12,893 22,590
Foreign born 39,596 55,450 74,129
Native U. S. 530,295 494,400 547,398
Chart 8: Number of Native-Born, Foreign-Born and Naturalized U. S. Citizens, Davidson County, 2000, 2005, 2010
Page14
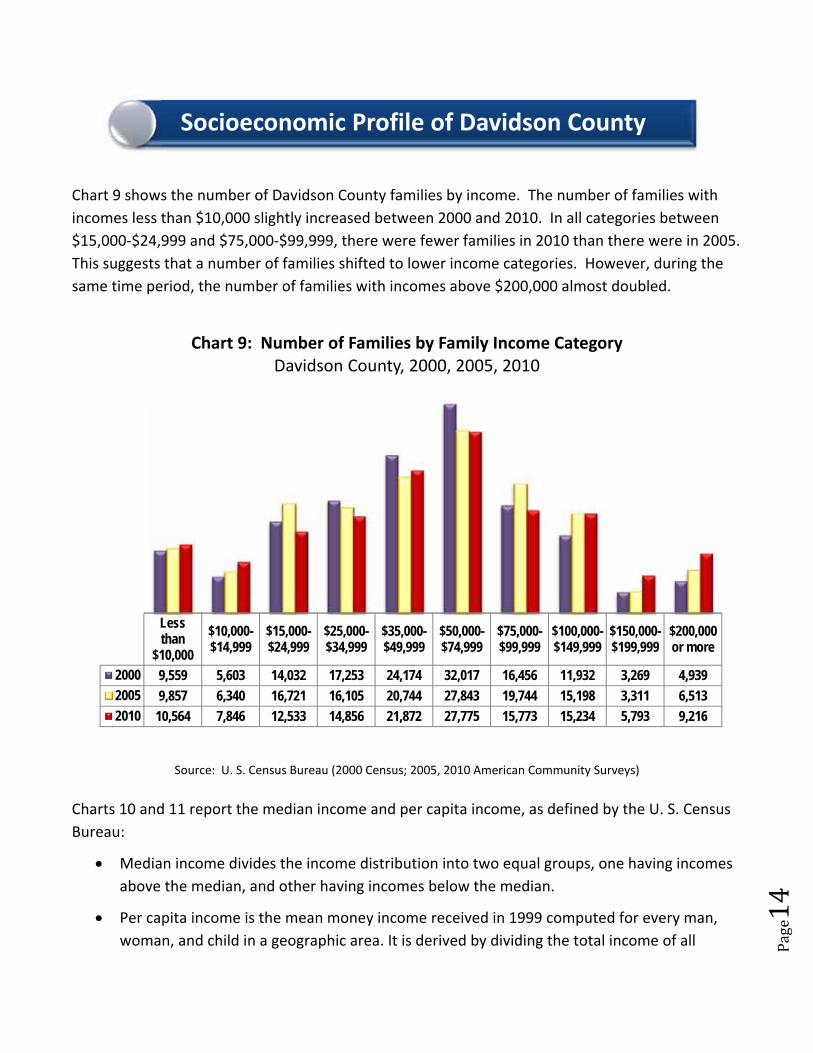
Chart 9 shows the number of Davidson County families by income. The number of families with
incomes less than $10,000 slightly increased between 2000 and 2010. In all categories between
$15,000‐$24,999 and $75,000‐$99,999, there were fewer families in 2010 than there were in 2005.
This suggests that a number of families shifted to lower income categories. However, during the
same time period, the number of families with incomes above $200,000 almost doubled.
Source: U. S. Census Bureau (2000 Census; 2005, 2010 American Community Surveys)
Charts 10 and 11 report the median income and per capita income, as defined by the U. S. Census
Bureau:
Median income divides the income distribution into two equal groups, one having incomes
above the median, and other having incomes below the median.
Per capita income is the mean money income received in 1999 computed for every man,
woman, and child in a geographic area. It is derived by dividing the total income of all
Socioeconomic Profile of Davidson County
Lessthan
$10,000
$10,000-$14,999
$15,000-$24,999
$25,000-$34,999
$35,000-$49,999
$50,000-$74,999
$75,000-$99,999
$100,000-$149,999
$150,000-$199,999
$200,000or more
2000 9,559 5,603 14,032 17,253 24,174 32,017 16,456 11,932 3,269 4,939
2005 9,857 6,340 16,721 16,105 20,744 27,843 19,744 15,198 3,311 6,513
2010 10,564 7,846 12,533 14,856 21,872 27,775 15,773 15,234 5,793 9,216
Chart 9: Number of Families by Family Income CategoryDavidson County, 2000, 2005, 2010
Page15
people 15 years old and over in a geographic area by the total population in that area. Note
‐‐ income is not collected for people under 15 years old even though those people are
included in the denominator of per capita income. This measure is rounded to the nearest
whole dollar.
Mean income is the amount obtained by dividing the total income of a particular statistical
universe by the number of units in that universe. Thus, mean household income is obtained
by dividing total household income by the total number of households. For the various
types of income, the means are based on households having those types of income.
Money income includes amounts reported separately for wage or salary income; net self‐
employment income; interest, dividends, or net rental or royalty income or income from
estates and trusts; Social Security or Railroad Retirement income; Supplemental Security
Income (SSI); public assistance or welfare payments; retirement, survivor, or disability
pensions; and all other income.
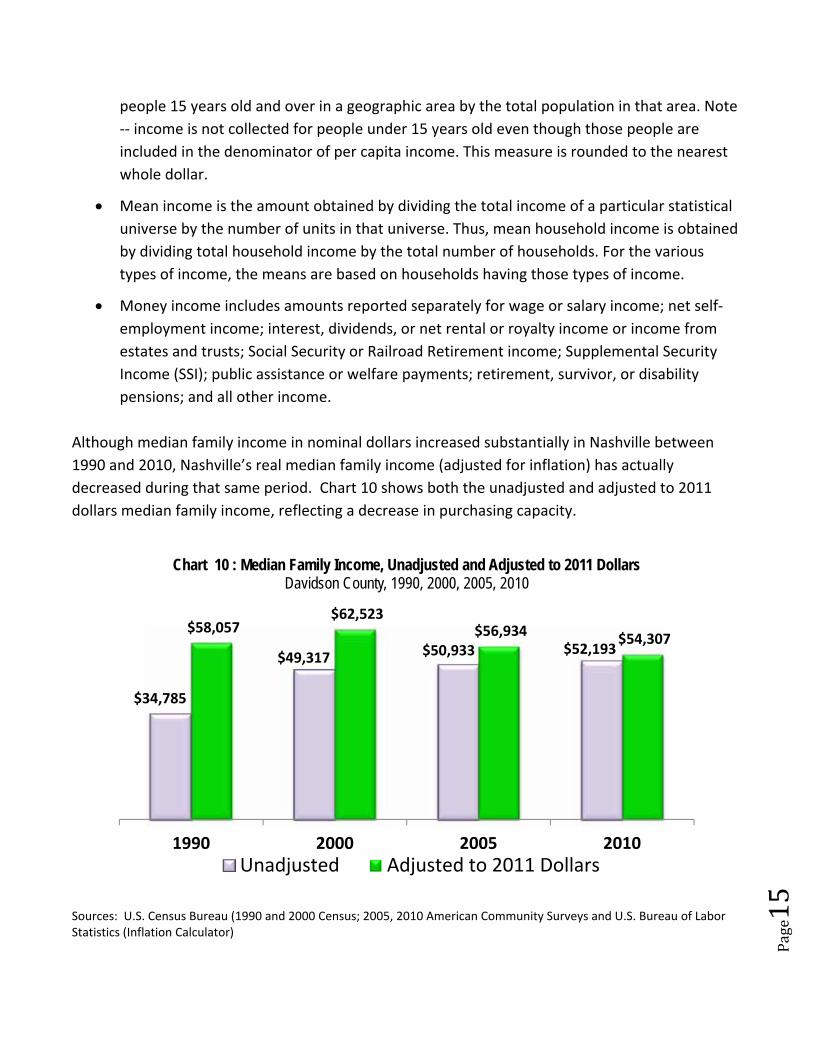
Although median family income in nominal dollars increased substantially in Nashville between
1990 and 2010, Nashville’s real median family income (adjusted for inflation) has actually
decreased during that same period. Chart 10 shows both the unadjusted and adjusted to 2011
dollars median family income, reflecting a decrease in purchasing capacity.
Sources: U.S. Census Bureau (1990 and 2000 Census; 2005, 2010 American Community Surveys and U.S. Bureau of Labor Statistics (Inflation Calculator)
$34,785
$49,317 $50,933 $52,193
$58,057 $62,523
$56,934 $54,307
1990 2000 2005 2010
Chart 10 : Median Family Income, Unadjusted and Adjusted to 2011 DollarsDavidson County, 1990, 2000, 2005, 2010
Unadjusted Adjusted to 2011 Dollars
Page16
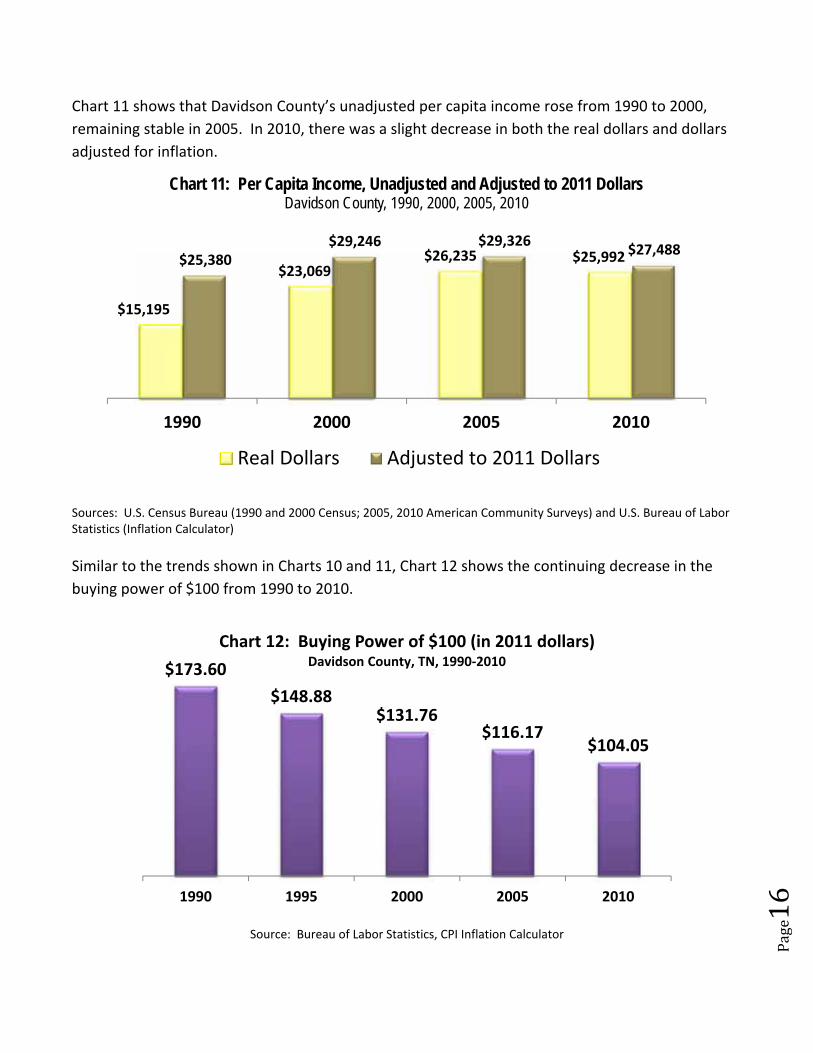
Chart 11 shows that Davidson County’s unadjusted per capita income rose from 1990 to 2000,
remaining stable in 2005. In 2010, there was a slight decrease in both the real dollars and dollars
adjusted for inflation.
Sources: U.S. Census Bureau (1990 and 2000 Census; 2005, 2010 American Community Surveys) and U.S. Bureau of Labor Statistics (Inflation Calculator)
Similar to the trends shown in Charts 10 and 11, Chart 12 shows the continuing decrease in the
buying power of $100 from 1990 to 2010.
Source: Bureau of Labor Statistics, CPI Inflation Calculator
$15,195
$23,069 $26,235 $25,992 $25,380
$29,246 $29,326 $27,488
1990 2000 2005 2010
Chart 11: Per Capita Income, Unadjusted and Adjusted to 2011 DollarsDavidson County, 1990, 2000, 2005, 2010
Real Dollars Adjusted to 2011 Dollars
$173.60
$148.88 $131.76
$116.17 $104.05
1990 1995 2000 2005 2010
Chart 12: Buying Power of $100 (in 2011 dollars)Davidson County, TN, 1990‐2010
Page17
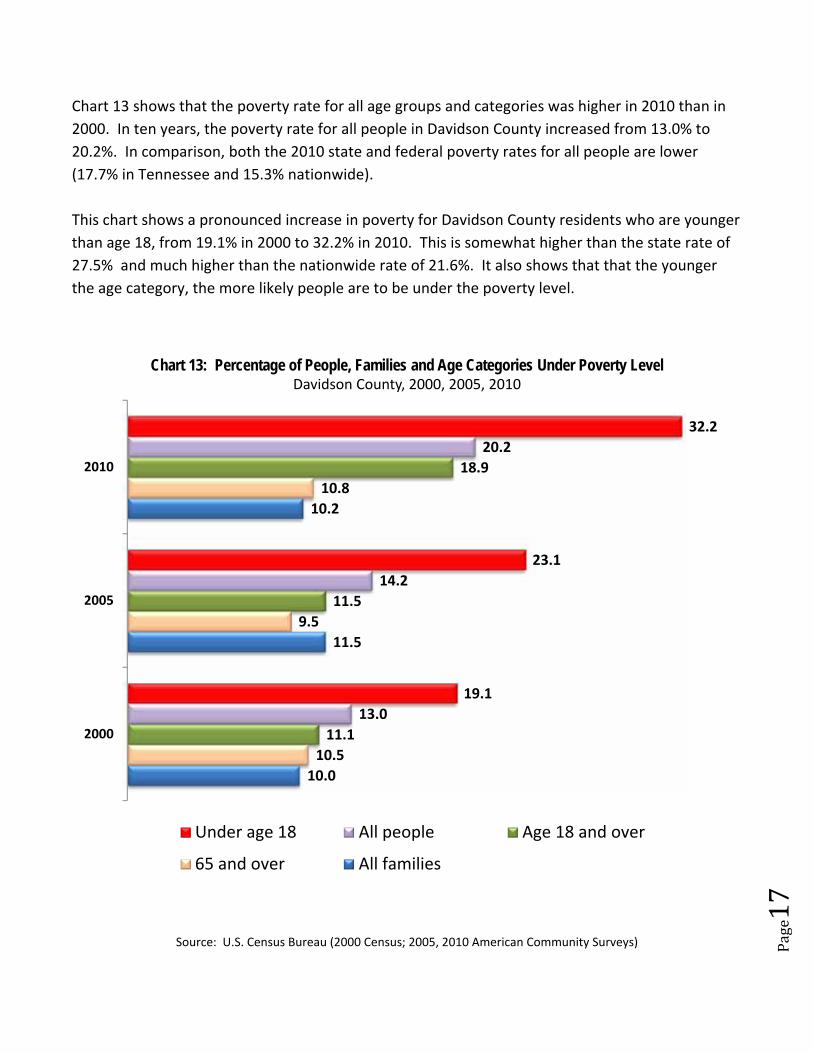
Chart 13 shows that the poverty rate for all age groups and categories was higher in 2010 than in
2000. In ten years, the poverty rate for all people in Davidson County increased from 13.0% to
20.2%. In comparison, both the 2010 state and federal poverty rates for all people are lower
(17.7% in Tennessee and 15.3% nationwide).
This chart shows a pronounced increase in poverty for Davidson County residents who are younger
than age 18, from 19.1% in 2000 to 32.2% in 2010. This is somewhat higher than the state rate of
27.5% and much higher than the nationwide rate of 21.6%. It also shows that that the younger
the age category, the more likely people are to be under the poverty level.
Source: U.S. Census Bureau (2000 Census; 2005, 2010 American Community Surveys)
10.0
11.5
10.2
10.5
9.5
10.8
11.1
11.5
18.9
13.0
14.2
20.2
19.1
23.1
32.2
2000
2005
2010
Chart 13: Percentage of People, Families and Age Categories Under Poverty LevelDavidson County, 2000, 2005, 2010
Under age 18 All people Age 18 and over
65 and over All families
Page18
It is important to note that the 2010 data includes the time period of the May 2010 flood that
caused significant damage in Davidson County and surrounding areas. While it is likely that the
flood had some deterimental effect on the rate of poverty, as well as the shortage of affordable
housing and unemployment, no data is available from the U. S. Census Bureau to determine
specifically how the 2010 flood had an effect on the 2010 data.
The flood occurred during a slow recovery from a major recession, so it is difficult to isolate the
impact of the flood from that of the recession. Data from the time periods before and after can be
compared, but neither the long‐term nor short‐term detriment can be shown in exact terms. The
web site of the Mayor’s Office of Recovery provides this information about the damage and the
recovery efforts:
Rainfall exceeded 17 inches, the highest amount in more than 140 years of recorded
history. The Cumberland River crested in Nashville at 51.86 feet, 12 feet above flood stage.
According to Metro Planning and Metro Codes, the flood resulted in an estimated $2 billion
in damages to private property.
11 people died as a result of the flood.
In the year following the flood, 25,000 volunteers gave more than 330,000 service hours to
recovery and rebuilding efforts.
The Nashville Area Chamber of Commerce reported 2,773 impacted businesses with 14,499
workers at the time of the flood. Of those jobs lost, 1,528 are considered unlikely to return.
Metro’s We Are Home program has awarded more than $12 million in grants and loans to
residents for home rebuilding and repairs.
FEMA received 20,189 Individual Assistance applications and approved 12,903, totaling
more than $87 million. It also funded 768 Public Assistance projects totaling more than $53
million. http://www.nashvillerecovery.com/
Chart 18 in the section of this document with 2‐1‐1 Call Center data shows the calls about disaster
services reached an especially high peak during May 2010, but dropped rapidly the following
month. Gradually the volume of calls about disaster services decreased to pre‐flood levels.
2010 Flood
Page19
Income poverty means simply the lack of income or a shortage of material goods, but human
poverty means much more. It can include a loss of dignity, a sense of powerlessness, a lack of
autonomy and control, and the perception of being marginalized or excluded politically, socially, or
psychologically. The deprivation of what most of society considers necessary can result in the
diminution of aspirations and achievements, especially for poor children who are very aware of
what they are missing.
Poverty Definitions
The U. S. Census Bureau has definitions for subcategories of poverty. For example:
Chronic or long‐term poverty means those who have been in poverty every month for the
duration of a longitudinal study (typically 3‐4 years).
Episodic poverty refers to people who were poor in two or more consecutive months in a
given time period, which is computed using longitudinal survey data (surveys in which
respondents are interviewed multiple times over a period of time).
Poverty is determined by the money income thresholds that vary by family size and
composition (in accordance with OMB Statistical Policy Directive 14) If a family's total
income is less than the threshold based on the size of the family, then every individual in
that family is considered in poverty. While official poverty thresholds do not vary
geographically, they are updated for inflation using Consumer Price Index. The official
poverty definition uses money income before taxes and does not include capital gains or
noncash benefits (such as public housing, Medicaid, and food stamps).
The poverty rate is the percentage of people (or families) who are below poverty.
“Federal Poverty Level” has been described by the U. S. Department of Health and Human
Services as a phrase that is “ambiguous and should be avoided, especially in situations (e.g.,
legislative or administrative) where precision is important."
Poverty
Page20
Poverty spells are also measured by longitudinal survey data that lasts at least two months
and are separated by two or more months of not being in poverty.
Poverty thresholds are the dollar amounts the Census Bureau uses to determine poverty
status. (Eligibility for federally‐funded programs may be income at or below 100% of
poverty, or some other percent of poverty, as identified in the programs’ threshold poverty
guidelines.)
The Census Bureau refers to those who are below the identified poverty level as “poor.” The term
“near poverty” is not well‐defined and has been used in various ways, such as to describe those
who are less than 125% of poverty or families/households with income of less than $45,000.
“Working poor” is not an official term used by the Census Bureau, and there are various meanings
of working poor: people who worked but their income was below the official definition of poverty;
people who were in poverty and had at least one working family member; people who may not
meet the official measure of poverty but who fall below some percentage of the poverty level
(such as below 200% of poverty, which some other organizations define as working poor).
“Deep poverty” is another term not defined or used by the Census Bureau. Some organizations
define it as those who live below 50% of poverty.
http://www.census.gov/hhes/www/poverty/methods/definitions.html
http://aspe.hhs.gov/poverty/faq.shtml
Poverty is complex and there is no universally accepted definition. Some definitions describe what
is lacking that affects the quality of a person’s life. Definitions may generally describe what is
lacking in money and material possessions, or that persons are unable to afford basic human
needs, or they experience a level of material deprivation below which an individual suffers
emotionally and socially.
U. S. Poverty Threshold
The Census Bureau’s poverty threshold for 2010 is based on calculations that increase depending
on the number and age of people in the household and the family’s annual income. The poverty
threshold for a person under age 65 is $11,344 and $10,458 if the person is 65 or older. The
threshold is slightly lower, a difference of about $850 per year, if the householder is age 65 or
older, with additional adjustments for each additional minor child.
Page21
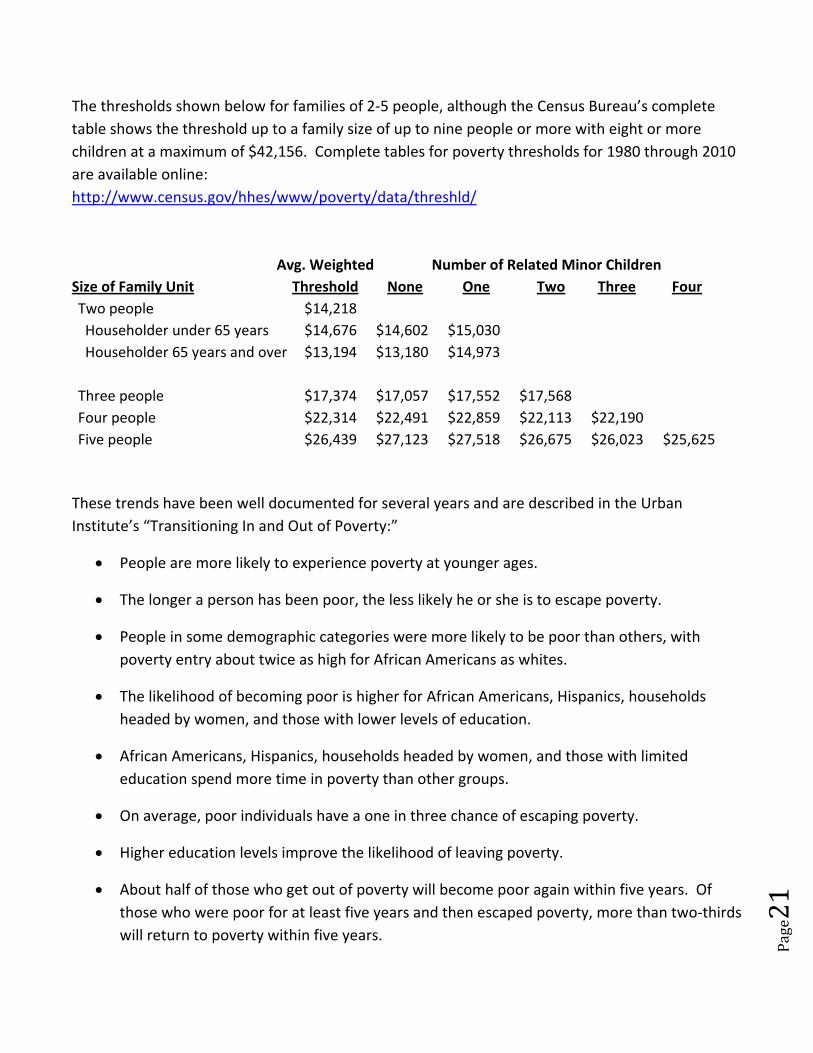
The thresholds shown below for families of 2‐5 people, although the Census Bureau’s complete
table shows the threshold up to a family size of up to nine people or more with eight or more
children at a maximum of $42,156. Complete tables for poverty thresholds for 1980 through 2010
are available online:
http://www.census.gov/hhes/www/poverty/data/threshld/
Avg. Weighted Number of Related Minor Children
Size of Family Unit Threshold None One Two Three Four
Two people $14,218
Householder under 65 years $14,676 $14,602 $15,030
Householder 65 years and over $13,194 $13,180 $14,973
Three people $17,374 $17,057 $17,552 $17,568
Four people $22,314 $22,491 $22,859 $22,113 $22,190
Five people $26,439 $27,123 $27,518 $26,675 $26,023 $25,625
These trends have been well documented for several years and are described in the Urban
Institute’s “Transitioning In and Out of Poverty:”
People are more likely to experience poverty at younger ages.
The longer a person has been poor, the less likely he or she is to escape poverty.
People in some demographic categories were more likely to be poor than others, with
poverty entry about twice as high for African Americans as whites.
The likelihood of becoming poor is higher for African Americans, Hispanics, households
headed by women, and those with lower levels of education.
African Americans, Hispanics, households headed by women, and those with limited
education spend more time in poverty than other groups.
On average, poor individuals have a one in three chance of escaping poverty.
Higher education levels improve the likelihood of leaving poverty.
About half of those who get out of poverty will become poor again within five years. Of
those who were poor for at least five years and then escaped poverty, more than two‐thirds
will return to poverty within five years.
Page22
Job gains and pay raises most often lift a household out of poverty. For the 50‐70% who
leave poverty, they do so because a family member got a job or increased earnings.
Shifts from female‐headed to two‐parent households and increases in educational
attainment help lift households out of poverty.
http://www.urban.org/UploadedPDF/411956_transitioningpoverty.pdf
The data used above is from the U. S. Bureau for individual year American Community Surveys and
the decennial Census. For the first time at the end of 2010, the U. S. Census Bureau released a
five‐year data set covering the 5‐year period of 2005‐2009. Late in 2011, it released the data set
for 2006‐2010. The Census Bureau indicates that the longer reporting period provides more
accurate and reliable data than the annual data. Even though the 5‐year data cannot be used to
track annual trends and is less current than the annual reports, the greater reliability makes it
useful as an overview of longer‐term conditions.
An additional advantage to using the 5‐year data from the American Community Survey is that it
breaks down data into smaller geographic groups (rather than combined countywide data). The 5‐
year data sets can be used to reflect demographic, economic and social factors by Metropolitan
Council District or other geographic areas. Metropolitan Social Services‐Planning & Coordination
will continue to analyze and report on other 2006‐2010 data in future newsletters available at:
http://www.nashville.gov/sservices/newsletter.asp
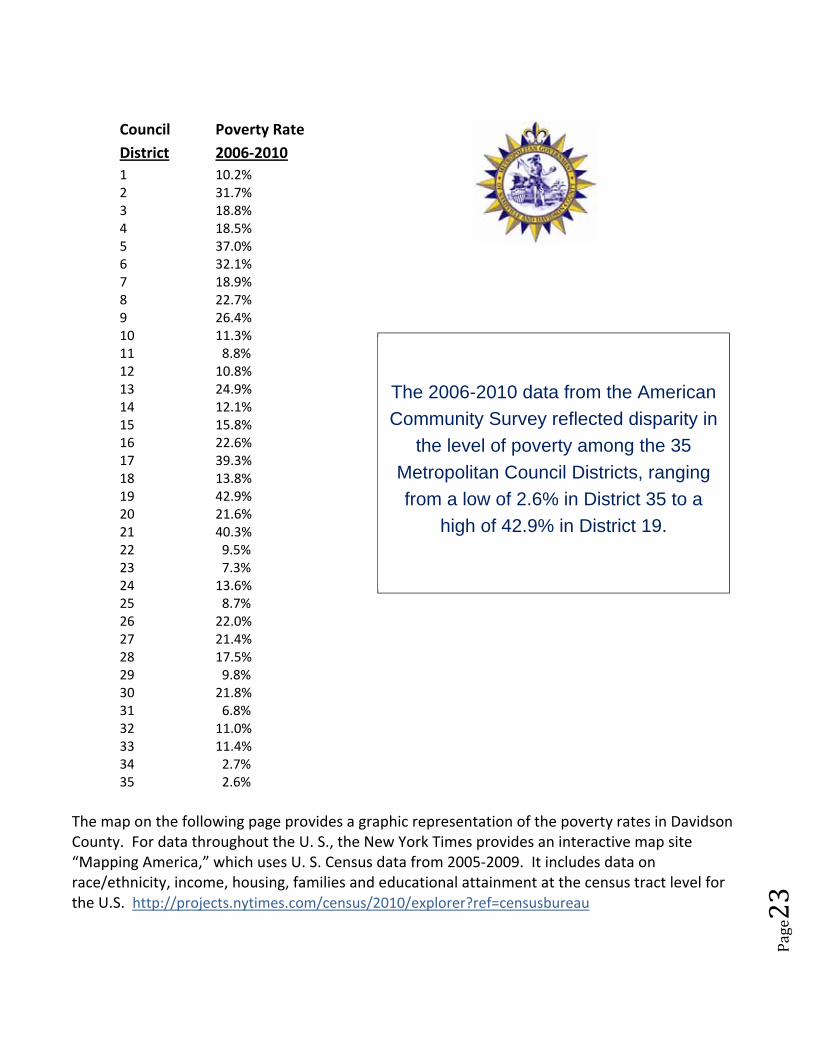
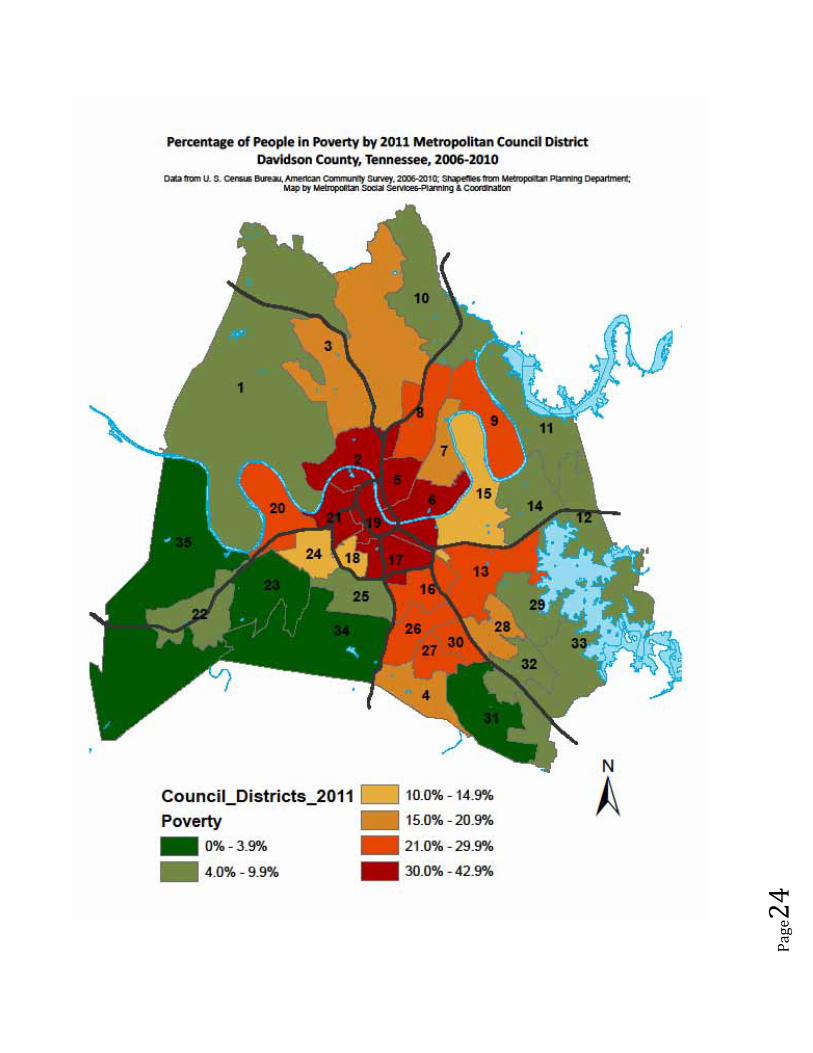
According to the 2006‐2010 data, this is the percentage of people living in poverty in each District
of the Metropolitan Council. (Council Districts are based on similar population sizes, allowing for a
better comparison. Zip Codes are used sometimes, but they are based on residential and
commercial mail volume and determined by the U. S. Postal Service.)
Davidson County’s 2000 data shows that those under age 18 were almost
twice as likely to be in poverty than those who were age 65 and over.
In 2010, the increase in poverty for minor children now makes them more
than three times as likely to be in poverty than those over 65.
Page23
Council Poverty Rate
District 2006‐2010
1 10.2% 2 31.7% 3 18.8% 4 18.5% 5 37.0% 6 32.1% 7 18.9% 8 22.7% 9 26.4% 10 11.3% 11 8.8% 12 10.8% 13 24.9% 14 12.1% 15 15.8% 16 22.6% 17 39.3% 18 13.8% 19 42.9% 20 21.6% 21 40.3% 22 9.5% 23 7.3% 24 13.6% 25 8.7% 26 22.0% 27 21.4% 28 17.5% 29 9.8% 30 21.8% 31 6.8% 32 11.0% 33 11.4% 34 2.7% 35 2.6%
The map on the following page provides a graphic representation of the poverty rates in Davidson County. For data throughout the U. S., the New York Times provides an interactive map site “Mapping America,” which uses U. S. Census data from 2005‐2009. It includes data on race/ethnicity, income, housing, families and educational attainment at the census tract level for the U.S. http://projects.nytimes.com/census/2010/explorer?ref=censusbureau
The 2006-2010 data from the American
Community Survey reflected disparity in
the level of poverty among the 35
Metropolitan Council Districts, ranging
from a low of 2.6% in District 35 to a
high of 42.9% in District 19.
Page24
Page25
Supplemental Poverty Measure
More than 15 years ago, the National Academy of Sciences identified several major weaknesses in
the current poverty measure, such as:
The current measure does not reflect the government policies that alter the disposable
income available to families. For example, the in‐kind Food Stamp/SNAP programs frees up
resources to spend on nonfood items.
The current measure does not adjust for rising levels and standards of living since 1965. In
1963‐1964, the official threshold was approximately equal to half of the median income.
However, by 1992, half the median income had increased to more than 120% of the
threshold.
The current measure does not consider necessary work‐related expenditures that reduce
disposable income (transportation, child care, etc.).
The current measure does not consider the variation in medical costs due to health status,
insurance coverage and the rising share of health care costs.
The current poverty threshold does not consider the changes in family structure or the
effect of these changes on budgets and expenditures (child support or cohabitation among
unmarried couples).
The current poverty thresholds do not consider the differences in prices across the nation,
despite the difference in prices in different geographic areas.
After years of discussion about flaws in how poverty is measured by the U. S. Census Bureau, in
2009 the Office of Management and Budget formed an Interagency technical Working Group on
Developing a Supplemental Poverty Measure. They subsequently completed a document
reporting on their work, “Observations from the Interagency Technical Working Group on
Developing a Supplemental Poverty Measure.”
On March 2, 2010, the U. S. Census Bureau announced that in 2011 it would develop a new
measurement to complement but not replace the existing measure.
On November 7, 2011, the U. S. Census Bureau issued Current Population Reports‐Supplemental
Poverty Measure: 2010, with national and limited regional data to show how and why the rates of
Page26
poverty differ from the current standard measure to the more comprehensive Supplemental
Poverty Measure.
http://www.census.gov/prod/2011pubs/p60‐241.pdf
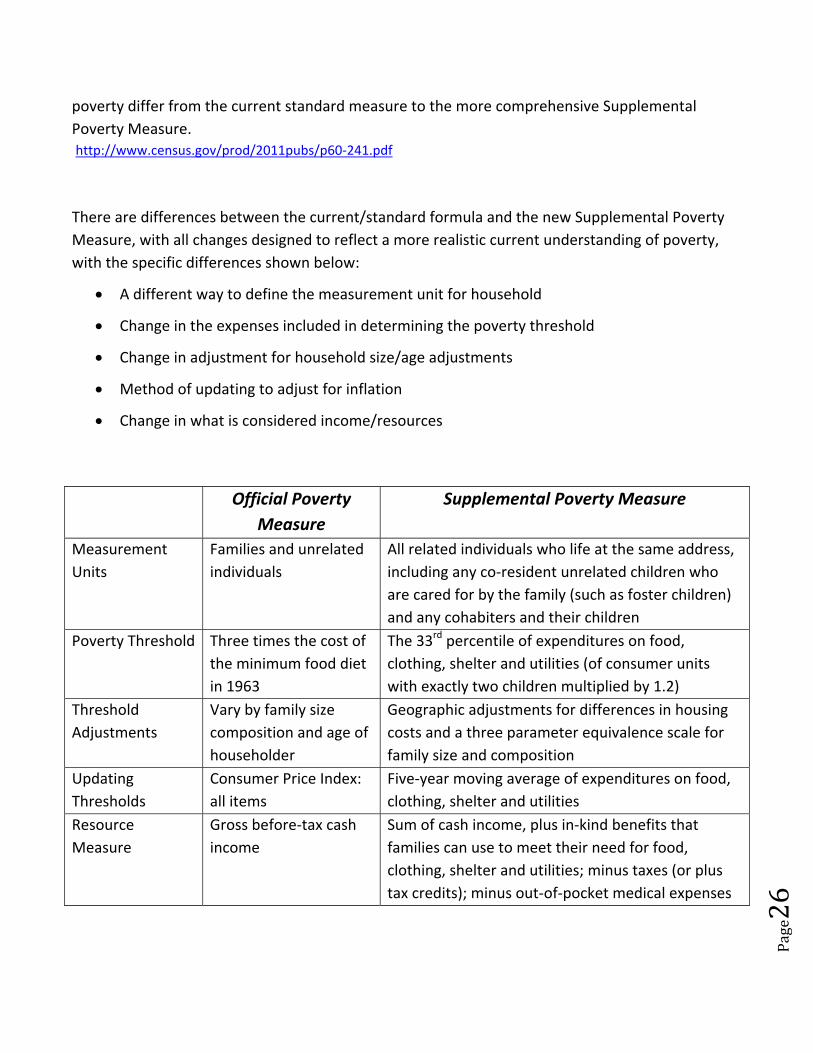
There are differences between the current/standard formula and the new Supplemental Poverty
Measure, with all changes designed to reflect a more realistic current understanding of poverty,
with the specific differences shown below:
A different way to define the measurement unit for household
Change in the expenses included in determining the poverty threshold
Change in adjustment for household size/age adjustments
Method of updating to adjust for inflation
Change in what is considered income/resources
Official Poverty
Measure
Supplemental Poverty Measure
Measurement
Units
Families and unrelated
individuals
All related individuals who life at the same address,
including any co‐resident unrelated children who
are cared for by the family (such as foster children)
and any cohabiters and their children
Poverty Threshold Three times the cost of
the minimum food diet
in 1963
The 33rd percentile of expenditures on food,
clothing, shelter and utilities (of consumer units
with exactly two children multiplied by 1.2)
Threshold
Adjustments
Vary by family size
composition and age of
householder
Geographic adjustments for differences in housing
costs and a three parameter equivalence scale for
family size and composition
Updating
Thresholds
Consumer Price Index:
all items
Five‐year moving average of expenditures on food,
clothing, shelter and utilities
Resource
Measure
Gross before‐tax cash
income
Sum of cash income, plus in‐kind benefits that
families can use to meet their need for food,
clothing, shelter and utilities; minus taxes (or plus
tax credits); minus out‐of‐pocket medical expenses
Page27
While all changes are important, perhaps the most significant in determining the rate of poverty
for specific demographic groups are:
The Supplemental Poverty Measure’s inclusion of other basic expenditures (clothing,
shelter, utilities) along with food, to determine poverty.
The Supplemental Poverty Measure’s addition of consideration for the different levels of
housing costs depending on whether a household rents or owns their residence, and
whether or not there is a mortgage on the residence if it is owned.
The Supplemental Poverty Measure’s change in how resources/income is measured, by
adding in‐kind benefits that provide food, clothing, shelter or utilities; by subtracting the
taxes that are paid from income; and providing consideration for out‐of‐pocket medical
expenses.
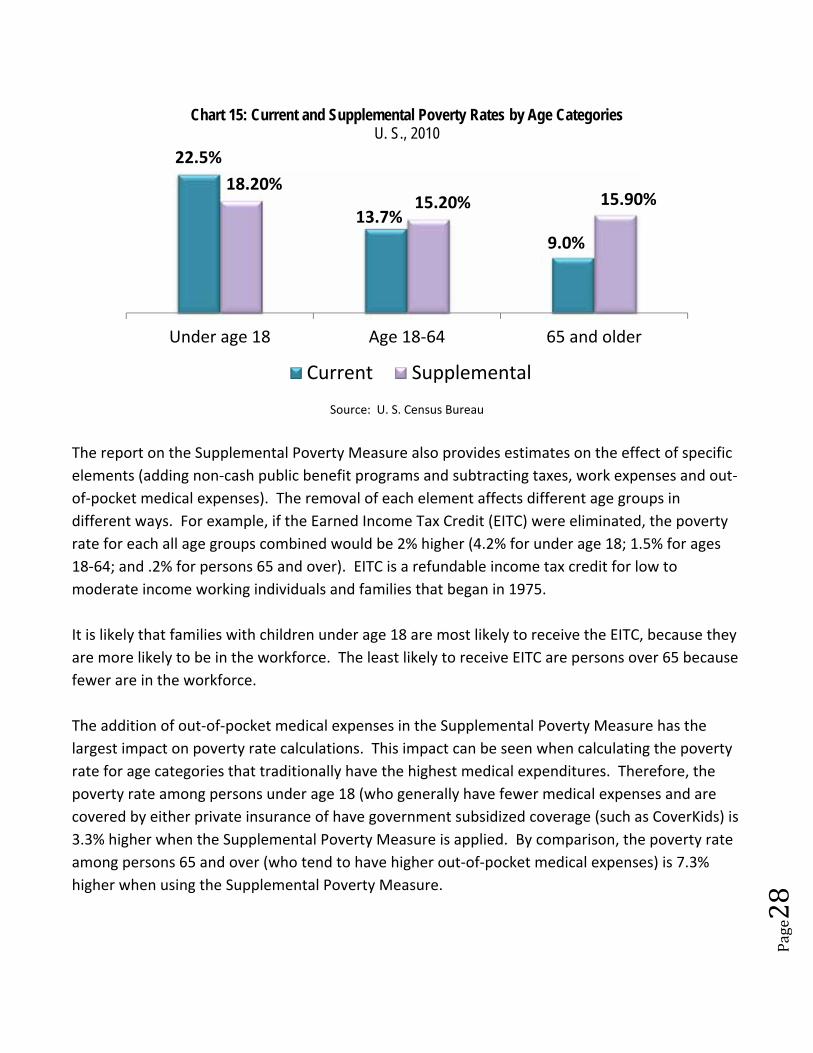
Using the more comprehensive measurement of the Supplemental Poverty Measure changes the
proportion of people in poverty for different age categories. For example, Chart 15 shows the
difference in poverty rates using the current poverty measure and the Supplemental Poverty
Measure.
The Supplemental Poverty Measure shows a 4.3% lower rate of poverty for minor children under
age 18, which may be due to the consideration of non‐cash benefits available to younger recipients
(SNAP, WIC, etc.). The 6.9% increase in the rate of poverty for persons aged 65 and over is
probably due to the consideration used for out‐of‐pocket medical expenses (usually higher for
older age groups).
The Supplemental Poverty Measure estimates that 15.9% of people over
age 65 are in poverty, rather than the 9.0% estimated by the current
measure (which does not consider out‐of‐pocket medical expenses).
Page28
Source: U. S. Census Bureau
The report on the Supplemental Poverty Measure also provides estimates on the effect of specific
elements (adding non‐cash public benefit programs and subtracting taxes, work expenses and out‐
of‐pocket medical expenses). The removal of each element affects different age groups in
different ways. For example, if the Earned Income Tax Credit (EITC) were eliminated, the poverty
rate for each all age groups combined would be 2% higher (4.2% for under age 18; 1.5% for ages
18‐64; and .2% for persons 65 and over). EITC is a refundable income tax credit for low to
moderate income working individuals and families that began in 1975.
It is likely that families with children under age 18 are most likely to receive the EITC, because they
are more likely to be in the workforce. The least likely to receive EITC are persons over 65 because
fewer are in the workforce.
The addition of out‐of‐pocket medical expenses in the Supplemental Poverty Measure has the
largest impact on poverty rate calculations. This impact can be seen when calculating the poverty
rate for age categories that traditionally have the highest medical expenditures. Therefore, the
poverty rate among persons under age 18 (who generally have fewer medical expenses and are
covered by either private insurance of have government subsidized coverage (such as CoverKids) is
3.3% higher when the Supplemental Poverty Measure is applied. By comparison, the poverty rate
among persons 65 and over (who tend to have higher out‐of‐pocket medical expenses) is 7.3%
higher when using the Supplemental Poverty Measure.
22.5%
13.7%
9.0%
18.20%15.20% 15.90%
Under age 18 Age 18‐64 65 and older
Chart 15: Current and Supplemental Poverty Rates by Age CategoriesU. S., 2010
Current Supplemental
Page29
Income Distribution
In October 2011, the U. S. Congressional Budget Office reported on the effects of the economy on
households in “Trends in the Distribution of Household Income Between 1979 and 2007.” They
studied household income and found an average income growth of 62%, with a dramatically
steeper increase for those in the highest income brackets.
The greatest percentage and amount of growth was in the 1% of the population with the highest
income, which grew 275%. This compares to the 20% of the population in the category
immediately below that with income in the 81‐92 percentile, which grew by 65%. For the 20% of
households with the lowest income, the average real after‐tax income was about 18% higher in
2007 than it was in 1979. It noted that “As a result of that uneven income growth, the distribution
of after‐tax household income in the United States was substantially more unequal in 2007 than in
1979: The share of income accruing to higher‐income households increased, whereas the share
accruing to other households declined.”
http://www.cbo.gov/ftpdocs/124xx/doc12485/10‐25‐HouseholdIncome.pdf
Poverty Projections
While it is generally agreed among economists that the recent recession lasted from December
2007 through June 2009, the recovery has been slower than expected. The economic downturn
was not limited to the U. S., but extended to a global economic crisis for many countries.
“An Update to Simulating the Effect of the Great Recession on Poverty” (Center on Children and
Families of the Brookings Institution, September 13, 2011) projected the effect of the recession on
poverty and unemployment through 2020. It noted that the projections for 2012 and beyond have
During long‐term unemployment, families deplete their
assets and resources, which will make it more difficult
for them to move out of poverty.
Page30
become more pessimistic than during the previous year (because of stagnant recovery and more
negative unemployment projections).
Brookings based projections on data from both the U. S. Congressional Budget Office (CBO) and
the U. S. Office of Management and Budget, which anticipate a similar pattern in the nationwide
poverty rate. Both sets of data show the rate of poverty has peaked and that a slight decrease is
expected in 2013. Gradual decreases are projected through 2020 (to 14.2‐14.3%), although the
2020 poverty rate is expected to be almost as high as it was in 2009 (14.3%), rather than near the
2007 level (12.5%).
The CBO estimates that the “natural” rate of unemployment is 5.2%. The 2011 CBO projection is
that unemployment will not reach 5.3% (the approximate natural rate) until 2016, and they project
an average 5.2% rate for 2017 through 2021.
The September 13, 2011 “Poverty in the United States” report from the Urban Institute suggests
that the rise in poverty does not fully demonstrate the effect of the current unemployment crisis.
Unemployment benefits were helpful for many, and the report estimates that if unemployment
benefits and not been extended and counted as income, 3.2 million people nationwide would have
been in poverty. However, many low‐income workers were not eligible for unemployment
benefits, and others whose benefits were discontinued when their eligibility period ended.
Children in Poverty
A joint report from the Center for American Progress and Half in 10, “Penny Wise, Pound Foolish:
Why Tackling Child Poverty During the Great Recession Makes Economic Sense,” describes the
effects of the disporportionately high rate of poverty for children. While they point out that there
is a statistical correlation with the poverty rate, they indicate that some but not all of the causation
is related to income:
Children born and raised in poverty are more likely to be poor and less likely to experience
upward mobility across generations.
When children start to fall behind in academic achievement, they have difficulty catching
up.
Poor children are more likely to attend lower‐quality public schoools.
Page31
Poor children are more likely to drop out of high school in their teens and less likely to get a
college degree.
Health disparities for poor and less educated children increase into adulthood, resulting in
lower levels of employment and earnings over their working lives.
Those with the lowest levels of employment are more likely to become single parents.
Those with the lowest levels of employment are more likely to engage in criminal activities
and be incarcerated.
“Penny Wise, Pound Foolish” explains the additional long‐term effects of the recession on poor
children. It notes that because one of the factors in the recession was the housing bubble that
burst, nationwide millions of families experienced foreclosure on their home mortgages. The lack
of housing increased the number of homeless children, who are more likely to perform poorly in
school and have behavioral problems.
“Penny Wise, Pound Foolish” describes how a 1% increase in child poverty could cost the U.S.
economy an additional $28 billion, because it has been consistently demonstrated that children
who grow up poor earn less.
“An Update to Simulating the Effect of the Great Recession on Poverty” (Brookings) report
suggests an even more negative poverty projection for children. From the 2007 rate of 18.0%, the
peak years of slightly more than 24% occur until a gradual decrease begins toward the end of 2013.
The 2020 projections are for a children’s poverty rate of 21.6‐22.0% rate of poverty.
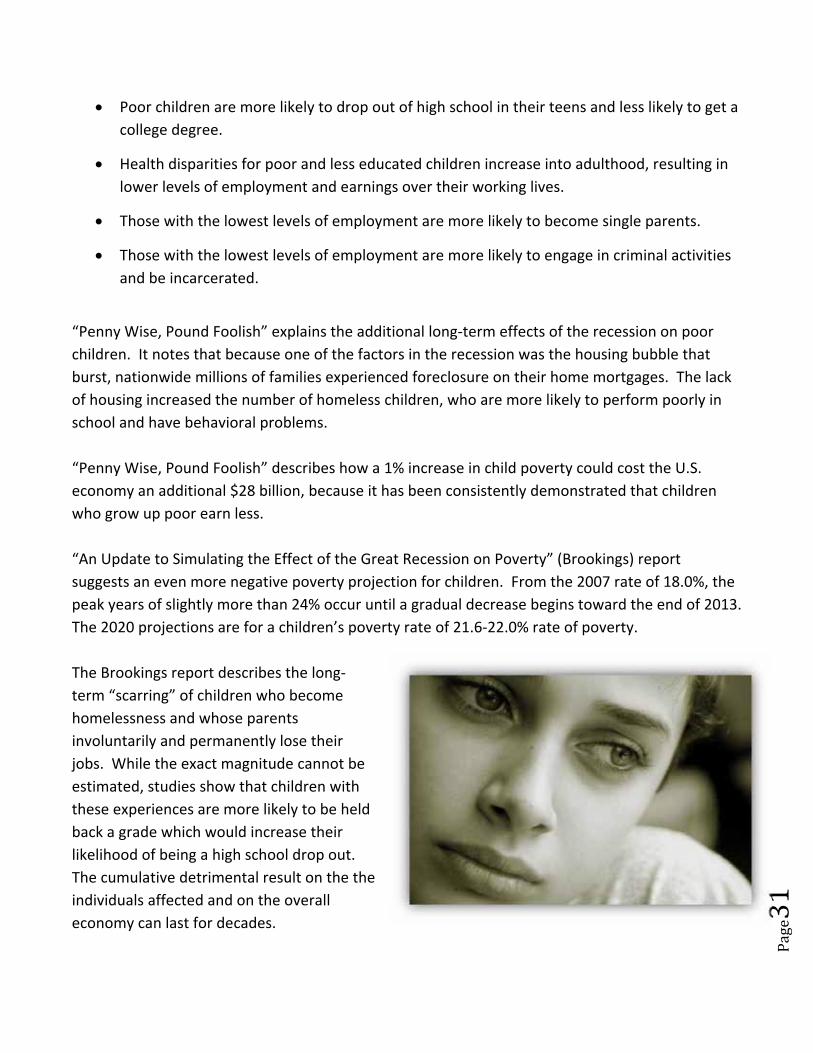
The Brookings report describes the long‐
term “scarring” of children who become
homelessness and whose parents
involuntarily and permanently lose their
jobs. While the exact magnitude cannot be
estimated, studies show that children with
these experiences are more likely to be held
back a grade which would increase their
likelihood of being a high school drop out.
The cumulative detrimental result on the the
individuals affected and on the overall
economy can last for decades.
Page32
Neighborhoods in Poverty
In September 2011, the American Sociological Review published “Neighborhood Effects in
Temporal Perspective: The Impact of Long‐Term Exposure to Concentrated Disadvantage on High
School Graduation.” While there was already ample research showing the detrimental affect of
poor neighborhoods on academic peformance, this research explains the effect of the length of
time the child experiences the poor neighborhood and at what point in childhood is he/she most
negatively affected.
A longitudinal study was conducted over a 17‐year period to estimate the effects of neighborhood
disadvantage on high school graduation. They also found that the effects of poor neighborhoods
affect children directly (through their own experiences) as well as indirectly (through how the
disadvantaged neighborhoods affect their parents). The importance of incorporating a temporal
aspect in to the research was important to understand the greater impact of spending more time
in poor neighborhoods.
This article provides an extensive review of the literature demonstrating the effects experienced by
children who grow up in poor neighborhoods, but adds the important factor of how the length of
time enhances the effect on children. The research focused on the degree to which high school
graduation rates are affected by exposure to disadvantaged neighborhoods (characterized by high
poverty, unemployment, and welfare receipt; many female‐headed households; and few well‐
educated adults).
Among other significant finds, the report stated that “sustained exposure to disadvantaged
neighborhoods throughout the entire childhood life course has a devastating impact on the
chances of graduating from high school. . . Absent more enduring structural changes,
concentrated neighborhood poverty will likely continue to hamper the development of future
generations of children.”
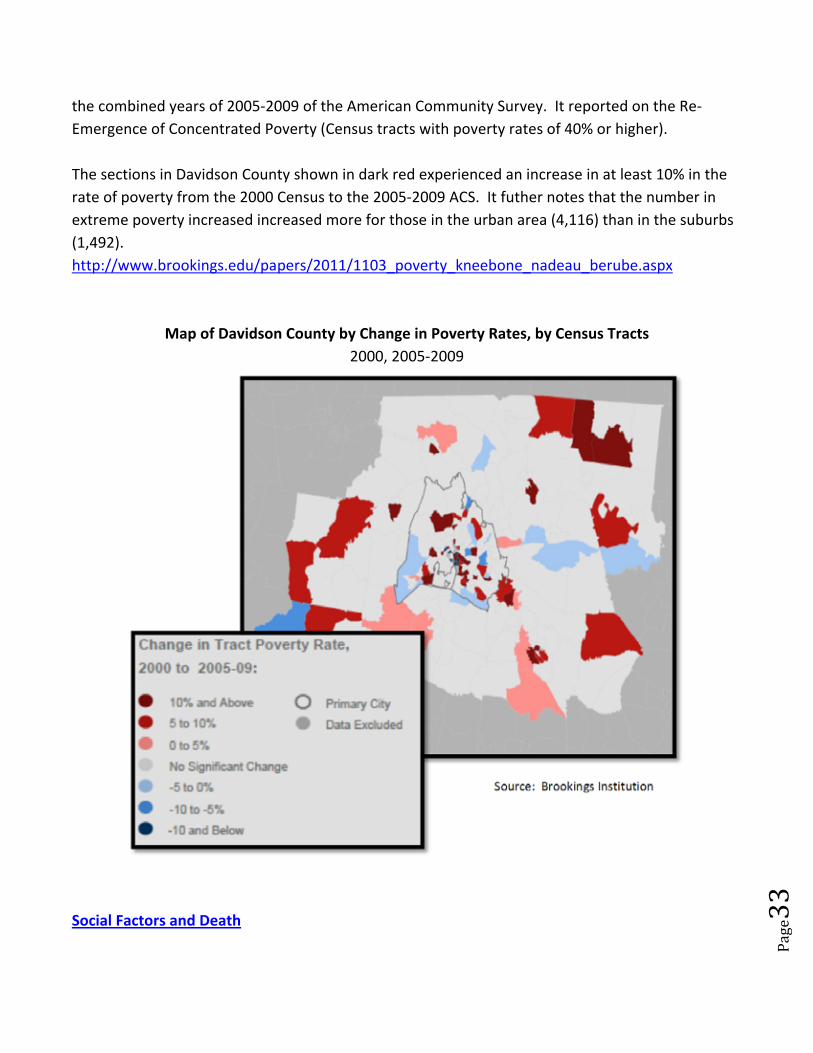
The Metropolitan Policy Program of Brookings Institution created the map below to show the
change in Neighborhood Poverty Rates, and compares data from the 2000 Decennial Census with
This longitudinal data suggests that efforts to improve schools could be more effective when a more comprehensive approach is used to also address poverty in the families and disadvantaged neighborhoods.
Page33
the combined years of 2005‐2009 of the American Community Survey. It reported on the Re‐
Emergence of Concentrated Poverty (Census tracts with poverty rates of 40% or higher).
The sections in Davidson County shown in dark red experienced an increase in at least 10% in the
rate of poverty from the 2000 Census to the 2005‐2009 ACS. It futher notes that the number in
extreme poverty increased increased more for those in the urban area (4,116) than in the suburbs
(1,492).
http://www.brookings.edu/papers/2011/1103_poverty_kneebone_nadeau_berube.aspx
Map of Davidson County by Change in Poverty Rates, by Census Tracts
2000, 2005‐2009
Source: Brookings Institution
Social Factors and Death
Page34
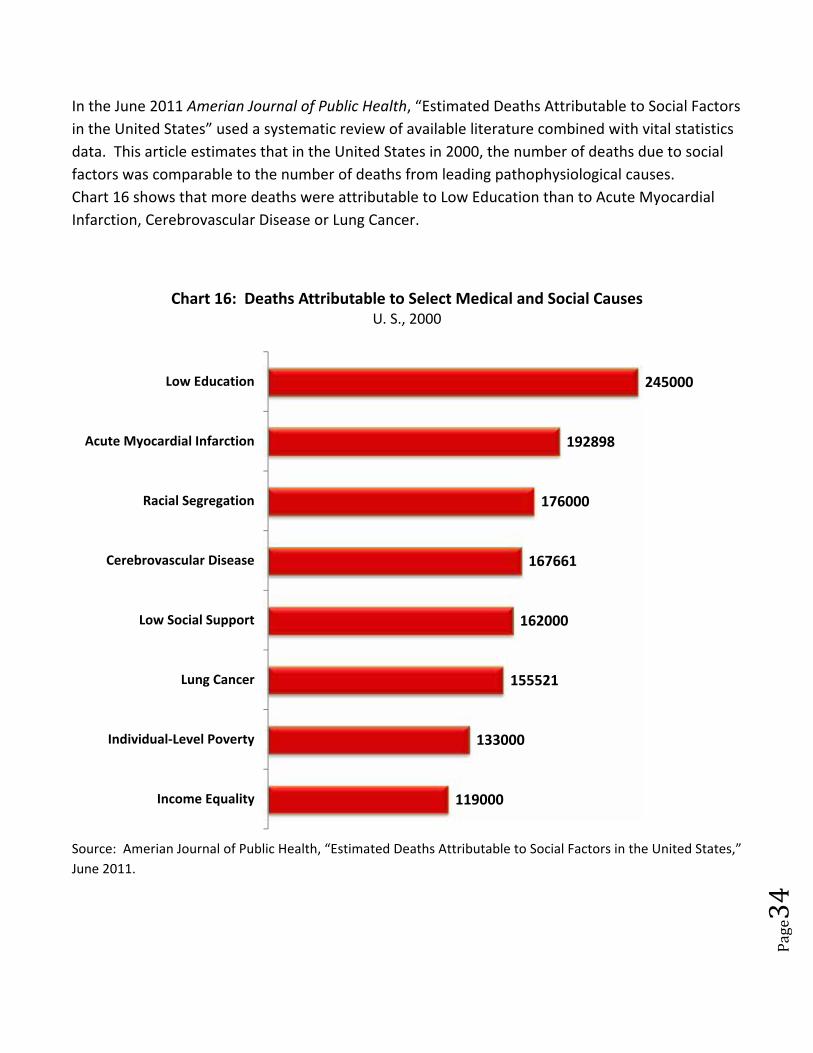
In the June 2011 Amerian Journal of Public Health, “Estimated Deaths Attributable to Social Factors
in the United States” used a systematic review of available literature combined with vital statistics
data. This article estimates that in the United States in 2000, the number of deaths due to social
factors was comparable to the number of deaths from leading pathophysiological causes.
Chart 16 shows that more deaths were attributable to Low Education than to Acute Myocardial
Infarction, Cerebrovascular Disease or Lung Cancer.
Source: Amerian Journal of Public Health, “Estimated Deaths Attributable to Social Factors in the United States,”
June 2011.
119000
133000
155521
162000
167661
176000
192898
245000
Income Equality
Individual‐Level Poverty
Lung Cancer
Low Social Support
Cerebrovascular Disease
Racial Segregation
Acute Myocardial Infarction
Low Education
Chart 16: Deaths Attributable to Select Medical and Social CausesU. S., 2000
Page35
Evidence‐based practice has been used in many fields, most notably with medicine. An
international movement toward evidence‐based social work began in the 1970s.
In the July/August 2009 issue of Social Work Today, “Understanding Evidence‐Based Practice in
Behavioral Health” described issues in regard to using evidence‐based practice in social work.
While noting that many earlier practices identified as evidence‐based have become common
practice, they also described the challenges in definining and measuring what is evidenced‐based.
For example, they noted that there has been some confusion in the term which was originally
applied to the process, but was later used to refer to the practices used rather than the process.
It specifically points out:
It must be clear what the process/practice is based upon.
Methods and the level of evidence should be transparent, and researchers should be clear
on the specific outcomes they were expecting.
It is difficult for social work to use the randomized clinical trials used in medical research,
and individual differences should also be considered.
Evidence‐Based Practice
“The use of research evidence to guide practice and develop policies in
the human services has become increasingly important given the limited
resources and the pressures to document service outcomes. These
pressures have emerged from increased scrutiny of public expenditures
and the call for information about the impact of interventions on the
reduction or elimination of social problems.”
Evidence‐Based Practice in the Social Services: Implications for Organizational Change, School of Social Welfare, University of California‐Berkeley (February 2005) http://calswec.berkeley.edu/calswec/EB_0705_2.1_EBP_FinalFeb05.pdf

Page36
The infrastructure for evidence‐based practice is growing in social work/behavioral health,
but there are no systematic studies measuring its implementation.
If efficacy is demonstrated, the challenges of implementation should be addressed, and
many social work schools are now teaching evidence‐based practice.
It is critical to know that the interventions do not affect the client negatively and that the
likelihood of a positive result is increased.
There are various sources of information about evidence‐based practice, including from the Social
Work Policy Institute, which stated, “This approach ensures that the treatments and services,
when used as intended, will have the most effective outcomes as demonstrated by the research. It
will also ensure that programs with proven success will be more widely disseminated and will
benefit a greater number of people.”
The National Association of Social Workers emphasizes the use of evidence‐based interventions,
and it is working on Partnerships to Integrate Evidence‐Based Treatments into Social Work
Training. It emphasizes the importance of identifying and sharing information about models of
evidence‐based practices.
Doing What Works
The Center for American Progress has identified the next steps in the report on Doing What Works:
Building a Government That Delivers Greater Value and Results to the American People. The report
focuses on eliminating/redesigning misguided spending programs, boosting government
productivity by streamlining management and strengthening operations and building a foundation
for smarter decisions by enhancing transparency, performance measurement and evaluation.
Primarily designed for the federal government, it could be applied to other levels of government.
It describes ways to save money, produce policy results and improve public confidence in
government. It describes how these techniques can be used to produce maximum results:
Challenge the status quo.
Measure what works.
Experiment and innovate.
Coordinate and consolidate.
Enlist the public.
Be ready to execute.
Page37
Collective Impact
“Collective Impact,” in the Winter 2011 Sanford Social Innovation Review, describes how broad
cross‐sector coordination could create large‐scale social change. However, it points out that most
nonprofit sector approaches focus on “isolated impact” which is oriented toward finding and
funding a solution within a single organization. The isolated impact approach may presume that
somehow effective organizations will grow and replicate to expand the impact, although this is
often inaccurate.
The article notes that there is little evidence to suggest that isolated initiatives are the best way to
solve social problems in a complex and interdependent world. It describes the instance in which
isolation may be more effective – when technical problems are being addressed and the problem
is well defined, the answer known in advance and when one or very few organizations have the
ability to implement the solution.
Collective impact approaches have been used to
improve school performance and address
homelessness, and can be applied to any large social
issue. Using a collective impact requires a systemic
approach that focuses on the relationships between
organizations and the progress toward shared
objectives. To achieve collective success requires five
elements:
1. Common Agenda – all participants share the same vision for change (common
understanding of the problem and a joint approach to solving it through agreed upon
actions).
2. Shared Measurement System – shared measurement is essential to collective impact (how
to measure and report success; holding each other accountable and learning from each
other).
3. Mutually Reinforcing Activities – diverse group of stakeholders working together (each
working on specific activities to support and coordinate the actions of other stakeholders).
4. Continuous Communication – involves developing trust among participants (may take years
to recognize and appreciate common motivation behind different types of efforts; takes
No single organization is responsible for any major
social problem, nor can any single organization cure it.

Page38
time to believe own interests will be treated fairly; must develop common vocabulary;
participants must be personally active leaders).
5. Backbone Support Organizations – dedicated staff with responsibility to create and manage
collective impact (providing myriad administrative and logistical types of support separate
from the participating organizations).
Effective collective impact initiatives require significant investment, of both time and funding.
Collective impact requires that funders support a long‐term process of social change without
identifying any particular solution in advance, which requires a fundamental difference in how
funders see their role. Rather than be funders of specific projects, they could lead a long‐term
process to social change.
http://www.fsg.org/tabid/191/ArticleId/211/Default.aspx?srpush=true
Nashville’s Poverty Reduction Initiative
Following the development of the Nashville Poverty Reduction Plan through an initiative led by the
Metropolitan Action Commission and the Nashville Area Chamber of Commerce, Mayor Karl Dean
asked Metropolitan Social Services to “monitor and coordinate the initiative’s implementation as
well as look at any initiatives that may overlap or be better supported by involving additional
resources from existing agencies.”
Seven public‐private Implementation Teams were formed (Child Care, Economic Opportunity,
Food, Health, Housing, Neighborhood Development, Workforce Development), and the Nashville
Poverty Council was formed to support and provide guidance. Metropolitan Social Services is
working with the seven public‐private Implementation Teams to implement recommended actions
from the Poverty Initiative Plan. The first Annual Progress Report is available online.
http://www.nashville.gov/sservices/docs/poverty/NPC‐AnnualReport‐FY2010‐2011.pdf
Poverty Reduction/Alleviation Efforts
Page39
Community Action Agencies
Perhaps the largest and most well‐known nationwide poverty reduction initiative is the system of
Community Action Agencies (CAA) created as part of the 1964 Economic Opportunity Act to fight
poverty by empowering the poor in the United States and its territories, as part of the War on
Poverty. There are more than 1,000 public or private nonprofit CAAs nationwide that carry out the
Community Action Program (CAP). Community Services Block Grants are provided to CAAs to
reduce poverty in their communities.
Services vary among CAAs, although they generally operate some combination of Head Start
programs (early childhood development), Low‐Income Home Energy Assistance (LIHEAP) utility
grants and Weatherization Assistance Program. Metropolitan Action Agency is the Community
Action Program for Davidson County and was created by ordinance on August 12, 1964, for the
purpose of securing and expending federal grants in accordance with regulations regarding the
eradication of poverty.
Catholic Charities USA’s Campaign to Reduce Poverty in America
The Campaign to Reduce Poverty in America describes poverty as a moral and social crisis
threatening our country. Their campaign addresses the importance of promoting changes to
enhance human dignity and the common good, stating, “We must no longer ignore the injustice of
poverty and the extreme inequality in America.” Catholic Charities USA provides social services to
more than 10 million people each year and sponsored a National Poverty Summit in Ft. Worth,
Texas, in September 2011.
http://www.catholiccharitiesusa.org/page.aspx?pid=2286
Through the work of Catholic Charities USA, on September 1, 2011, the National Opportunity and
Community Renewal Act was reintroduced U. S. Senate (S .1565). If approved, it would bring
innovative strategies existing in communities throughout the country that will serve to revamp the
federal approach to poverty prevention and alleviation.
Half in Ten
One of the national initiatives to decrease poverty is Half in Ten, a campaign to cut poverty in half
in ten years, sponsored by the Center for American Progress Action Fund, the Leadership
Conference on Civil and Human Rights and the Coalition on Human Needs. The areas in which they
Page40
work are Child Care, Child Tax Credit, Earned Income Tax Credit, Foreclosure Prevention, Green
Buildings and Green Jobs, Minimum Wage and Unemployment Insurance.
http://halfinten.org/issues
Half in Ten recently released a follow‐up to their 2007 “From Poverty to Prosperity: A National
Strategy to Cut Poverty in Half,” which laid out the policy recommendations that could significantly
cut poverty in the United States. Shortly after the 2007 report was released, the Great Recession
began which affected programs, services and initiatives needed to decrease poverty. The 2010
“Restoring Shared Prosperity: 2010” describes the current state of poverty and how public policies
can be shaped to boost national prosperity and experience economic trends that improve the lives
of all Americans.
http://halfinten.org/indicators/publications/2010report/
Half in Ten’s October 2011 Tennessee Fact Sheet:
http://test.hit‐new.techprogress.org/uploads/support_files/factsheet‐2010‐TN.pdf
Center for American Progress
The Center for American Progress addresses 21st‐century challenges such as energy, national
security, economic growth and opportunity, immigration, education, and health care. It is
dedicated to improving the lives of Americans through progressive ideas and action, by building on
the achievements of progressive pioneers such as Teddy Roosevelt and Martin Luther King. The
Center was founded in 2003 to provide long‐term leadership and support to a progressive
approach that supports the freedom to climb the ladder of economic mobility.
http://www.americanprogress.org/
Page41
Measuring Human Development
The American Human Development Project recently released its second report, The Measure of
America 2010‐2011: Mapping Risks and Resilience that stated, “In chronicling of the American
story, the human development approach seeks to shift focus from the financial sphere of growth
and profits to the human sphere of opportunity and freedom.” This report expands the indicators
used to assess the quality of life beyond income alone:
Health – the capacity to live a long and healthy life;
Education – the access to knowledge;
Income – the capacity to maintain a decent standard of living.
The Human Development Index report ranks various measures by specific geographic areas, with
demographic variables including gender, race and ethnicity. This type of data has been used for
many years to compare countries and is now available for U. S. Congressional Districts, Zip Codes
and states. Both the book and web site have extensive data with breakdowns by multiple factors,
considering risks in each measure:
http://www.measureofamerica.org/the‐measure‐of‐america‐2010‐2011‐book/
The report notes that the measures used are not necessarily correlated. For example, in their
comparison across states, those with higher median income did not necessarily have a longer life
expectancy. Washington, DC, New Jersey and Maryland were the top three for income, but ranked
46th, 16th and 33rd, respectively.
Measuring Human Development
Out of 50 states and the District of Columbia, Tennessee ranks 44th of 51 on the overall American Human Development Index, ranking 4.33 compared to 5.17 nationwide.
Page42
Health – A Long and Healthy Life – Overall Measure: Life Expectancy at Birth, with risk factors:
1. Low birth weight (indicator of population health, especially for medical care for women);
2. Diabetes rates (related to obesity and physical inactivity); and
3. Trauma‐related deaths (preventable deaths from homicide, suicide and unintentional injury
such as car accidents and workplace accidents).
Education – Access to Knowledge – Overall Measure: Educational Attainment (degree attainment
and school enrollment for preschool and above), with risk factors:
1. The percentage of 3‐4 year olds not enrolled in preschool (an important indicator of school
readiness and life chances);
2. Fourth‐graders not demonstrating reading proficiency (a strong predictor of school
performance);
3. Students who do not graduate from high school on time (higher risk of never graduating).
Income – A Decent Standard of Living – Overall Measure: Median Personal Earnings, with risk
factors:
1. Children under age 6 living in households with incomes below the poverty line (vulnerable
to a range of health, cognitive and emotional risks; associated with poor outcomes later).
2. Marginally attached workers (available to work but have stopped trying to find employment
who have looked for work in the past year but not in the past four weeks who are not
included in standard counts of unemployment);
3. Renters with severe housing cost‐burdens (spending more than half of their household
incomes on rent; at risk of forgoing other essential goods and services);
4. Elderly poverty (face trade‐offs in essential areas such as medical care, home‐care services,
energy consumption and food security.
Charts 17, 18 and 19 show the rankings by the Human Development Index, which show the 5th
Congressional District of Tennessee (primarily Davidson County) in context with the statewide and
nationwide ranking with the addition of states ranked the lowest and highest in each measure in
the chart.
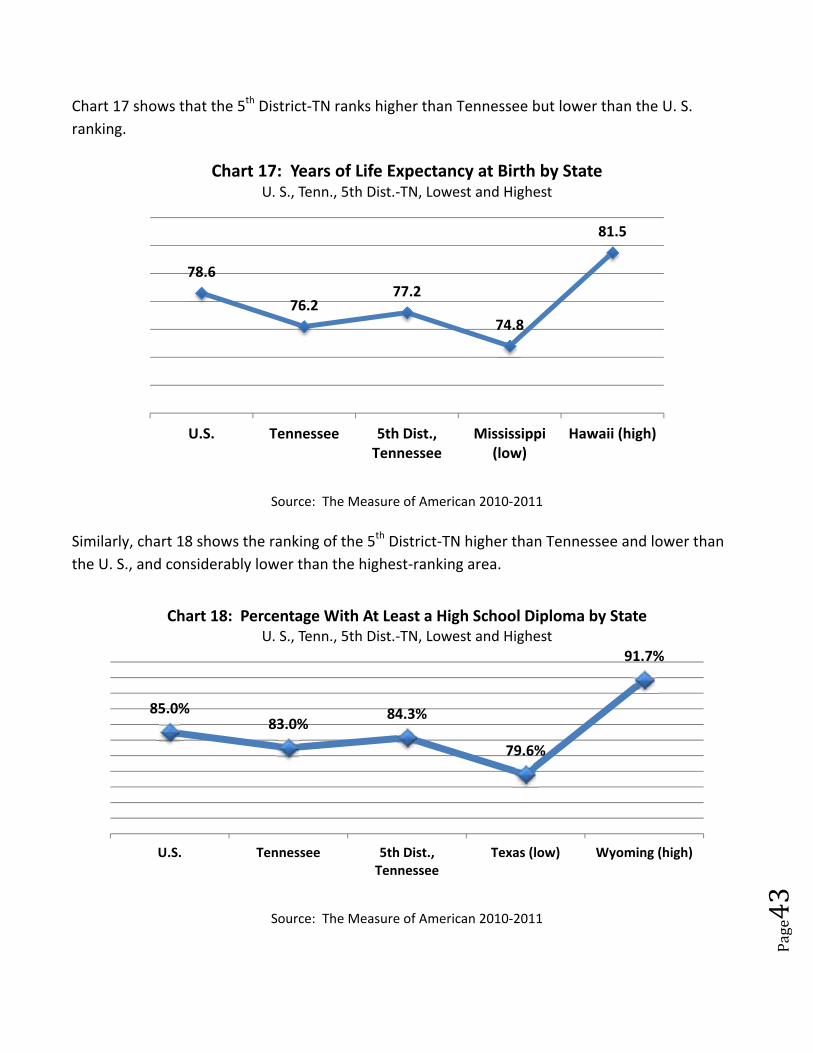
Page43
Chart 17 shows that the 5th District‐TN ranks higher than Tennessee but lower than the U. S.
ranking.
Source: The Measure of American 2010‐2011
Similarly, chart 18 shows the ranking of the 5th District‐TN higher than Tennessee and lower than
the U. S., and considerably lower than the highest‐ranking area.
Source: The Measure of American 2010‐2011
78.6
76.277.2
74.8
81.5
U.S. Tennessee 5th Dist.,Tennessee
Mississippi(low)
Hawaii (high)
Chart 17: Years of Life Expectancy at Birth by StateU. S., Tenn., 5th Dist.‐TN, Lowest and Highest
85.0%83.0%
84.3%
79.6%
91.7%
U.S. Tennessee 5th Dist.,Tennessee
Texas (low) Wyoming (high)
Chart 18: Percentage With At Least a High School Diploma by StateU. S., Tenn., 5th Dist.‐TN, Lowest and Highest
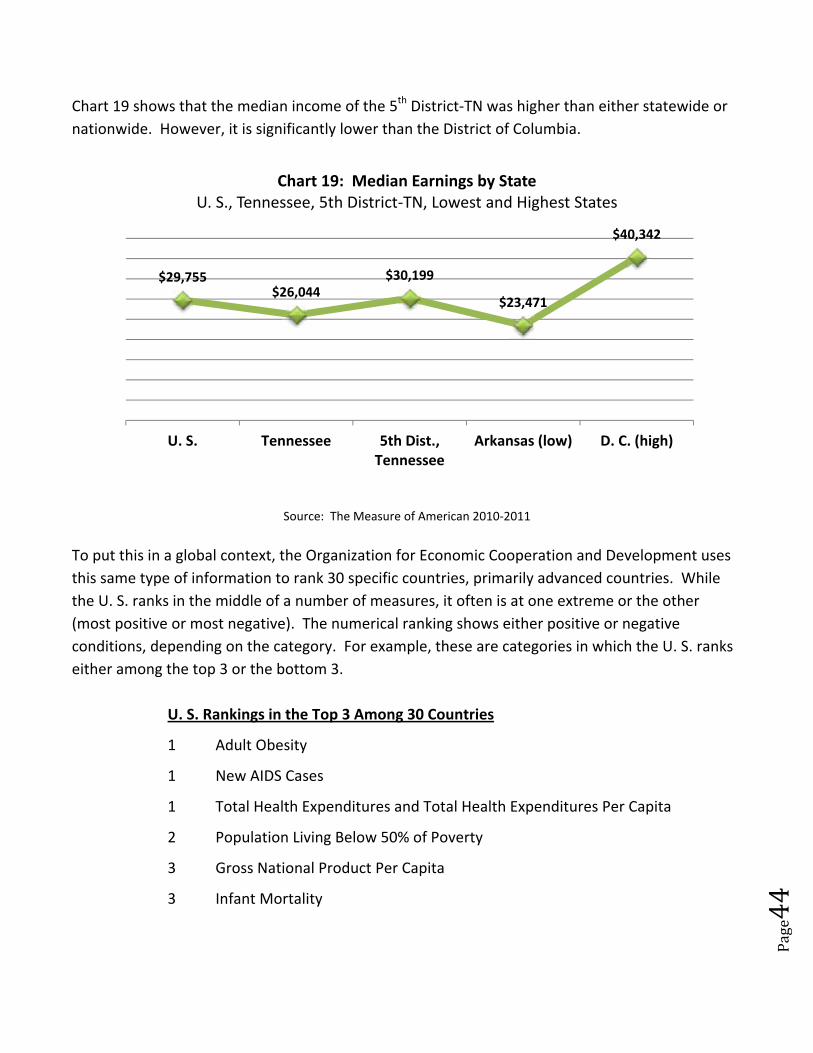
Page44
Chart 19 shows that the median income of the 5th District‐TN was higher than either statewide or
nationwide. However, it is significantly lower than the District of Columbia.
Source: The Measure of American 2010‐2011
To put this in a global context, the Organization for Economic Cooperation and Development uses
this same type of information to rank 30 specific countries, primarily advanced countries. While
the U. S. ranks in the middle of a number of measures, it often is at one extreme or the other
(most positive or most negative). The numerical ranking shows either positive or negative
conditions, depending on the category. For example, these are categories in which the U. S. ranks
either among the top 3 or the bottom 3.
U. S. Rankings in the Top 3 Among 30 Countries
1 Adult Obesity
1 New AIDS Cases
1 Total Health Expenditures and Total Health Expenditures Per Capita
2 Population Living Below 50% of Poverty
3 Gross National Product Per Capita
3 Infant Mortality
$29,755$26,044
$30,199
$23,471
$40,342
U. S. Tennessee 5th Dist.,Tennessee
Arkansas (low) D. C. (high)
Chart 19: Median Earnings by StateU. S., Tennessee, 5th District‐TN, Lowest and Highest States
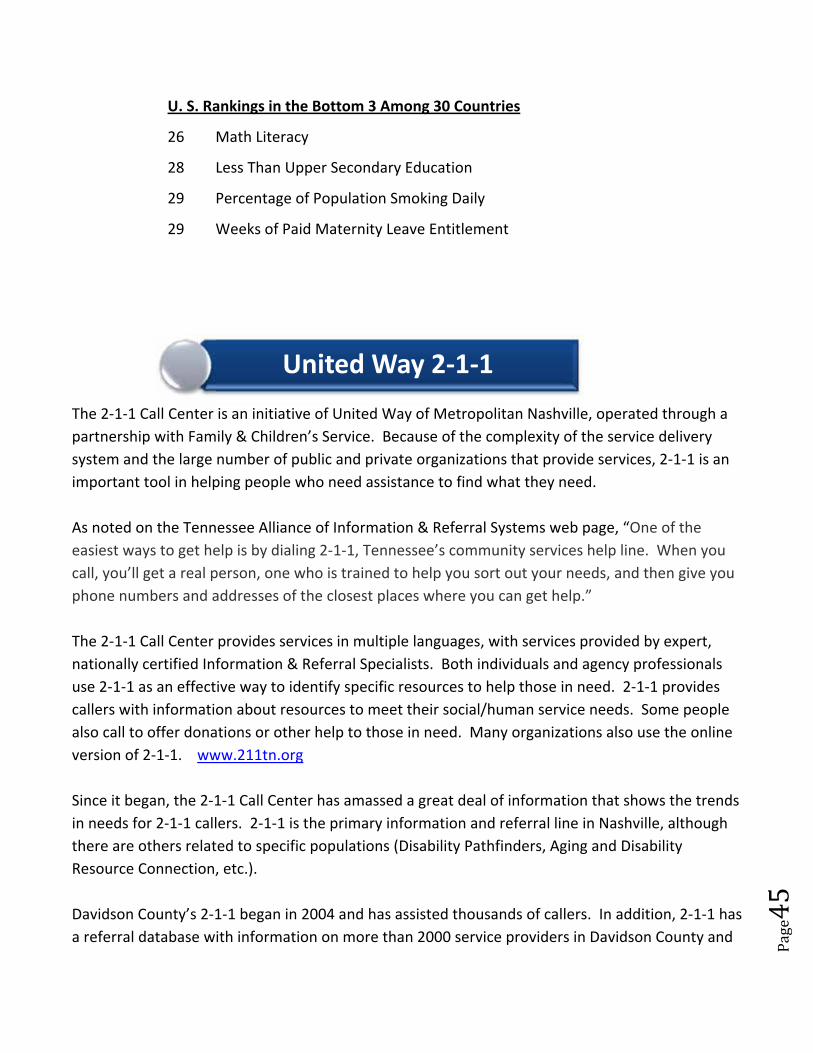
Page45
U. S. Rankings in the Bottom 3 Among 30 Countries
26 Math Literacy
28 Less Than Upper Secondary Education
29 Percentage of Population Smoking Daily
29 Weeks of Paid Maternity Leave Entitlement
The 2‐1‐1 Call Center is an initiative of United Way of Metropolitan Nashville, operated through a
partnership with Family & Children’s Service. Because of the complexity of the service delivery
system and the large number of public and private organizations that provide services, 2‐1‐1 is an
important tool in helping people who need assistance to find what they need.
As noted on the Tennessee Alliance of Information & Referral Systems web page, “One of the
easiest ways to get help is by dialing 2‐1‐1, Tennessee’s community services help line. When you
call, you’ll get a real person, one who is trained to help you sort out your needs, and then give you
phone numbers and addresses of the closest places where you can get help.”
The 2‐1‐1 Call Center provides services in multiple languages, with services provided by expert,
nationally certified Information & Referral Specialists. Both individuals and agency professionals
use 2‐1‐1 as an effective way to identify specific resources to help those in need. 2‐1‐1 provides
callers with information about resources to meet their social/human service needs. Some people
also call to offer donations or other help to those in need. Many organizations also use the online
version of 2‐1‐1. www.211tn.org
Since it began, the 2‐1‐1 Call Center has amassed a great deal of information that shows the trends
in needs for 2‐1‐1 callers. 2‐1‐1 is the primary information and referral line in Nashville, although
there are others related to specific populations (Disability Pathfinders, Aging and Disability
Resource Connection, etc.).
Davidson County’s 2‐1‐1 began in 2004 and has assisted thousands of callers. In addition, 2‐1‐1 has
a referral database with information on more than 2000 service providers in Davidson County and
United Way 2‐1‐1
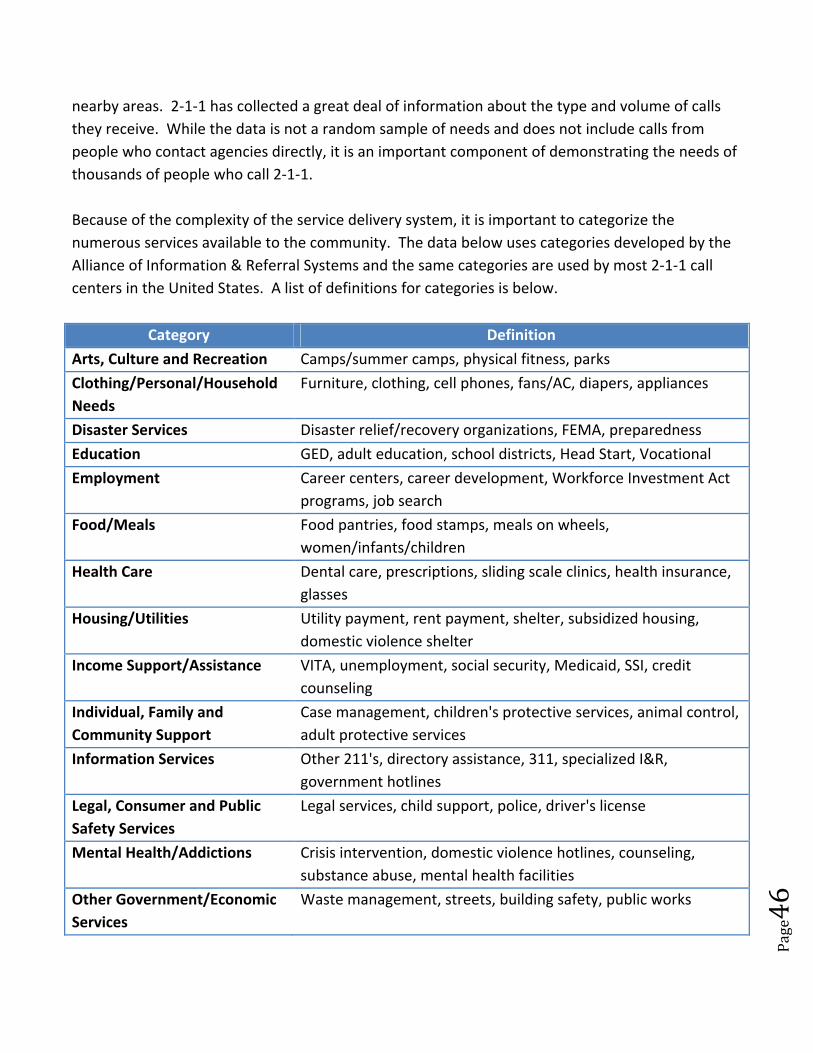
Page46
nearby areas. 2‐1‐1 has collected a great deal of information about the type and volume of calls
they receive. While the data is not a random sample of needs and does not include calls from
people who contact agencies directly, it is an important component of demonstrating the needs of
thousands of people who call 2‐1‐1.
Because of the complexity of the service delivery system, it is important to categorize the
numerous services available to the community. The data below uses categories developed by the
Alliance of Information & Referral Systems and the same categories are used by most 2‐1‐1 call
centers in the United States. A list of definitions for categories is below.
Category Definition
Arts, Culture and Recreation Camps/summer camps, physical fitness, parks
Clothing/Personal/Household
Needs
Furniture, clothing, cell phones, fans/AC, diapers, appliances
Disaster Services Disaster relief/recovery organizations, FEMA, preparedness
Education GED, adult education, school districts, Head Start, Vocational
Employment Career centers, career development, Workforce Investment Act
programs, job search
Food/Meals Food pantries, food stamps, meals on wheels,
women/infants/children
Health Care Dental care, prescriptions, sliding scale clinics, health insurance,
glasses
Housing/Utilities Utility payment, rent payment, shelter, subsidized housing,
domestic violence shelter
Income Support/Assistance VITA, unemployment, social security, Medicaid, SSI, credit
counseling
Individual, Family and
Community Support
Case management, children's protective services, animal control,
adult protective services
Information Services Other 211's, directory assistance, 311, specialized I&R,
government hotlines
Legal, Consumer and Public
Safety Services
Legal services, child support, police, driver's license
Mental Health/Addictions Crisis intervention, domestic violence hotlines, counseling,
substance abuse, mental health facilities
Other Government/Economic
Services
Waste management, streets, building safety, public works
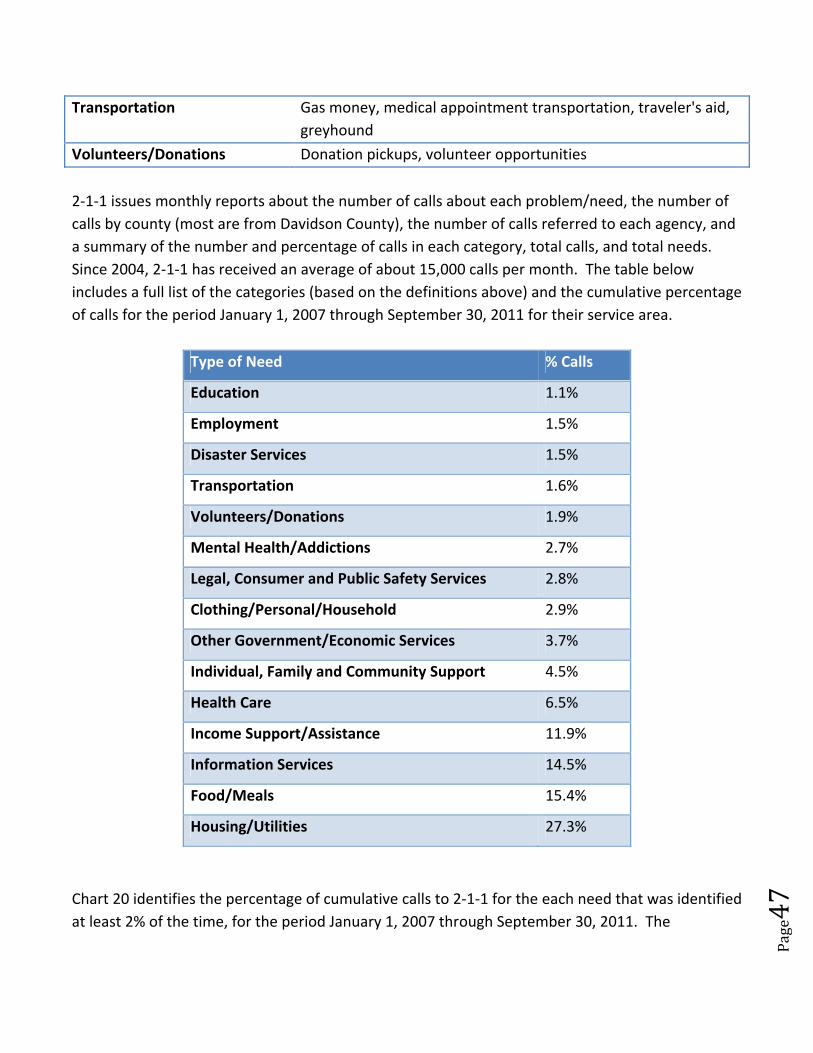
Page47
Transportation Gas money, medical appointment transportation, traveler's aid,
greyhound
Volunteers/Donations Donation pickups, volunteer opportunities
2‐1‐1 issues monthly reports about the number of calls about each problem/need, the number of
calls by county (most are from Davidson County), the number of calls referred to each agency, and
a summary of the number and percentage of calls in each category, total calls, and total needs.
Since 2004, 2‐1‐1 has received an average of about 15,000 calls per month. The table below
includes a full list of the categories (based on the definitions above) and the cumulative percentage
of calls for the period January 1, 2007 through September 30, 2011 for their service area.
Type of Need % Calls
Education 1.1%
Employment 1.5%
Disaster Services 1.5%
Transportation 1.6%
Volunteers/Donations 1.9%
Mental Health/Addictions 2.7%
Legal, Consumer and Public Safety Services 2.8%
Clothing/Personal/Household 2.9%
Other Government/Economic Services 3.7%
Individual, Family and Community Support 4.5%
Health Care 6.5%
Income Support/Assistance 11.9%
Information Services 14.5%
Food/Meals 15.4%
Housing/Utilities 27.3%
Chart 20 identifies the percentage of cumulative calls to 2‐1‐1 for the each need that was identified
at least 2% of the time, for the period January 1, 2007 through September 30, 2011. The
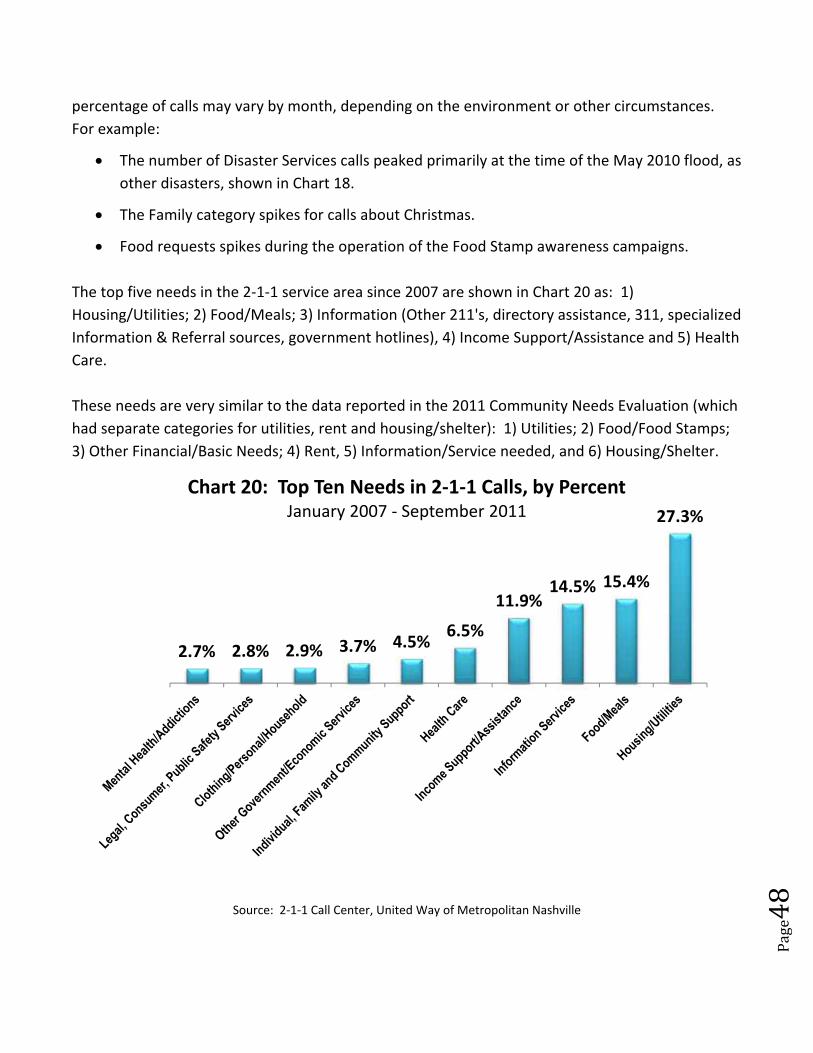
Page48
percentage of calls may vary by month, depending on the environment or other circumstances.
For example:
The number of Disaster Services calls peaked primarily at the time of the May 2010 flood, as
other disasters, shown in Chart 18.
The Family category spikes for calls about Christmas.
Food requests spikes during the operation of the Food Stamp awareness campaigns.
The top five needs in the 2‐1‐1 service area since 2007 are shown in Chart 20 as: 1)
Housing/Utilities; 2) Food/Meals; 3) Information (Other 211's, directory assistance, 311, specialized
Information & Referral sources, government hotlines), 4) Income Support/Assistance and 5) Health
Care.
These needs are very similar to the data reported in the 2011 Community Needs Evaluation (which
had separate categories for utilities, rent and housing/shelter): 1) Utilities; 2) Food/Food Stamps;
3) Other Financial/Basic Needs; 4) Rent, 5) Information/Service needed, and 6) Housing/Shelter.
Source: 2‐1‐1 Call Center, United Way of Metropolitan Nashville
2.7% 2.8% 2.9% 3.7% 4.5%6.5%
11.9%14.5% 15.4%
27.3%
Chart 20: Top Ten Needs in 2‐1‐1 Calls, by PercentJanuary 2007 ‐ September 2011
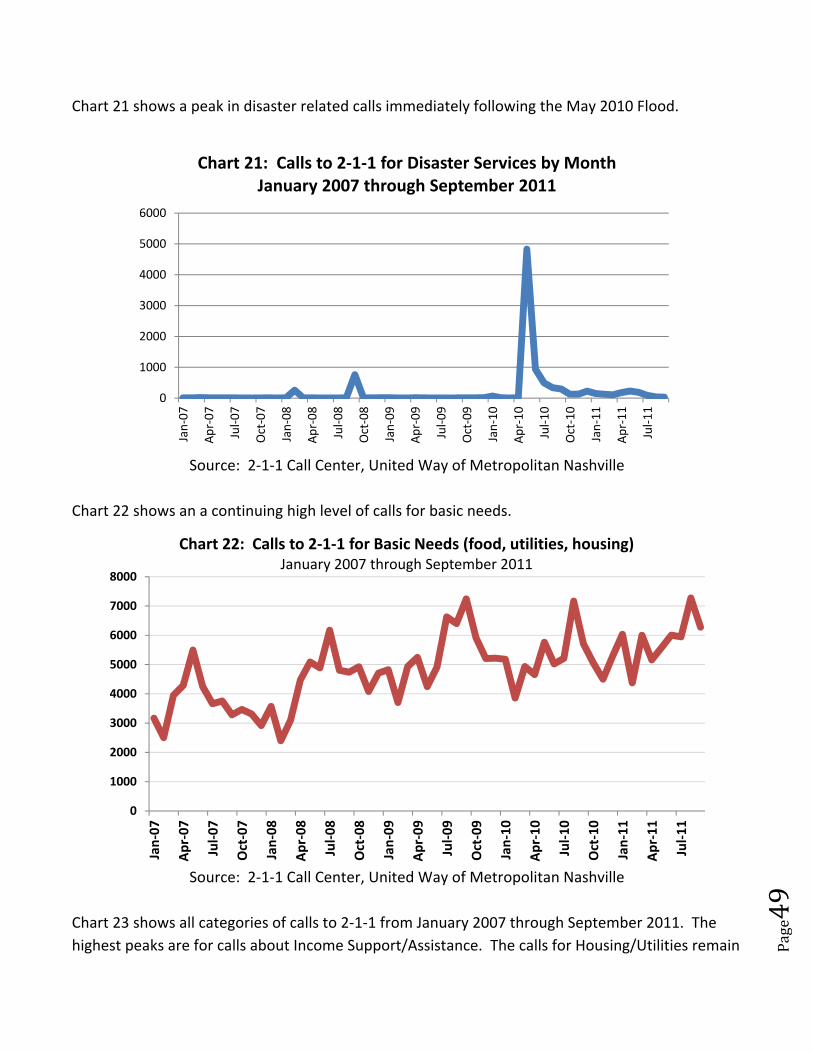
Page49
Chart 21 shows a peak in disaster related calls immediately following the May 2010 Flood.
Source: 2‐1‐1 Call Center, United Way of Metropolitan Nashville
Chart 22 shows an a continuing high level of calls for basic needs.
Source: 2‐1‐1 Call Center, United Way of Metropolitan Nashville
Chart 23 shows all categories of calls to 2‐1‐1 from January 2007 through September 2011. The
highest peaks are for calls about Income Support/Assistance. The calls for Housing/Utilities remain
0
1000
2000
3000
4000
5000
6000
Jan‐07
Apr‐07
Jul‐07
Oct‐07
Jan‐08
Apr‐08
Jul‐08
Oct‐08
Jan‐09
Apr‐09
Jul‐09
Oct‐09
Jan‐10
Apr‐10
Jul‐10
Oct‐10
Jan‐11
Apr‐11
Jul‐11
Chart 21: Calls to 2‐1‐1 for Disaster Services by MonthJanuary 2007 through September 2011
0
1000
2000
3000
4000
5000
6000
7000
8000
Jan‐07
Apr‐07
Jul‐07
Oct‐07
Jan‐08
Apr‐08
Jul‐08
Oct‐08
Jan‐09
Apr‐09
Jul‐09
Oct‐09
Jan‐10
Apr‐10
Jul‐10
Oct‐10
Jan‐11
Apr‐11
Jul‐11
Chart 22: Calls to 2‐1‐1 for Basic Needs (food, utilities, housing)January 2007 through September 2011
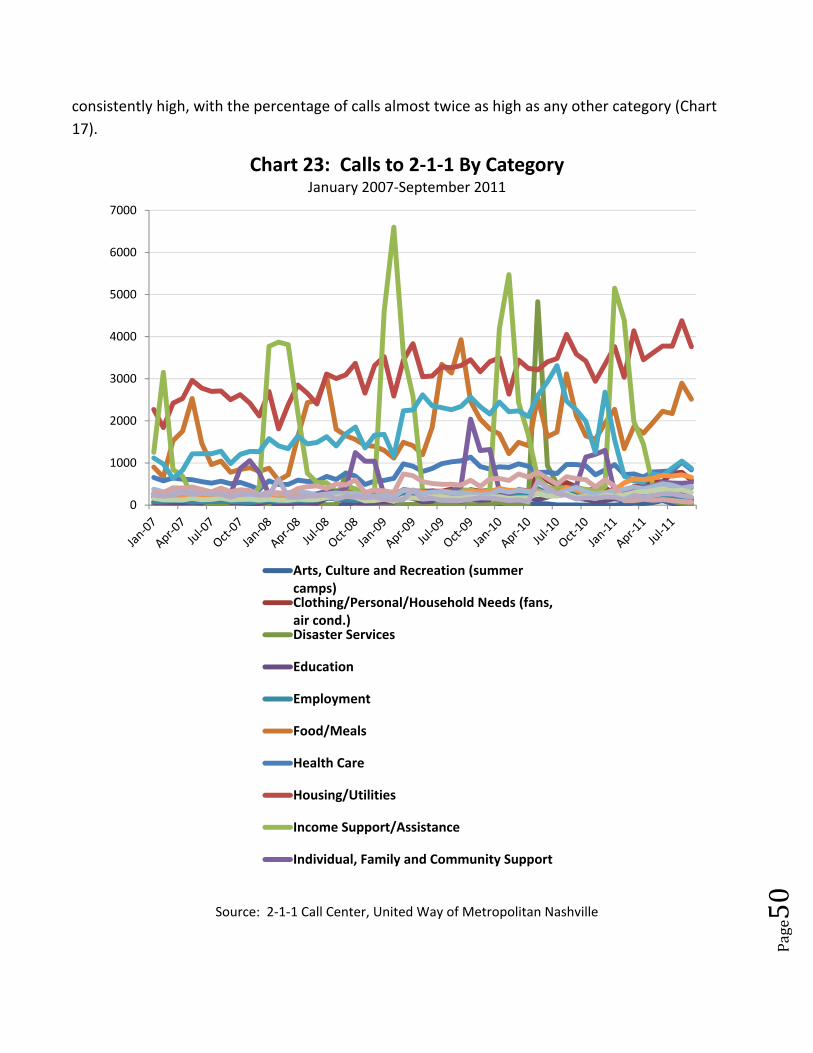
Page50
consistently high, with the percentage of calls almost twice as high as any other category (Chart
17).
Source: 2‐1‐1 Call Center, United Way of Metropolitan Nashville
0
1000
2000
3000
4000
5000
6000
7000
Chart 23: Calls to 2‐1‐1 By CategoryJanuary 2007‐September 2011
Arts, Culture and Recreation (summercamps)Clothing/Personal/Household Needs (fans,air cond.)Disaster Services
Education
Employment
Food/Meals
Health Care
Housing/Utilities
Income Support/Assistance
Individual, Family and Community Support
Page51
Of 50 states, Tennessee ranked below average as the 44th state in the nation for infant
mortality rate and 24th in the nation for the number of child deaths of children ages 1‐
14.
Two‐thirds of children in poverty are living in working families.
Almost 11% of the nation’s children had at least one unemployed parent in 2010,
affecting nearly 8 million children.
The poorest children are preschool children of color living in female‐headed families.
Black children are roughly 2.5 times more likely than white children to experience
poverty and 7 times more likely to be persistently poor.
The average Families First monthly cash assistance benefit in Davidson County is $157
per month.
The cost to the state of Tennessee per incarcerated prisoner is $14,827 compared to
the state’s annual expenditure per public school child that is $7,004.
African‐American children were nearly twice as likely as white children to have an unemployed
parent. Children whose more highly educated parent had only a high school diploma were far
more likely to experience parental unemployment than children with a college‐educated parent,
according to the 2011 KIDS Count Data Book of the Annie E. Casey Foundation.
Over the past 4 decades, the U.S. child poverty rate has ranged from a low of 15% to a high of 23%
as measured annually by the U.S. Census Bureau. The Children’s Defense Fund report of The State
of America’s Children 2011 revealed that children of color lag behind on most every measure of
child well‐being. They face multiple risks that put them in jeopardy of entering prison rather than
college, productive employment and successful futures. Chart C‐1 shows that in Tennessee, there
"Toputtheworldinorder,wemustfirstputthenationinorder;
Toputthenationinorder,wemustputthefamilyinorder;Toputthefamilyinorder,wemustfirstcultivateourpersonallives;
Wemustfirstsetourheartsright.”‐Confucius

Page52
were more Black and Hispanic children that lived in impoverished families than White and other
races of children.
Source: National Center for Children in Poverty, 2010
For a family of four, the 2011 federal poverty level is $22,350 a year, with the exception of
adjustment for inflation. The federal poverty level has not been revised since the 1960s, and has
been identified as an ineffective measure of a family’s ability to meet their basic needs.
Children Born in Poverty
Children who are poor at birth are significantly more likely to be poor as adults, drop out of high
school, and have a teen non‐marital birth than those who were not poor at birth according to the
Childhood Poverty Persistence Report from the Urban Institute. It states that being born into
poverty can be a predictor of adult poverty. It describes various possible mechanisms through
which adult poverty may occur such as parental income, family functioning and home
environment, neighborhood factors, and school quality.
The likelihood of not completing high school is three times greater for
individuals who were poor at birth, compared with individuals who were not
poor at birth. For persons who were not poor at birth, 7% lack high school
diplomas, compared to 22% who lack high school diplomas among those who
were poor at birth. Some children have been resilient to childhood poverty and
are able to avoid negative outcomes. Understanding the characteristics and experiences of
persistently poor children who successfully transition to adulthood could provide important
16.0%
41.0%38.0%
5.0%
White Children in poorfamilies
Black Children in poorfamilies
Hispanic Children inpoor families
Other Children in poorfamilies
Chart C‐1: Percentage Children Living in Poor Families Tennessee, 2009
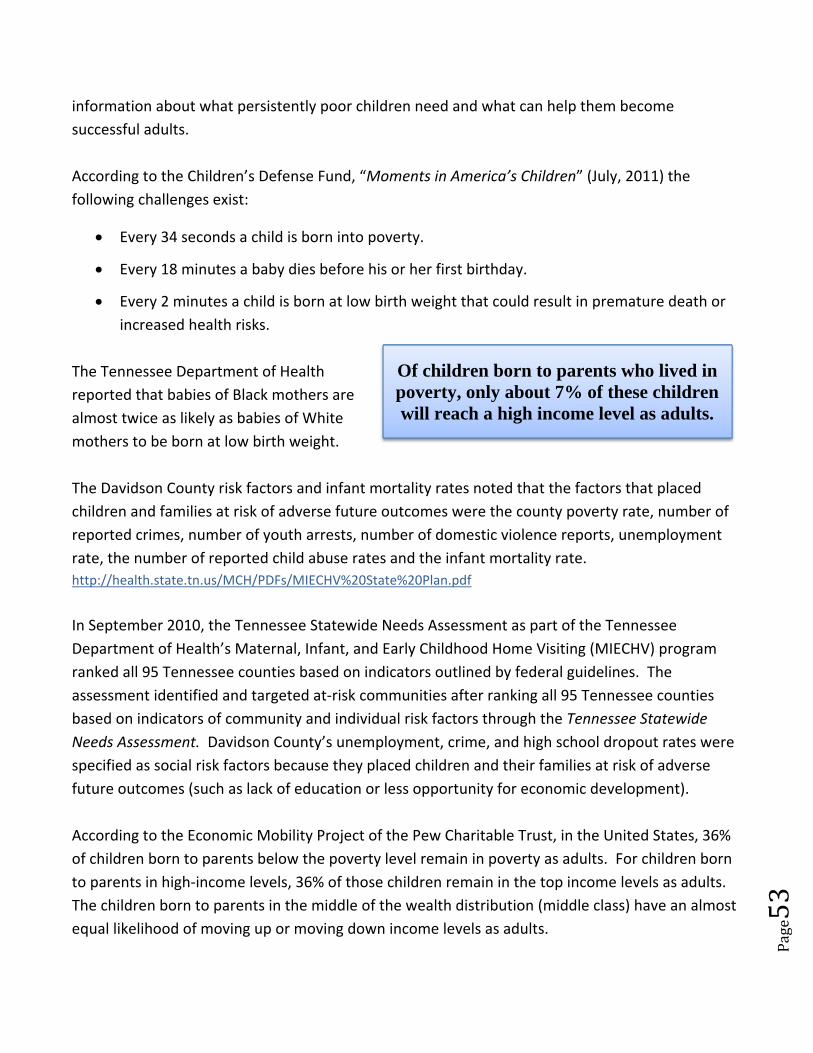
Page53
Of children born to parents who lived in poverty, only about 7% of these children will reach a high income level as adults.
information about what persistently poor children need and what can help them become
successful adults.
According to the Children’s Defense Fund, “Moments in America’s Children” (July, 2011) the
following challenges exist:
Every 34 seconds a child is born into poverty.
Every 18 minutes a baby dies before his or her first birthday.
Every 2 minutes a child is born at low birth weight that could result in premature death or
increased health risks.
The Tennessee Department of Health
reported that babies of Black mothers are
almost twice as likely as babies of White
mothers to be born at low birth weight.
The Davidson County risk factors and infant mortality rates noted that the factors that placed
children and families at risk of adverse future outcomes were the county poverty rate, number of
reported crimes, number of youth arrests, number of domestic violence reports, unemployment
rate, the number of reported child abuse rates and the infant mortality rate.
http://health.state.tn.us/MCH/PDFs/MIECHV%20State%20Plan.pdf
In September 2010, the Tennessee Statewide Needs Assessment as part of the Tennessee
Department of Health’s Maternal, Infant, and Early Childhood Home Visiting (MIECHV) program
ranked all 95 Tennessee counties based on indicators outlined by federal guidelines. The
assessment identified and targeted at‐risk communities after ranking all 95 Tennessee counties
based on indicators of community and individual risk factors through the Tennessee Statewide
Needs Assessment. Davidson County’s unemployment, crime, and high school dropout rates were
specified as social risk factors because they placed children and their families at risk of adverse
future outcomes (such as lack of education or less opportunity for economic development).
According to the Economic Mobility Project of the Pew Charitable Trust, in the United States, 36%
of children born to parents below the poverty level remain in poverty as adults. For children born
to parents in high‐income levels, 36% of those children remain in the top income levels as adults.
The children born to parents in the middle of the wealth distribution (middle class) have an almost
equal likelihood of moving up or moving down income levels as adults.
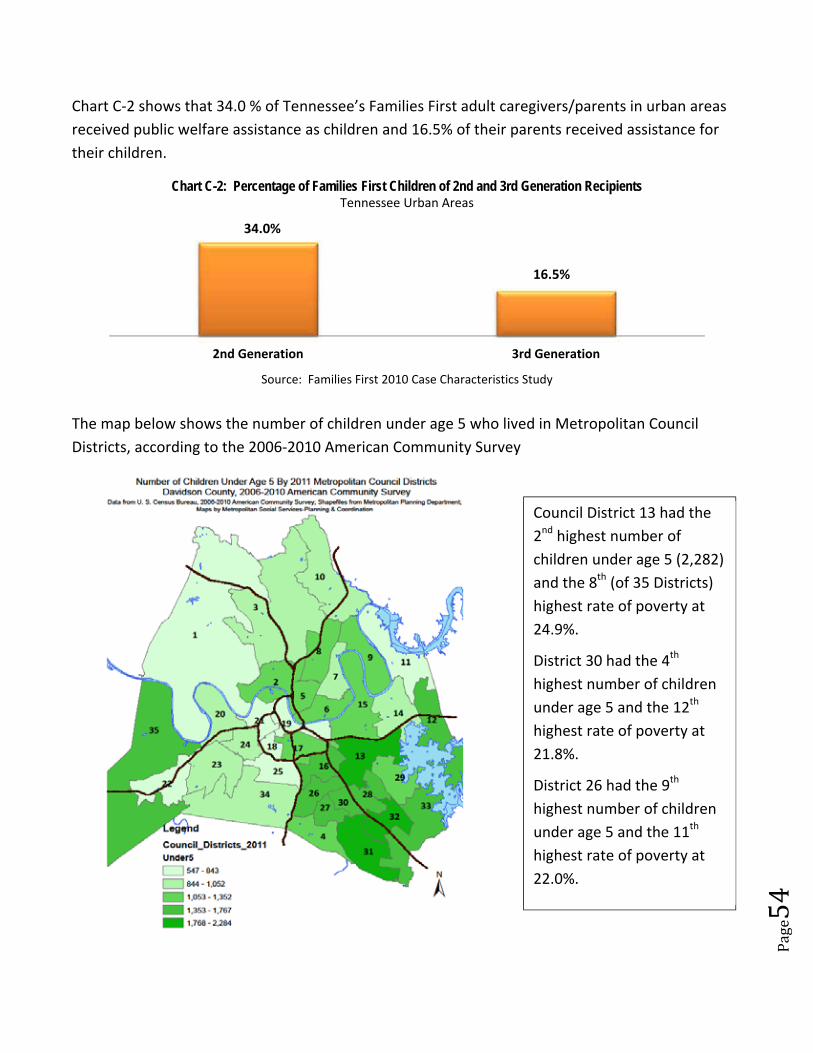
Page54
Chart C‐2 shows that 34.0 % of Tennessee’s Families First adult caregivers/parents in urban areas
received public welfare assistance as children and 16.5% of their parents received assistance for
their children.
Source: Families First 2010 Case Characteristics Study
The map below shows the number of children under age 5 who lived in Metropolitan Council
Districts, according to the 2006‐2010 American Community Survey
34.0%
16.5%
2nd Generation 3rd Generation
Chart C-2: Percentage of Families First Children of 2nd and 3rd Generation RecipientsTennessee Urban Areas
Council District 13 had the
2nd highest number of
children under age 5 (2,282)
and the 8th (of 35 Districts)
highest rate of poverty at
24.9%.
District 30 had the 4th
highest number of children
under age 5 and the 12th
highest rate of poverty at
21.8%.
District 26 had the 9th
highest number of children
under age 5 and the 11th
highest rate of poverty at
22.0%.
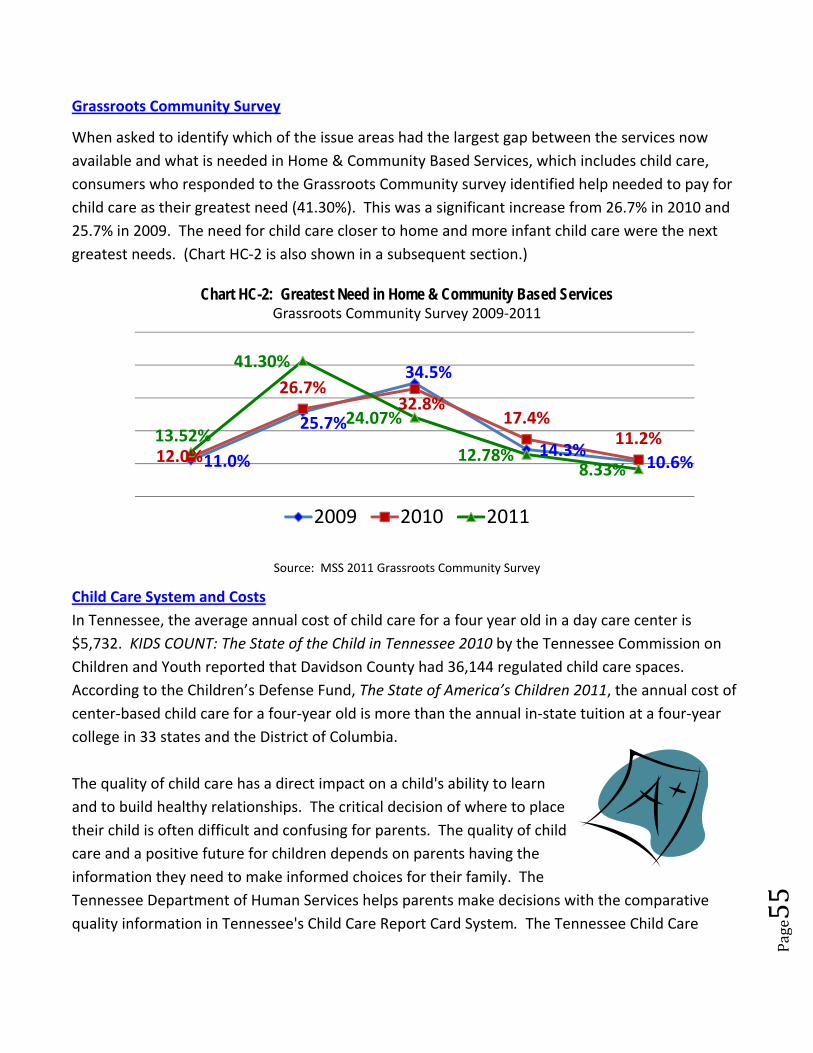
Page55
Grassroots Community Survey
When asked to identify which of the issue areas had the largest gap between the services now
available and what is needed in Home & Community Based Services, which includes child care,
consumers who responded to the Grassroots Community survey identified help needed to pay for
child care as their greatest need (41.30%). This was a significant increase from 26.7% in 2010 and
25.7% in 2009. The need for child care closer to home and more infant child care were the next
greatest needs. (Chart HC‐2 is also shown in a subsequent section.)
Source: MSS 2011 Grassroots Community Survey
Child Care System and Costs
In Tennessee, the average annual cost of child care for a four year old in a day care center is
$5,732. KIDS COUNT: The State of the Child in Tennessee 2010 by the Tennessee Commission on
Children and Youth reported that Davidson County had 36,144 regulated child care spaces.
According to the Children’s Defense Fund, The State of America’s Children 2011, the annual cost of
center‐based child care for a four‐year old is more than the annual in‐state tuition at a four‐year
college in 33 states and the District of Columbia.
The quality of child care has a direct impact on a child's ability to learn
and to build healthy relationships. The critical decision of where to place
their child is often difficult and confusing for parents. The quality of child
care and a positive future for children depends on parents having the
information they need to make informed choices for their family. The
Tennessee Department of Human Services helps parents make decisions with the comparative
quality information in Tennessee's Child Care Report Card System. The Tennessee Child Care
11.0%
25.7%
34.5%
14.3%10.6%12.0%
26.7%32.8%
17.4%11.2%13.52%
41.30%
24.07%
12.78%8.33%
Chart HC-2: Greatest Need in Home & Community Based ServicesGrassroots Community Survey 2009‐2011
2009 2010 2011

Page56
Report Card System is part of the state’s comprehensive plan to provide more information for
parents and improve the quality of child care in Tennessee.
http://www.tn.gov/humanserv/adfam/ccrcsq.html
Under the Tennessee's Child Care Report Card System, every licensed child care agency must
undergo an annual evaluation and post a report card of the results. Agencies are required to post
their report card with their renewal license for parents.
The Report Card system is mandatory for all licensed providers in the state. An agency must be
open for at least 1 year before it can be assessed. The Star‐Quality Child Care Program is a
voluntary program that recognizes child care agencies that exceed minimum licensing standards.
According to the Tennessee Department of Human Services in Tennessee, the average cost for
unsubsidized child care for one infant and one four year‐old is approximately $13,000 per year,
which is more than the annual median income of $11,400 for employed adults leaving the
TANF/Families First program. For 13,467 families in Davidson County with incomes less than
$15,000, it is challenging for families to pay for child care.
Research through The University of Tennessee Social Work Office of Research and Public Service
noted that partnerships of local providers and community programs could help provide parents
with access to and availability of child care to meet family child care needs. Collaborative efforts
included partnerships to provide full‐day care, long‐range planning at the local and state levels,
assistance and referral to parents for child care resources, training of child care providers in the
community, and development support for local providers of extended care for school‐age children.
Tennessee Child Care Certificate Program
The Child Care Certificate Program is Tennessee’s assistance program for low‐income and at‐risk
children. Funding for the Certificate Program comes from the federal Families First/Temporary
Assistance to Needy Families block grant and the Child Care Development Block Grant (CCDBG).
The Child Care Certificate Program is often referred to as subsidized child care.
The primary source of funding for child care assistance is the federal Child Care and Development
Block Grant (CCDBG) program. CCDBG funding was $5.140 billion in FY 2011. This was a decrease
from CCDBG funding for FY 2010 even before adjusting for inflation—$6.044 billion, including the
additional $2 billion in CCDBG funding for states to obligate in FY 2009 and FY 2010 provided
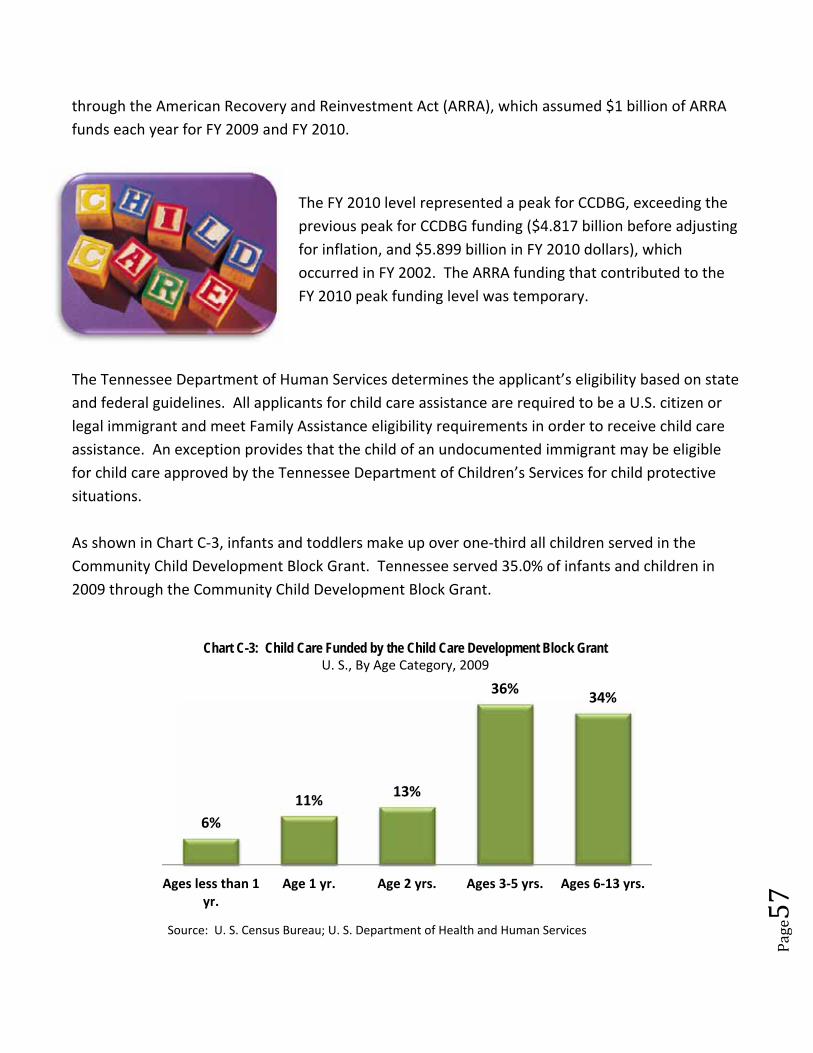
Page57
through the American Recovery and Reinvestment Act (ARRA), which assumed $1 billion of ARRA
funds each year for FY 2009 and FY 2010.
The FY 2010 level represented a peak for CCDBG, exceeding the
previous peak for CCDBG funding ($4.817 billion before adjusting
for inflation, and $5.899 billion in FY 2010 dollars), which
occurred in FY 2002. The ARRA funding that contributed to the
FY 2010 peak funding level was temporary.
The Tennessee Department of Human Services determines the applicant’s eligibility based on state
and federal guidelines. All applicants for child care assistance are required to be a U.S. citizen or
legal immigrant and meet Family Assistance eligibility requirements in order to receive child care
assistance. An exception provides that the child of an undocumented immigrant may be eligible
for child care approved by the Tennessee Department of Children’s Services for child protective
situations.
As shown in Chart C‐3, infants and toddlers make up over one‐third all children served in the
Community Child Development Block Grant. Tennessee served 35.0% of infants and children in
2009 through the Community Child Development Block Grant.
Source: U. S. Census Bureau; U. S. Department of Health and Human Services
6%
11%13%
36%34%
Ages less than 1yr.
Age 1 yr. Age 2 yrs. Ages 3‐5 yrs. Ages 6‐13 yrs.
Chart C-3: Child Care Funded by the Child Care Development Block Grant U. S., By Age Category, 2009
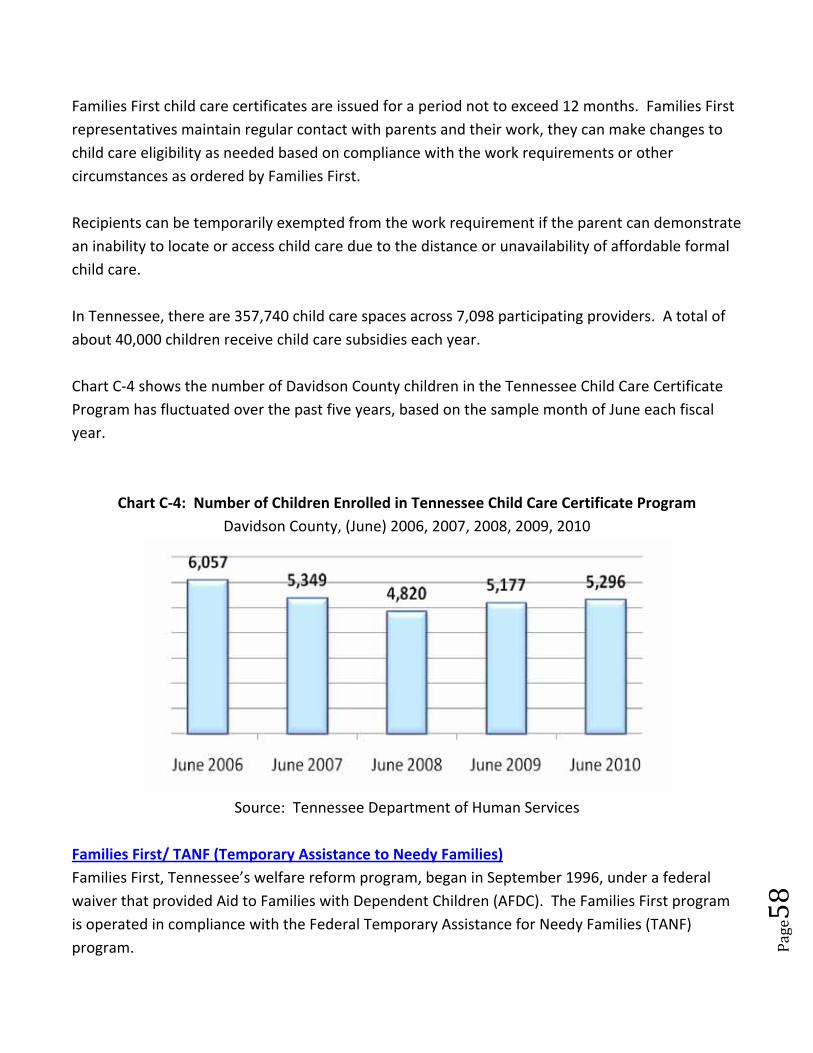
Page58
Families First child care certificates are issued for a period not to exceed 12 months. Families First
representatives maintain regular contact with parents and their work, they can make changes to
child care eligibility as needed based on compliance with the work requirements or other
circumstances as ordered by Families First.
Recipients can be temporarily exempted from the work requirement if the parent can demonstrate
an inability to locate or access child care due to the distance or unavailability of affordable formal
child care.
In Tennessee, there are 357,740 child care spaces across 7,098 participating providers. A total of
about 40,000 children receive child care subsidies each year.
Chart C‐4 shows the number of Davidson County children in the Tennessee Child Care Certificate
Program has fluctuated over the past five years, based on the sample month of June each fiscal
year.
Chart C‐4: Number of Children Enrolled in Tennessee Child Care Certificate Program
Davidson County, (June) 2006, 2007, 2008, 2009, 2010
Source: Tennessee Department of Human Services
Families First/ TANF (Temporary Assistance to Needy Families)
Families First, Tennessee’s welfare reform program, began in September 1996, under a federal
waiver that provided Aid to Families with Dependent Children (AFDC). The Families First program
is operated in compliance with the Federal Temporary Assistance for Needy Families (TANF)
program.
Page59
The Families First program provides temporary cash assistance program and emphasizes work,
training, and personal responsibility. As part of the Families First program, each participant must
agree to follow a mandatory personal responsibility plan. The personal responsibility plan is a
work agreement between the client and Families First that the client will comply with the plan in
order to receive assistance.
The Families First caseload data collected and reported by the Center on Budget and Policy
Priorities, September 2011 showed that between 2008 and 2009, 38 families participated in
Families First for every 100 families in poverty.
Children and Education
Research from the Annie E. Casey Foundation and other organizations have demonstrated that
high‐quality early childhood development programs for disadvantaged children and their families
are cost‐effective investments for reducing the negative effects of economic hardship. Findings
show that reading proficiency by the third grade is a crucial marker in a child’s educational
development. Children who fail to read proficiently by the end of third grade are more likely to
drop out of high school, reducing their earning potential and chances for success.
In April 2011, Mayor Karl Dean’s Advisory Council on Early Childhood Development and Early
Education submitted a comprehensive report that described Davidson County programs for early
childhood development and early education. The report showed that there is a patchwork of
services in Davidson County. The report established a city‐wide vision of success for children from
birth to 8 years of age and included recommendations to affect outcomes and quality of life for
young children, their families and the city.
The report noted that in providing key services and supports to
promote early childhood development and education, there are needs
and weaknesses in early care and education that must be addressed.
A wide variety of service providers exist within the field of early child
development and education.
Other relevant data from the report:
Of Davidson County’s approximately 48,285 children ages 0‐5, it is estimated that 37%
participate in some form of licensed child care or education program.
Page60
Approximately 35% of eligible children who apply for Metro Nashville Public Schools
(MNPS) Voluntary Pre‐K program are on waiting lists
While 37% of all children are in some type of care, an estimated 27% of Davidson County’s
entire 0‐5 year old population participates in a high‐quality formalized care program.
There is uncertainty about whether the Tennessee Department of Human Services’ 3‐star
rating system and the Tennessee Voluntary Pre‐K oversight processes are sufficient to
incentivize and comprehensively measure quality learning and developmental outcomes for
children.
Programs use different standards and assessments that promote and determine a certain
set of early childhood programming practices.
Current and potential funders, both private and public sources, of early child development
programs may be unsure of what they are funding (child care or early childhood education).
According to America’s Children: National Indicators of Well‐Being, 2011, during the time after
school and on weekends school‐age some children spend that time in child care arrangements, and
in a variety of other activities such as sports, arts, clubs, academic activities, religious activities, and
community service. Other children cared for themselves without adult supervision. In 2010, older
children were more likely to care for themselves than their younger counterparts: 2% of children
ages 5‐8, 11% of children ages 9‐11, and 36% of children ages 12‐14, were regularly in self‐care
situations. Other facts that support the need for after school care for children are:
As many as 15 million children have no place to go after school. (Source: U.S. Census)
More than 28 million children have parents who work outside the home. (Source: U.S.
Department of Labor)
Parents themselves admit to regularly leaving more than 4 million middle school children
under the age of 13 to care for themselves for a few hours each week. (Source: Child
Trends)
The Nashville After Zone Alliance in partnership with Metro Nashville Public Schools (MNPS), a
coordinated system of afterschool programming for middle school students in Nashville released
the following data:
Fewer than 10% of the 21,500 public middle‐school students participate in structured after
school programs.
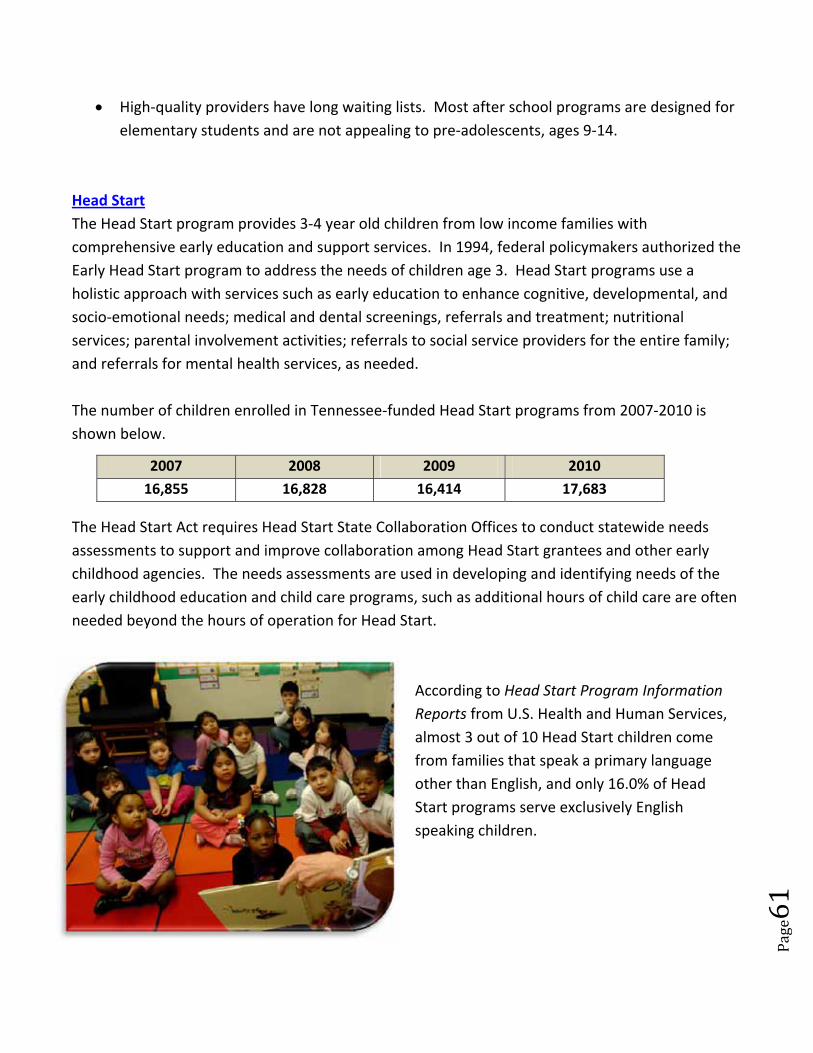
Page61
High‐quality providers have long waiting lists. Most after school programs are designed for
elementary students and are not appealing to pre‐adolescents, ages 9‐14.
Head Start
The Head Start program provides 3‐4 year old children from low income families with
comprehensive early education and support services. In 1994, federal policymakers authorized the
Early Head Start program to address the needs of children age 3. Head Start programs use a
holistic approach with services such as early education to enhance cognitive, developmental, and
socio‐emotional needs; medical and dental screenings, referrals and treatment; nutritional
services; parental involvement activities; referrals to social service providers for the entire family;
and referrals for mental health services, as needed.
The number of children enrolled in Tennessee‐funded Head Start programs from 2007‐2010 is
shown below.
The Head Start Act requires Head Start State Collaboration Offices to conduct statewide needs
assessments to support and improve collaboration among Head Start grantees and other early
childhood agencies. The needs assessments are used in developing and identifying needs of the
early childhood education and child care programs, such as additional hours of child care are often
needed beyond the hours of operation for Head Start.
According to Head Start Program Information
Reports from U.S. Health and Human Services,
almost 3 out of 10 Head Start children come
from families that speak a primary language
other than English, and only 16.0% of Head
Start programs serve exclusively English
speaking children.
2007 2008 2009 2010
16,855 16,828 16,414 17,683
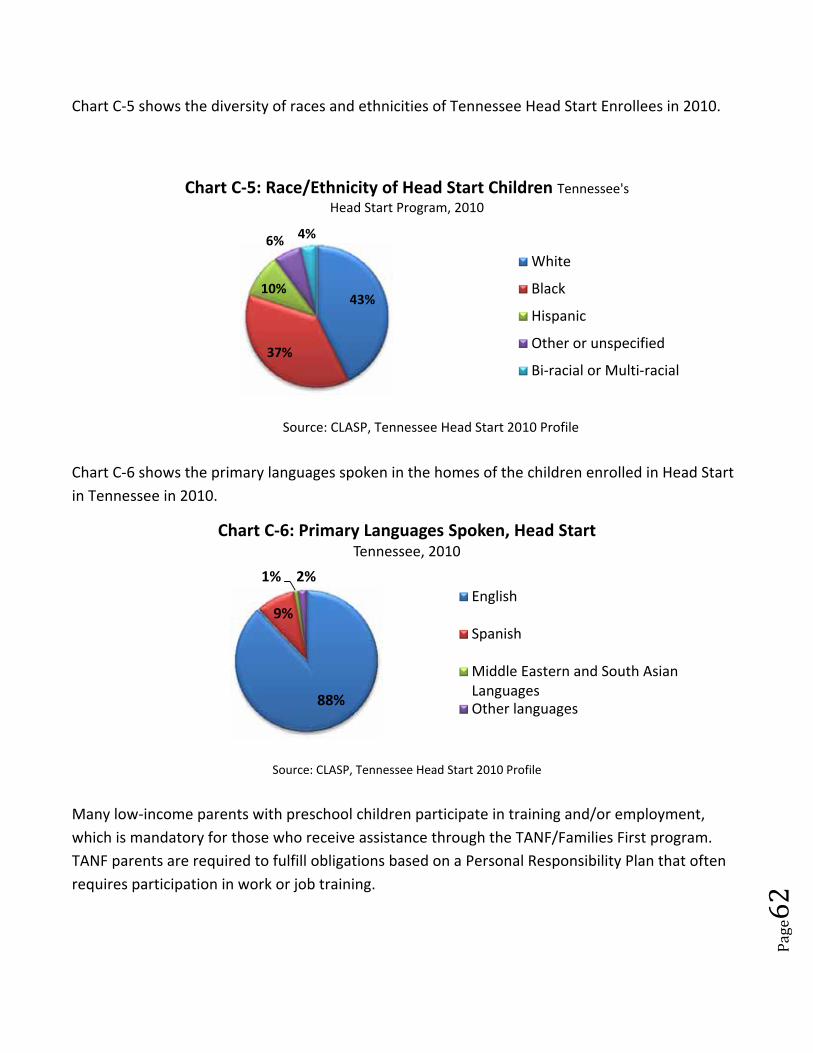
Page62
Chart C‐5 shows the diversity of races and ethnicities of Tennessee Head Start Enrollees in 2010.
Source: CLASP, Tennessee Head Start 2010 Profile
Chart C‐6 shows the primary languages spoken in the homes of the children enrolled in Head Start
in Tennessee in 2010.
Source: CLASP, Tennessee Head Start 2010 Profile
Many low‐income parents with preschool children participate in training and/or employment,
which is mandatory for those who receive assistance through the TANF/Families First program.
TANF parents are required to fulfill obligations based on a Personal Responsibility Plan that often
requires participation in work or job training.
43%
37%
10%
6% 4%
Chart C‐5: Race/Ethnicity of Head Start Children Tennessee's Head Start Program, 2010
White
Black
Hispanic
Other or unspecified
Bi‐racial or Multi‐racial
88%
9%
1% 2%
Chart C‐6: Primary Languages Spoken, Head StartTennessee, 2010
English
Spanish
Middle Eastern and South AsianLanguagesOther languages

Page63
Tennessee Voluntary Pre‐Kindergarten
Tennessee Pre‐K is a statewide, voluntary pre‐kindergarten program serving more than 18,000 4‐
year‐olds in 934 classrooms. While all 4‐year‐olds are eligible, current funding does not provide
enough slots for all interested families to enroll in the program, and not all schools have Pre‐K
classrooms. Priority is given to children who are eligible to receive free or reduced price lunch,
then to students with disabilities, English language learners and children who are otherwise at‐risk.
In Tennessee Pre‐K is 100% voluntary, meaning that parents can decide if they want to enroll their
child in the Pre‐K program or not. Tennessee uses a state approved list of research‐based curricula
aligned with the Tennessee Early Learning Developmental Standards (lessons are based on what
the average child at that age should know or be capable of learning). Tennessee's Voluntary Pre‐K
Programs have been recognized by the National Institute for Early Education Research as a national
model for providing high‐quality Pre‐K programs.
According to findings in June 2011 by researchers at Vanderbilt University's Peabody Research
Institute, quality Pre‐kindergarten is a key component of a comprehensive early childhood
education system that prepares children to succeed in school and life. Children who attend pre‐
kindergarten in Tennessee are much better prepared for school, especially in literacy and math.
The results show that Pre‐k students (typically age 4) have gains over their peers in all subject
areas as well as indicators that affect future school performance such as paying attention, love of
learning, and following instructions.
High‐quality Pre‐K for at‐risk children helps to narrow the achievement gap, reduces grade
repetition and special education placements, increases high school graduation rates, reduces
crime, and leads to greater employment and higher earnings among adults according to
researchers from the Annie E. Casey Foundation.
The 2007 Invest in Kids Tennessee Report (part of the FIGHT CRIME: Invest in Kids program)
described the recommendations from Tennessee law enforcement leaders that all at‐risk children
should have access to affordable high‐quality pre‐kindergarten. The Fight Crime program also
reported that without access and affordable pre‐K communities have risks for increased crime and
violence, noting that at‐risk children who did not have quality Pre‐K were 70% more likely to
commit violent crimes for which they were arrested by age 18.
Tennessee had increased state spending for Pre‐K from 2005, with some decrease in 2007 then
another increase of spending in 2008 but has since shown a gradual decline as seen in Chart C‐7
that affected the resources needed to serve more children.
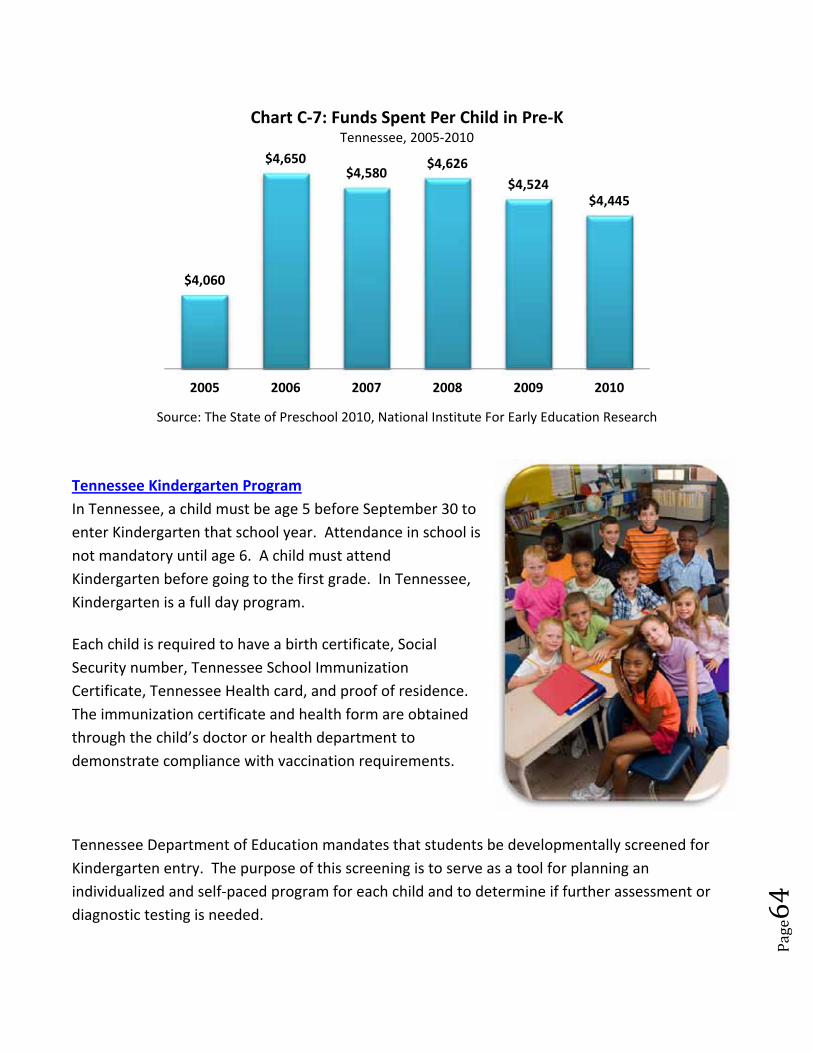
Page64
Source: The State of Preschool 2010, National Institute For Early Education Research
Tennessee Kindergarten Program
In Tennessee, a child must be age 5 before September 30 to
enter Kindergarten that school year. Attendance in school is
not mandatory until age 6. A child must attend
Kindergarten before going to the first grade. In Tennessee,
Kindergarten is a full day program.
Each child is required to have a birth certificate, Social
Security number, Tennessee School Immunization
Certificate, Tennessee Health card, and proof of residence.
The immunization certificate and health form are obtained
through the child’s doctor or health department to
demonstrate compliance with vaccination requirements.
Tennessee Department of Education mandates that students be developmentally screened for
Kindergarten entry. The purpose of this screening is to serve as a tool for planning an
individualized and self‐paced program for each child and to determine if further assessment or
diagnostic testing is needed.
$4,060
$4,650 $4,580
$4,626
$4,524 $4,445
2005 2006 2007 2008 2009 2010
Chart C‐7: Funds Spent Per Child in Pre‐KTennessee, 2005‐2010
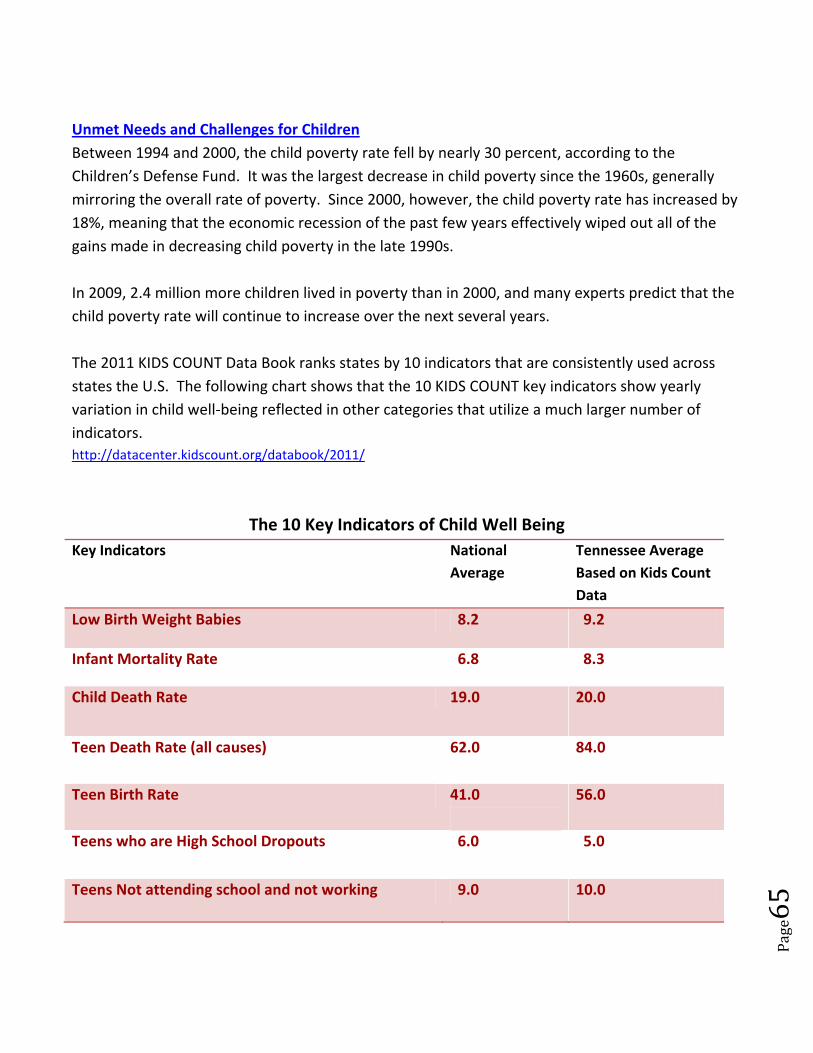
Page65
Unmet Needs and Challenges for Children
Between 1994 and 2000, the child poverty rate fell by nearly 30 percent, according to the
Children’s Defense Fund. It was the largest decrease in child poverty since the 1960s, generally
mirroring the overall rate of poverty. Since 2000, however, the child poverty rate has increased by
18%, meaning that the economic recession of the past few years effectively wiped out all of the
gains made in decreasing child poverty in the late 1990s.
In 2009, 2.4 million more children lived in poverty than in 2000, and many experts predict that the
child poverty rate will continue to increase over the next several years.
The 2011 KIDS COUNT Data Book ranks states by 10 indicators that are consistently used across
states the U.S. The following chart shows that the 10 KIDS COUNT key indicators show yearly
variation in child well‐being reflected in other categories that utilize a much larger number of
indicators.
http://datacenter.kidscount.org/databook/2011/
The 10 Key Indicators of Child Well Being
Key Indicators National
Average
Tennessee Average
Based on Kids Count
Data
Low Birth Weight Babies 8.2 9.2
Infant Mortality Rate 6.8 8.3
Child Death Rate 19.0 20.0
Teen Death Rate (all causes) 62.0 84.0
Teen Birth Rate 41.0
56.0
Teens who are High School Dropouts 6.0 5.0
Teens Not attending school and not working 9.0 10.0
Page66
Children living in families where no parent has full
time, year round employment.
31.0 35.0
Percentage of children in poverty 20.0 24.0
Percentage of children in single parent families 34.0 36.0
In January 2011, The Children’s Defense funds ranked Tennessee as 44th of 51 (among 50 states
and the District of Columbia) in the percent of babies born at low birth weight (with the best state
being Alaska and worst state was Mississippi). Tennessee ranked poorly as 44th among states in
its infant mortality rate, with the best state being Washington and the worst was the District of
Columbia. (Best states were those with the highest quality and the worst were the poorest of
quality).
Page67
BEST PRACTICES – Example for Child Care
Evidenced Based Comprehensive Preschool Programs for Low-Income Children and Parents
Description
Evidenced‐based preschool programs provide comprehensive educational and family support to
economically disadvantaged children and their parents. This comprehensive design is based on
verification that a school‐based, stable learning environment during preschool scholastic success is
likely to follow. An important component is the active and consistent participation of parents in
their children’s education.
This technique has been used successfully by the Chicago Child‐Parent Centers (CPCs) founded in
1967 to serve families in high poverty neighborhoods in Illinois.
The Centers are part of the Chicago Public School System operating 11 federally funded
Title 1 CPC’s.
CPCs provide pre‐school programs located in Chicago Public Schools in which parents are
active and consistent in their child’s education.
Rationale
The 40‐year‐old CPCs are evidence driven, based on extensive research of early childhood
development.
The philosophy is based on proven outcomes of cognitive readiness, as identified by
comparing children who enter the first grade after completion of the outcome‐based
preschool programs with those who did not attend such programs.
When they entered school, the CPC’s preschool children scored higher on math and
reading.
On a long‐term basis, the CPC’s preschool group had better outcomes on arrests of any type
and high school completion before or by age 21.
CPC preschool participants’ rate of full‐time employment was 42.7 %, compared with 36.4%
for those not in preschool.
For each year of preschool, the cost per child is $5,219, with a cost effective return of $1.97
for each $1 invested.
Page68
Potential Challenges for Davidson County
The State of Tennessee would need to support such an endeavor, similar to the way Illinois
provided funding including an early childhood block grant for programs from birth to age 5
years.
The absence of financial backing and legislation to support evidence‐based services would
be a significant challenge.
Steps to Operation in Davidson County
To establish an effective comprehensive approach would necessitate the support and
financial contributions of both private and public funding. This would involve
acknowledgement by policy makers of the need to increase funding for all children,
especially low‐income children to ensure future economic returns in Davidson County.
Comprehensive data‐driven studies and cost‐effective approaches demonstrate the long‐
term investment and return value of preschool education. Greater awareness could
effectively mobilize the support of Investors, businesses, government legislation, educators,
community partners and others.
The programs would need to be incorporated into the Metropolitan Nashville Public School
System to receive federal Title I funding.
BEST PRACTICES – Example for Child Care
Empowerment of Low Income Preschool Children and Parents for Return on Investment
Description
The highly respected High/Scope Perry Preschool model is considered a best practice for early
childhood development. Children become active learners, continuously involved in a “plan‐do‐
review.” process. This approach involves supportive adults and a stable learning environment to
facilitate the activities. In addition to the classroom activities, teachers visited the parents and
children in their homes at least once a week for approximately an hour and a half. The home visit
Page69
was focused on helping parents in providing support for their child’s intellectual, social, and
physical development.
The High/Scope Perry Preschool Program and Head Start began as a pioneering project in
the early 1960s that introduced early childhood education for America’s young children
living in poverty. Both programs were created to improve the academic success of low‐
income children by offering them settings and activities that their home environments
could not provide because their families had limited resources and insufficient home
accommodations.
In a longitudinal study comparing former High/Scope Perry Preschool participants at age 27
with nonparticipants, the Preschool participants had had higher earnings, higher rates of
employment, higher graduation rates, lower rates of special education, less dropout rates
and fewer arrests.
Rationale
The average cost of the High/Scope Perry Preschool program per participant was $12,356
(in 1992 dollars), while the average amount of economic benefits was estimated at $88,433
per participant. The cost effectiveness is that tax dollars invested in early childhood
programs saves money in future.
Preschools of high‐quality have greater long‐term effects on children than those
determined to be of lower quality. The outcomes for participants in high quality preschools
include greater likelihood of being in the workforce, being taxpayers, thus contributing to
their community and the economy.
Potential Challenges for Davidson County
Funding is needed to provide educational incentives and opportunities for low income
preschool teachers and staff in order to provide quality preschool education
Community outreach is needed to engage low‐income children and their parents for
participation in preschool education.
Community partners will need the support of local and state legislators to work collectively
to develop critical elements of a comprehensive state early learning policy.
Such an initiative would require collaboration between the state government and local
government to financially support and endorse early childhood learning as a priority.
Page70
Steps to Operation in Davidson County
Key stakeholders representing public and private organizations, legislators, public
educators, and higher education institutions would need to support and endorse a
comprehensive early childhood learning policy in the county.
Nashville Davidson County could lead the state in the investment of early learning of all
children especially for low‐income children with support and contributions from private and
public funds.
In order to mobilize investors, businesses, local government, lawmakers, there will have to
be comprehensive evidence driven data and outcomes measurements that will
demonstrate educational effectiveness and economic returns.
BEST PRACTICES – Example for Child Care
Coalition Building, Advocacy and Legislative Impact
Description
Through coalitions, advocacy and legislative policies, New Jersey developed high‐quality preschool
programs for low‐income 3‐4 year olds. Their philosophy is based on national studies that have
demonstrated that children who attend quality preschool are more likely to succeed in school and
in life.
In 1998, the Early Care and Education Coalition came together to ensure that New Jersey children
were given quality early childhood education. Today, the coalition has influenced funding
representing more than 40 organizations and individual members and nearly 200 constituent
supporters, child advocates, child care educators, public educators and higher education
academia.
In 2008, the state Legislature approved an expansion of high‐quality preschool throughout New
Jersey as part of the School Funding Reform Act, spearheaded by the coalition.
Rationale
Investments in quality early childhood development programs yield high public as well as
private returns.
Page71
The quality of life and the contributions a child makes to society as an adult can be traced
back to the first 5 years of life when a child undergoes significant growth and change in
cognition, language, motor skills, adaptive skills and social‐emotional functioning.
Investment in early childhood development is directly linked for later economic success for
individuals that contribute positively to the overall economy.
Potential Challenges for Davidson County
The model is a State‐level endeavor. It would require financial support at the State level. If
the State of Tennessee did not adopt such an approach, local funds would be needed to
develop a pilot project for Davidson County.
The Illinois coalition partners and supporters work collectively in developing the critical
elements of a comprehensive state policy. While there are multiple coalitions in Davidson
County, there appears to be no specific lead entity representing all supporting groups and
individuals.
Steps to Operation in Davidson County
Through enhanced community engagement, along with the support and contributions of
both private and public funding, Davidson County could lead the state in the investment of
early learning of all children especially low‐income children for future economic returns of
the city and county.
To mobilize investors, businesses, government, policy makers and lawmakers, there is need
to support comprehensive data‐driven and cost effective approaches that are recognized as
a long‐term investment.
http://www.minneapolisfed.org/publications_papers/studies/earlychild/ http://www.iff.org/resources/content/3/1/documents/eissummary.pdf http://www.njaccrra.org/documents/publicationsTestimony/NJACCRRA%20Tesimony%203‐10.pdf http://web.mit.edu/workplacecenter/docs/Full%20Report.pdf
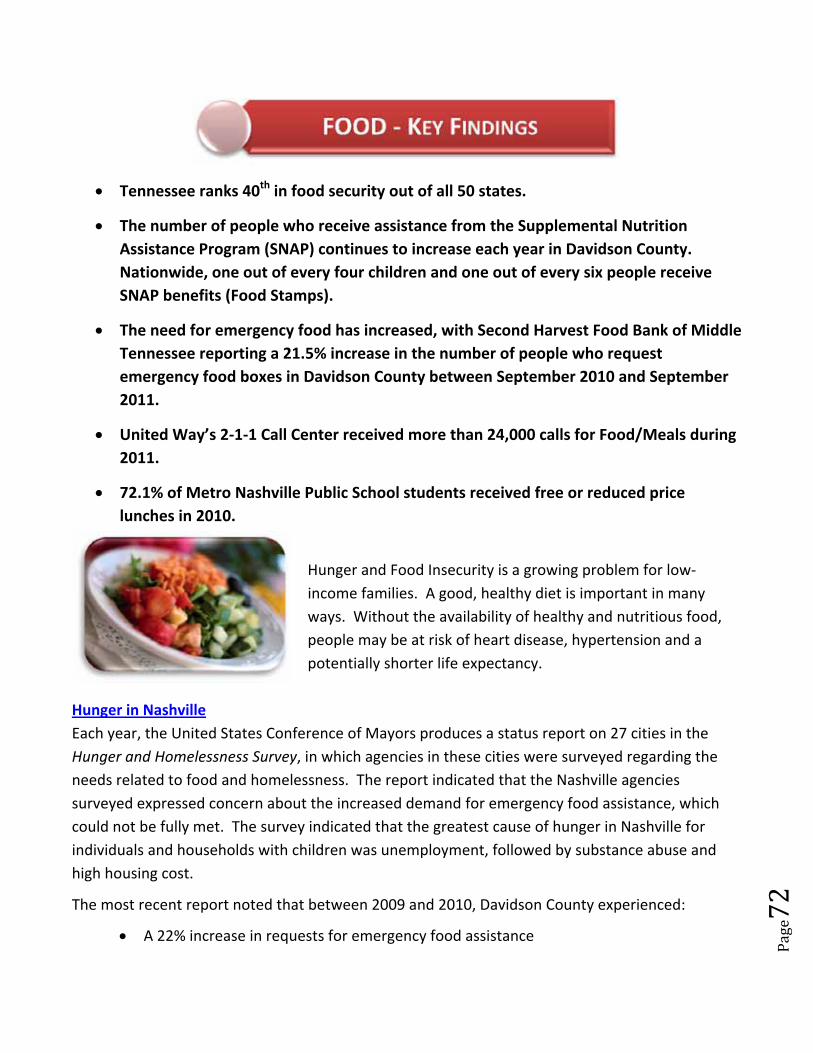
Page72
Tennessee ranks 40th in food security out of all 50 states.
The number of people who receive assistance from the Supplemental Nutrition
Assistance Program (SNAP) continues to increase each year in Davidson County.
Nationwide, one out of every four children and one out of every six people receive
SNAP benefits (Food Stamps).
The need for emergency food has increased, with Second Harvest Food Bank of Middle
Tennessee reporting a 21.5% increase in the number of people who request
emergency food boxes in Davidson County between September 2010 and September
2011.
United Way’s 2‐1‐1 Call Center received more than 24,000 calls for Food/Meals during
2011.
72.1% of Metro Nashville Public School students received free or reduced price
lunches in 2010.
Hunger and Food Insecurity is a growing problem for low‐
income families. A good, healthy diet is important in many
ways. Without the availability of healthy and nutritious food,
people may be at risk of heart disease, hypertension and a
potentially shorter life expectancy.
Hunger in Nashville
Each year, the United States Conference of Mayors produces a status report on 27 cities in the
Hunger and Homelessness Survey, in which agencies in these cities were surveyed regarding the
needs related to food and homelessness. The report indicated that the Nashville agencies
surveyed expressed concern about the increased demand for emergency food assistance, which
could not be fully met. The survey indicated that the greatest cause of hunger in Nashville for
individuals and households with children was unemployment, followed by substance abuse and
high housing cost.
The most recent report noted that between 2009 and 2010, Davidson County experienced:
A 22% increase in requests for emergency food assistance
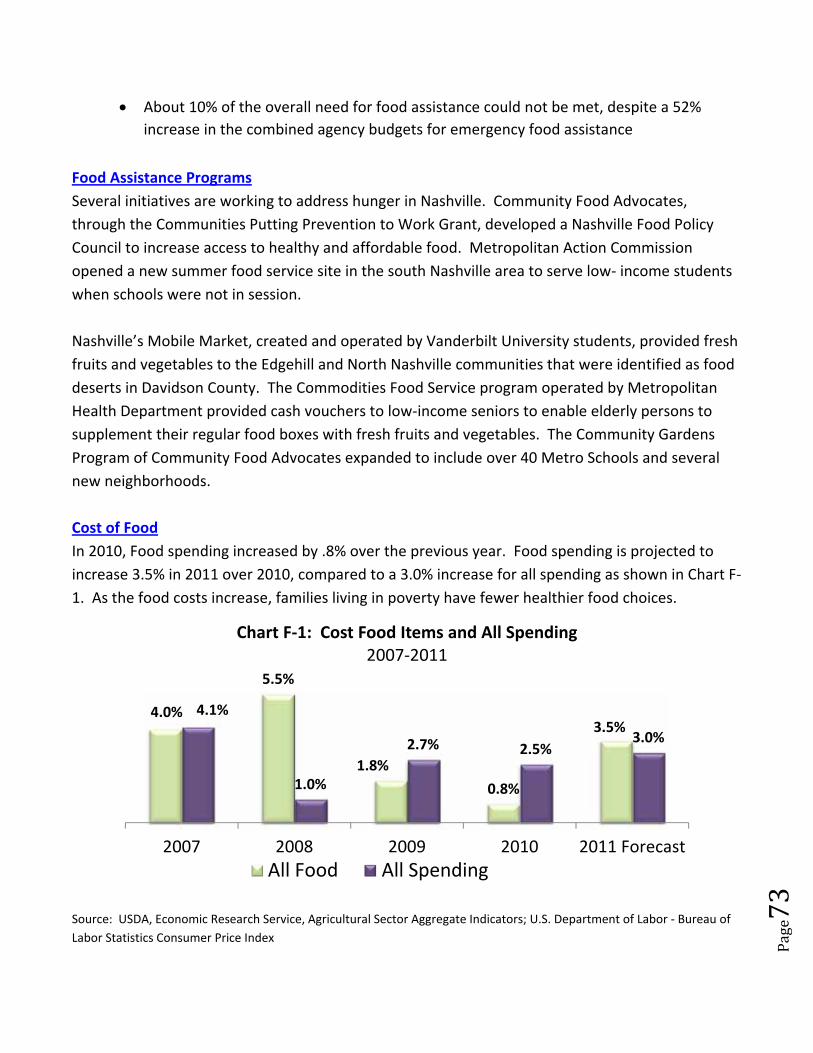
Page73
About 10% of the overall need for food assistance could not be met, despite a 52%
increase in the combined agency budgets for emergency food assistance
Food Assistance Programs
Several initiatives are working to address hunger in Nashville. Community Food Advocates,
through the Communities Putting Prevention to Work Grant, developed a Nashville Food Policy
Council to increase access to healthy and affordable food. Metropolitan Action Commission
opened a new summer food service site in the south Nashville area to serve low‐ income students
when schools were not in session.
Nashville’s Mobile Market, created and operated by Vanderbilt University students, provided fresh
fruits and vegetables to the Edgehill and North Nashville communities that were identified as food
deserts in Davidson County. The Commodities Food Service program operated by Metropolitan
Health Department provided cash vouchers to low‐income seniors to enable elderly persons to
supplement their regular food boxes with fresh fruits and vegetables. The Community Gardens
Program of Community Food Advocates expanded to include over 40 Metro Schools and several
new neighborhoods.
Cost of Food
In 2010, Food spending increased by .8% over the previous year. Food spending is projected to
increase 3.5% in 2011 over 2010, compared to a 3.0% increase for all spending as shown in Chart F‐
1. As the food costs increase, families living in poverty have fewer healthier food choices.
Source: USDA, Economic Research Service, Agricultural Sector Aggregate Indicators; U.S. Department of Labor ‐ Bureau of
Labor Statistics Consumer Price Index
4.0%
5.5%
1.8%
0.8%
3.5%4.1%
1.0%
2.7% 2.5%3.0%
2007 2008 2009 2010 2011 Forecast
Chart F‐1: Cost Food Items and All Spending2007‐2011
All Food All Spending
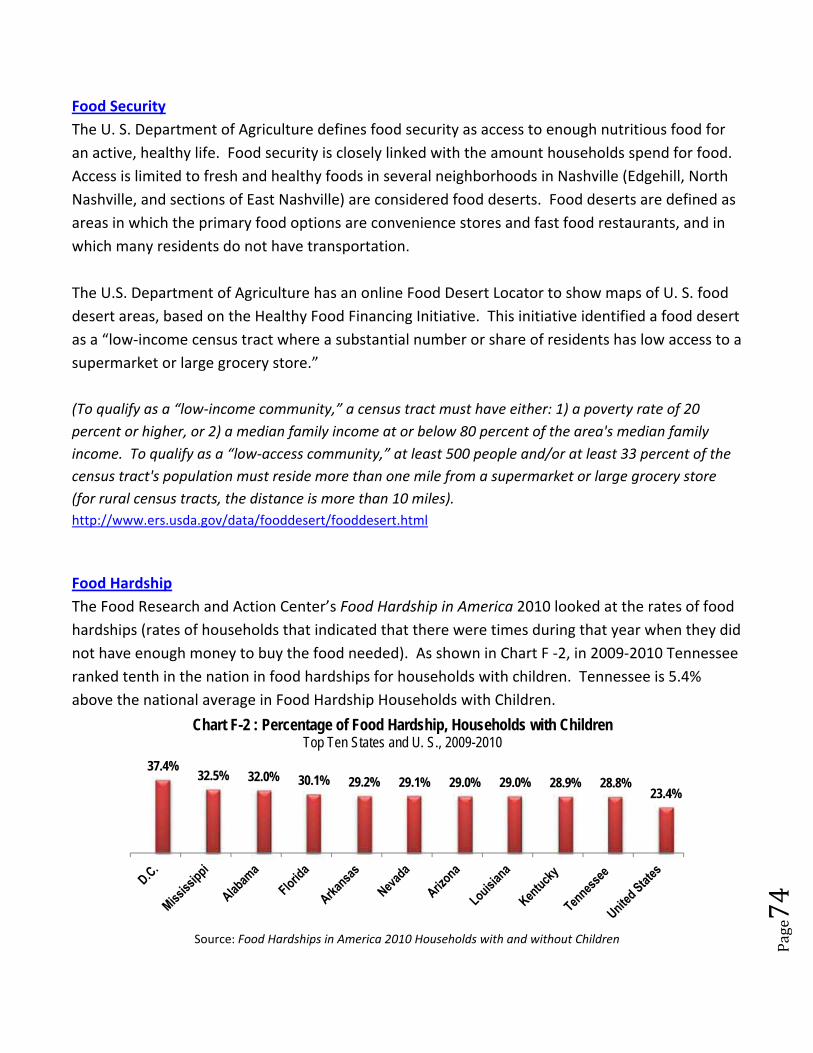
Page74
Food Security
The U. S. Department of Agriculture defines food security as access to enough nutritious food for
an active, healthy life. Food security is closely linked with the amount households spend for food.
Access is limited to fresh and healthy foods in several neighborhoods in Nashville (Edgehill, North
Nashville, and sections of East Nashville) are considered food deserts. Food deserts are defined as
areas in which the primary food options are convenience stores and fast food restaurants, and in
which many residents do not have transportation.
The U.S. Department of Agriculture has an online Food Desert Locator to show maps of U. S. food
desert areas, based on the Healthy Food Financing Initiative. This initiative identified a food desert
as a “low‐income census tract where a substantial number or share of residents has low access to a
supermarket or large grocery store.”
(To qualify as a “low‐income community,” a census tract must have either: 1) a poverty rate of 20
percent or higher, or 2) a median family income at or below 80 percent of the area's median family
income. To qualify as a “low‐access community,” at least 500 people and/or at least 33 percent of the
census tract's population must reside more than one mile from a supermarket or large grocery store
(for rural census tracts, the distance is more than 10 miles).
http://www.ers.usda.gov/data/fooddesert/fooddesert.html
Food Hardship
The Food Research and Action Center’s Food Hardship in America 2010 looked at the rates of food
hardships (rates of households that indicated that there were times during that year when they did
not have enough money to buy the food needed). As shown in Chart F ‐2, in 2009‐2010 Tennessee
ranked tenth in the nation in food hardships for households with children. Tennessee is 5.4%
above the national average in Food Hardship Households with Children.
Source: Food Hardships in America 2010 Households with and without Children
37.4%32.5% 32.0% 30.1% 29.2% 29.1% 29.0% 29.0% 28.9% 28.8%
23.4%
Chart F-2 : Percentage of Food Hardship, Households with ChildrenTop Ten States and U. S., 2009-2010
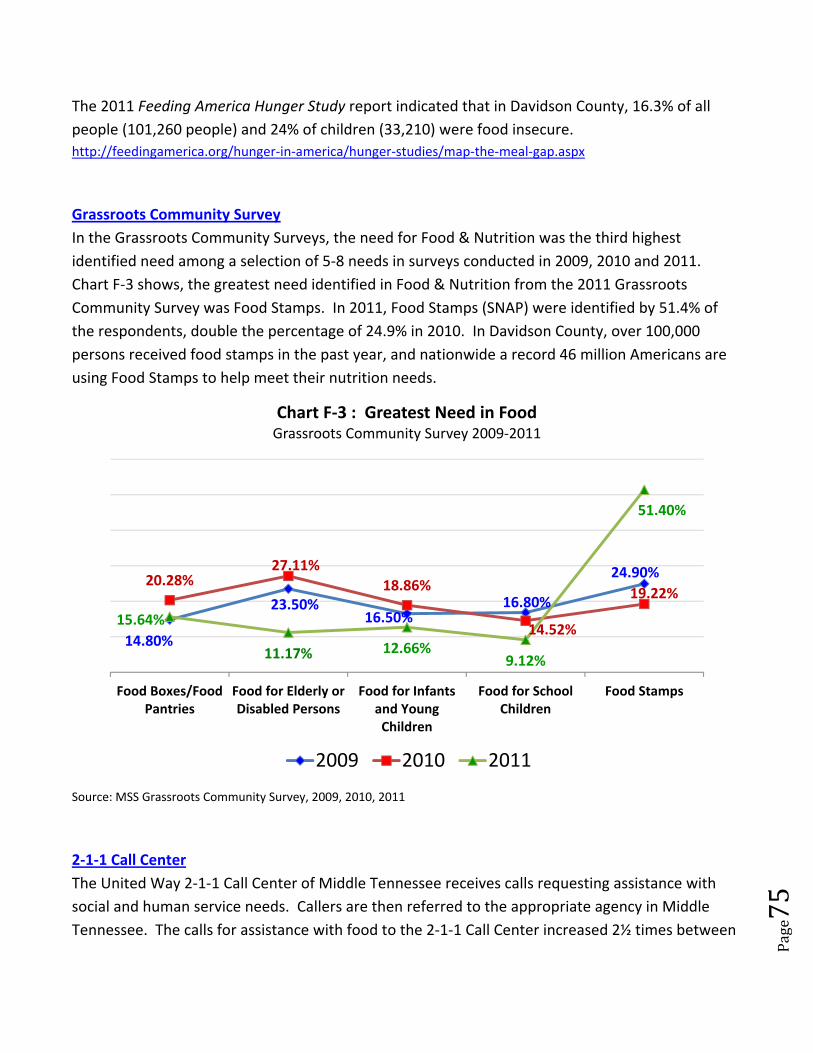
Page75
The 2011 Feeding America Hunger Study report indicated that in Davidson County, 16.3% of all
people (101,260 people) and 24% of children (33,210) were food insecure.
http://feedingamerica.org/hunger‐in‐america/hunger‐studies/map‐the‐meal‐gap.aspx
Grassroots Community Survey
In the Grassroots Community Surveys, the need for Food & Nutrition was the third highest
identified need among a selection of 5‐8 needs in surveys conducted in 2009, 2010 and 2011.
Chart F‐3 shows, the greatest need identified in Food & Nutrition from the 2011 Grassroots
Community Survey was Food Stamps. In 2011, Food Stamps (SNAP) were identified by 51.4% of
the respondents, double the percentage of 24.9% in 2010. In Davidson County, over 100,000
persons received food stamps in the past year, and nationwide a record 46 million Americans are
using Food Stamps to help meet their nutrition needs.
Source: MSS Grassroots Community Survey, 2009, 2010, 2011
2‐1‐1 Call Center
The United Way 2‐1‐1 Call Center of Middle Tennessee receives calls requesting assistance with
social and human service needs. Callers are then referred to the appropriate agency in Middle
Tennessee. The calls for assistance with food to the 2‐1‐1 Call Center increased 2½ times between
14.80%
23.50%16.50%
16.80%
24.90%20.28%27.11%
18.86%
14.52%
19.22%
15.64%
11.17% 12.66%9.12%
51.40%
Food Boxes/FoodPantries
Food for Elderly orDisabled Persons
Food for Infantsand YoungChildren
Food for SchoolChildren
Food Stamps
Chart F‐3 : Greatest Need in FoodGrassroots Community Survey 2009‐2011
2009 2010 2011
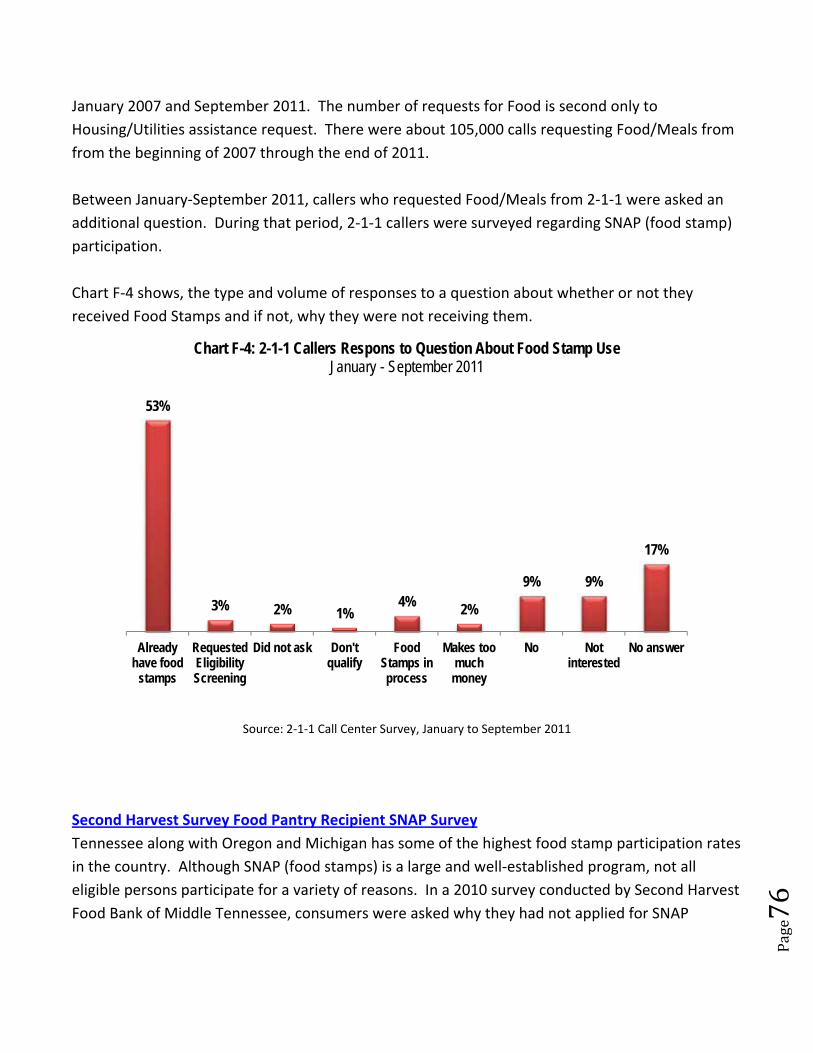
Page76
January 2007 and September 2011. The number of requests for Food is second only to
Housing/Utilities assistance request. There were about 105,000 calls requesting Food/Meals from
from the beginning of 2007 through the end of 2011.
Between January‐September 2011, callers who requested Food/Meals from 2‐1‐1 were asked an
additional question. During that period, 2‐1‐1 callers were surveyed regarding SNAP (food stamp)
participation.
Chart F‐4 shows, the type and volume of responses to a question about whether or not they
received Food Stamps and if not, why they were not receiving them.
Source: 2‐1‐1 Call Center Survey, January to September 2011
Second Harvest Survey Food Pantry Recipient SNAP Survey
Tennessee along with Oregon and Michigan has some of the highest food stamp participation rates
in the country. Although SNAP (food stamps) is a large and well‐established program, not all
eligible persons participate for a variety of reasons. In a 2010 survey conducted by Second Harvest
Food Bank of Middle Tennessee, consumers were asked why they had not applied for SNAP
53%
3% 2% 1%4% 2%
9% 9%
17%
Alreadyhave food
stamps
RequestedEligibilityScreening
Did not ask Don'tqualify
FoodStamps inprocess
Makes toomuchmoney
No Notinterested
No answer
Chart F-4: 2-1-1 Callers Respons to Question About Food Stamp UseJanuary - September 2011
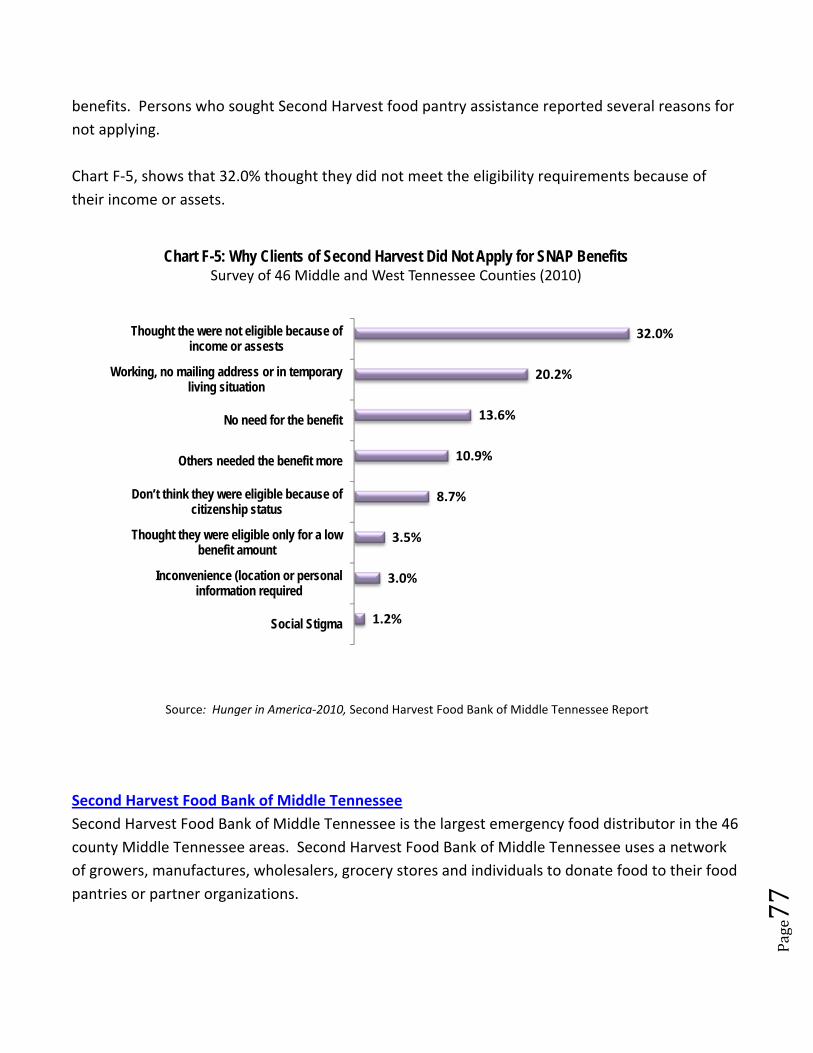
Page77
benefits. Persons who sought Second Harvest food pantry assistance reported several reasons for
not applying.
Chart F‐5, shows that 32.0% thought they did not meet the eligibility requirements because of
their income or assets.
Source: Hunger in America‐2010, Second Harvest Food Bank of Middle Tennessee Report
Second Harvest Food Bank of Middle Tennessee
Second Harvest Food Bank of Middle Tennessee is the largest emergency food distributor in the 46
county Middle Tennessee areas. Second Harvest Food Bank of Middle Tennessee uses a network
of growers, manufactures, wholesalers, grocery stores and individuals to donate food to their food
pantries or partner organizations.
1.2%
3.0%
3.5%
8.7%
10.9%
13.6%
20.2%
32.0%
Social Stigma
Inconvenience (location or personalinformation required
Thought they were eligible only for a lowbenefit amount
Don’t think they were eligible because of citizenship status
Others needed the benefit more
No need for the benefit
Working, no mailing address or in temporaryliving situation
Thought the were not eligible because ofincome or assests
Chart F-5: Why Clients of Second Harvest Did Not Apply for SNAP BenefitsSurvey of 46 Middle and West Tennessee Counties (2010)
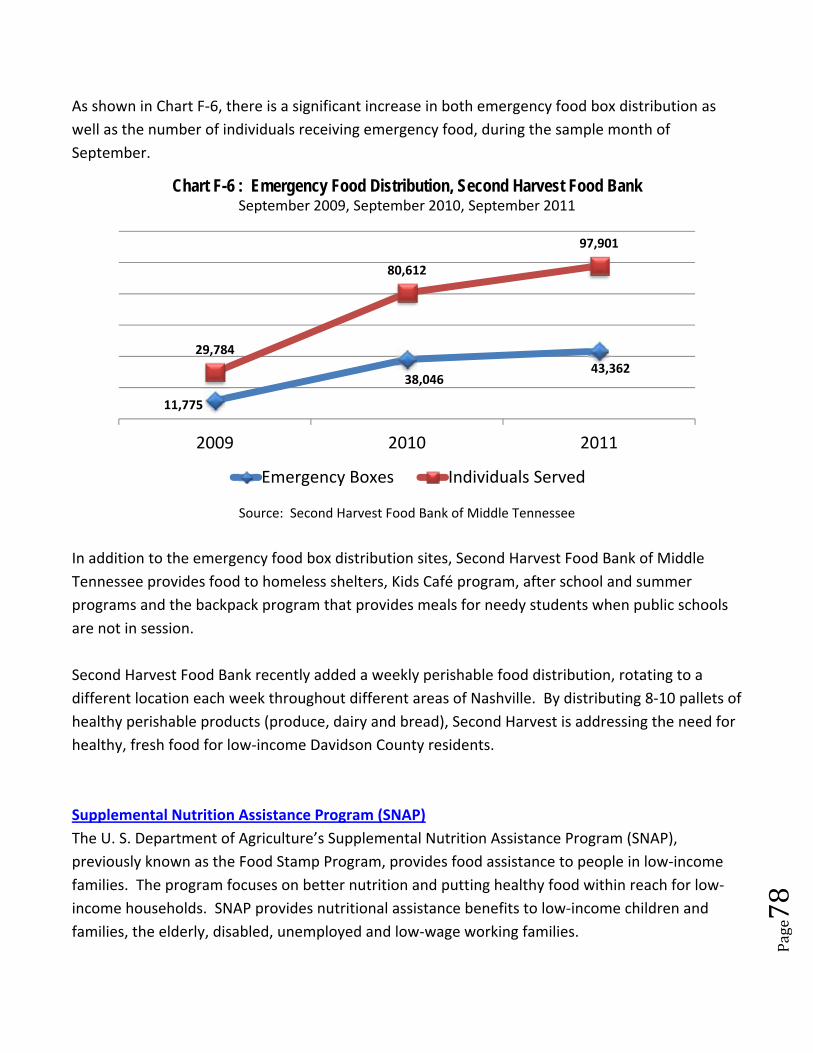
Page78
As shown in Chart F‐6, there is a significant increase in both emergency food box distribution as
well as the number of individuals receiving emergency food, during the sample month of
September.
Source: Second Harvest Food Bank of Middle Tennessee
In addition to the emergency food box distribution sites, Second Harvest Food Bank of Middle
Tennessee provides food to homeless shelters, Kids Café program, after school and summer
programs and the backpack program that provides meals for needy students when public schools
are not in session.
Second Harvest Food Bank recently added a weekly perishable food distribution, rotating to a
different location each week throughout different areas of Nashville. By distributing 8‐10 pallets of
healthy perishable products (produce, dairy and bread), Second Harvest is addressing the need for
healthy, fresh food for low‐income Davidson County residents.
Supplemental Nutrition Assistance Program (SNAP)
The U. S. Department of Agriculture’s Supplemental Nutrition Assistance Program (SNAP),
previously known as the Food Stamp Program, provides food assistance to people in low‐income
families. The program focuses on better nutrition and putting healthy food within reach for low‐
income households. SNAP provides nutritional assistance benefits to low‐income children and
families, the elderly, disabled, unemployed and low‐wage working families.
11,775
38,04643,362
29,784
80,612
97,901
2009 2010 2011
Chart F-6 : Emergency Food Distribution, Second Harvest Food BankSeptember 2009, September 2010, September 2011
Emergency Boxes Individuals Served
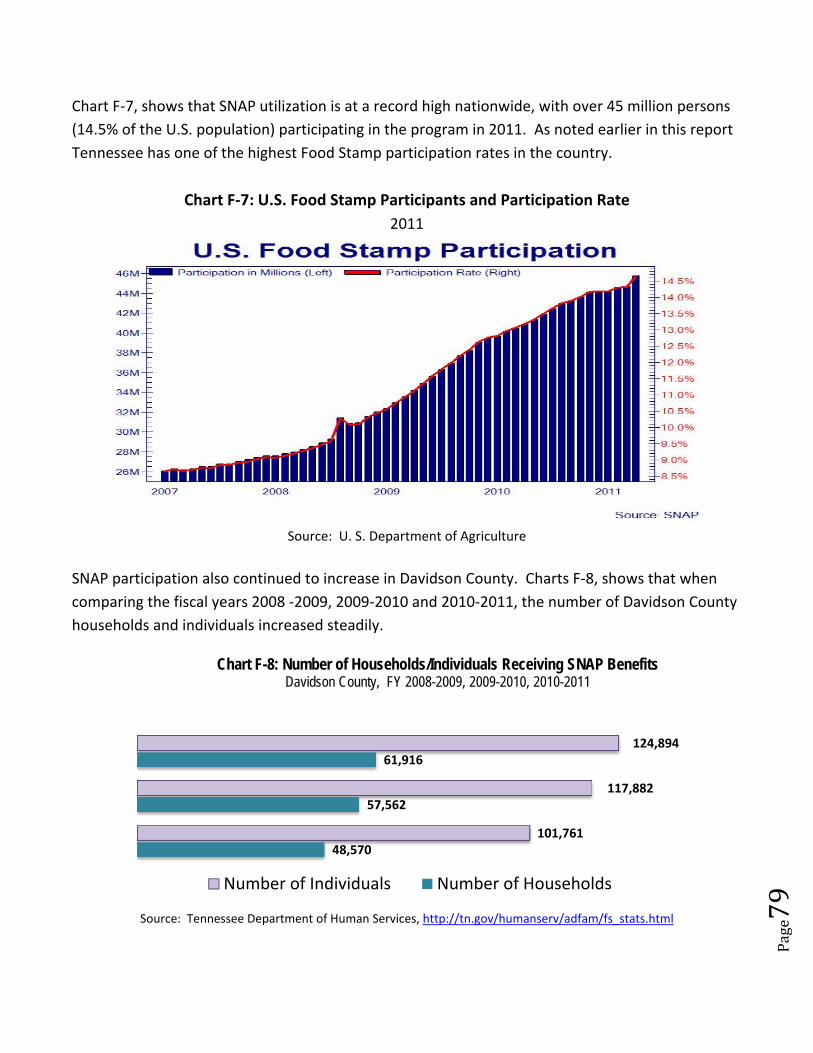
Page79
Chart F‐7, shows that SNAP utilization is at a record high nationwide, with over 45 million persons
(14.5% of the U.S. population) participating in the program in 2011. As noted earlier in this report
Tennessee has one of the highest Food Stamp participation rates in the country.
Chart F‐7: U.S. Food Stamp Participants and Participation Rate
2011
Source: U. S. Department of Agriculture
SNAP participation also continued to increase in Davidson County. Charts F‐8, shows that when
comparing the fiscal years 2008 ‐2009, 2009‐2010 and 2010‐2011, the number of Davidson County
households and individuals increased steadily.
Source: Tennessee Department of Human Services, http://tn.gov/humanserv/adfam/fs_stats.html
48,570
57,562
61,916
101,761
117,882
124,894
Chart F-8: Number of Households/Individuals Receiving SNAP BenefitsDavidson County, FY 2008-2009, 2009-2010, 2010-2011
Number of Individuals Number of Households
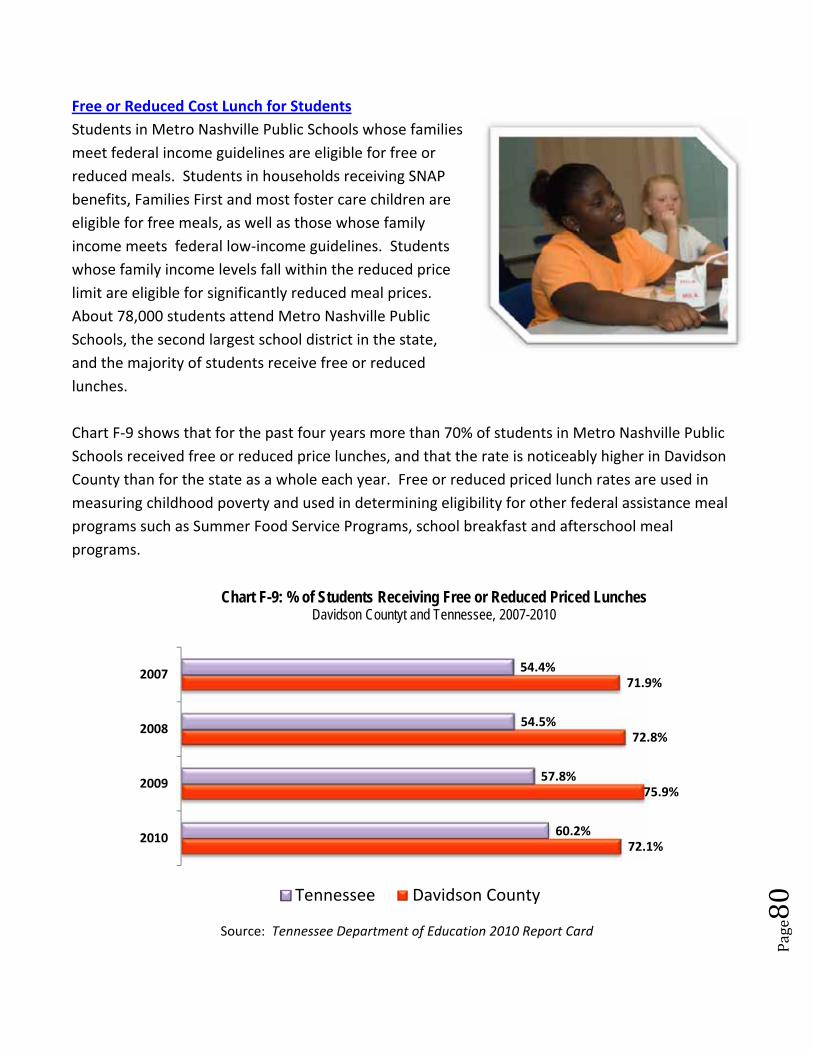
Page80
Free or Reduced Cost Lunch for Students
Students in Metro Nashville Public Schools whose families
meet federal income guidelines are eligible for free or
reduced meals. Students in households receiving SNAP
benefits, Families First and most foster care children are
eligible for free meals, as well as those whose family
income meets federal low‐income guidelines. Students
whose family income levels fall within the reduced price
limit are eligible for significantly reduced meal prices.
About 78,000 students attend Metro Nashville Public
Schools, the second largest school district in the state,
and the majority of students receive free or reduced
lunches.
Chart F‐9 shows that for the past four years more than 70% of students in Metro Nashville Public
Schools received free or reduced price lunches, and that the rate is noticeably higher in Davidson
County than for the state as a whole each year. Free or reduced priced lunch rates are used in
measuring childhood poverty and used in determining eligibility for other federal assistance meal
programs such as Summer Food Service Programs, school breakfast and afterschool meal
programs.
Source: Tennessee Department of Education 2010 Report Card
72.1%
75.9%
72.8%
71.9%
60.2%
57.8%
54.5%
54.4%
2010
2009
2008
2007
Chart F-9: % of Students Receiving Free or Reduced Priced LunchesDavidson Countyt and Tennessee, 2007-2010
Tennessee Davidson County
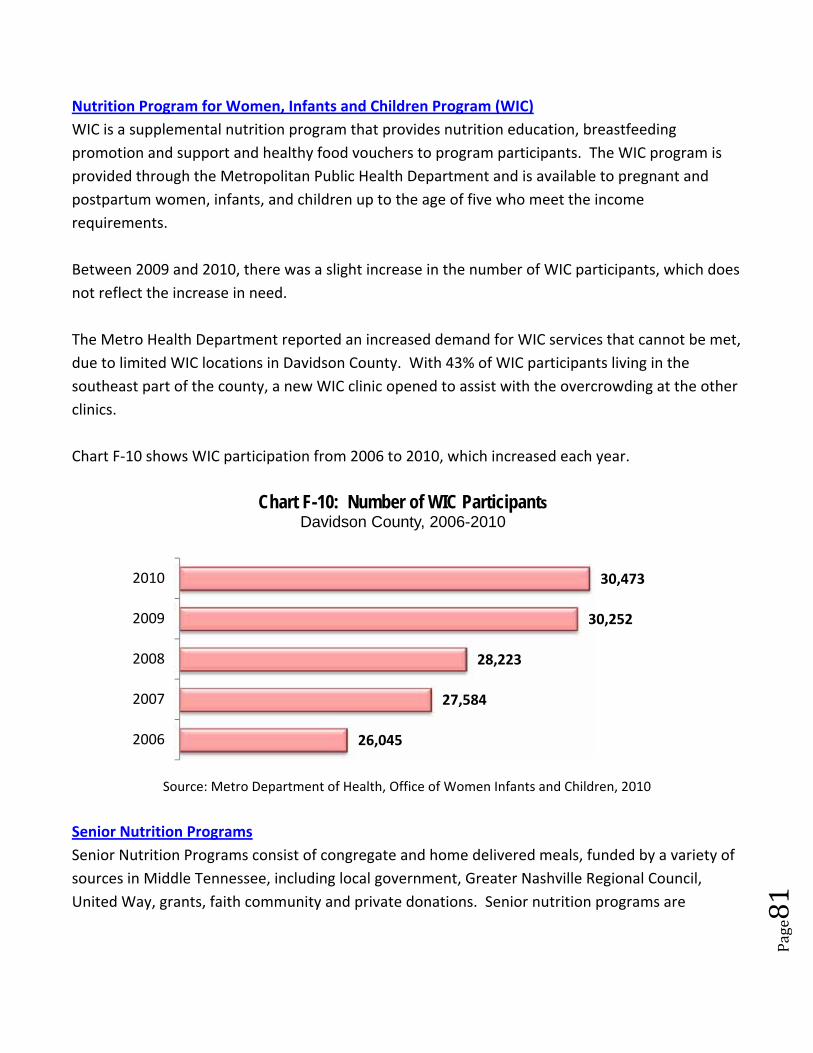
Page81
Nutrition Program for Women, Infants and Children Program (WIC)
WIC is a supplemental nutrition program that provides nutrition education, breastfeeding
promotion and support and healthy food vouchers to program participants. The WIC program is
provided through the Metropolitan Public Health Department and is available to pregnant and
postpartum women, infants, and children up to the age of five who meet the income
requirements.
Between 2009 and 2010, there was a slight increase in the number of WIC participants, which does
not reflect the increase in need.
The Metro Health Department reported an increased demand for WIC services that cannot be met,
due to limited WIC locations in Davidson County. With 43% of WIC participants living in the
southeast part of the county, a new WIC clinic opened to assist with the overcrowding at the other
clinics.
Chart F‐10 shows WIC participation from 2006 to 2010, which increased each year.
Source: Metro Department of Health, Office of Women Infants and Children, 2010
Senior Nutrition Programs
Senior Nutrition Programs consist of congregate and home delivered meals, funded by a variety of
sources in Middle Tennessee, including local government, Greater Nashville Regional Council,
United Way, grants, faith community and private donations. Senior nutrition programs are
26,045
27,584
28,223
30,252
30,473
2006
2007
2008
2009
2010
Chart F-10: Number of WIC ParticipantsDavidson County, 2006-2010
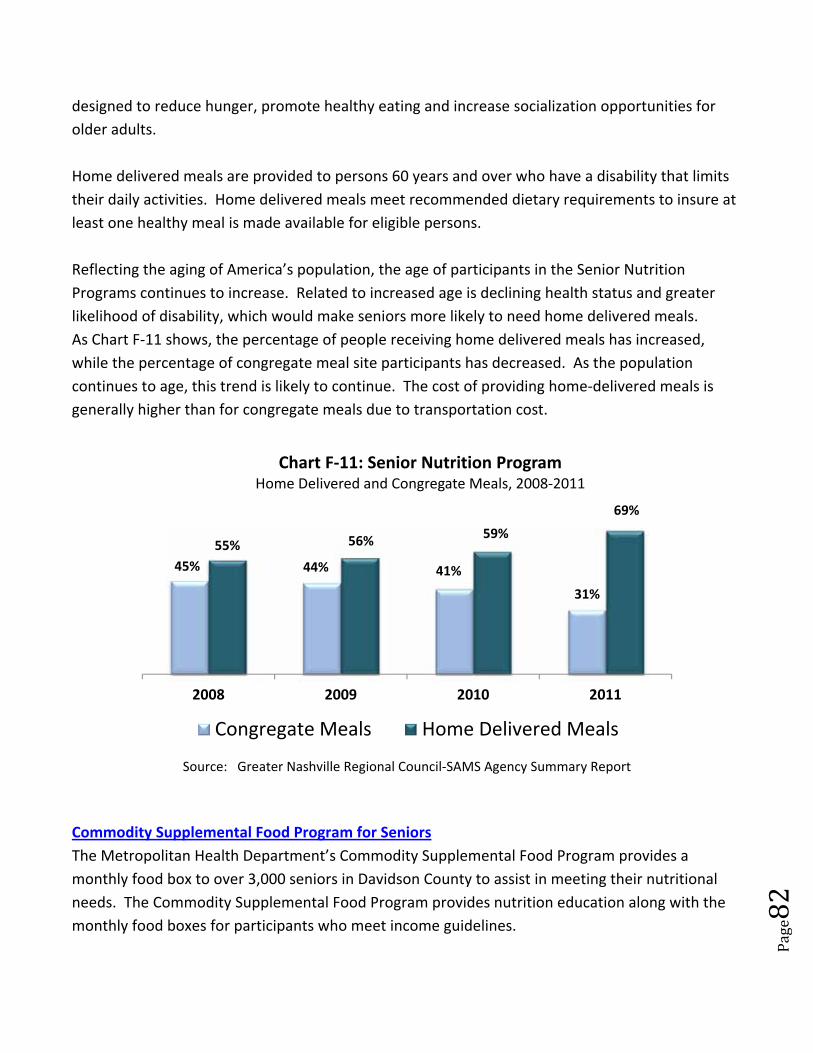
Page82
designed to reduce hunger, promote healthy eating and increase socialization opportunities for
older adults.
Home delivered meals are provided to persons 60 years and over who have a disability that limits
their daily activities. Home delivered meals meet recommended dietary requirements to insure at
least one healthy meal is made available for eligible persons.
Reflecting the aging of America’s population, the age of participants in the Senior Nutrition
Programs continues to increase. Related to increased age is declining health status and greater
likelihood of disability, which would make seniors more likely to need home delivered meals.
As Chart F‐11 shows, the percentage of people receiving home delivered meals has increased,
while the percentage of congregate meal site participants has decreased. As the population
continues to age, this trend is likely to continue. The cost of providing home‐delivered meals is
generally higher than for congregate meals due to transportation cost.
Source: Greater Nashville Regional Council‐SAMS Agency Summary Report
Commodity Supplemental Food Program for Seniors
The Metropolitan Health Department’s Commodity Supplemental Food Program provides a
monthly food box to over 3,000 seniors in Davidson County to assist in meeting their nutritional
needs. The Commodity Supplemental Food Program provides nutrition education along with the
monthly food boxes for participants who meet income guidelines.
45% 44% 41%
31%
55% 56%59%
69%
2008 2009 2010 2011
Chart F‐11: Senior Nutrition ProgramHome Delivered and Congregate Meals, 2008‐2011
Congregate Meals Home Delivered Meals
Page83
BEST PRACTICES – Example for Food
Increasing Access to Fresh Food Through Community Gardens
Description
Community Gardens are formed by individuals and neighborhood groups with an interest in
increasing access to fresh, affordable and healthy foods. These groups often are allowed to use
vacant land and are provided with technical assistance to grow their own food. Community
Gardens can offer neighborhoods a viable solution to lack of access to healthy, affordable food. In
some places, community gardens are supported by funding such as the Community Development
Block Grant.
Community gardening is being practiced by a variety of groups and individuals.
Some gardens are maintained by community groups, sponsored by an organization,
developed on public land and supported by local governments (such as at public schools)
and many are individually owned and operated.
Successful community gardens have common features that include cooperation between
landowners and gardeners, neighborhood support, technical assistance and committed
volunteers.
Community gardens are not only a community asset, but they can serve as a foundation for
other community activities (cooking classes, effective agricultural techniques, etc.).
Rationale
Community gardens offer residents the opportunity to grow their own food. Added benefits may
include intergenerational gardening with elderly residents and neighborhood children working
together, with the result of saving money spent on food and increasing the quality of their food.
As community gardening becomes more popular, it can improve access to fresh food for low‐
income residents who live in food deserts. While there are successful community gardens in
Davidson County (Organized Neighbors of Edgehill, McGruder Family Resource Center, etc.),
community gardens are not as frequently used as in some other places.
Potential Challenges for Davidson County
Some of the challenges to Community Gardens include land use policies that prohibit certain types
of gardening (particularly in urban areas), lack of awareness of the benefits of community gardens
by low income residents, gardening is labor intensive and there is a short growing season.
Page84
Steps to Operation in Davidson County
Davidson County has experienced an increase in Community Gardens due in part to local
government support, lack of access to affordable fresh fruits and vegetables in food deserts and an
increase in the number of farmers markets. Community Gardens offer an opportunity for local
growers to market their products in a low cost way. Nashville now has several “farmers markets”
that have recently developed allowing community garden operators to share their products with
low‐income residents. The web site of Metro Nashville Public Schools indicates that there are 47
school‐based community gardens.
http://www.blueshoenashville.com/nashvillegardens.html
http://aggie‐horticulture.tamu.edu/kinder/commun.html
http://www.mnps.org/Page85165.aspx
BEST PRACTICES – Example for Food
Expanding Summer Youth Food Programs
Description
Summer Youth Food Programs offer low‐income students an opportunity to continue receiving at
least one balanced meal a day during school breaks. With more than 70% of Metropolitan
Nashville Public School students receiving free or reduced price lunches during the school year,
their healthy food choices are limited during the summer months and at other times when schools
are not in session. Providing healthy food to students during these times is important in their
physical and academic growth.
Rationale
During the summer months, students who qualify for free or reduced price lunches during the
school year have limited options for healthy meals. The U.S. Department of Agriculture’s (USDA)
Food and Nutrition Service Program funds the Summer Food Service Program (SFSP). The SFSP
program is designed to provide nutritious meals to children when school is not in session. Metro
Nashville Public Schools served over 6.5 million free/reduced cost lunches during the 167
instructional days, about 39,000 per day. During the summer of 2011, Metropolitan Action
Commission's SFSP program served more than 232,000 meals in over 100 sites throughout
Davidson County. In contrast, during 39 days of operation, this would be about 6,000 a day.

Page85
Summer Food Service Programs offer low‐income students an opportunity to be in a structured
learning environment, since most of these programs are affiliated with summer enrichment
activities such as the Boys and Girls Club, YMCA, YWCA and community centers. Davidson County’s
Summer Food Service Program is operated by the Metropolitan Action Commission. Second
Harvest Food Bank also offers summer meals to low‐income students through its Kid’s Café
program. The target population is students who live in low‐income areas and qualify for free or
reduced price lunches from public schools. All meals must meet USDA nutrition guidelines.
The USDA’s Food and Nutrition Service began the “Seamless Summer” Option that would enable
school districts to provide the same meal during the summer that is offered during the school year.
Expansion of Summer Food Programs will enable more low‐income students access to meals
during the summer months. The primary difference between the traditional SFSP and the
Seamless Summer Option is that local school authorities are now encouraged to provide year
around meals to eligible students. The providers of meals can be reimbursed at the same rate as
free or reduced price lunches during the school year. In addition to the reimbursement, the
Seamless Summer Option reduces the amount of reporting and streamlines the site review
process.
Potential Challenges for Davidson County
The Seamless Summer Option would be new to Metro schools and may require additional
operating and personnel costs for targeted schools that are not typically open during summer
months. The existing Summer Food Service Program is already challenged with ongoing
recruitment of new sites and partners to reach the neediest students. Most Metro Schools do not
serve as sites for the SFSP.
Steps to Operate in Davidson County
Data from schools and the Metropolitan Action Commission indicates that there are many
students who are eligible but do not participate in the summer program. Additional outreach
efforts are needed to identify and enroll these students. MAC’s Summer Food Service Program
requires sites and partners to apply annually to serve meals to their summer camp recipients.
http://www.summerfood.usda.gov/
http://www.nashville.gov/mac/summer_lunch.asp
http://www.fns.usda.gov/cnd/Seamless_Summer.htm
http://www.fns.usda.gov/cnd/SFSP_SeamlessComparisonChart.pdf
http://frac.org/federal‐foodnutrition‐programs/summer‐programs/model‐summer‐programs/
Page86
In County Health Rankings, Davidson County ranks higher than most other Tennessee
counties in Clinical Care, Morbidity and Health Behaviors. However, it ranks 92 out of
95 counties in Tennessee for physical environment, based on air pollution, access to
healthy foods and access to recreational facilities.
The leading causes of death in Davidson County are that can be managed by proper
primary care and treatment are heart disease, cancer, and stroke. In Davidson
County, the leading cause of preventable death is homicide.
The U. S. Centers on Disease Control (CDC) reported that in Tennessee, suicide is the
ninth leading cause of death. For ages 25‐34, suicide is the second leading cause of
death and third leading cause of death for ages 15‐24.
Nationwide 5.6 million more people are projected to be eligible for subsidized health
insurance through Medicaid in 2012 than in 2008, due to job losses and cancellation of
insurance by employers.
The number of uninsured people in Nashville is projected to increase to approximately
98,300 by 2014, a 22.8% increase.
The CDC indicates that in recent decades, the leading causes of
death are no longer acute, communicable diseases, but are now
chronic diseases. It noted that a combination of genetic and
environmental factors cause most disease. With chronic diseases as
the leading causes of death and disability, there are nationwide
efforts working to prevent the conditions that could be prevented.
The Healthy People initiative, not only looks at the measures of
health, life expectancy and causes of death, but also assesses well‐
being (assessing the positive aspects and quality of life).
NashVitality (part of the Communities Putting Prevention to Work initiative of the Metro Nashville
Public Health Department) has information to enhance the health and activity level of our
community: http://www.nashvitality.org/
Page87
As mentioned near the beginning of the 2011 Community Needs Evaluation, recent research
estimates the deaths attributable to social factors in the United States. The June 2011 American
Journal of Public Health’s Estimated Deaths Attributable to Social Factors in the United States
identified correlations between social factors (poverty, low education, area (neighborhood)
poverty, low social support, income inequality, etc.
This analysis of deaths that occurred in 2000 identified the portion of deaths projected for each
factor. The prevalence of estimated deaths reported in the study included:
11.5% related to low education for people aged 25‐64
7.5% related to racial segregation
7.4% related to low education for people age 65 and over
6.7% related to poverty for people aged 25‐64
6.7% related to low social support for people aged 25‐64
5.4% related to low social support for people 65 and over
Healthy People 2020
The Healthy People initiative, part of the U.S. Department of Health and Human Services, focuses
on interventions to reduce or eliminate illness, disability and premature deaths in the U.S.
It provides a comprehensive set of 10‐year national goals and objectives for improving the health
of all Americans.
The Healthy People 2020 project contains 42 topic areas with nearly 600 objectives and 1,200
measures. A smaller set of Healthy People 2020 objectives, called Leading Health Indicators, were
selected to communicate high‐priority health issues and actions that can be taken to address
them. The Healthy People 2020 Leading Health Indicators emphasizes overcoming challenges to
track progress over the course of the decade. The indicators are used to assess the health of the
nation, facilitate collaboration across sectors, and motivate action at national, state, and
community levels to improve the health of the U.S. population.
The 2010 Tennessee State Health Plan from the State of Tennessee’s Division of Health reported
that Tennessee was one of the least healthy states, 44th out of 50 states. In 2009, the first edition
of the State Health Plan was developed and published as a document to begin a comprehensive
and participatory health planning process to coordinate Tennesseans’ efforts to improve health.

Page88
Numerous factors have contributed to poor health status of Tennesseans, including individual
behaviors, culture, the environment, economic and social determinants, and genetics. The state’s
health status is likely linked to the below average life expectancy of the population. Tennesseans
are expected to live on average 3 years less than the average U.S. citizen lives (75 years as
compared to 78 years), approximately nine deaths per 1,000 live births, compared to seven deaths
per 1,000 live births in Tennessee compared to nationwide.
The Leading Health Indicators from The Healthy People 2020 uses 26 indicators organized under 12
topics:
Access to Health Services
Clinical Preventive Services
Environmental Quality
Injury and Violence
Maternal, Infant, and Child Health
Mental Health
Nutrition, Physical Activity, and Obesity
Oral Health
Reproductive and Sexual Health
Social Determinants (Environmental Experiences)
Substance Abuse
Tobacco
The indicators were selected and organized to measure Health Determinants and Health
Outcomes. This approach is intended to draw attention to both physical and social determinants
to enhance the understanding on how health is affected by the personal, social, economic and
environmental experiences. These affect health status and contribute to health disparities from
infancy through old age.
The Social Determinants of Health topic areas in Healthy People 2020 identify ways to create social
and physical environments that promote good health for all. This involves establishing policies to
positively to improve conditions in which we live, learn, work, and play, in order to result in a
healthier population, society, and workforce.
Examples of social determinants include: Availability of resources to meet daily needs (such as
safe housing and local food markets); Access to educational, economic, and job opportunities;
Access to health care services; Quality of education and job training; Availability of community‐
Page89
based resources in support of community living and opportunities for recreational and leisure‐time
activities; Transportation options; Public safety; Social support; Social norms and attitudes
(discrimination, racism, and distrust of government); Exposure to crime, violence, and social
disorder (presence of trash and lack of cooperation in a community); Socioeconomic conditions
(concentrated poverty and the stressful conditions that accompany it); Residential segregation,
Language/Literacy; Access to mass media and emerging technologies (cell phones, the Internet,
and social media) and Culture.
Examples of physical determinants include: natural environment, such as green space (such as
trees and grass) or climate change, built environment (buildings, sidewalks, bike lanes, and roads),
work places, schools, and recreational settings, housing and community design, exposure to toxic
substances and other physical hazards, physical barriers (especially for people with disabilities) and
aesthetic elements (good lighting, trees, and benches).
County Health Rankings
The County Health Rankings program assesses
data and ranks counties in all 50 states by
various health measures and outcomes. The
program is a component of the Mobilizing Action Toward Community Health collaboration
between the Robert Wood Johnson Foundation and the University of Wisconsin Population Health
Institute).
In Tennessee, Davidson County ranked 26th out of 95 counties for social and economic factors that
included measures of education, employment, income family/social support and community
safety. Davidson County ranks 92nd in physical environment, based on factors of air pollution
(particulate matter and ozone), access to healthy foods and access to recreational facilities.
Davidson County had better rankings in other areas: 8th in Clinical Care, 10th in Morbidity, 15th in
Health Behaviors, 16th in Mortality,
The 2011 County Health Rankings noted that in Davidson County:
9% of adults over age 20 have been diagnosed as diabetic
11% adults reported binge drinking in the past 30 days
27% adults reported no leisure time physical activity in the past 30 days
For every 100,000 residents there are 10 liquor stores
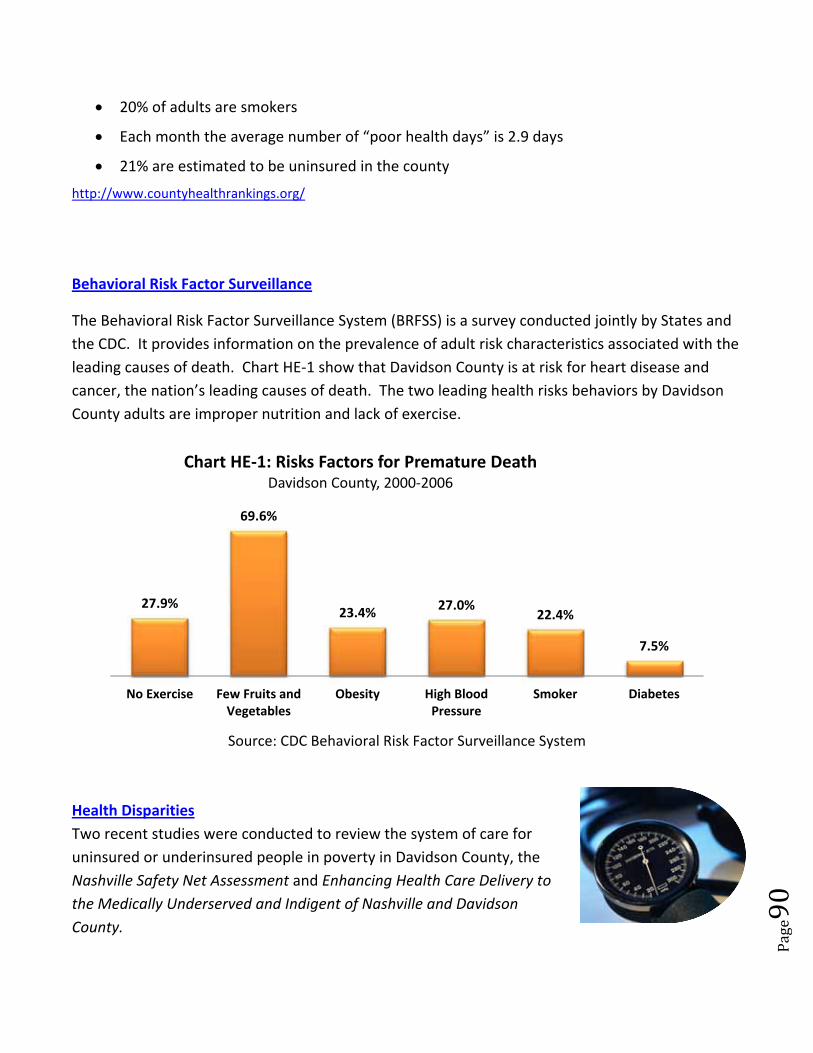
Page90
20% of adults are smokers
Each month the average number of “poor health days” is 2.9 days
21% are estimated to be uninsured in the county
http://www.countyhealthrankings.org/
Behavioral Risk Factor Surveillance
The Behavioral Risk Factor Surveillance System (BRFSS) is a survey conducted jointly by States and
the CDC. It provides information on the prevalence of adult risk characteristics associated with the
leading causes of death. Chart HE‐1 show that Davidson County is at risk for heart disease and
cancer, the nation’s leading causes of death. The two leading health risks behaviors by Davidson
County adults are improper nutrition and lack of exercise.
Source: CDC Behavioral Risk Factor Surveillance System
Health Disparities
Two recent studies were conducted to review the system of care for
uninsured or underinsured people in poverty in Davidson County, the
Nashville Safety Net Assessment and Enhancing Health Care Delivery to
the Medically Underserved and Indigent of Nashville and Davidson
County.
27.9%
69.6%
23.4%27.0%
22.4%
7.5%
No Exercise Few Fruits andVegetables
Obesity High BloodPressure
Smoker Diabetes
Chart HE‐1: Risks Factors for Premature DeathDavidson County, 2000‐2006
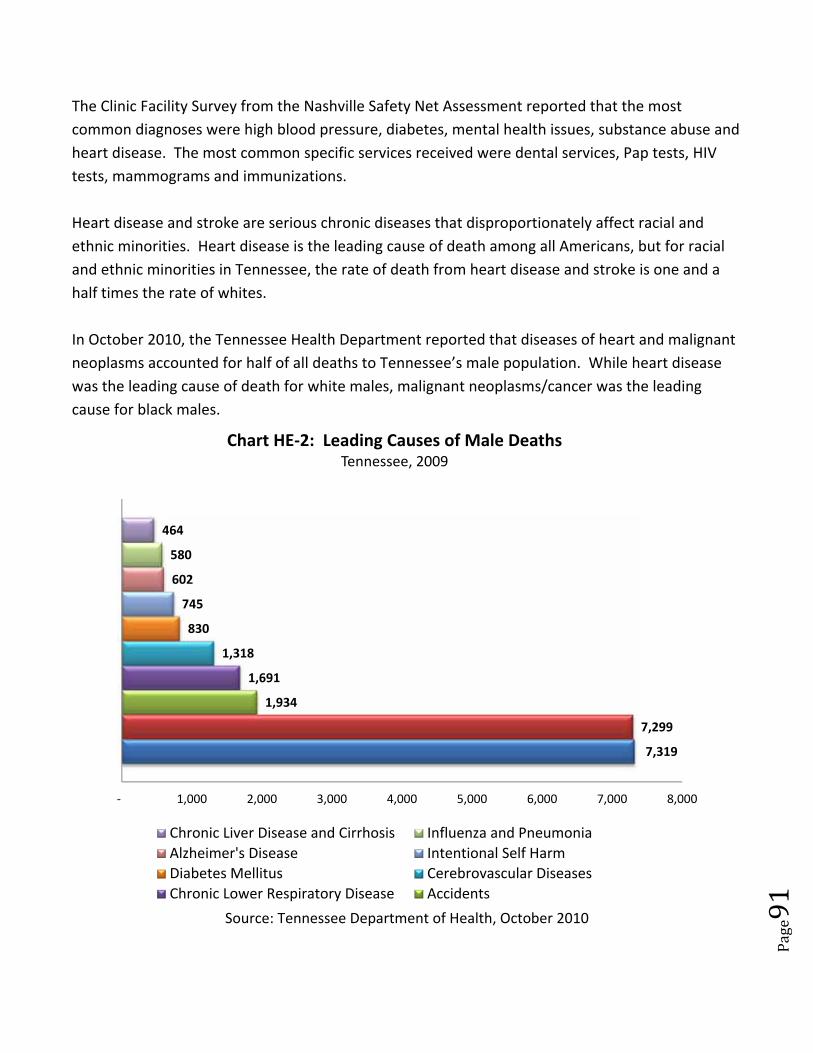
Page91
The Clinic Facility Survey from the Nashville Safety Net Assessment reported that the most
common diagnoses were high blood pressure, diabetes, mental health issues, substance abuse and
heart disease. The most common specific services received were dental services, Pap tests, HIV
tests, mammograms and immunizations.
Heart disease and stroke are serious chronic diseases that disproportionately affect racial and
ethnic minorities. Heart disease is the leading cause of death among all Americans, but for racial
and ethnic minorities in Tennessee, the rate of death from heart disease and stroke is one and a
half times the rate of whites.
In October 2010, the Tennessee Health Department reported that diseases of heart and malignant
neoplasms accounted for half of all deaths to Tennessee’s male population. While heart disease
was the leading cause of death for white males, malignant neoplasms/cancer was the leading
cause for black males.
Source: Tennessee Department of Health, October 2010
7,319
7,299
1,934
1,691
1,318
830
745
602
580
464
‐ 1,000 2,000 3,000 4,000 5,000 6,000 7,000 8,000
Chart HE‐2: Leading Causes of Male DeathsTennessee, 2009
Chronic Liver Disease and Cirrhosis Influenza and Pneumonia
Alzheimer's Disease Intentional Self Harm
Diabetes Mellitus Cerebrovascular Diseases
Chronic Lower Respiratory Disease Accidents
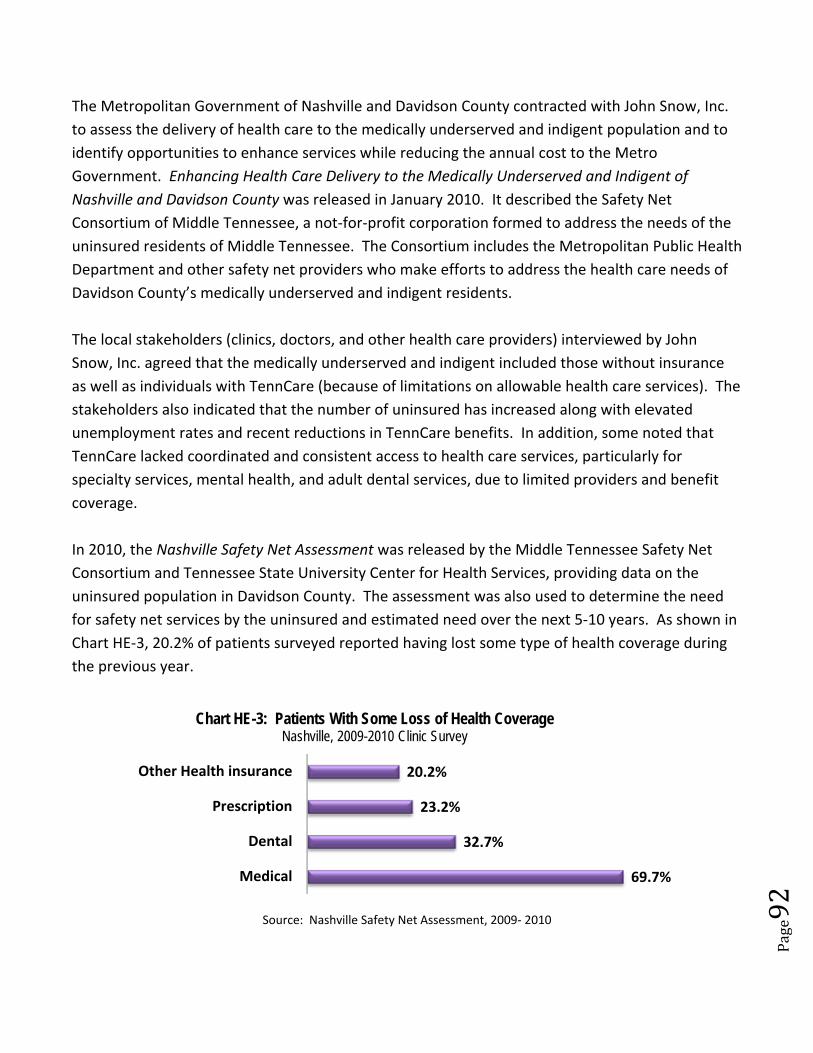
Page92
The Metropolitan Government of Nashville and Davidson County contracted with John Snow, Inc.
to assess the delivery of health care to the medically underserved and indigent population and to
identify opportunities to enhance services while reducing the annual cost to the Metro
Government. Enhancing Health Care Delivery to the Medically Underserved and Indigent of
Nashville and Davidson County was released in January 2010. It described the Safety Net
Consortium of Middle Tennessee, a not‐for‐profit corporation formed to address the needs of the
uninsured residents of Middle Tennessee. The Consortium includes the Metropolitan Public Health
Department and other safety net providers who make efforts to address the health care needs of
Davidson County’s medically underserved and indigent residents.
The local stakeholders (clinics, doctors, and other health care providers) interviewed by John
Snow, Inc. agreed that the medically underserved and indigent included those without insurance
as well as individuals with TennCare (because of limitations on allowable health care services). The
stakeholders also indicated that the number of uninsured has increased along with elevated
unemployment rates and recent reductions in TennCare benefits. In addition, some noted that
TennCare lacked coordinated and consistent access to health care services, particularly for
specialty services, mental health, and adult dental services, due to limited providers and benefit
coverage.
In 2010, the Nashville Safety Net Assessment was released by the Middle Tennessee Safety Net
Consortium and Tennessee State University Center for Health Services, providing data on the
uninsured population in Davidson County. The assessment was also used to determine the need
for safety net services by the uninsured and estimated need over the next 5‐10 years. As shown in
Chart HE‐3, 20.2% of patients surveyed reported having lost some type of health coverage during
the previous year.
Source: Nashville Safety Net Assessment, 2009‐ 2010
69.7%
32.7%
23.2%
20.2%
Medical
Dental
Prescription
Other Health insurance
Chart HE-3: Patients With Some Loss of Health Coverage Nashville, 2009-2010 Clinic Survey
Page93
The report noted that in 2002, the Safety Net Consortium established the Bridges to Care program
to link medically underserved and indigent Nashville and Davidson County residents to clinics for
health care. It further noted that:
Davidson County has 4 times as many doctors per capita as the
rest of the state.
Davidson County has 2.6 times as many dentists per capita as
the rest of the state.
Davidson County has 7.1 hospital beds (per 1,000 populations)
compared with 4.2 for the state as a whole.
Davidson County has gaps in health care services for the
medically underserved and indigent residents.
Grassroots Community Survey
Grassroots Community Surveys were conducted in 2009, 2010 and 2011. The 2011 included a
question asking respondents to identify the greatest need in the health category. Survey
respondents indicated the greatest need was basic health care for individuals who were uninsured
or had limited health care coverage (underinsured), followed by the need for specialty care
(dental, vision, etc.), preventive care and mental health or substance abuse care, as shown in Chart
HE‐4.
Source: MSS 2011 Grassroots Community Survey
10.5%
11.0%
24.5%
54.0%
Mental Health or Substance Abuse Care
Preventive Care
Specialty Care
Basic Health Care-Uninsured/Underinsured
Chart HE‐4: Greatest Need in HealthGrassroots Community Surveys 2011
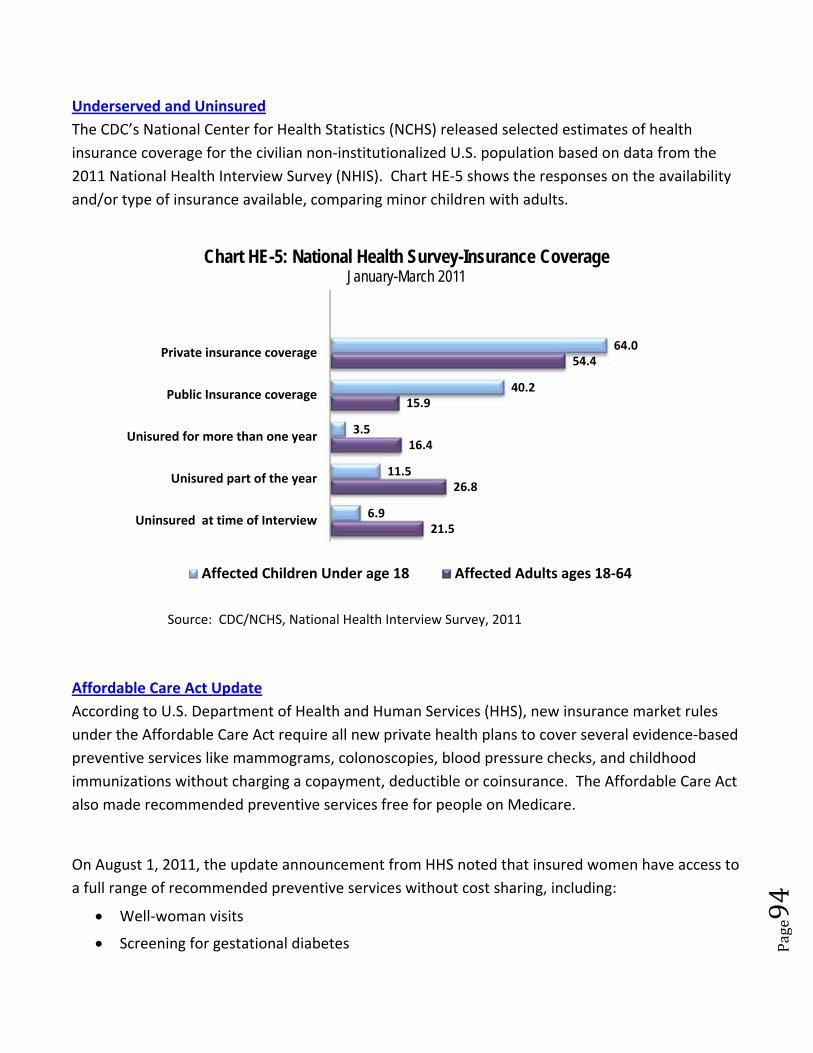
Page94
Underserved and Uninsured
The CDC’s National Center for Health Statistics (NCHS) released selected estimates of health
insurance coverage for the civilian non‐institutionalized U.S. population based on data from the
2011 National Health Interview Survey (NHIS). Chart HE‐5 shows the responses on the availability
and/or type of insurance available, comparing minor children with adults.
Source: CDC/NCHS, National Health Interview Survey, 2011
Affordable Care Act Update
According to U.S. Department of Health and Human Services (HHS), new insurance market rules
under the Affordable Care Act require all new private health plans to cover several evidence‐based
preventive services like mammograms, colonoscopies, blood pressure checks, and childhood
immunizations without charging a copayment, deductible or coinsurance. The Affordable Care Act
also made recommended preventive services free for people on Medicare.
On August 1, 2011, the update announcement from HHS noted that insured women have access to
a full range of recommended preventive services without cost sharing, including:
Well‐woman visits
Screening for gestational diabetes
21.5
26.8
16.4
15.9
54.4
6.9
11.5
3.5
40.2
64.0
Uninsured at time of Interview
Unisured part of the year
Unisured for more than one year
Public Insurance coverage
Private insurance coverage
Chart HE-5: National Health Survey-Insurance CoverageJanuary-March 2011
Affected Children Under age 18 Affected Adults ages 18‐64
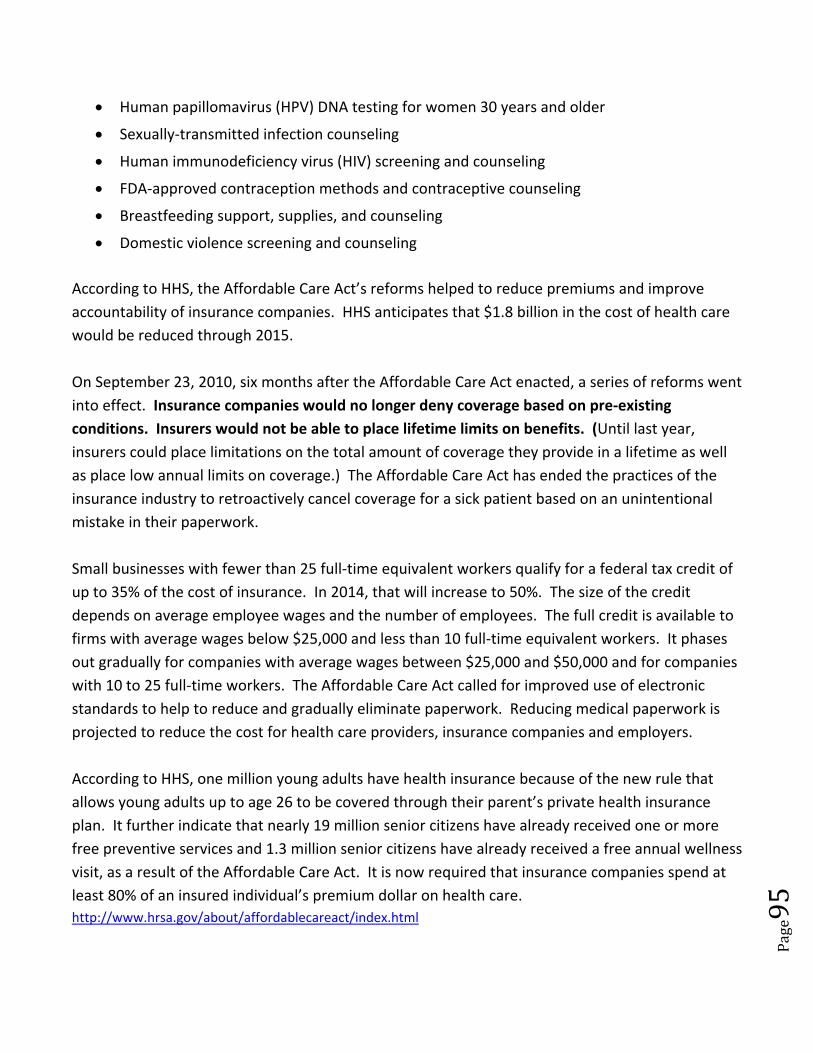
Page95
Human papillomavirus (HPV) DNA testing for women 30 years and older
Sexually‐transmitted infection counseling
Human immunodeficiency virus (HIV) screening and counseling
FDA‐approved contraception methods and contraceptive counseling
Breastfeeding support, supplies, and counseling
Domestic violence screening and counseling
According to HHS, the Affordable Care Act’s reforms helped to reduce premiums and improve
accountability of insurance companies. HHS anticipates that $1.8 billion in the cost of health care
would be reduced through 2015.
On September 23, 2010, six months after the Affordable Care Act enacted, a series of reforms went
into effect. Insurance companies would no longer deny coverage based on pre‐existing
conditions. Insurers would not be able to place lifetime limits on benefits. (Until last year,
insurers could place limitations on the total amount of coverage they provide in a lifetime as well
as place low annual limits on coverage.) The Affordable Care Act has ended the practices of the
insurance industry to retroactively cancel coverage for a sick patient based on an unintentional
mistake in their paperwork.
Small businesses with fewer than 25 full‐time equivalent workers qualify for a federal tax credit of
up to 35% of the cost of insurance. In 2014, that will increase to 50%. The size of the credit
depends on average employee wages and the number of employees. The full credit is available to
firms with average wages below $25,000 and less than 10 full‐time equivalent workers. It phases
out gradually for companies with average wages between $25,000 and $50,000 and for companies
with 10 to 25 full‐time workers. The Affordable Care Act called for improved use of electronic
standards to help to reduce and gradually eliminate paperwork. Reducing medical paperwork is
projected to reduce the cost for health care providers, insurance companies and employers.
According to HHS, one million young adults have health insurance because of the new rule that
allows young adults up to age 26 to be covered through their parent’s private health insurance
plan. It further indicate that nearly 19 million senior citizens have already received one or more
free preventive services and 1.3 million senior citizens have already received a free annual wellness
visit, as a result of the Affordable Care Act. It is now required that insurance companies spend at
least 80% of an insured individual’s premium dollar on health care.
http://www.hrsa.gov/about/affordablecareact/index.html
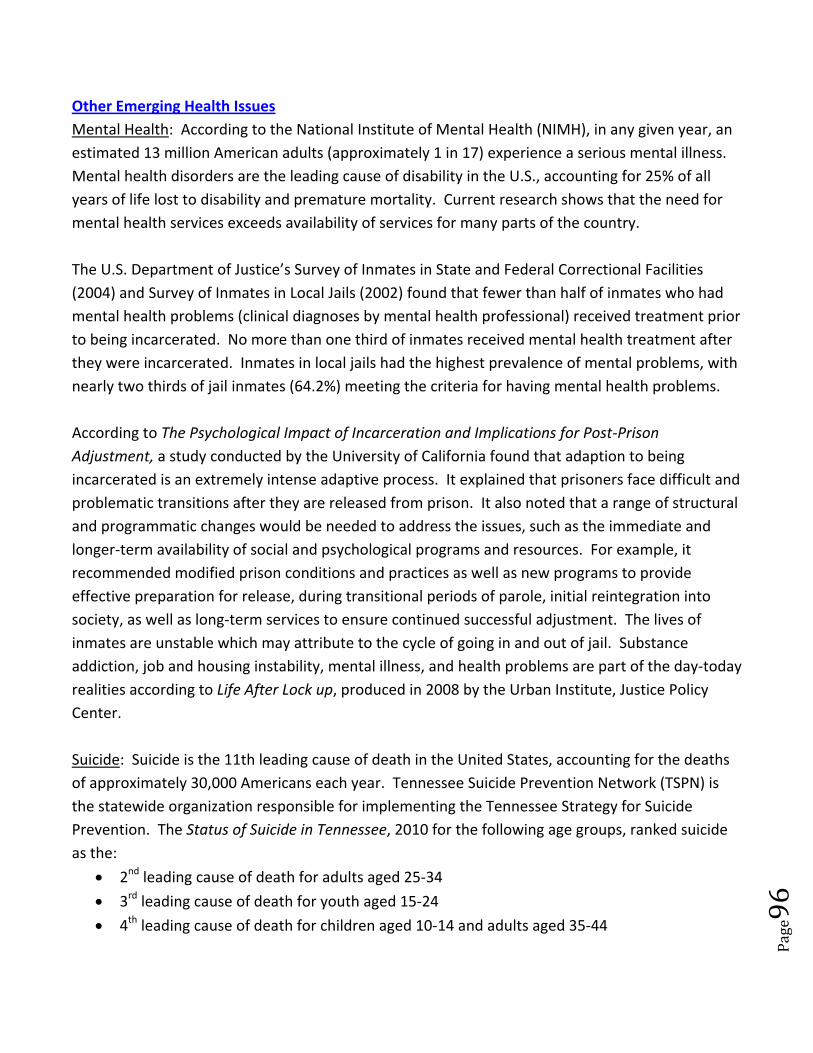
Page96
Other Emerging Health Issues
Mental Health: According to the National Institute of Mental Health (NIMH), in any given year, an
estimated 13 million American adults (approximately 1 in 17) experience a serious mental illness.
Mental health disorders are the leading cause of disability in the U.S., accounting for 25% of all
years of life lost to disability and premature mortality. Current research shows that the need for
mental health services exceeds availability of services for many parts of the country.
The U.S. Department of Justice’s Survey of Inmates in State and Federal Correctional Facilities
(2004) and Survey of Inmates in Local Jails (2002) found that fewer than half of inmates who had
mental health problems (clinical diagnoses by mental health professional) received treatment prior
to being incarcerated. No more than one third of inmates received mental health treatment after
they were incarcerated. Inmates in local jails had the highest prevalence of mental problems, with
nearly two thirds of jail inmates (64.2%) meeting the criteria for having mental health problems.
According to The Psychological Impact of Incarceration and Implications for Post‐Prison
Adjustment, a study conducted by the University of California found that adaption to being
incarcerated is an extremely intense adaptive process. It explained that prisoners face difficult and
problematic transitions after they are released from prison. It also noted that a range of structural
and programmatic changes would be needed to address the issues, such as the immediate and
longer‐term availability of social and psychological programs and resources. For example, it
recommended modified prison conditions and practices as well as new programs to provide
effective preparation for release, during transitional periods of parole, initial reintegration into
society, as well as long‐term services to ensure continued successful adjustment. The lives of
inmates are unstable which may attribute to the cycle of going in and out of jail. Substance
addiction, job and housing instability, mental illness, and health problems are part of the day‐today
realities according to Life After Lock up, produced in 2008 by the Urban Institute, Justice Policy
Center.
Suicide: Suicide is the 11th leading cause of death in the United States, accounting for the deaths
of approximately 30,000 Americans each year. Tennessee Suicide Prevention Network (TSPN) is
the statewide organization responsible for implementing the Tennessee Strategy for Suicide
Prevention. The Status of Suicide in Tennessee, 2010 for the following age groups, ranked suicide
as the:
2nd leading cause of death for adults aged 25‐34
3rd leading cause of death for youth aged 15‐24
4th leading cause of death for children aged 10‐14 and adults aged 35‐44
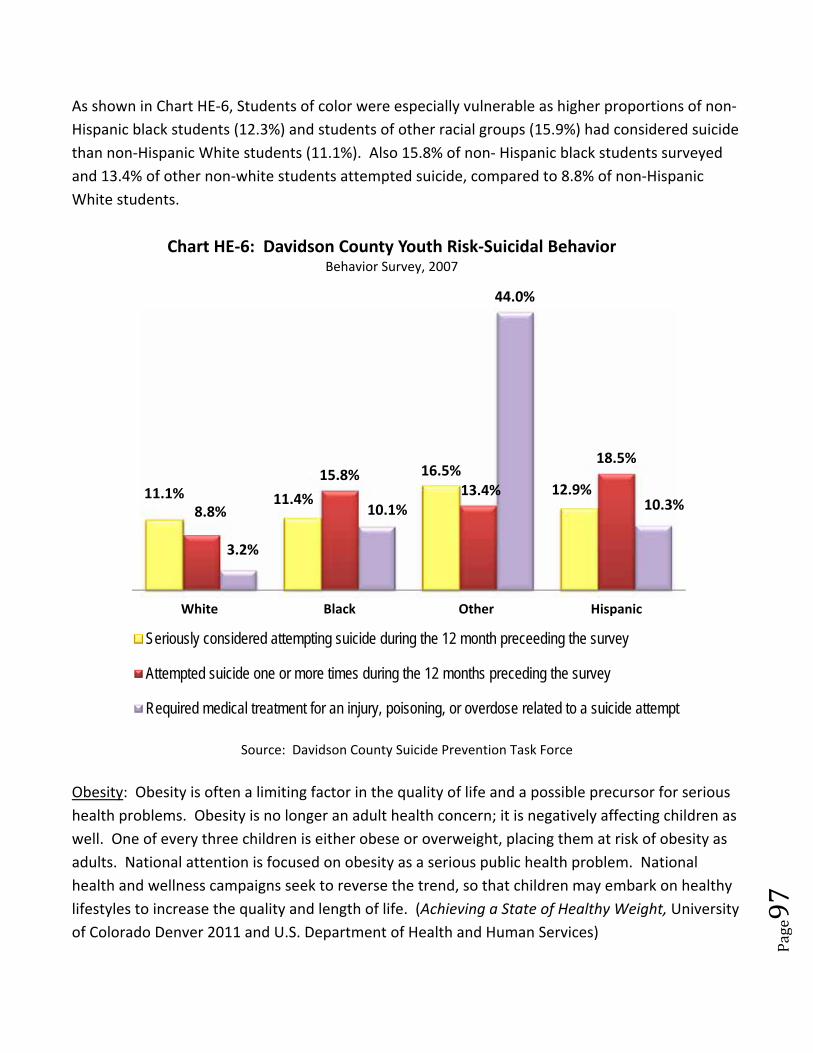
Page97
As shown in Chart HE‐6, Students of color were especially vulnerable as higher proportions of non‐
Hispanic black students (12.3%) and students of other racial groups (15.9%) had considered suicide
than non‐Hispanic White students (11.1%). Also 15.8% of non‐ Hispanic black students surveyed
and 13.4% of other non‐white students attempted suicide, compared to 8.8% of non‐Hispanic
White students.
Source: Davidson County Suicide Prevention Task Force
Obesity: Obesity is often a limiting factor in the quality of life and a possible precursor for serious
health problems. Obesity is no longer an adult health concern; it is negatively affecting children as
well. One of every three children is either obese or overweight, placing them at risk of obesity as
adults. National attention is focused on obesity as a serious public health problem. National
health and wellness campaigns seek to reverse the trend, so that children may embark on healthy
lifestyles to increase the quality and length of life. (Achieving a State of Healthy Weight, University
of Colorado Denver 2011 and U.S. Department of Health and Human Services)
11.1% 11.4%
16.5%12.9%
8.8%
15.8%13.4%
18.5%
3.2%
10.1%
44.0%
10.3%
White Black Other Hispanic
Chart HE‐6: Davidson County Youth Risk‐Suicidal BehaviorBehavior Survey, 2007
Seriously considered attempting suicide during the 12 month preceeding the survey
Attempted suicide one or more times during the 12 months preceding the survey
Required medical treatment for an injury, poisoning, or overdose related to a suicide attempt
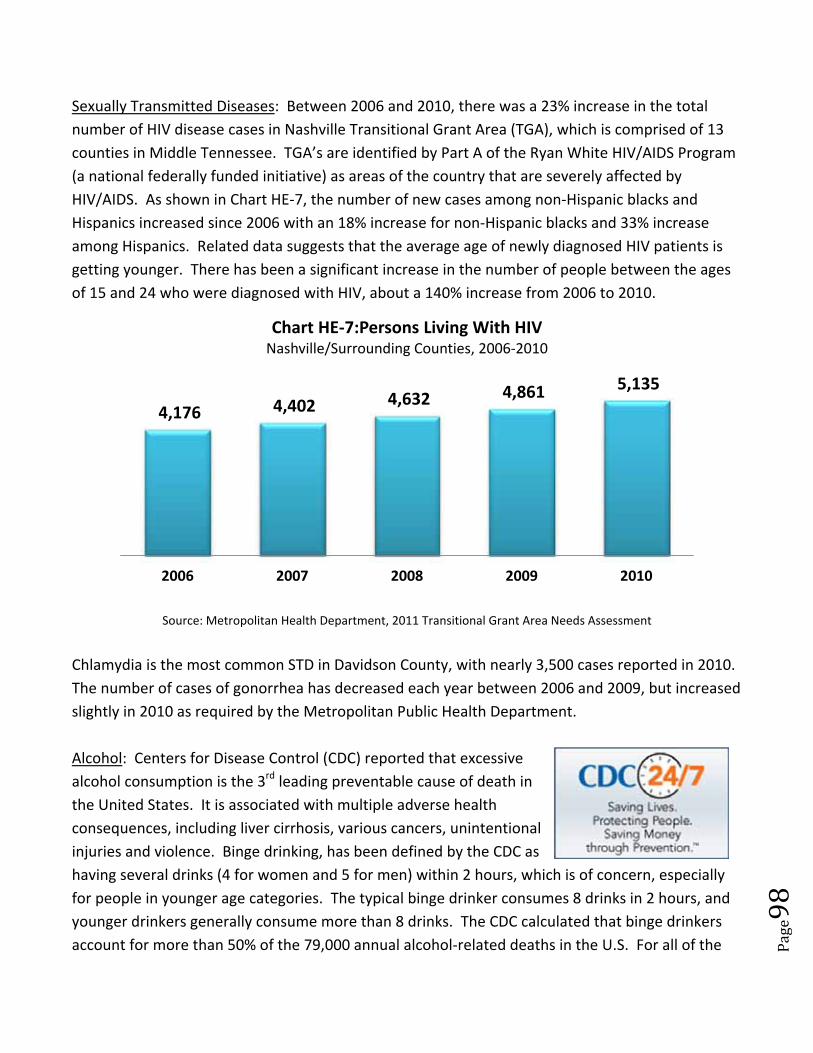
Page98
Sexually Transmitted Diseases: Between 2006 and 2010, there was a 23% increase in the total
number of HIV disease cases in Nashville Transitional Grant Area (TGA), which is comprised of 13
counties in Middle Tennessee. TGA’s are identified by Part A of the Ryan White HIV/AIDS Program
(a national federally funded initiative) as areas of the country that are severely affected by
HIV/AIDS. As shown in Chart HE‐7, the number of new cases among non‐Hispanic blacks and
Hispanics increased since 2006 with an 18% increase for non‐Hispanic blacks and 33% increase
among Hispanics. Related data suggests that the average age of newly diagnosed HIV patients is
getting younger. There has been a significant increase in the number of people between the ages
of 15 and 24 who were diagnosed with HIV, about a 140% increase from 2006 to 2010.
Source: Metropolitan Health Department, 2011 Transitional Grant Area Needs Assessment
Chlamydia is the most common STD in Davidson County, with nearly 3,500 cases reported in 2010.
The number of cases of gonorrhea has decreased each year between 2006 and 2009, but increased
slightly in 2010 as required by the Metropolitan Public Health Department.
Alcohol: Centers for Disease Control (CDC) reported that excessive
alcohol consumption is the 3rd leading preventable cause of death in
the United States. It is associated with multiple adverse health
consequences, including liver cirrhosis, various cancers, unintentional
injuries and violence. Binge drinking, has been defined by the CDC as
having several drinks (4 for women and 5 for men) within 2 hours, which is of concern, especially
for people in younger age categories. The typical binge drinker consumes 8 drinks in 2 hours, and
younger drinkers generally consume more than 8 drinks. The CDC calculated that binge drinkers
account for more than 50% of the 79,000 annual alcohol‐related deaths in the U.S. For all of the
4,176 4,402 4,632 4,861 5,135
2006 2007 2008 2009 2010
Chart HE‐7:Persons Living With HIV Nashville/Surrounding Counties, 2006‐2010
Page99
alcohol‐attributed deaths in the U.S., 6% (4,675 nationwide annually) are caused by people under
age 21. Binge drinking is a significant public health problem, with insufficient public awareness
about its severity.
Tobacco: More deaths are caused each year by tobacco use than by the combined
number of deaths from alcohol use, illegal drug use, motor vehicle injuries, human
immunodeficiency virus (HIV), suicides, and murders combined. Smoking cigarettes,
pipes, or cigars increases the risk of dying from cancers of the lung, esophagus, larynx,
and oral cavity. Smokeless tobacco is also a known cause of human cancer. In
addition, the nicotine in smokeless tobacco may increase the risk for sudden death from
ventricular arrhythmia, a condition where the heart does not beat properly. The Nashville Safety
Net Assessment reported that of those who smoked, smokers had higher rates of being uninsured
than those who were former smokers and those that have never smoked.
Prescribed and Over‐the‐Counter Medication: Despite recent reductions in teen use of illegal
drugs, particularly marijuana, the number of teenagers who misused or abused prescribed and
over‐the‐counter medications increased. According to the CDC, many teens obtain prescription
drugs, from their families, friends, or relatives. Methamphetamine is commonly known as meth, a
highly toxic drug made from over the counter medications and household chemicals. Local
manufacturing of meth is second only to cocaine trafficking in the state of Tennessee, according to
the Tennessee Alcohol and Drug Abuse Summary from the U.S. Department of Health and Human
Services.
Page100
BEST PRACTICES – Examples for Health
Providing Health Care for the Poor Through a Leading Entity
Description
Most successful health care safety net models are led by a governance board or by the leading
entity responsible for development and implementation of a coordinated strategy to address the
medically underserved and indigent population needs, across a broad spectrum of health care
services. Effective leading entity organizations are identified as committed to the process and
visionary in its goals for the health of the medically underserved and indigent community as a
whole.
Leading entities have typically been independent non‐profit organizations, rather than government
agencies. However, the leading entities are accountable to the community at large through board
composition that included community members (health care leaders, business community, etc.),
reports to the community and public officials. The leading entity addresses the entire safety net
system and establishes accountability standards and principles for contracted providers.
Rationale
This approach provides governance and accountability for a safety net system and serves as a
payer to the health care safety net providers responsible for rendering health services. It
coordinates services, ensures quality care and saves money.
Potential Challenges for Davidson County
There various safety net providers in Davidson County and a designated lead entity is
needed to develop and maintain a coordinated, cohesive, and consistently well‐funded
safety net system.
The health care safety net provider organizations in Nashville Davidson County are capable
and dedicated, but there is no integrated planning and resource allocation process.
Steps to Operation in Davidson County
A health care safety net system’s lead entity would need fiduciary responsibility for the
entire safety net system in the county.
Page101
The system’s lead entity should be governed by a group of advisors/board members,
consisting of health care leaders and the community’s most prominent and influential
business people.
The system’s lead entity would need a dedicated public funding stream as part of their
revenue.
The system’s lead entity will need to ensure that there are significant investments in
information system technology to support their coordinated efforts of governance.
The system’s lead entity should have strong community‐based support.
http://www.rwjf.org/coverage/product.jsp?id=49869
BEST PRACTICES – Examples for Health
Cost Effective Health Care Coverage for the Uninsured Through Primary Care, Health Education and Peer Review
Description
In Grand Junction, Colorado, health care costs have been among the lowest in the nation for thirty
years. In the early 1970s, a group of primary care physicians and specialists founded the physician‐
run Rocky Mountain Health Plans and the Mesa County Physicians Independent Practice
Association. These organizations foster a culture of incentives for cost control, transparency and
accountability for the health of the community. The organizations emphasize primary care, health
education, and physician peer reviews. Advocates believe the practice has fostered health and
managed diseases, resulting in savings on high medical costs. Using such practices decreased
premature births, decreased hospitalizations and provided effective management for chronic
illnesses. Oversight is through peer reviews by Rocky Mountain and MCPIPA when doctors order
an unusual numbers of tests or very expensive tests or procedures and providing oversight.
Grand Junction provides health care to the uninsured through their hospital‐affiliated clinic
(Marillac). The Marillac clinic receives more than $1 million of its $7.5 million annual budget from
their affiliate hospital, St. Mary's Regional Hospital. The hospital is located next to the clinic that
treats patients for non‐emergency care, which decreases the cost for more expensive emergency
treatment for non‐emergency care in its Emergency Room. Patients (including uninsured) may
receive primary care and emergency care at the clinic and the hospital. The convenience of having
Page102
one location for primary care, non‐emergency care and immediate access to emergency care
provide a continuum of care that attracts insured and private pay patients to the clinic and
hospital.
Rationale
The focus on primary and preventive care (rather than on hospitals or specialty care)
resulted in decreased health care costs and increased the coverage of the uninsured in
Grand Junction.
Costs, outcomes and effectiveness of treatments are tracked by Rocky Mountain Health
Plans and MCPIPA, which promotes evidence‐based practices and protocols.
Physicians receive lower payments at the front end, but can earn bonus payments based on
the overall performance of the system (also called bundling).
When President Obama was promoting what became the Patient Protection and Affordable
Care Act (PPACA), he visited Grand Junction in 2009 in recognition of their highly effective
system.
Potential Challenges for Davidson County
In 2010, the population of Grand Junction was 146,723, according to the U. S. Census
Bureau, so it is smaller than Davidson County.
Some critics say the little competition among hospitals and specialists is a major factor that
has contributed to keeping down health cost.
This best practice was implemented in Grand Junction thirty years ago before the onset of
managed care.
Steps to Operation in Davidson County
It would be necessary for the government and providers to agree on a common vision of
appropriate and accountable low‐cost care for all.

Page103
A required element would be a significant level of cooperation among providers and
insurers.
This practice would need to focus specifically on primary care and health education
(including prevention), rather than hospitals and specialty care. [Although this model does
not suggest that hospitals and specialty care are unimportant, this model does not include
them.]
A system would be needed to provide peer reviews for quality and utilization regularly and
as needed.
http://marillacclinic.org/
Page104
Persons over 60 years of age are the fastest growing segment of the U.S. Population
than other age categories. The 60‐64 age group increased by about 55% during the
past ten years.
There is an increasing need for Home and Community Based Services for Adults with
disabilities and seniors. As the population ages, the number of people who need
services will increase.
Most frail elderly or disabled adults prefer to remain in their home rather than going
to an institution, but many of them need assistance to continue living in their own
homes.
Additional challenges in transportation may arise for people who get older. For
example, some older people have less access to a vehicle or may have diminished
driving skills.
Home and Community Based Services are generally more affordable than skilled
Nursing Home Care. TennCare reimbursement rates for homemaker, personal care
and home delivered meals are the same as they were in 2008, while skilled Nursing
home care has risen from $52,000 in 2009 to over $58,000 in 2011.
The Baby Boom Generation (persons born between 1946 and
1964) are the fastest growing segment of the United States
population. The first wave of Baby Boomers turned 65 in 2011.
With the aging of the U.S. population, the need for affordable,
quality healthcare options will also increase.
According to the U. S. Census Bureau’s 2010 American Community Survey, there are 859,922
persons age 65 and over living in Tennessee, 13.5% of the total population. Davidson County’s
population includes 66,420 persons over age 65 (10.6%) with 30,570 over age 75.
Home and Community Based Services (HCBS) are designed to assist adults with disabilities and frail
seniors to remain in the familiar surroundings of their homes as long as possible, rather than enter
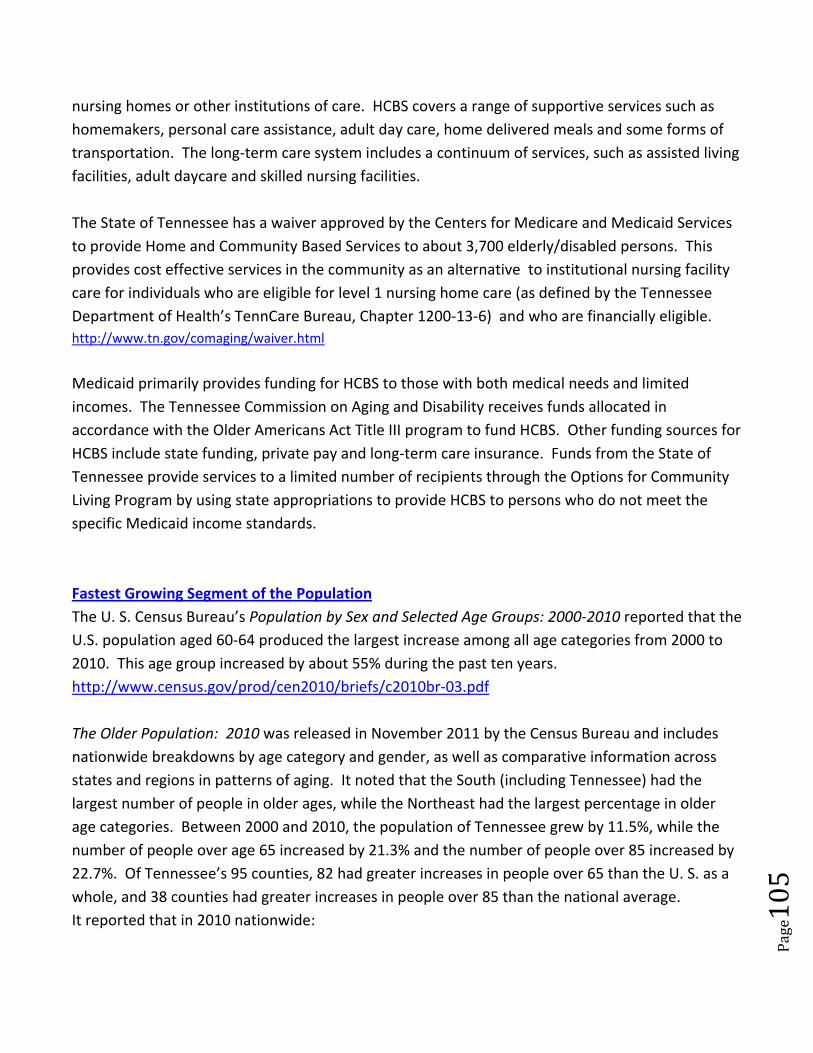
Page105
nursing homes or other institutions of care. HCBS covers a range of supportive services such as
homemakers, personal care assistance, adult day care, home delivered meals and some forms of
transportation. The long‐term care system includes a continuum of services, such as assisted living
facilities, adult daycare and skilled nursing facilities.
The State of Tennessee has a waiver approved by the Centers for Medicare and Medicaid Services
to provide Home and Community Based Services to about 3,700 elderly/disabled persons. This
provides cost effective services in the community as an alternative to institutional nursing facility
care for individuals who are eligible for level 1 nursing home care (as defined by the Tennessee
Department of Health’s TennCare Bureau, Chapter 1200‐13‐6) and who are financially eligible.
http://www.tn.gov/comaging/waiver.html
Medicaid primarily provides funding for HCBS to those with both medical needs and limited
incomes. The Tennessee Commission on Aging and Disability receives funds allocated in
accordance with the Older Americans Act Title III program to fund HCBS. Other funding sources for
HCBS include state funding, private pay and long‐term care insurance. Funds from the State of
Tennessee provide services to a limited number of recipients through the Options for Community
Living Program by using state appropriations to provide HCBS to persons who do not meet the
specific Medicaid income standards.
Fastest Growing Segment of the Population
The U. S. Census Bureau’s Population by Sex and Selected Age Groups: 2000‐2010 reported that the
U.S. population aged 60‐64 produced the largest increase among all age categories from 2000 to
2010. This age group increased by about 55% during the past ten years.
http://www.census.gov/prod/cen2010/briefs/c2010br‐03.pdf
The Older Population: 2010 was released in November 2011 by the Census Bureau and includes
nationwide breakdowns by age category and gender, as well as comparative information across
states and regions in patterns of aging. It noted that the South (including Tennessee) had the
largest number of people in older ages, while the Northeast had the largest percentage in older
age categories. Between 2000 and 2010, the population of Tennessee grew by 11.5%, while the
number of people over age 65 increased by 21.3% and the number of people over 85 increased by
22.7%. Of Tennessee’s 95 counties, 82 had greater increases in people over 65 than the U. S. as a
whole, and 38 counties had greater increases in people over 85 than the national average.
It reported that in 2010 nationwide:
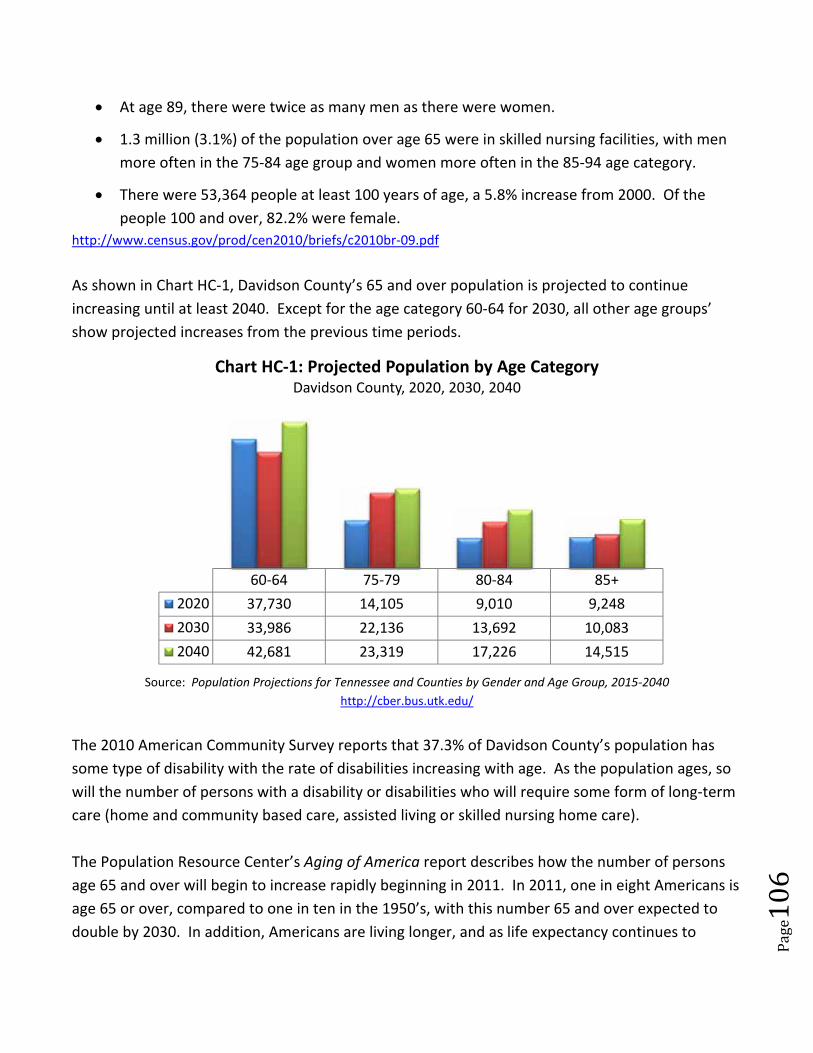
Page106
At age 89, there were twice as many men as there were women.
1.3 million (3.1%) of the population over age 65 were in skilled nursing facilities, with men
more often in the 75‐84 age group and women more often in the 85‐94 age category.
There were 53,364 people at least 100 years of age, a 5.8% increase from 2000. Of the
people 100 and over, 82.2% were female.
http://www.census.gov/prod/cen2010/briefs/c2010br‐09.pdf
As shown in Chart HC‐1, Davidson County’s 65 and over population is projected to continue
increasing until at least 2040. Except for the age category 60‐64 for 2030, all other age groups’
show projected increases from the previous time periods.
Source: Population Projections for Tennessee and Counties by Gender and Age Group, 2015‐2040
http://cber.bus.utk.edu/
The 2010 American Community Survey reports that 37.3% of Davidson County’s population has
some type of disability with the rate of disabilities increasing with age. As the population ages, so
will the number of persons with a disability or disabilities who will require some form of long‐term
care (home and community based care, assisted living or skilled nursing home care).
The Population Resource Center’s Aging of America report describes how the number of persons
age 65 and over will begin to increase rapidly beginning in 2011. In 2011, one in eight Americans is
age 65 or over, compared to one in ten in the 1950’s, with this number 65 and over expected to
double by 2030. In addition, Americans are living longer, and as life expectancy continues to
60‐64 75‐79 80‐84 85+
2020 37,730 14,105 9,010 9,248
2030 33,986 22,136 13,692 10,083
2040 42,681 23,319 17,226 14,515
Chart HC‐1: Projected Population by Age CategoryDavidson County, 2020, 2030, 2040

Page107
increase, the period of time during which elderly and disabled persons will need home and
community based services will probably lengthen, while the number needing the services will also
increase. http://www.prcdc.org/300million/The_Aging_of_America/
The map below shows the percentage of people age 62 in over by Metropolitan Council District,
according to data from the 2006‐2010 American Community Survey.
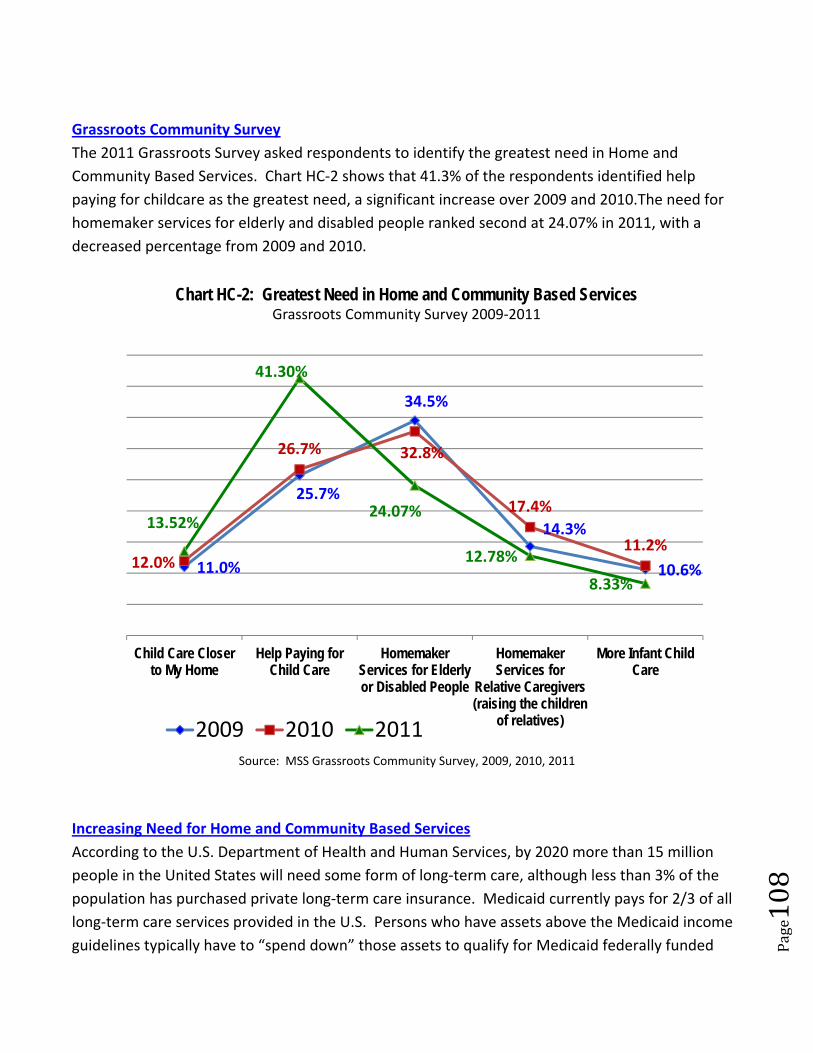
Page108
Grassroots Community Survey
The 2011 Grassroots Survey asked respondents to identify the greatest need in Home and
Community Based Services. Chart HC‐2 shows that 41.3% of the respondents identified help
paying for childcare as the greatest need, a significant increase over 2009 and 2010.The need for
homemaker services for elderly and disabled people ranked second at 24.07% in 2011, with a
decreased percentage from 2009 and 2010.
Source: MSS Grassroots Community Survey, 2009, 2010, 2011
Increasing Need for Home and Community Based Services
According to the U.S. Department of Health and Human Services, by 2020 more than 15 million
people in the United States will need some form of long‐term care, although less than 3% of the
population has purchased private long‐term care insurance. Medicaid currently pays for 2/3 of all
long‐term care services provided in the U.S. Persons who have assets above the Medicaid income
guidelines typically have to “spend down” those assets to qualify for Medicaid federally funded
11.0%
25.7%
34.5%
14.3%
10.6%12.0%
26.7% 32.8%
17.4%
11.2%
13.52%
41.30%
24.07%
12.78%
8.33%
Child Care Closerto My Home
Help Paying forChild Care
HomemakerServices for Elderlyor Disabled People
HomemakerServices for
Relative Caregivers(raising the children
of relatives)
More Infant ChildCare
Chart HC-2: Greatest Need in Home and Community Based ServicesGrassroots Community Survey 2009‐2011
2009 2010 2011
Page109
long‐term care services. Individuals who have spent years building their assets face the choice of
either depleting those assets or paying out of pocket for expensive long‐term care services.
According to data from American Families USA, 70% of persons reaching age 65 will need financial
assistance with long‐term care at some point as they increase in age. Long Term‐care services
include both institutional care (nursing home or assisted living facilities) and home and community
based services (personal care, homemaker and home delivered meals). As Americans increase in
age, so will the cost of healthcare services. Medicare and Medicaid expenditures are expected to
increase significantly over the next 5–10 years.
For persons affected by age‐related frailty or by a disability, home and community based services
offer an affordable and more desirable long‐term care alternative to nursing home placement. As
the numbers of baby boomers increase, the need for Medicaid funded long‐term care increases
proportionately. http://www.familiesusa.org
Poverty, Aging and Disability
As shown in Chart HC‐3, Davidson County residents with one or more disabilities are most likely to
be in poverty. This group has a very low employment rate and most rely on public benefits for
income, such as Supplemental Security Income, Social Security Disability Income and TennCare for
health services.
The Social Security Administration is responsible for Medicare enrollment. Medicare is for any U.S.
citizen age 65 and over as well as persons 65 and younger who have certain disabilities and
illnesses. Full eligibility and enrollment information is available at the Medicare web site:
http://www.cms.gov/
It is projected that more than 15 million Americans will need long‐term care.
Less than 3% of the population has purchased private long‐term care insurance.
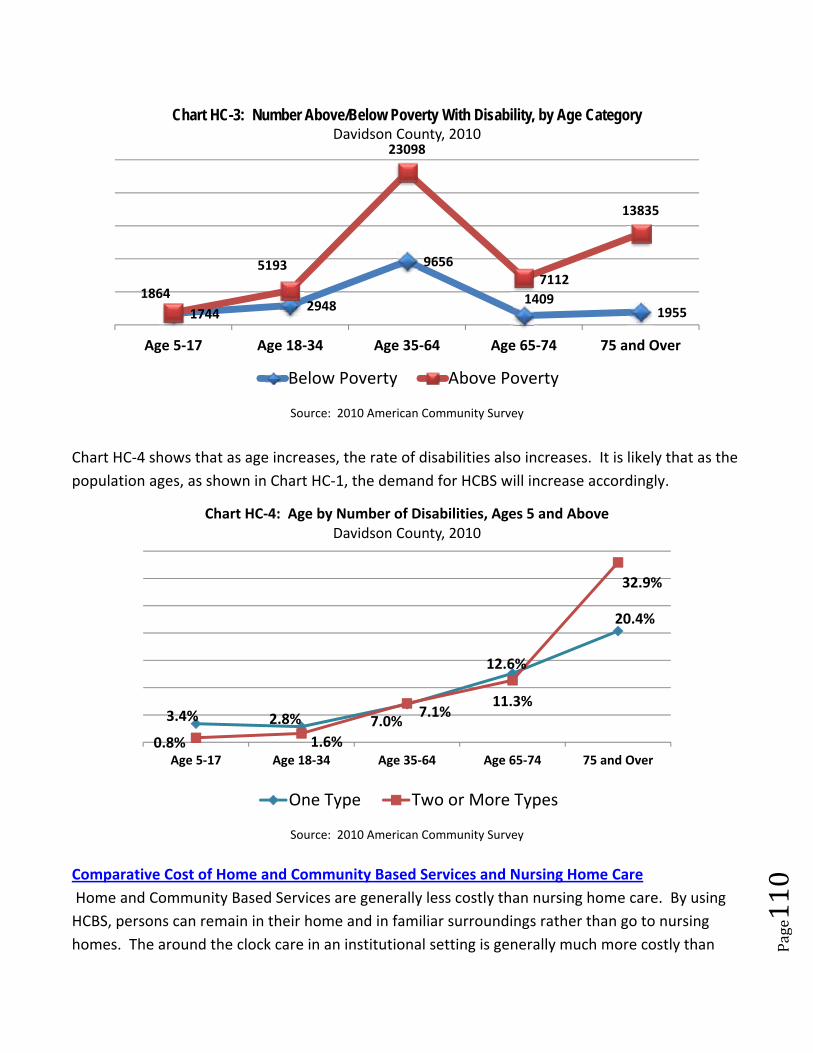
Page110
Source: 2010 American Community Survey
Chart HC‐4 shows that as age increases, the rate of disabilities also increases. It is likely that as the
population ages, as shown in Chart HC‐1, the demand for HCBS will increase accordingly.
Source: 2010 American Community Survey
Comparative Cost of Home and Community Based Services and Nursing Home Care
Home and Community Based Services are generally less costly than nursing home care. By using
HCBS, persons can remain in their home and in familiar surroundings rather than go to nursing
homes. The around the clock care in an institutional setting is generally much more costly than
17442948
9656
14091955
1864
5193
23098
7112
13835
Age 5‐17 Age 18‐34 Age 35‐64 Age 65‐74 75 and Over
Chart HC-3: Number Above/Below Poverty With Disability, by Age CategoryDavidson County, 2010
Below Poverty Above Poverty
3.4% 2.8% 7.0%
12.6%
20.4%
0.8% 1.6%
7.1%11.3%
32.9%
Age 5‐17 Age 18‐34 Age 35‐64 Age 65‐74 75 and Over
Chart HC‐4: Age by Number of Disabilities, Ages 5 and AboveDavidson County, 2010
One Type Two or More Types
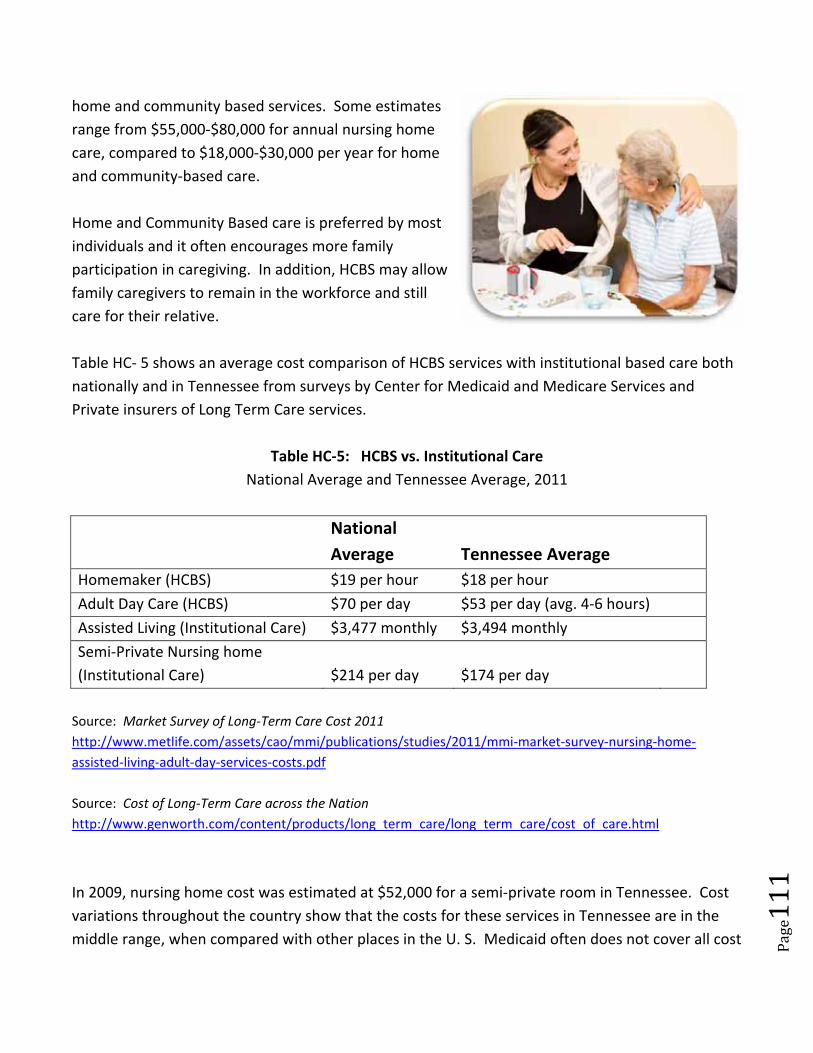
Page111
home and community based services. Some estimates
range from $55,000‐$80,000 for annual nursing home
care, compared to $18,000‐$30,000 per year for home
and community‐based care.
Home and Community Based care is preferred by most
individuals and it often encourages more family
participation in caregiving. In addition, HCBS may allow
family caregivers to remain in the workforce and still
care for their relative.
Table HC‐ 5 shows an average cost comparison of HCBS services with institutional based care both
nationally and in Tennessee from surveys by Center for Medicaid and Medicare Services and
Private insurers of Long Term Care services.
Table HC‐5: HCBS vs. Institutional Care
National Average and Tennessee Average, 2011
National
Average Tennessee Average
Homemaker (HCBS) $19 per hour $18 per hour
Adult Day Care (HCBS) $70 per day $53 per day (avg. 4‐6 hours)
Assisted Living (Institutional Care) $3,477 monthly $3,494 monthly
Semi‐Private Nursing home
(Institutional Care) $214 per day $174 per day
Source: Market Survey of Long‐Term Care Cost 2011
http://www.metlife.com/assets/cao/mmi/publications/studies/2011/mmi‐market‐survey‐nursing‐home‐
assisted‐living‐adult‐day‐services‐costs.pdf
Source: Cost of Long‐Term Care across the Nation
http://www.genworth.com/content/products/long_term_care/long_term_care/cost_of_care.html
In 2009, nursing home cost was estimated at $52,000 for a semi‐private room in Tennessee. Cost
variations throughout the country show that the costs for these services in Tennessee are in the
middle range, when compared with other places in the U. S. Medicaid often does not cover all cost
Page112
associated with a nursing home stay, depending upon the level of medical services provided. As a
result, there are out‐of‐pocket expenses for nursing home residents, which may be covered by an
individual’s Social Security Income or Social Security Disability Income.
Home and Community Based Care Programs
Tennessee consumers have primarily two ways to receive Home and Community Based Care.
Options for Community Living Program and TennCare Choices program are available to low‐income
elderly and disabled persons who prefer to remain in their homes and communities.
OPTIONS FOR COMMUNITY LIVING PROGRAM: The Older Americans Act and State appropriations provides
funding for the Options for Community Living Program (Options). The Option program differs from
regular Medicaid services in that there is no spend down requirement, the state establishes the
type and frequency of services an enrollee receives and how much is allocated to the program.
The Options program targets low‐income seniors and minorities. Options program services
(homemaker, personal care and home delivered meals) are designed to enable seniors and adults
with disabilities to remain in their home and communities and avoid unnecessary
institutionalization. Options funds are for persons age 60+ and/or persons age 18 and over who
have a qualifying disability. A waiting list for enrollment is typical for Options.
According to the Greater Nashville Regional Council Area Agency on Aging and Disability as of
September 2010, there was a waiting list of approximately 1,300 applicants for the Options
Program services. By October of 2011, there was little change in the number of persons on the
waiting list with 1,312 applicants, and a typical wait is 12‐14 months. Greater Nashville Regional
Council conducts the initial assessment, determines the level of service to be provided for each
enrollee, and then authorizes the designated service provider to deliver the approved services. In
addition, Greater Nashville Regional Council maintains a waiting list for consumers when funding is
unavailable.
TENNCARE CHOICES ACT: In 2008, Tennessee enacted the TennCare Long‐Term Care Community
Choices Act (commonly known as Choices). TennCare Choices in Long‐Term Care allows the state
to use existing dollars to offer more options to those in need of long‐term care. Choices was
designed to rebalance Medicaid Funding to support more home and community based services
choices, as well as to increase the number of persons who could successfully transition from a
nursing home facility to an appropriate home and community based setting. TennCare’s FY 2012
Recommended Budget Presentation reported that before statewide long‐term care enrollment,
82% of funding was used for nursing home care with 17.5% on long‐term (home and community
Page113
based) care (March 1, 2010). By April 1, 2011, the long‐term care enrollment had increased to
25.7%, and the nursing home care had decreased to 74.3%.
Choices offers a single point of entry for persons seeking long‐term care services compared to the
previous system that was fragmented and difficult to navigate. Choices also offered persons who
had expressed a desire to live in their community and receive some of their care from families and
friends an alternative to institutional care. Participants may receive services up to a cost that
would be equivalent to the cost of institutional care. The costs for Choices services are
significantly lower than assisted living facilities and skilled care nursing homes. Choices enrollment
continues to increase in Tennessee along with the number of providers from which consumers
have to choose.
http://www.tn.gov/tenncare/forms/tenncarebudgetFY12.pdf
Transportation Options
As the baby boom generation ages, access to affordable and reliable transportation will continue
to increase. Seniors prefer to remain in their own homes and communities, so affordable and
easily accessible transportation alternatives are needed. Increased age and deteriorating
medical/physical conditions may prevent people from driving. Additional transportation
alternatives are needed for those who can no longer drive and others who may not have access to
a vehicle.
Because some skills and abilities associated with driving tend to diminish with age, viable alternate
forms of transportation for the elderly will continue to be an important issue if future years. There
are three general types of public transportation alternatives for the frail elderly or disabled adults:
1) Door‐to‐door services are provided through Metropolitan Transit Authority (MTA) Access
Ride program. Door–to‐door or demand response trips require advance reservations for
transportation for seniors and persons with disabilities to a designated location with a
scheduled return trip.
2) A fixed route system or scheduled services transport elderly persons
between designated stops along a route that is typically used by
persons other than seniors. An increasing number of fixed route
buses are wheelchair accessible.
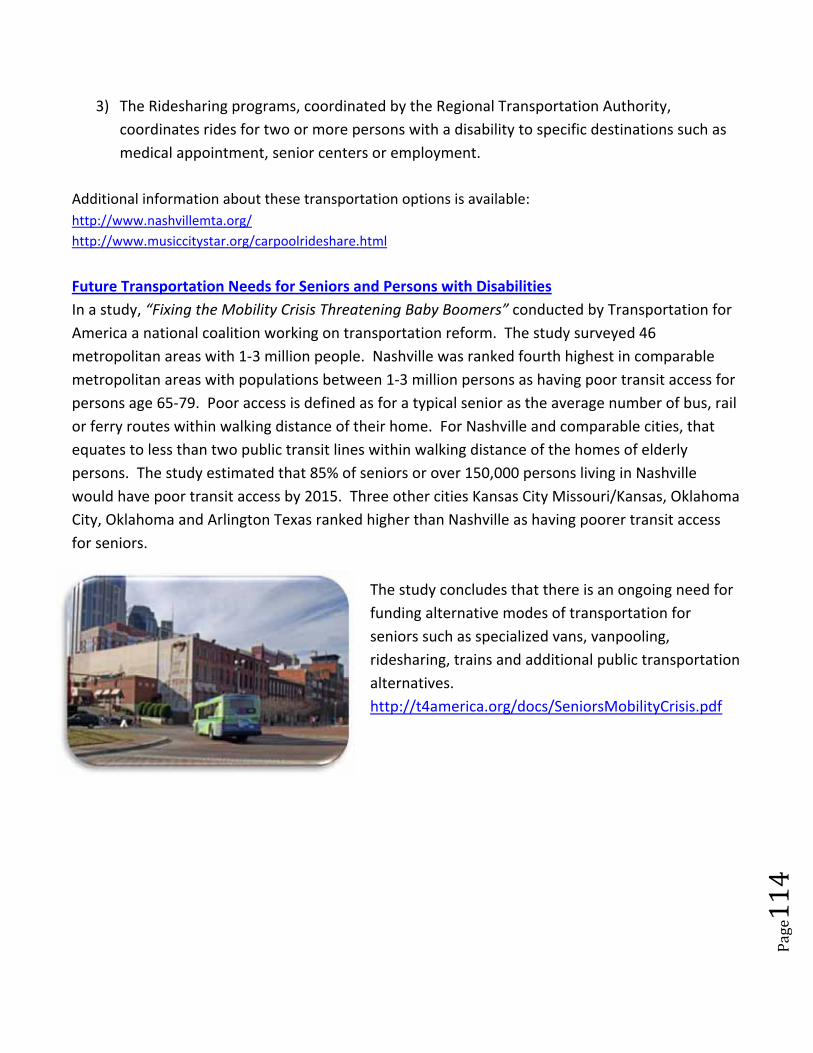
Page114
3) The Ridesharing programs, coordinated by the Regional Transportation Authority,
coordinates rides for two or more persons with a disability to specific destinations such as
medical appointment, senior centers or employment.
Additional information about these transportation options is available:
http://www.nashvillemta.org/
http://www.musiccitystar.org/carpoolrideshare.html
Future Transportation Needs for Seniors and Persons with Disabilities
In a study, “Fixing the Mobility Crisis Threatening Baby Boomers” conducted by Transportation for
America a national coalition working on transportation reform. The study surveyed 46
metropolitan areas with 1‐3 million people. Nashville was ranked fourth highest in comparable
metropolitan areas with populations between 1‐3 million persons as having poor transit access for
persons age 65‐79. Poor access is defined as for a typical senior as the average number of bus, rail
or ferry routes within walking distance of their home. For Nashville and comparable cities, that
equates to less than two public transit lines within walking distance of the homes of elderly
persons. The study estimated that 85% of seniors or over 150,000 persons living in Nashville
would have poor transit access by 2015. Three other cities Kansas City Missouri/Kansas, Oklahoma
City, Oklahoma and Arlington Texas ranked higher than Nashville as having poorer transit access
for seniors.
The study concludes that there is an ongoing need for
funding alternative modes of transportation for
seniors such as specialized vans, vanpooling,
ridesharing, trains and additional public transportation
alternatives.
http://t4america.org/docs/SeniorsMobilityCrisis.pdf
Page115
BEST PRACTICES – Example for Home and Community Based Services‐Adults and Seniors
Money Follows the Person
Introduction
Home and Community Based Services (HCBS) are designed to assist adults with disabilities and frail
seniors to remain their homes and communities as long as possible, rather than enter nursing
homes. HCBS include a variety of supportive services delivered in community settings or in the
homes of those who receive services, such as homemaker, personal care, caregiver respite, adult
daycare, case management, transportation to medical appointments and home delivered meals.
People who have greater assets or income may be able to pay for the services they receive, while
others have long‐term care insurance that pays for these services. For people who need
subsidized HCBS, most funding is federal, with less provided by the state. There are some
examples of limited funding being provided by local governments or private philanthropic sources.
Best practices in Home and Community Based Services have focused on rebalancing Medicaid
dollars between nursing home (institutional) care and home based services for the growing
population of seniors. As people age, they are more likely to need either Home and Community
Based Services or nursing home care (often funded by Medicaid for people who cannot afford to
pay). With the aging of the baby boom population, there is a growing need to find creative ways to
best utilize the limited Medicaid dollars. Over the past several years, Congress has funded
innovative strategies. One of the effective practices developed is the Money Follows the Person
model to strengthen community living.
Description
Money Follows the Person (MFP) programs are designed to allow states to develop strategies for
eligible nursing home residents as they transition from institutional care to home based care.
Persons leaving institutional care would have more options in determining the types and frequency
of medical care they receive under Medicaid. Funds that would have gone to the nursing home
could then be used to fund HCBS as directed by the individual. Tennessee was one of 13 additional
states to receive funding for this model (29 states had already been using the model. The target
populations for MFP funding include persons at least 60 years of age who live in nursing homes,
persons under age 60 who are physically disabled and persons who have intellectual disabilities
and or mental retardation. The MFP model increases the use of Home and Community Based
services while reducing the use of more expensive nursing home care.
Page116
Rationale
Under Money Follows the Person model, states would have more flexibility in coordinating care for
persons leaving institutional care, assuring that appropriate supportive services are available while
they monitor cost‐effectiveness of Medicaid funds. This model allows individuals to have greater
flexibility in determining their long‐term care options and services. In addition, MFP could allow
states to serve more persons without incurring additional cost. Elderly persons and persons with
disabilities who express a desire to live in the community with appropriate support services can do
so with significant cost savings compared to costly institutional care.
Potential Challenges for Tennessee
According to Money Follows the Person 2010 Evaluation Report reports by the Center for Medicare
and Medicaid Services, some of the states that received initial MFP funding did not have the
infrastructure to effectively administer the program. Infrastructure needs include timely payment
processing, cooperation with medical providers and protections against fraud and waste. The
report also indicated that states needed to have in place effective monitoring procedures, quality
assurance controls, financial accountability, consumer satisfaction procedures and consumer
education programs for the MFP model to be successful.
Tennessee’s challenges in implementing MFP includes, coordinating MFP services TennCare
Choices services, developing program oversight procedures and insuring fiscal accountability.
Collaborations among nursing homes and home and community based service providers are
important in assuring program success in Tennessee.
http://www.mathematica‐mpr.com/publications/pdfs/health/MFP_2010_annual.pdf
Steps to Operation in Tennessee
Tennessee received its initial funding for MFP in 2010 from the Center for Medicare and Medicaid
Services. The purpose of the funding was to expand HCBS to persons transitioning from nursing
home care back into the community. MFP goal of transitioning consumers from nursing home care
to home and community‐based care is consistent with Tennessee’s TennCare Choices program that
was implemented in 2010. MFP has the potential to increase the number of frail elderly and
disabled adults successfully transition back into the community with the appropriate support
services.
Although this description is about the transition from nursing home care to HCBS, this model of
using the appropriate combination of coordinated services could be used to decrease costs for
other types of services and at other levels of government.
Page117
There is nothing more important than a good, safe, secure home.
Rosalynn Carter
During the period 2006‐2010, new construction decreased, reflected in the significant
drop in the number of building permits issued.
Between 2006 and 2010, homeowner vacancy rates increased and renter vacancy rates
declined.
Half of homeowners in Davidson County and 54% of renters were housing cost‐burdened
in 2010, paying more than 30% of their household income for housing and related costs.
From 2008 to 2010, the percentage of U. S. multi‐generational households rose from 5.3%
to 6.1% of all households, a faster rate of growth than the previous eight years combined.
The number of foreclosure filings dropped from 2009 to
2010, for the first time since 2007.
The 2011 MSS grassroots survey data shows that many
people continue to need help with housing‐related
expenses such as rent payments. More 2010 survey
respondents identified the need for Section 8 vouchers
than in previous years (the unmet need would be
intensified by proposed federal housing budget cuts).
Page118
Housing Occupancy, Units and Construction
The Census Bureau defines housing unit as a house, apartment, mobile home, group of rooms or
single room that is occupied or intended for occupancy as separate living quarters Table H‐1 shows
changes in housing unit occupancy in Davidson County from 2007‐2010. The number of housing
units rose from 2007 to 2009 and in 2010, fell to approximately the 2008 level. In 2010, owners
accounted for 55.9% of the occupied units, and 44.1% were renter‐occupied. The vacancy rate for
homeowners was 3.5% and the vacancy rate for renters was 9.2%. Three or more generations
lived in 3.47% of households in 2010.
Table H‐1: Housing Unit Occupancy
Davidson County 2008‐2010
2007 2008 2009 2010
Total Housing Units 278,855 283,739 285,187 283,978
Occupied 250,958 90% 257,193 90.6% 255,290 89.5% 259,499 91.4%
Vacant 27,897 10% 26,546 9.4% 29,879 11.7% 24,479 8.6%
Source: American Community Survey 1‐Year estimates, tables PCT14, DP‐1 and DP‐04
Although less as affected by the housing crisis than some other areas of the country, the Davidson
County housing market showed the effects of that situation, as well as for the downturn in the
economy and the flood in May 2010.
Helped by the federal tax credit program, U. S. first‐time home buyers were 49% of buyers in April
2010, the month the program ended, but by January 2011, they had decreased to 29%. Freddie
Mac’s October 2010 30‐year mortgage interest rate was 4.23%, the lowest since the series began
in 1971. (State of the Nation’s Housing 2010, Joint Center for Housing Studies Harvard University)
http://www.jchs.harvard.edu/publications/markets/son2011/son2011_fact_sheet.pdf
Chart H‐1 shows the trend in building permits issued in
Davidson County from 1990 to 2010. The number of
permits issued in 2009 and 2010 are approximately the
same as in 1990. The 2000‐2006 numbers reflect the
housing boom, with the downturn starting in 2006.
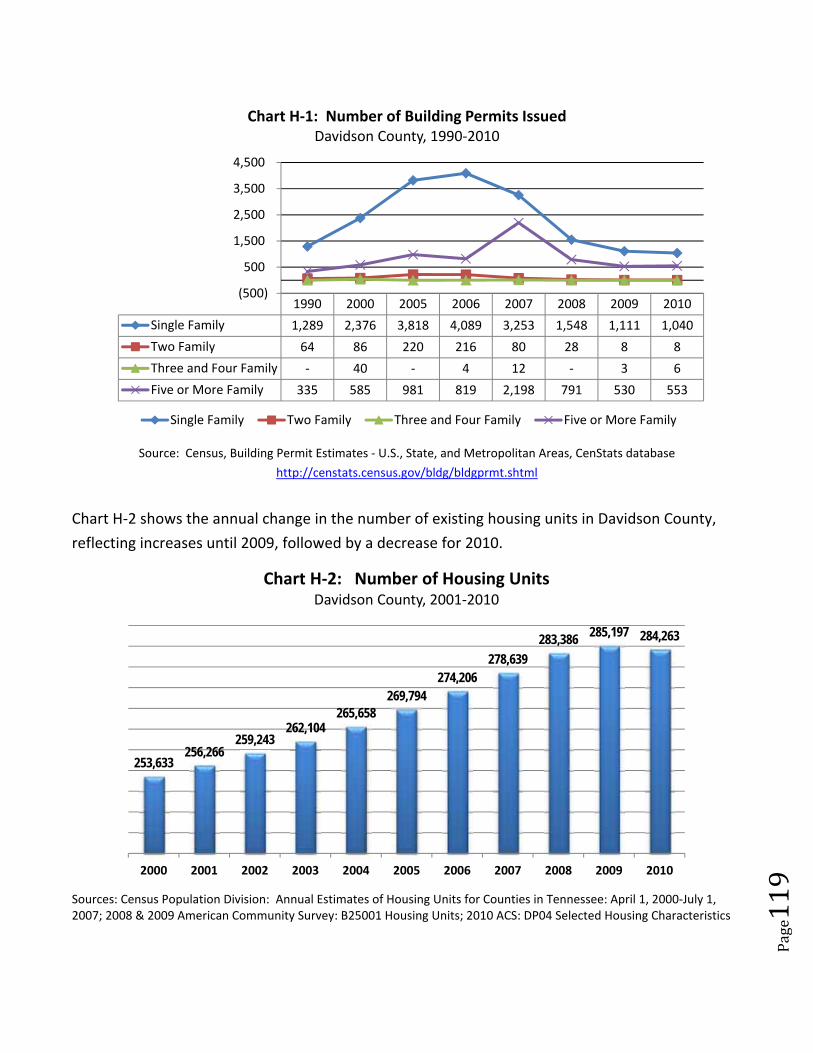
Page119
Source: Census, Building Permit Estimates ‐ U.S., State, and Metropolitan Areas, CenStats database
http://censtats.census.gov/bldg/bldgprmt.shtml
Chart H‐2 shows the annual change in the number of existing housing units in Davidson County,
reflecting increases until 2009, followed by a decrease for 2010.
Sources: Census Population Division: Annual Estimates of Housing Units for Counties in Tennessee: April 1, 2000‐July 1, 2007; 2008 & 2009 American Community Survey: B25001 Housing Units; 2010 ACS: DP04 Selected Housing Characteristics
1990 2000 2005 2006 2007 2008 2009 2010
Single Family 1,289 2,376 3,818 4,089 3,253 1,548 1,111 1,040
Two Family 64 86 220 216 80 28 8 8
Three and Four Family ‐ 40 ‐ 4 12 ‐ 3 6
Five or More Family 335 585 981 819 2,198 791 530 553
(500)
500
1,500
2,500
3,500
4,500
Chart H‐1: Number of Building Permits IssuedDavidson County, 1990‐2010
Single Family Two Family Three and Four Family Five or More Family
253,633256,266
259,243262,104
265,658269,794
274,206278,639
283,386 285,197 284,263
2000 2001 2002 2003 2004 2005 2006 2007 2008 2009 2010
Chart H‐2: Number of Housing UnitsDavidson County, 2001‐2010
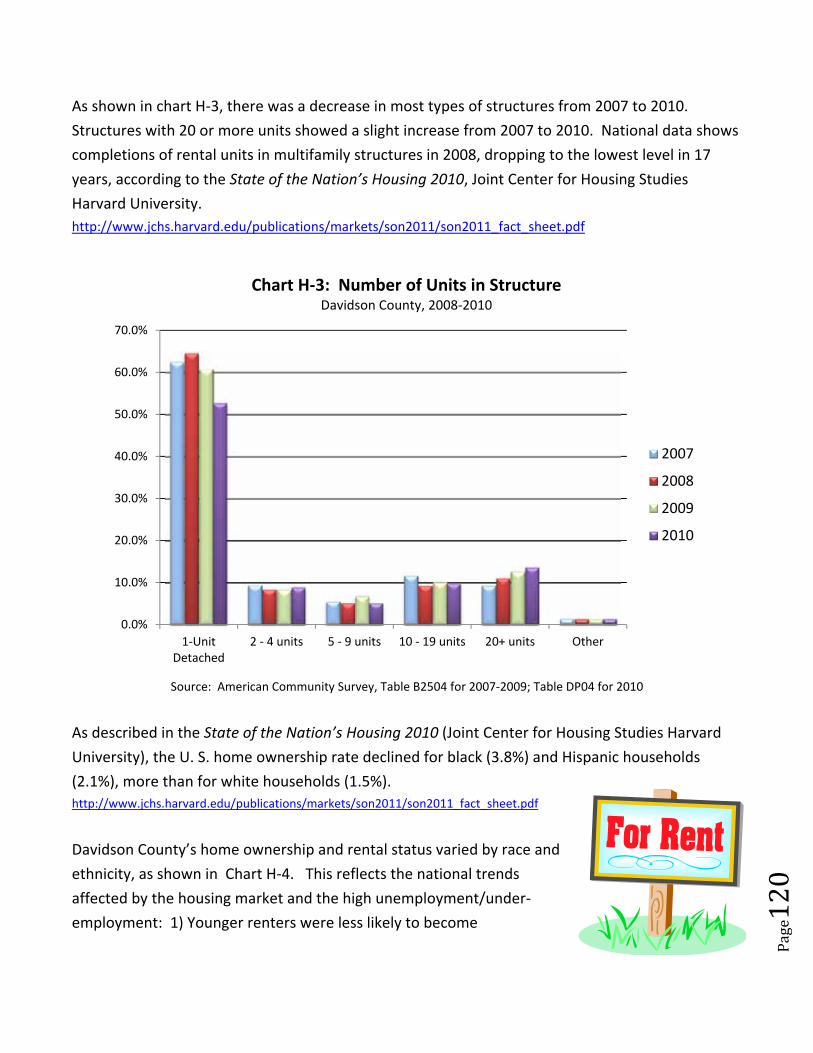
Page120
As shown in chart H‐3, there was a decrease in most types of structures from 2007 to 2010.
Structures with 20 or more units showed a slight increase from 2007 to 2010. National data shows
completions of rental units in multifamily structures in 2008, dropping to the lowest level in 17
years, according to the State of the Nation’s Housing 2010, Joint Center for Housing Studies
Harvard University.
http://www.jchs.harvard.edu/publications/markets/son2011/son2011_fact_sheet.pdf
Source: American Community Survey, Table B2504 for 2007‐2009; Table DP04 for 2010
As described in the State of the Nation’s Housing 2010 (Joint Center for Housing Studies Harvard
University), the U. S. home ownership rate declined for black (3.8%) and Hispanic households
(2.1%), more than for white households (1.5%).
http://www.jchs.harvard.edu/publications/markets/son2011/son2011_fact_sheet.pdf
Davidson County’s home ownership and rental status varied by race and
ethnicity, as shown in Chart H‐4. This reflects the national trends
affected by the housing market and the high unemployment/under‐
employment: 1) Younger renters were less likely to become
0.0%
10.0%
20.0%
30.0%
40.0%
50.0%
60.0%
70.0%
1‐UnitDetached
2 ‐ 4 units 5 ‐ 9 units 10 ‐ 19 units 20+ units Other
Chart H‐3: Number of Units in StructureDavidson County, 2008‐2010
2007
2008
2009
2010
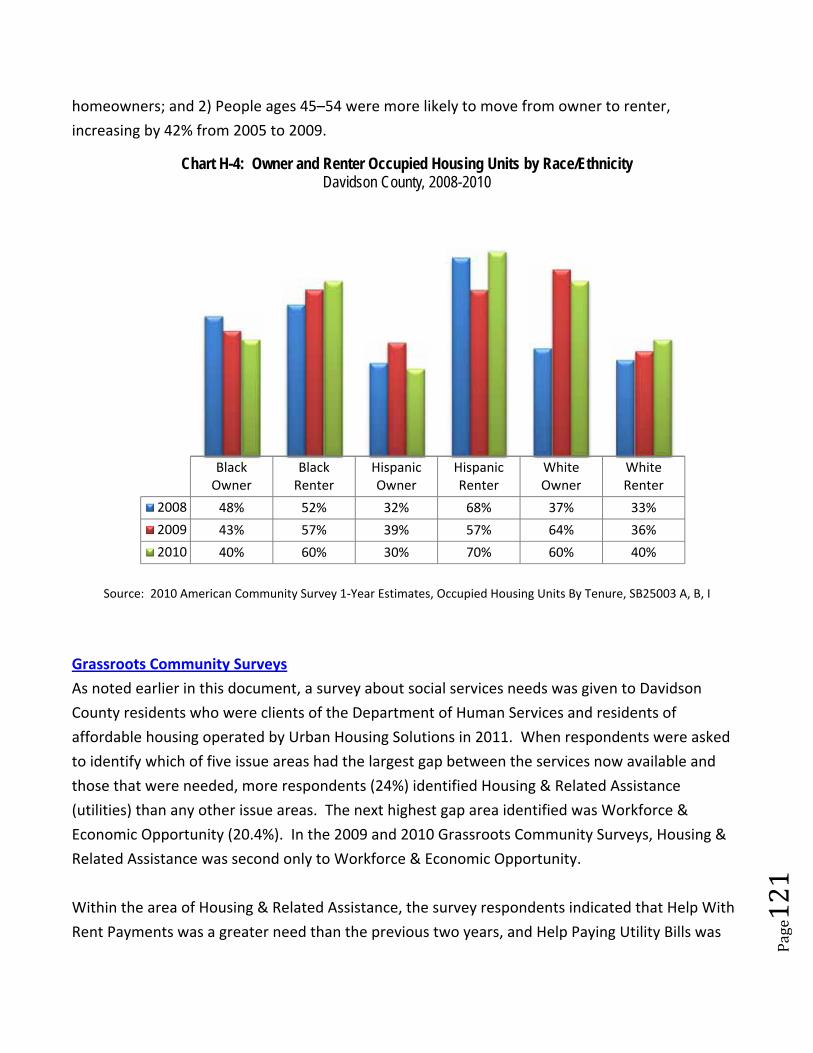
Page121
homeowners; and 2) People ages 45–54 were more likely to move from owner to renter,
increasing by 42% from 2005 to 2009.
Source: 2010 American Community Survey 1‐Year Estimates, Occupied Housing Units By Tenure, SB25003 A, B, I
Grassroots Community Surveys
As noted earlier in this document, a survey about social services needs was given to Davidson
County residents who were clients of the Department of Human Services and residents of
affordable housing operated by Urban Housing Solutions in 2011. When respondents were asked
to identify which of five issue areas had the largest gap between the services now available and
those that were needed, more respondents (24%) identified Housing & Related Assistance
(utilities) than any other issue areas. The next highest gap area identified was Workforce &
Economic Opportunity (20.4%). In the 2009 and 2010 Grassroots Community Surveys, Housing &
Related Assistance was second only to Workforce & Economic Opportunity.
Within the area of Housing & Related Assistance, the survey respondents indicated that Help With
Rent Payments was a greater need than the previous two years, and Help Paying Utility Bills was
BlackOwner
BlackRenter
HispanicOwner
HispanicRenter
WhiteOwner
WhiteRenter
2008 48% 52% 32% 68% 37% 33%
2009 43% 57% 39% 57% 64% 36%
2010 40% 60% 30% 70% 60% 40%
Chart H-4: Owner and Renter Occupied Housing Units by Race/EthnicityDavidson County, 2008-2010
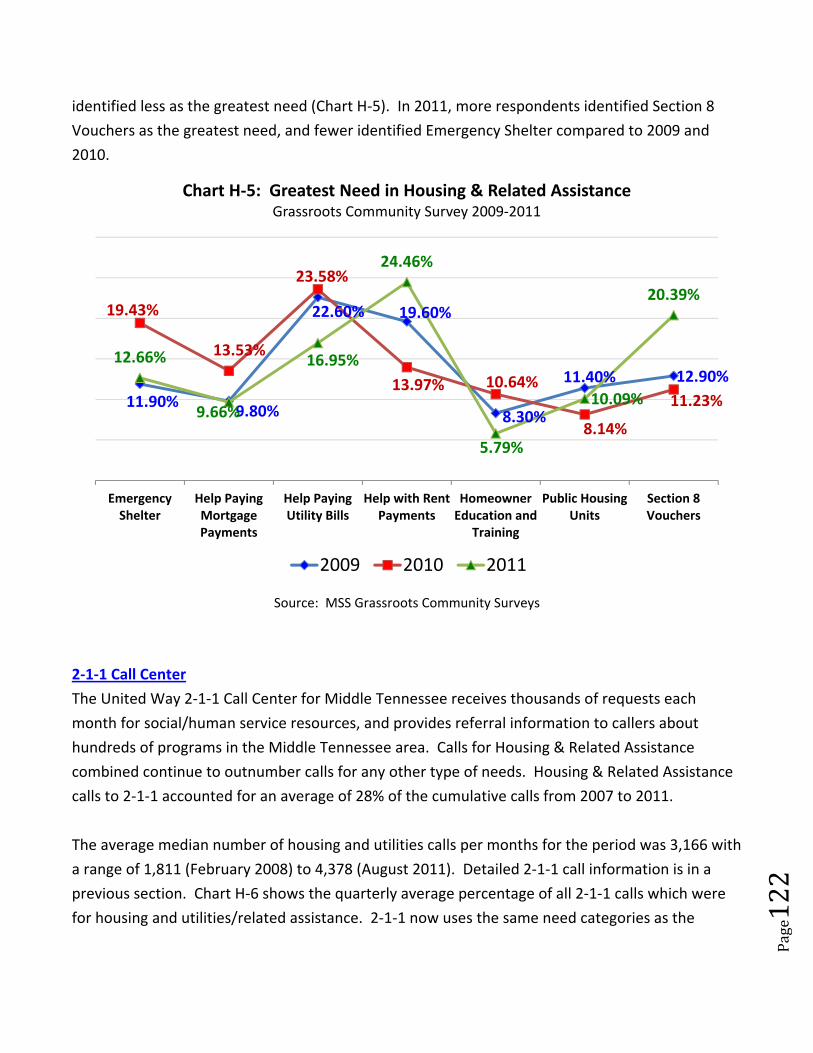
Page122
identified less as the greatest need (Chart H‐5). In 2011, more respondents identified Section 8
Vouchers as the greatest need, and fewer identified Emergency Shelter compared to 2009 and
2010.
Source: MSS Grassroots Community Surveys
2‐1‐1 Call Center
The United Way 2‐1‐1 Call Center for Middle Tennessee receives thousands of requests each
month for social/human service resources, and provides referral information to callers about
hundreds of programs in the Middle Tennessee area. Calls for Housing & Related Assistance
combined continue to outnumber calls for any other type of needs. Housing & Related Assistance
calls to 2‐1‐1 accounted for an average of 28% of the cumulative calls from 2007 to 2011.
The average median number of housing and utilities calls per months for the period was 3,166 with
a range of 1,811 (February 2008) to 4,378 (August 2011). Detailed 2‐1‐1 call information is in a
previous section. Chart H‐6 shows the quarterly average percentage of all 2‐1‐1 calls which were
for housing and utilities/related assistance. 2‐1‐1 now uses the same need categories as the
11.90%9.80%
22.60% 19.60%
8.30%
11.40% 12.90%
19.43%
13.53%
23.58%
13.97% 10.64%
8.14%
11.23%
12.66%
9.66%
16.95%
24.46%
5.79%
10.09%
20.39%
EmergencyShelter
Help PayingMortgagePayments
Help PayingUtility Bills
Help with RentPayments
HomeownerEducation and
Training
Public HousingUnits
Section 8Vouchers
Chart H‐5: Greatest Need in Housing & Related AssistanceGrassroots Community Survey 2009‐2011
2009 2010 2011
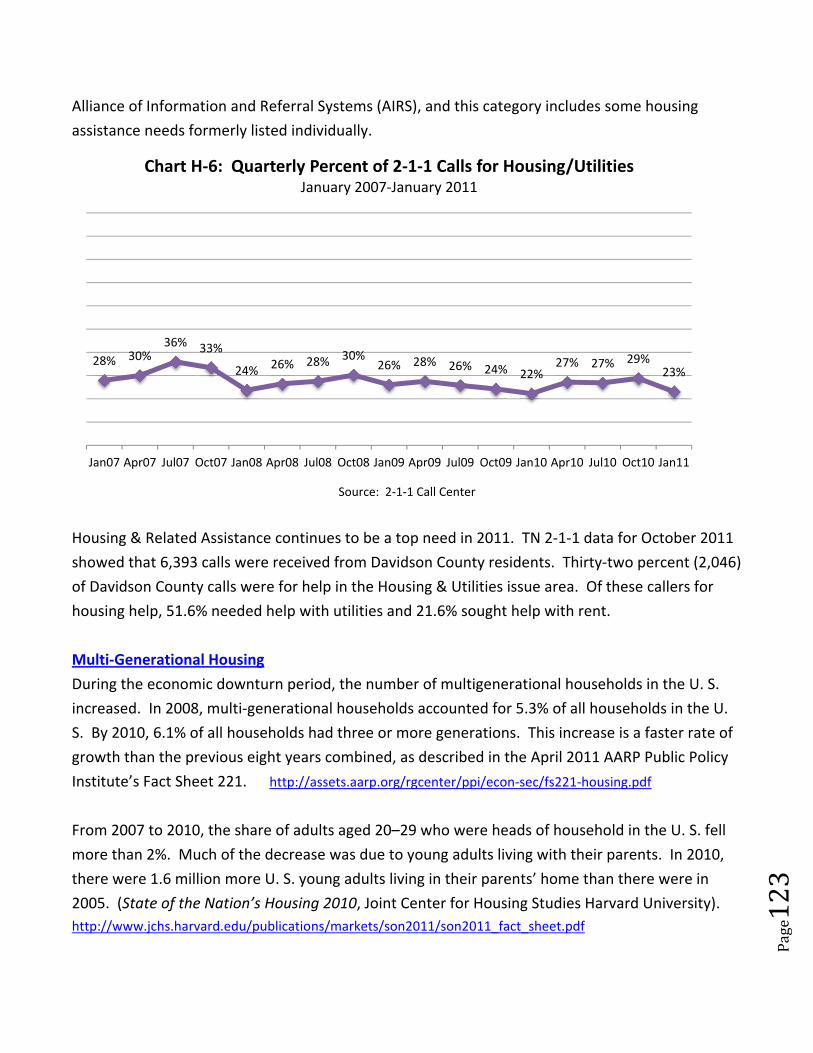
Page123
Alliance of Information and Referral Systems (AIRS), and this category includes some housing
assistance needs formerly listed individually.
Source: 2‐1‐1 Call Center
Housing & Related Assistance continues to be a top need in 2011. TN 2‐1‐1 data for October 2011
showed that 6,393 calls were received from Davidson County residents. Thirty‐two percent (2,046)
of Davidson County calls were for help in the Housing & Utilities issue area. Of these callers for
housing help, 51.6% needed help with utilities and 21.6% sought help with rent.
Multi‐Generational Housing
During the economic downturn period, the number of multigenerational households in the U. S.
increased. In 2008, multi‐generational households accounted for 5.3% of all households in the U.
S. By 2010, 6.1% of all households had three or more generations. This increase is a faster rate of
growth than the previous eight years combined, as described in the April 2011 AARP Public Policy
Institute’s Fact Sheet 221. http://assets.aarp.org/rgcenter/ppi/econ‐sec/fs221‐housing.pdf
From 2007 to 2010, the share of adults aged 20–29 who were heads of household in the U. S. fell
more than 2%. Much of the decrease was due to young adults living with their parents. In 2010,
there were 1.6 million more U. S. young adults living in their parents’ home than there were in
2005. (State of the Nation’s Housing 2010, Joint Center for Housing Studies Harvard University).
http://www.jchs.harvard.edu/publications/markets/son2011/son2011_fact_sheet.pdf
28% 30%36% 33%
24% 26% 28% 30%26% 28% 26% 24% 22%
27% 27% 29%23%
Jan07 Apr07 Jul07 Oct07 Jan08 Apr08 Jul08 Oct08 Jan09 Apr09 Jul09 Oct09 Jan10 Apr10 Jul10 Oct10 Jan11
Chart H‐6: Quarterly Percent of 2‐1‐1 Calls for Housing/UtilitiesJanuary 2007‐January 2011
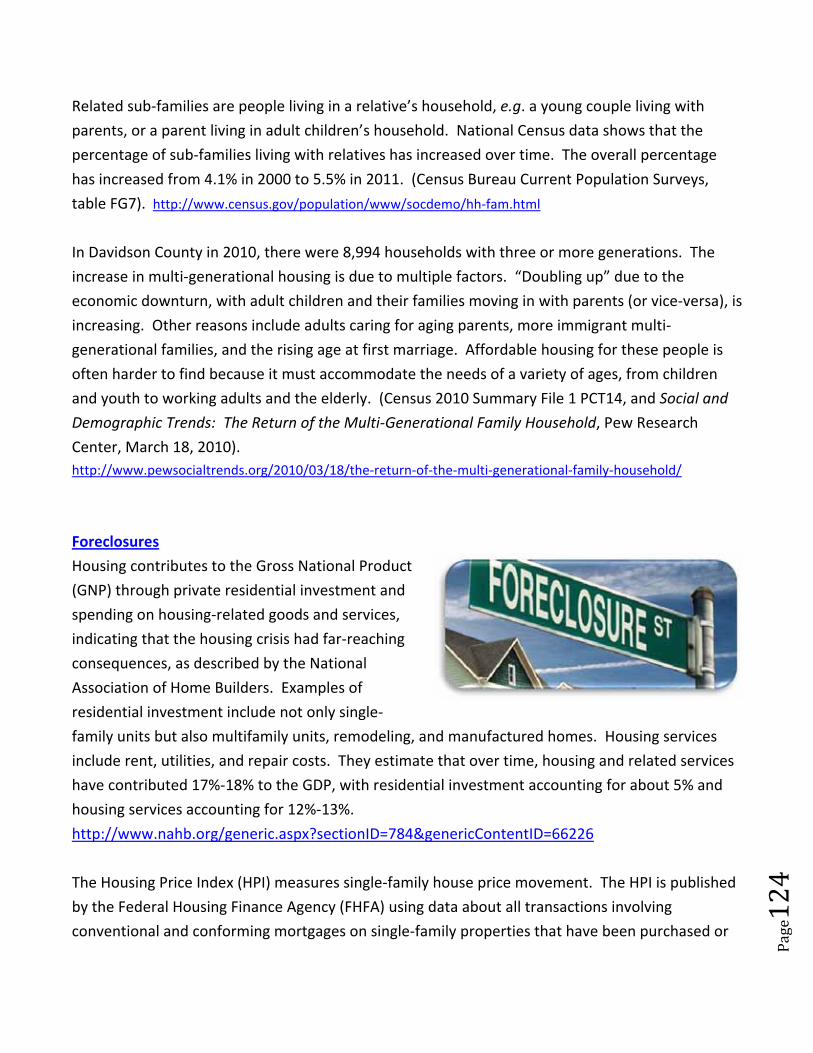
Page124
Related sub‐families are people living in a relative’s household, e.g. a young couple living with
parents, or a parent living in adult children’s household. National Census data shows that the
percentage of sub‐families living with relatives has increased over time. The overall percentage
has increased from 4.1% in 2000 to 5.5% in 2011. (Census Bureau Current Population Surveys,
table FG7). http://www.census.gov/population/www/socdemo/hh‐fam.html
In Davidson County in 2010, there were 8,994 households with three or more generations. The
increase in multi‐generational housing is due to multiple factors. “Doubling up” due to the
economic downturn, with adult children and their families moving in with parents (or vice‐versa), is
increasing. Other reasons include adults caring for aging parents, more immigrant multi‐
generational families, and the rising age at first marriage. Affordable housing for these people is
often harder to find because it must accommodate the needs of a variety of ages, from children
and youth to working adults and the elderly. (Census 2010 Summary File 1 PCT14, and Social and
Demographic Trends: The Return of the Multi‐Generational Family Household, Pew Research
Center, March 18, 2010).
http://www.pewsocialtrends.org/2010/03/18/the‐return‐of‐the‐multi‐generational‐family‐household/
Foreclosures
Housing contributes to the Gross National Product
(GNP) through private residential investment and
spending on housing‐related goods and services,
indicating that the housing crisis had far‐reaching
consequences, as described by the National
Association of Home Builders. Examples of
residential investment include not only single‐
family units but also multifamily units, remodeling, and manufactured homes. Housing services
include rent, utilities, and repair costs. They estimate that over time, housing and related services
have contributed 17%‐18% to the GDP, with residential investment accounting for about 5% and
housing services accounting for 12%‐13%.
http://www.nahb.org/generic.aspx?sectionID=784&genericContentID=66226
The Housing Price Index (HPI) measures single‐family house price movement. The HPI is published
by the Federal Housing Finance Agency (FHFA) using data about all transactions involving
conventional and conforming mortgages on single‐family properties that have been purchased or
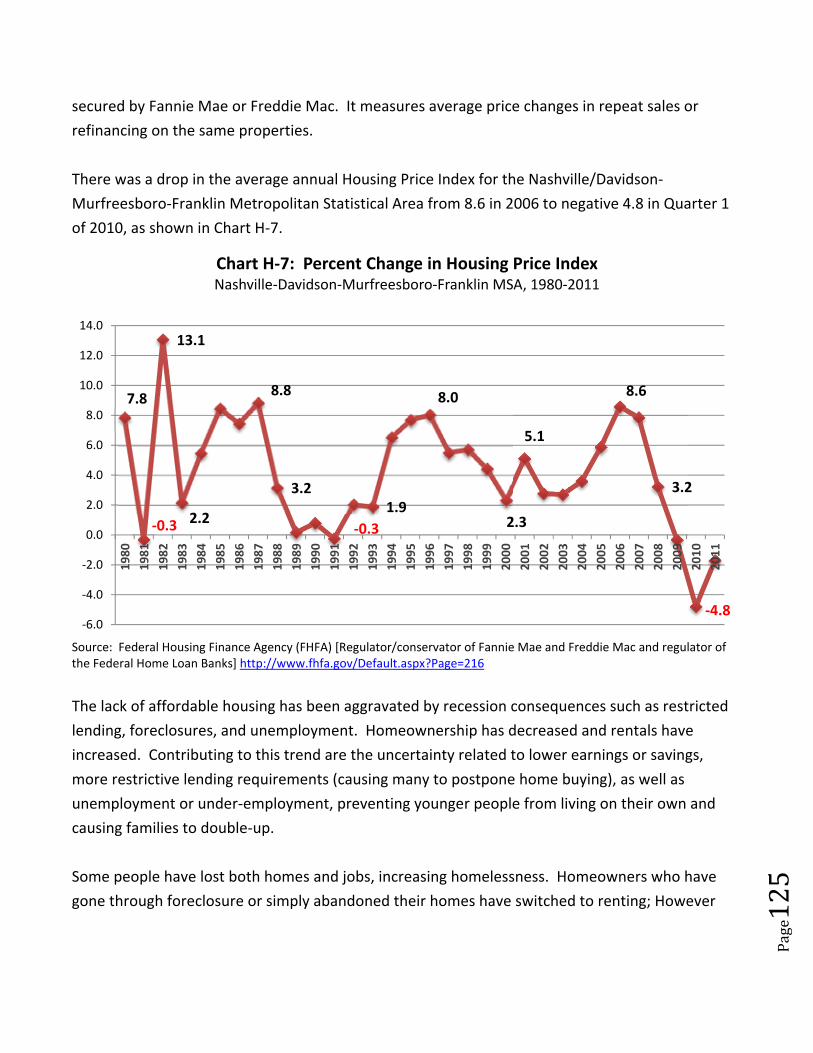
Page125
secured by Fannie Mae or Freddie Mac. It measures average price changes in repeat sales or
refinancing on the same properties.
There was a drop in the average annual Housing Price Index for the Nashville/Davidson‐
Murfreesboro‐Franklin Metropolitan Statistical Area from 8.6 in 2006 to negative 4.8 in Quarter 1
of 2010, as shown in Chart H‐7.
Source: Federal Housing Finance Agency (FHFA) [Regulator/conservator of Fannie Mae and Freddie Mac and regulator of the Federal Home Loan Banks] http://www.fhfa.gov/Default.aspx?Page=216
The lack of affordable housing has been aggravated by recession consequences such as restricted
lending, foreclosures, and unemployment. Homeownership has decreased and rentals have
increased. Contributing to this trend are the uncertainty related to lower earnings or savings,
more restrictive lending requirements (causing many to postpone home buying), as well as
unemployment or under‐employment, preventing younger people from living on their own and
causing families to double‐up.
Some people have lost both homes and jobs, increasing homelessness. Homeowners who have
gone through foreclosure or simply abandoned their homes have switched to renting; However
7.8
‐0.3
13.1
2.2
8.8
3.2
‐0.3
1.9
8.0
2.3
5.1
8.6
3.2
‐4.8‐6.0
‐4.0
‐2.0
0.0
2.0
4.0
6.0
8.0
10.0
12.0
14.0
1980
1981
1982
1983
1984
1985
1986
1987
1988
1989
1990
1991
1992
1993
1994
1995
1996
1997
1998
1999
2000
2001
2002
2003
2004
2005
2006
2007
2008
2009
2010
2011
Chart H‐7: Percent Change in Housing Price IndexNashville‐Davidson‐Murfreesboro‐Franklin MSA, 1980‐2011
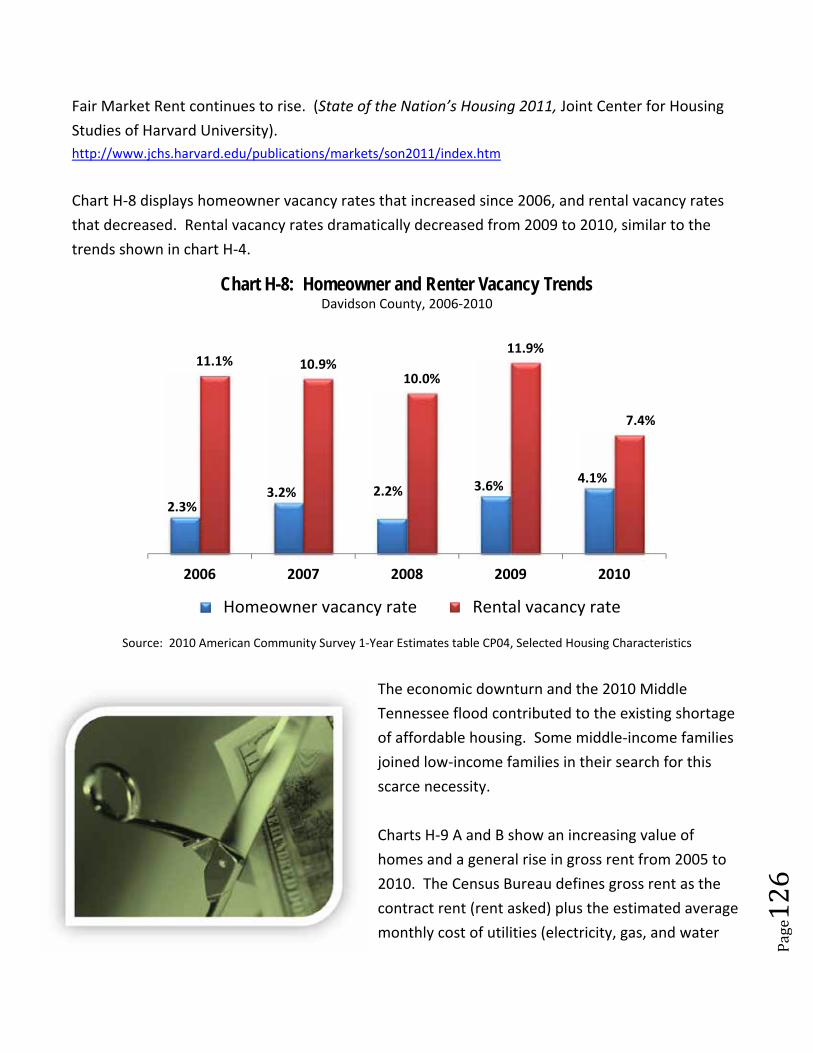
Page126
Fair Market Rent continues to rise. (State of the Nation’s Housing 2011, Joint Center for Housing
Studies of Harvard University).
http://www.jchs.harvard.edu/publications/markets/son2011/index.htm
Chart H‐8 displays homeowner vacancy rates that increased since 2006, and rental vacancy rates
that decreased. Rental vacancy rates dramatically decreased from 2009 to 2010, similar to the
trends shown in chart H‐4.
Source: 2010 American Community Survey 1‐Year Estimates table CP04, Selected Housing Characteristics
The economic downturn and the 2010 Middle
Tennessee flood contributed to the existing shortage
of affordable housing. Some middle‐income families
joined low‐income families in their search for this
scarce necessity.
Charts H‐9 A and B show an increasing value of
homes and a general rise in gross rent from 2005 to
2010. The Census Bureau defines gross rent as the
contract rent (rent asked) plus the estimated average
monthly cost of utilities (electricity, gas, and water
2.3%3.2% 2.2% 3.6%
4.1%
11.1% 10.9%10.0%
11.9%
7.4%
2006 2007 2008 2009 2010
Chart H-8: Homeowner and Renter Vacancy TrendsDavidson County, 2006‐2010
Homeowner vacancy rate Rental vacancy rate
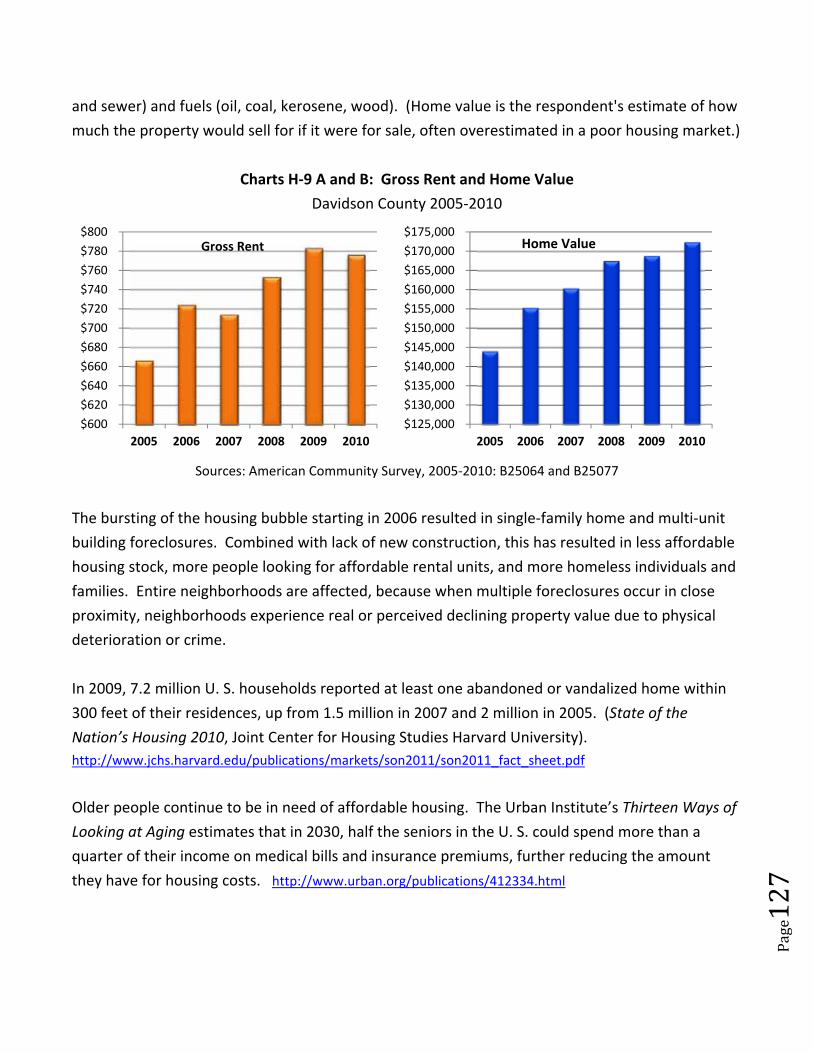
Page127
and sewer) and fuels (oil, coal, kerosene, wood). (Home value is the respondent's estimate of how
much the property would sell for if it were for sale, often overestimated in a poor housing market.)
Charts H‐9 A and B: Gross Rent and Home Value
Davidson County 2005‐2010
Sources: American Community Survey, 2005‐2010: B25064 and B25077
The bursting of the housing bubble starting in 2006 resulted in single‐family home and multi‐unit
building foreclosures. Combined with lack of new construction, this has resulted in less affordable
housing stock, more people looking for affordable rental units, and more homeless individuals and
families. Entire neighborhoods are affected, because when multiple foreclosures occur in close
proximity, neighborhoods experience real or perceived declining property value due to physical
deterioration or crime.
In 2009, 7.2 million U. S. households reported at least one abandoned or vandalized home within
300 feet of their residences, up from 1.5 million in 2007 and 2 million in 2005. (State of the
Nation’s Housing 2010, Joint Center for Housing Studies Harvard University).
http://www.jchs.harvard.edu/publications/markets/son2011/son2011_fact_sheet.pdf
Older people continue to be in need of affordable housing. The Urban Institute’s Thirteen Ways of
Looking at Aging estimates that in 2030, half the seniors in the U. S. could spend more than a
quarter of their income on medical bills and insurance premiums, further reducing the amount
they have for housing costs. http://www.urban.org/publications/412334.html
$600
$620
$640
$660
$680
$700
$720
$740
$760
$780
$800
2005 2006 2007 2008 2009 2010
Gross Rent
$125,000
$130,000
$135,000
$140,000
$145,000
$150,000
$155,000
$160,000
$165,000
$170,000
$175,000
2005 2006 2007 2008 2009 2010
Home Value
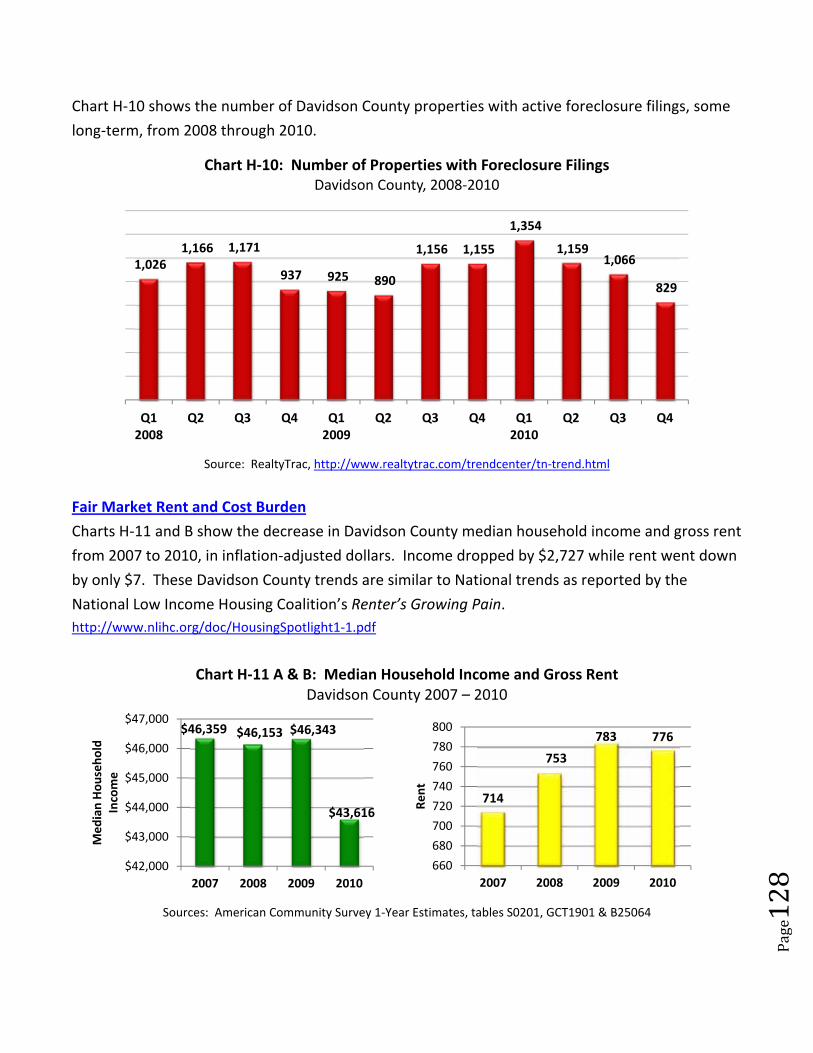
Page128
Chart H‐10 shows the number of Davidson County properties with active foreclosure filings, some
long‐term, from 2008 through 2010.
Source: RealtyTrac, http://www.realtytrac.com/trendcenter/tn‐trend.html
Fair Market Rent and Cost Burden
Charts H‐11 and B show the decrease in Davidson County median household income and gross rent
from 2007 to 2010, in inflation‐adjusted dollars. Income dropped by $2,727 while rent went down
by only $7. These Davidson County trends are similar to National trends as reported by the
National Low Income Housing Coalition’s Renter’s Growing Pain.
http://www.nlihc.org/doc/HousingSpotlight1‐1.pdf
Chart H‐11 A & B: Median Household Income and Gross Rent Davidson County 2007 – 2010
Sources: American Community Survey 1‐Year Estimates, tables S0201, GCT1901 & B25064
1,026 1,166 1,171
937 925 890
1,156 1,155
1,354
1,159 1,066
829
Q12008
Q2 Q3 Q4 Q12009
Q2 Q3 Q4 Q12010
Q2 Q3 Q4
Chart H‐10: Number of Properties with Foreclosure FilingsDavidson County, 2008‐2010
$46,359 $46,153 $46,343
$43,616
$42,000
$43,000
$44,000
$45,000
$46,000
$47,000
2007 2008 2009 2010
Median Household
Income
714
753
783 776
660
680
700
720
740
760
780
800
2007 2008 2009 2010
Rent
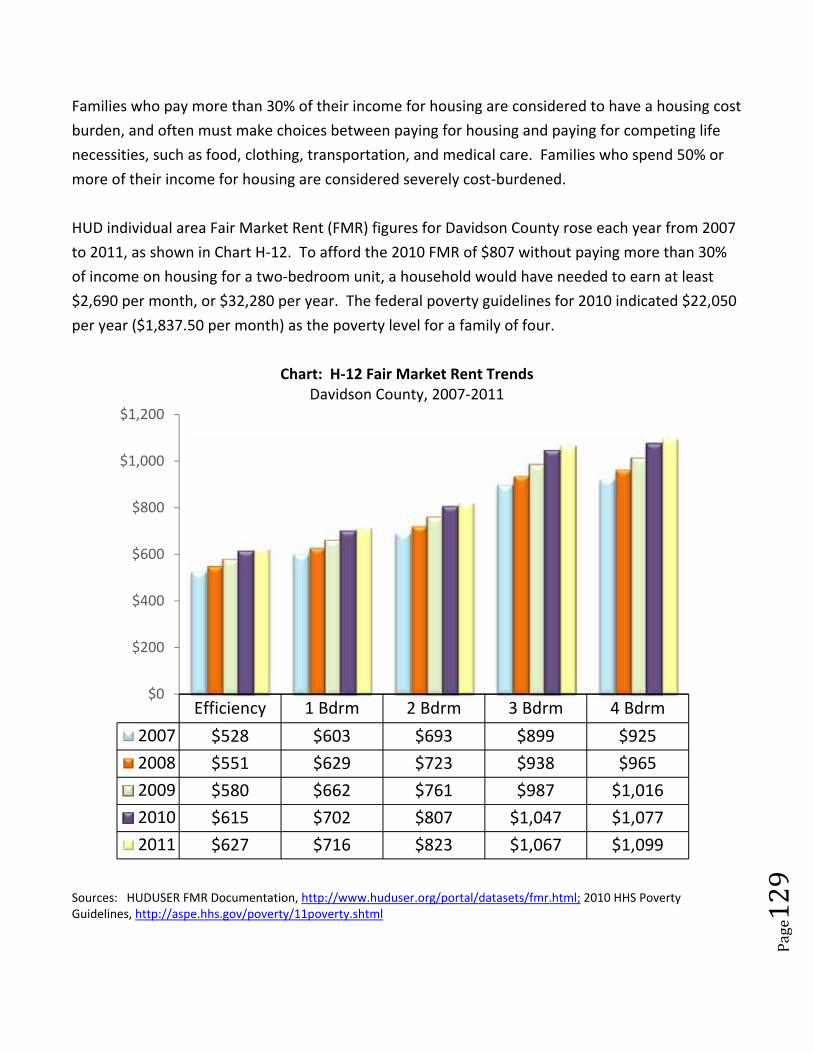
Page129
Families who pay more than 30% of their income for housing are considered to have a housing cost
burden, and often must make choices between paying for housing and paying for competing life
necessities, such as food, clothing, transportation, and medical care. Families who spend 50% or
more of their income for housing are considered severely cost‐burdened.
HUD individual area Fair Market Rent (FMR) figures for Davidson County rose each year from 2007
to 2011, as shown in Chart H‐12. To afford the 2010 FMR of $807 without paying more than 30%
of income on housing for a two‐bedroom unit, a household would have needed to earn at least
$2,690 per month, or $32,280 per year. The federal poverty guidelines for 2010 indicated $22,050
per year ($1,837.50 per month) as the poverty level for a family of four.
Chart: H‐12 Fair Market Rent Trends Davidson County, 2007‐2011
Sources: HUDUSER FMR Documentation, http://www.huduser.org/portal/datasets/fmr.html; 2010 HHS Poverty Guidelines, http://aspe.hhs.gov/poverty/11poverty.shtml
Efficiency 1 Bdrm 2 Bdrm 3 Bdrm 4 Bdrm
2007 $528 $603 $693 $899 $925
2008 $551 $629 $723 $938 $965
2009 $580 $662 $761 $987 $1,016
2010 $615 $702 $807 $1,047 $1,077
2011 $627 $716 $823 $1,067 $1,099
$0
$200
$400
$600
$800
$1,000
$1,200
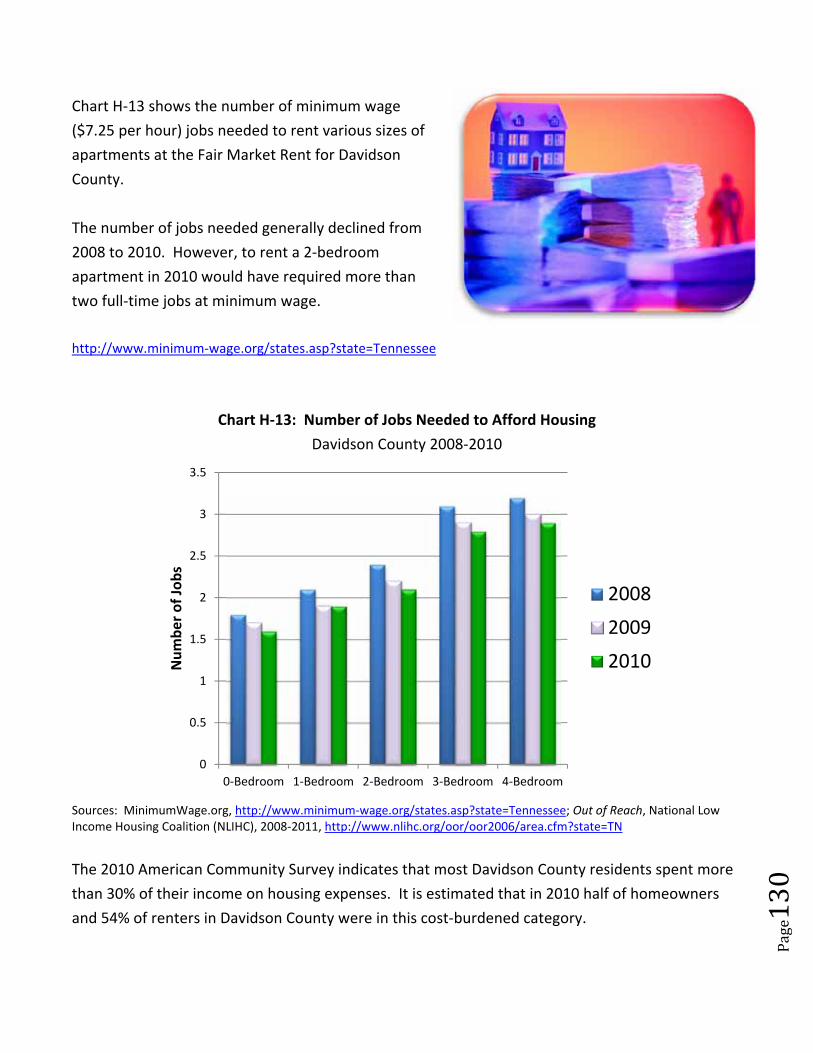
Page130
Chart H‐13 shows the number of minimum wage
($7.25 per hour) jobs needed to rent various sizes of
apartments at the Fair Market Rent for Davidson
County.
The number of jobs needed generally declined from
2008 to 2010. However, to rent a 2‐bedroom
apartment in 2010 would have required more than
two full‐time jobs at minimum wage.
http://www.minimum‐wage.org/states.asp?state=Tennessee
Chart H‐13: Number of Jobs Needed to Afford Housing
Davidson County 2008‐2010
Sources: MinimumWage.org, http://www.minimum‐wage.org/states.asp?state=Tennessee; Out of Reach, National Low Income Housing Coalition (NLIHC), 2008‐2011, http://www.nlihc.org/oor/oor2006/area.cfm?state=TN
The 2010 American Community Survey indicates that most Davidson County residents spent more
than 30% of their income on housing expenses. It is estimated that in 2010 half of homeowners
and 54% of renters in Davidson County were in this cost‐burdened category.
0
0.5
1
1.5
2
2.5
3
3.5
0‐Bedroom 1‐Bedroom 2‐Bedroom 3‐Bedroom 4‐Bedroom
Number of Jobs
2008
2009
2010
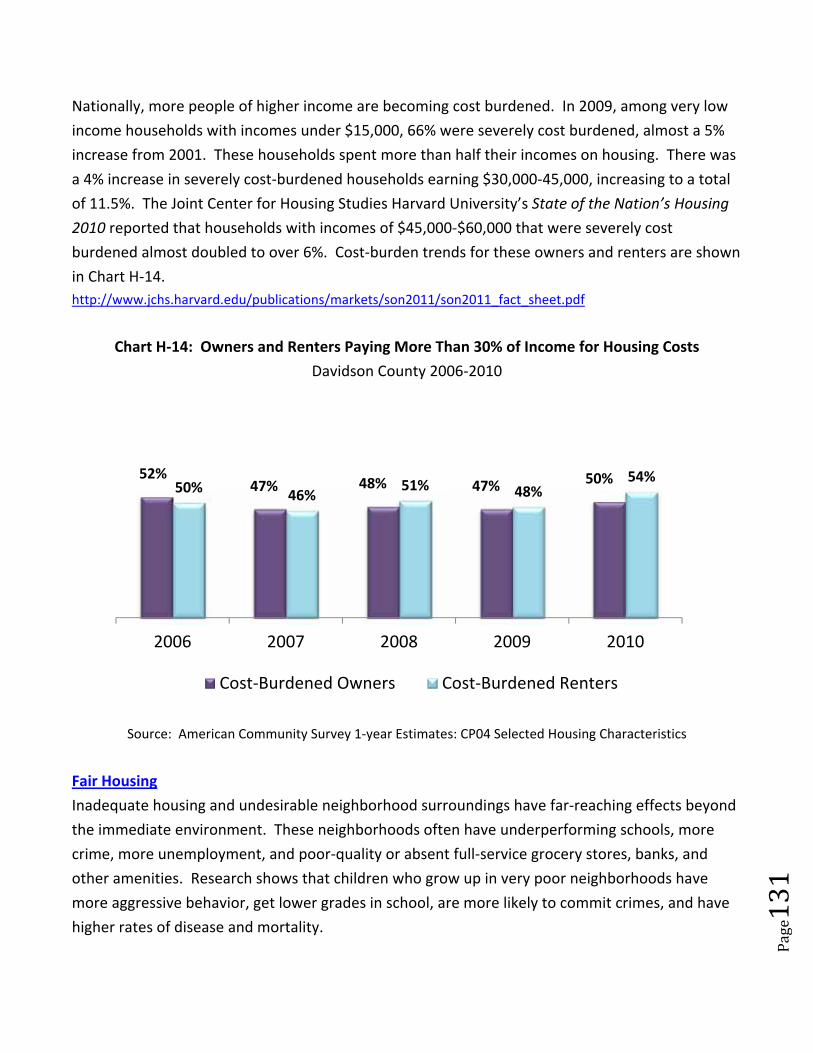
Page131
Nationally, more people of higher income are becoming cost burdened. In 2009, among very low
income households with incomes under $15,000, 66% were severely cost burdened, almost a 5%
increase from 2001. These households spent more than half their incomes on housing. There was
a 4% increase in severely cost‐burdened households earning $30,000‐45,000, increasing to a total
of 11.5%. The Joint Center for Housing Studies Harvard University’s State of the Nation’s Housing
2010 reported that households with incomes of $45,000‐$60,000 that were severely cost
burdened almost doubled to over 6%. Cost‐burden trends for these owners and renters are shown
in Chart H‐14.
http://www.jchs.harvard.edu/publications/markets/son2011/son2011_fact_sheet.pdf
Chart H‐14: Owners and Renters Paying More Than 30% of Income for Housing Costs
Davidson County 2006‐2010
Source: American Community Survey 1‐year Estimates: CP04 Selected Housing Characteristics
Fair Housing
Inadequate housing and undesirable neighborhood surroundings have far‐reaching effects beyond
the immediate environment. These neighborhoods often have underperforming schools, more
crime, more unemployment, and poor‐quality or absent full‐service grocery stores, banks, and
other amenities. Research shows that children who grow up in very poor neighborhoods have
more aggressive behavior, get lower grades in school, are more likely to commit crimes, and have
higher rates of disease and mortality.
52%47% 48% 47% 50%
50% 46%51% 48%
54%
2006 2007 2008 2009 2010
Cost‐Burdened Owners Cost‐Burdened Renters
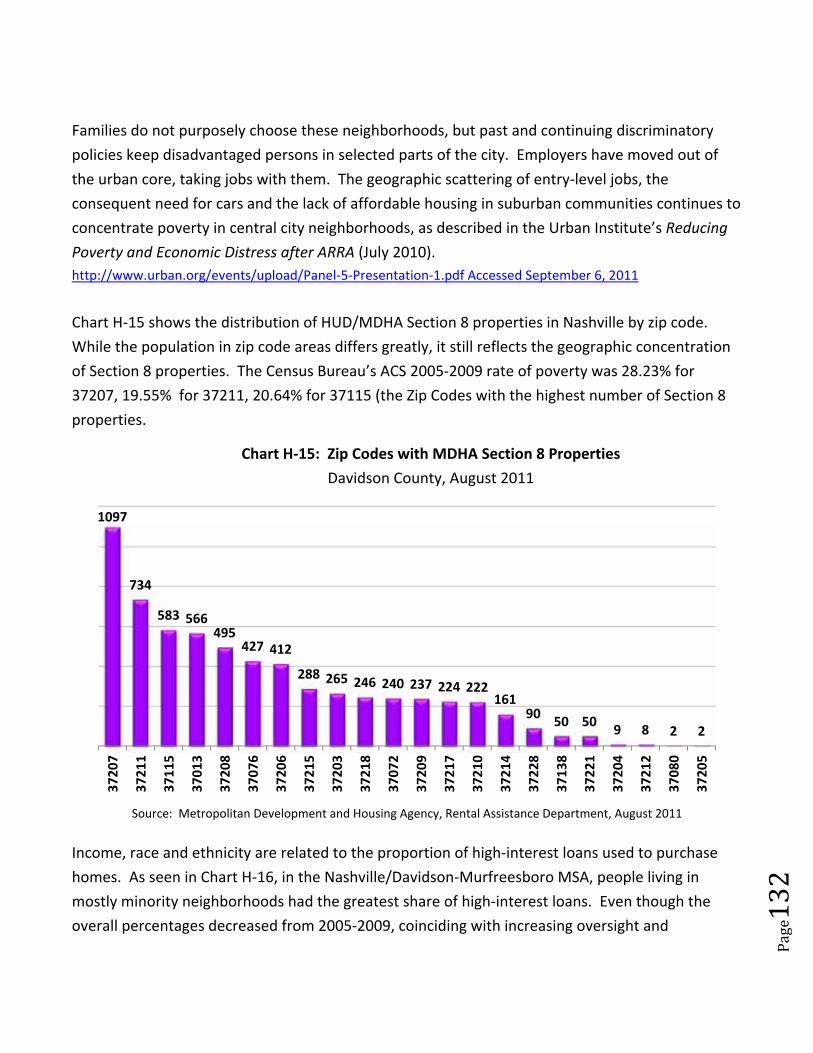
Page132
Families do not purposely choose these neighborhoods, but past and continuing discriminatory
policies keep disadvantaged persons in selected parts of the city. Employers have moved out of
the urban core, taking jobs with them. The geographic scattering of entry‐level jobs, the
consequent need for cars and the lack of affordable housing in suburban communities continues to
concentrate poverty in central city neighborhoods, as described in the Urban Institute’s Reducing
Poverty and Economic Distress after ARRA (July 2010).
http://www.urban.org/events/upload/Panel‐5‐Presentation‐1.pdf Accessed September 6, 2011
Chart H‐15 shows the distribution of HUD/MDHA Section 8 properties in Nashville by zip code.
While the population in zip code areas differs greatly, it still reflects the geographic concentration
of Section 8 properties. The Census Bureau’s ACS 2005‐2009 rate of poverty was 28.23% for
37207, 19.55% for 37211, 20.64% for 37115 (the Zip Codes with the highest number of Section 8
properties.
Chart H‐15: Zip Codes with MDHA Section 8 Properties
Davidson County, August 2011
Source: Metropolitan Development and Housing Agency, Rental Assistance Department, August 2011
Income, race and ethnicity are related to the proportion of high‐interest loans used to purchase
homes. As seen in Chart H‐16, in the Nashville/Davidson‐Murfreesboro MSA, people living in
mostly minority neighborhoods had the greatest share of high‐interest loans. Even though the
overall percentages decreased from 2005‐2009, coinciding with increasing oversight and
1097
734
583 566495
427 412
288 265 246 240 237 224 222161
9050 50
9 8 2 2
37207
37211
37115
37013
37208
37076
37206
37215
37203
37218
37072
37209
37217
37210
37214
37228
37138
37221
37204
37212
37080
37205
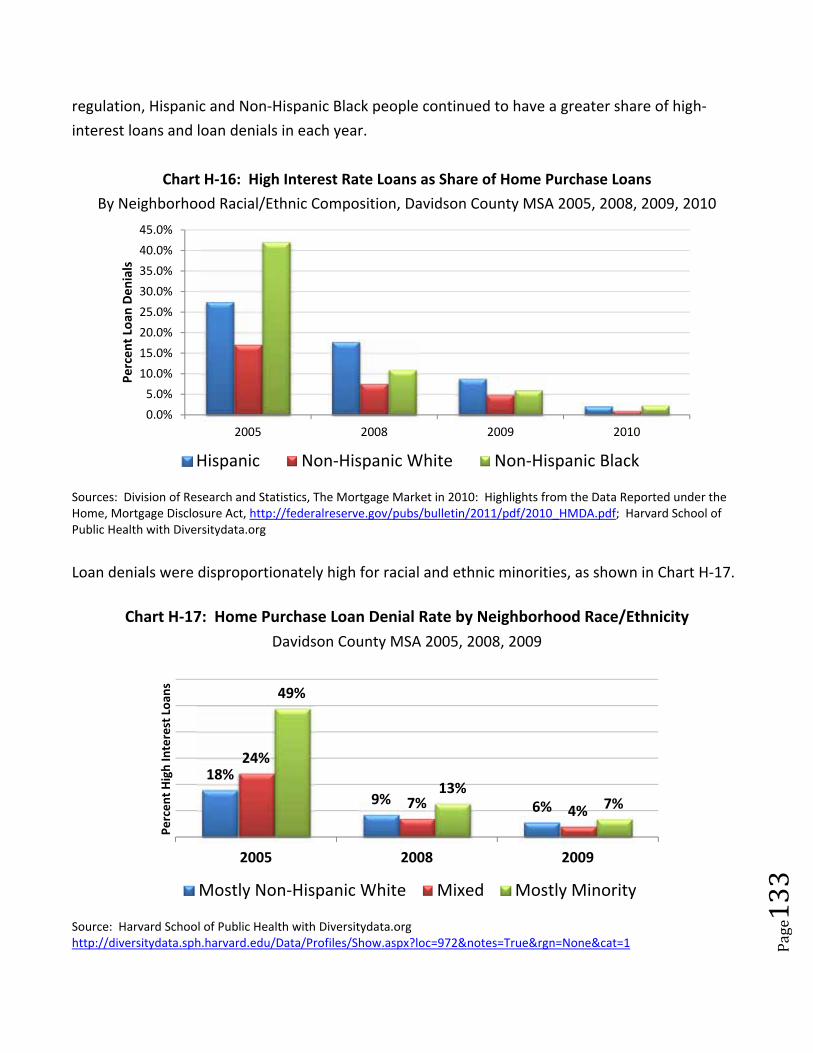
Page133
regulation, Hispanic and Non‐Hispanic Black people continued to have a greater share of high‐
interest loans and loan denials in each year.
Chart H‐16: High Interest Rate Loans as Share of Home Purchase Loans
By Neighborhood Racial/Ethnic Composition, Davidson County MSA 2005, 2008, 2009, 2010
Sources: Division of Research and Statistics, The Mortgage Market in 2010: Highlights from the Data Reported under the Home, Mortgage Disclosure Act, http://federalreserve.gov/pubs/bulletin/2011/pdf/2010_HMDA.pdf; Harvard School of Public Health with Diversitydata.org
Loan denials were disproportionately high for racial and ethnic minorities, as shown in Chart H‐17.
Chart H‐17: Home Purchase Loan Denial Rate by Neighborhood Race/Ethnicity
Davidson County MSA 2005, 2008, 2009
Source: Harvard School of Public Health with Diversitydata.org http://diversitydata.sph.harvard.edu/Data/Profiles/Show.aspx?loc=972¬es=True&rgn=None&cat=1
0.0%
5.0%
10.0%
15.0%
20.0%
25.0%
30.0%
35.0%
40.0%
45.0%
2005 2008 2009 2010
Percent Loan
Denials
Hispanic Non‐Hispanic White Non‐Hispanic Black
18%
9% 6%
24%
7% 4%
49%
13%7%
2005 2008 2009
Percent High In
terest Loan
s
Mostly Non‐Hispanic White Mixed Mostly Minority
Page134
Homelessness
In the 2010 Hunger and Homelessness Survey of 27 cities,
Nashville service providers’ responses indicated that among
households with children, the greatest cause of
homelessness was unemployment, followed by lack of
affordable housing and low wages. Conducted each year by
the U. S. Conference of Mayors, the report noted that for
individuals the lack of affordable housing was the main
reason for homelessness.
When asked what actions were needed to reduce homelessness in the survey cities, the number
one response was providing more mainstream assisted housing such as Housing Choice Vouchers.
The Housing Choice Voucher program of the U. S. Housing and Urban Development agency allows
participants to choose any housing in the private market that meets the requirements of the
program, and is not limited to units located in subsidized housing projects.
HUD describes a homeless person as an individual who lacks a fixed, regular and adequate
nighttime residence or whose nighttime residence is a supervised publicly or privately operated
shelter or an institution that provides temporary residence or a place not designed for a regular
sleeping accommodation for human beings.
The Metropolitan Government of Nashville and Davidson County has responded to the homeless
crisis by establishing the Metropolitan Homeless Commission. It began in 2005, tasked with
implementing a 10‐year Strategic Plan to End Chronic Homelessness. The Commission has since
“The causes of homelessness are complex and multiple. A slide into homelessness is the result of a number of economic and social factors that impact an individual or family at a personal level. No one chooses to be homeless and it can happen to anyone – from a teenager escaping an abusive home to a senior citizen on a fixed income who cannot cover a rent or tax increase, to a child whose parents suddenly become unemployed . . . There are many pathways to homelessness . . . Addressing the root causes is necessary to improve circumstances and foster stability in a person’s life.” (Homelessness Resource Center, U. S. Substance Abuse and Mental Health Services Administration)
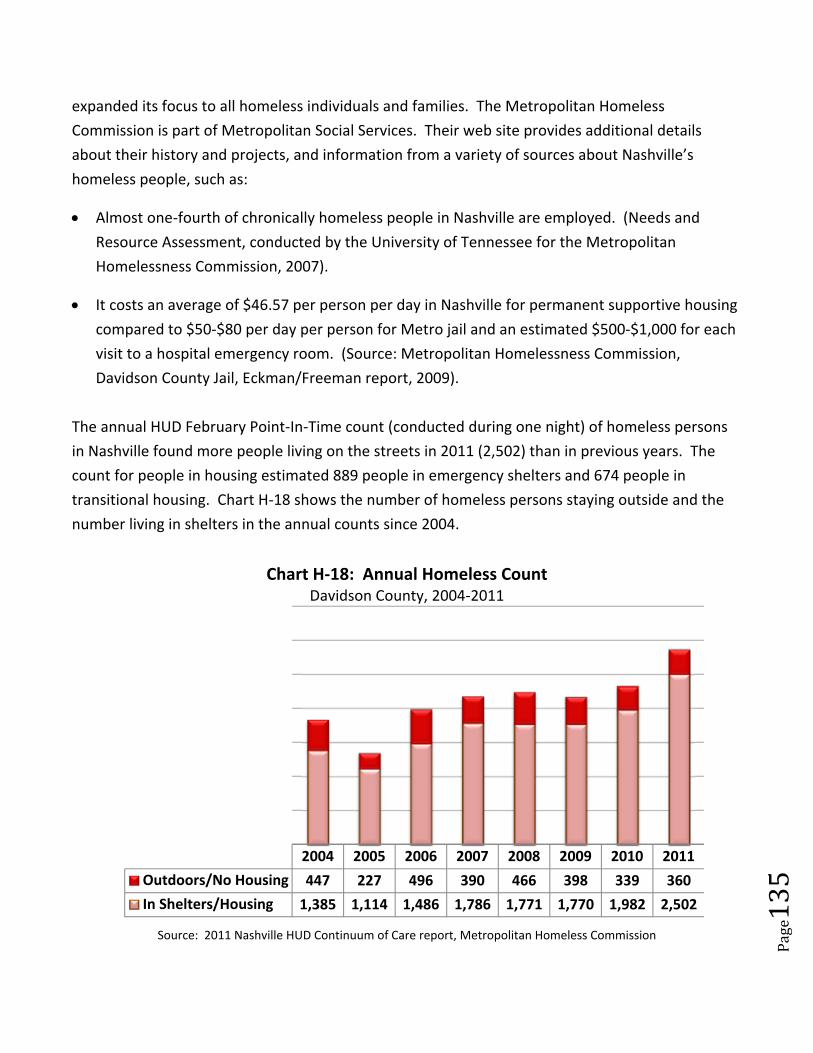
Page135
expanded its focus to all homeless individuals and families. The Metropolitan Homeless
Commission is part of Metropolitan Social Services. Their web site provides additional details
about their history and projects, and information from a variety of sources about Nashville’s
homeless people, such as:
Almost one‐fourth of chronically homeless people in Nashville are employed. (Needs and
Resource Assessment, conducted by the University of Tennessee for the Metropolitan
Homelessness Commission, 2007).
It costs an average of $46.57 per person per day in Nashville for permanent supportive housing
compared to $50‐$80 per day per person for Metro jail and an estimated $500‐$1,000 for each
visit to a hospital emergency room. (Source: Metropolitan Homelessness Commission,
Davidson County Jail, Eckman/Freeman report, 2009).
The annual HUD February Point‐In‐Time count (conducted during one night) of homeless persons
in Nashville found more people living on the streets in 2011 (2,502) than in previous years. The
count for people in housing estimated 889 people in emergency shelters and 674 people in
transitional housing. Chart H‐18 shows the number of homeless persons staying outside and the
number living in shelters in the annual counts since 2004.
Chart H‐18: Annual Homeless Count Davidson County, 2004‐2011
Source: 2011 Nashville HUD Continuum of Care report, Metropolitan Homeless Commission
2004 2005 2006 2007 2008 2009 2010 2011
Outdoors/No Housing 447 227 496 390 466 398 339 360
In Shelters/Housing 1,385 1,114 1,486 1,786 1,771 1,770 1,982 2,502
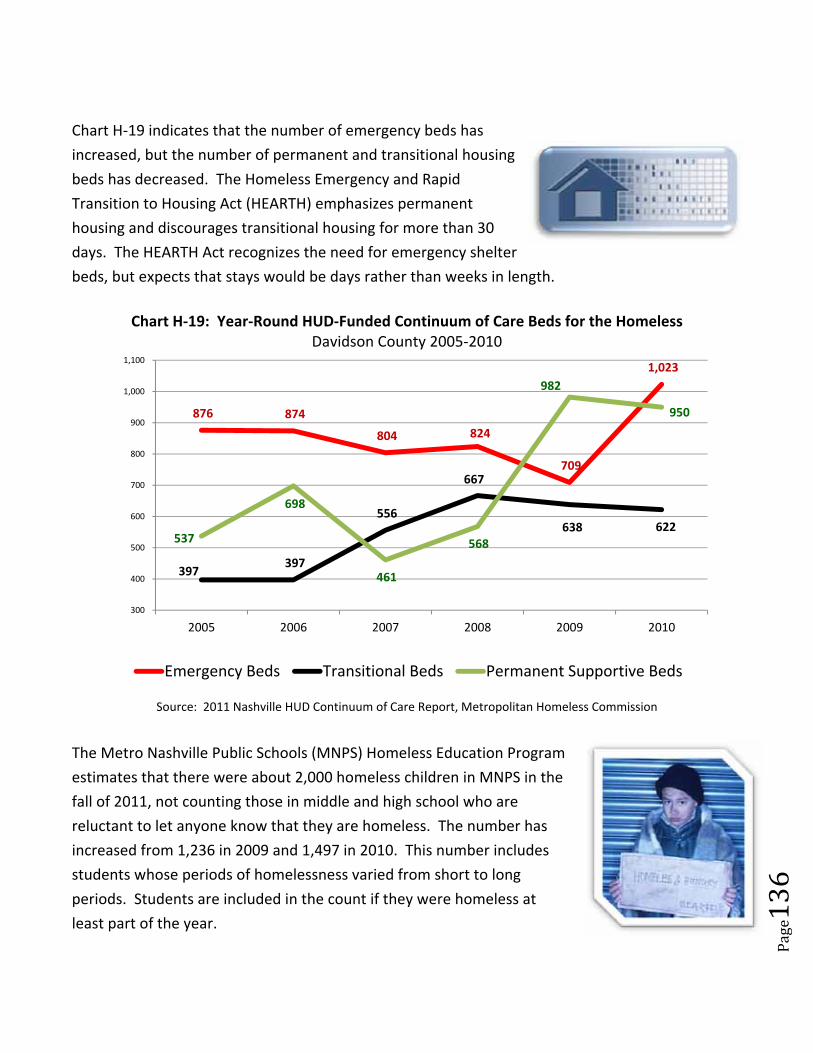
Page136
Chart H‐19 indicates that the number of emergency beds has
increased, but the number of permanent and transitional housing
beds has decreased. The Homeless Emergency and Rapid
Transition to Housing Act (HEARTH) emphasizes permanent
housing and discourages transitional housing for more than 30
days. The HEARTH Act recognizes the need for emergency shelter
beds, but expects that stays would be days rather than weeks in length.
Chart H‐19: Year‐Round HUD‐Funded Continuum of Care Beds for the Homeless
Davidson County 2005‐2010
Source: 2011 Nashville HUD Continuum of Care Report, Metropolitan Homeless Commission
The Metro Nashville Public Schools (MNPS) Homeless Education Program
estimates that there were about 2,000 homeless children in MNPS in the
fall of 2011, not counting those in middle and high school who are
reluctant to let anyone know that they are homeless. The number has
increased from 1,236 in 2009 and 1,497 in 2010. This number includes
students whose periods of homelessness varied from short to long
periods. Students are included in the count if they were homeless at
least part of the year.
876 874
804 824
709
1,023
397 397
556
667
638 622 537
698
461
568
982
950
300
400
500
600
700
800
900
1,000
1,100
2005 2006 2007 2008 2009 2010
Emergency Beds Transitional Beds Permanent Supportive Beds
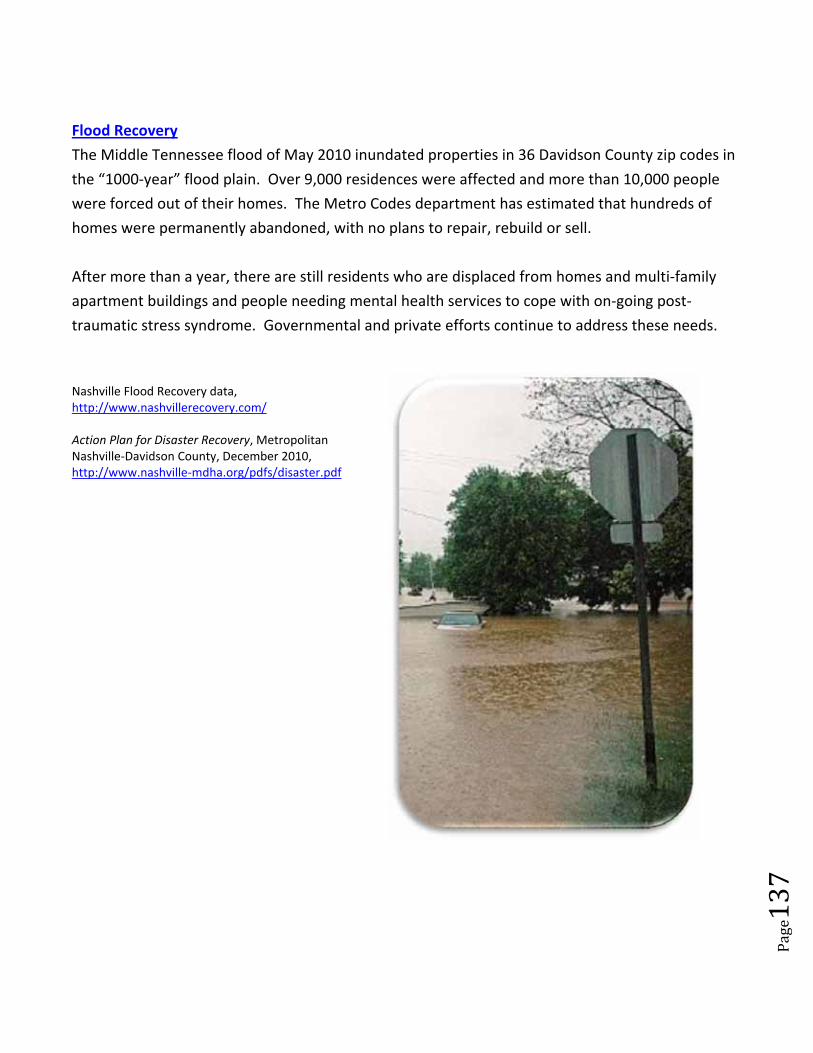
Page137
Flood Recovery
The Middle Tennessee flood of May 2010 inundated properties in 36 Davidson County zip codes in
the “1000‐year” flood plain. Over 9,000 residences were affected and more than 10,000 people
were forced out of their homes. The Metro Codes department has estimated that hundreds of
homes were permanently abandoned, with no plans to repair, rebuild or sell.
After more than a year, there are still residents who are displaced from homes and multi‐family
apartment buildings and people needing mental health services to cope with on‐going post‐
traumatic stress syndrome. Governmental and private efforts continue to address these needs.
Nashville Flood Recovery data, http://www.nashvillerecovery.com/ Action Plan for Disaster Recovery, Metropolitan Nashville‐Davidson County, December 2010, http://www.nashville‐mdha.org/pdfs/disaster.pdf
Page138
BEST PRACTICES – Examples for Housing
Inclusionary Zoning
Description
Inclusionary Zoning (IZ) refers to city or county ordinances specifying that a share of new housing
construction must be affordable by people with low to moderate incomes. The requirement can be
mandatory or voluntary. It is a tool for local governments to encourage a wider range of housing
options than the free market produces.
Inclusionary Zoning falls into three broad categories:
1. Mandatory Programs contain government‐mandated requirements. An example would be to
require that at least 20% of the units in new development be affordable to people earning wages
equal to or below the county’s area median income.
2. Voluntary IZ programs provide incentives such as allowing greater density, smaller lot sizes, etc., to
encourage developer participation when the apply for a building permit. These IZ programs are
usually the easiest to employ since participation is voluntary.
3. Conditional Programs require that a property owner request that the property be considered for
inclusionary zoning, in order to take advantage of incentives that are defined. These incentives can
be negotiated for each property.
Rationale
Montgomery County, Maryland, is widely considered a successful example of Inclusionary Zoning, with
its Moderately Priced Dwelling Unit (MPDU) program. In the past 36 years, the program has produced
more than 11,000 affordable housing units. This success is even more laudable because the program
serves households with a lower percentage of area minimum income than many other programs.
Montgomery County’s mandatory program requires residential developments of 50 or more units to
make a percentage of the units affordable to low‐ and moderate‐income families. The program
includes incentives for developers to provide affordable housing, such as density bonuses (allowing
more housing on a property than what would ordinarily be allowed), height allowances and reduced
parking requirements.
Potential challenges for Davidson County
A program similar to that of Montgomery County, MD, has been proposed for Davidson County. In
December of 2008, a resolution was passed by Metro Council requesting the Metro Planning
Page139
Department “to develop a plan for the equitable distribution of affordable housing throughout
Metropolitan Nashville and Davidson County” (resolution RS2008‐553).
The report notes that successful programs have been funded by Housing Trust Funds in other
locations, with goals tailored to the communities. They generally use tax‐exempt or general‐obligation
bonds to provide a dedicated source of funding for housing affordable to low‐ and moderate‐income
families.
Steps to Operate in Davidson County
A Planning Department staff member developed a document responding to the resolution. The
document recommended several actions:
1. Restructure the zoning code to expand opportunities for mixed use (commercial & residential) and
mixed housing (diversity of housing types and prices)
2. Expand the use of accessory apartments (also called “mother‐in‐law apartments) to provide
additional housing in smaller units that would blend into the neighborhood
3. Discourage downzoning, i.e. zoning for only single‐family detached units, which results in low‐
income housing being concentrated in neighborhoods which already allow multiple‐family housing
(often in lower‐income neighborhoods, rarely in middle‐ or upper‐income neighborhoods).
4. Encourage conservation subdivisions, which group homes more closely together while preserving
open space around the grouping. This would be an alternative to preserving open space by zoning
only large lots.
5. Reduce parking standards/requirements to encourage the use of public transit. The report notes
that many dwellers in affordable housing already use public transit, reducing the need for parking
space.
http://www.bpichicago.org/documents/impact_iz_development.pdf
http://www.nahb.org/fileUpload_details.aspx?contentTypeID=3&contentID=159814&subContentID=355774
http://www.cues.fau.edu/toolbox/about_us.asp
http://www.1000fof.org/
http://sogweb.sog.unc.edu/blogs/localgovt/?p=3525
http://www.inhousing.org/IHwhy.html
http://www.nhc.org/publications/Housing‐and‐Education.html
http://www.montgomerycountymd.gov/content/DHCA/community/pdf/rr‐ahtf.pdf.
http://www.bocyf.org/children_who_move_burkam_paper.pdf
Page140
BEST PRACTICES – Examples for Housing
Housing Trust Funds
Description
In Davidson County, the flood of May 2010 and the economic downturn, including the subsequent high
unemployment rate, dramatically increased the need for affordable housing. Housing has become less
affordable not only for those in poverty, but also for formerly middle‐income families whose resources
were depleted due to loss of jobs or decreased income.
Housing Trust Funds (HTFs) are specific fund repositories established by local or state governments,
funded through dedicated public funding sources for the production and preservation of affordable
housing. Housing Trust Funds can receive private donations to augment ongoing government funding.
This type of fund was created in the mid‐1970s, and the number has since increased greatly since then.
The National Association of Realtors has estimated that there are over 650 housing trust funds in cities,
counties and states that generate over $1 billion a year to address housing needs. HTFs most often use
new revenue, such as a new tax or fee, which does not take funding from other programs.
Rationale
A permanent Affordable Housing Trust Fund was established in 1993 at the East Tennessee
Foundation, with start‐up funding provided by the Knoxville Community Development Corporation, the
city of Knoxville government and the Cornerstone Foundation. The East Tennessee Foundation (ETF) is
a public, nonprofit, community foundation similar to the Community Foundation of Middle Tennessee.
The ETF receives money for the HTF, invests and manages that money, and provides funding for
eligible agencies and programs.
There are three main reasons this model is advantageous.
1. There is a relatively stable source of funding through local government, augmented by funds from
the ETF and other sources.
2. The HTF is managed by an independent corporate [501(c)] entity (the ETF) under the direction of an
Advisory Board representing various stakeholders in the community, including representation of
local government.
3. This type of HTF can be designed to be flexible in the types of funding it can make available (e.g.
grants, deferred loans, rental assistance, incentives to developers) and the purposes for which the
funding can be used (e.g. new construction, down payment assistance, housing preservation,
emergency repairs, homeless shelters, housing‐related services, multifamily building).
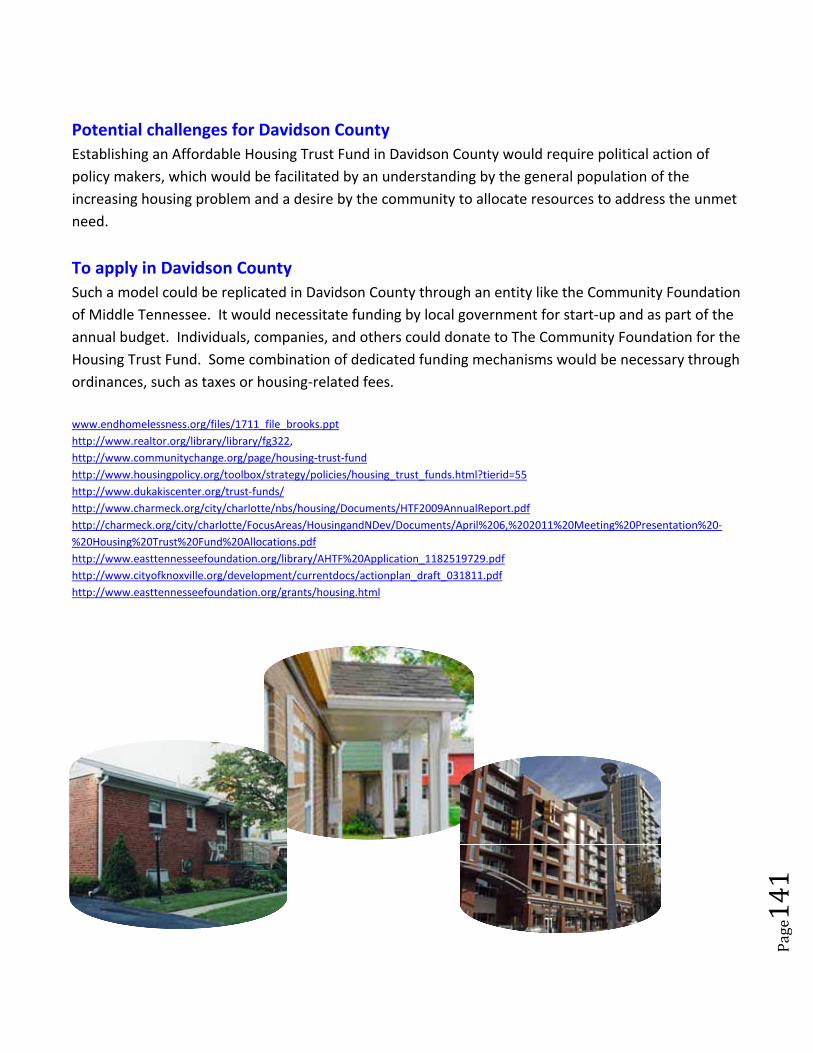
Page141
Potential challenges for Davidson County
Establishing an Affordable Housing Trust Fund in Davidson County would require political action of
policy makers, which would be facilitated by an understanding by the general population of the
increasing housing problem and a desire by the community to allocate resources to address the unmet
need.
To apply in Davidson County
Such a model could be replicated in Davidson County through an entity like the Community Foundation
of Middle Tennessee. It would necessitate funding by local government for start‐up and as part of the
annual budget. Individuals, companies, and others could donate to The Community Foundation for the
Housing Trust Fund. Some combination of dedicated funding mechanisms would be necessary through
ordinances, such as taxes or housing‐related fees.
www.endhomelessness.org/files/1711_file_brooks.ppt
http://www.realtor.org/library/library/fg322,
http://www.communitychange.org/page/housing‐trust‐fund
http://www.housingpolicy.org/toolbox/strategy/policies/housing_trust_funds.html?tierid=55
http://www.dukakiscenter.org/trust‐funds/
http://www.charmeck.org/city/charlotte/nbs/housing/Documents/HTF2009AnnualReport.pdf
http://charmeck.org/city/charlotte/FocusAreas/HousingandNDev/Documents/April%206,%202011%20Meeting%20Presentation%20‐
%20Housing%20Trust%20Fund%20Allocations.pdf
http://www.easttennesseefoundation.org/library/AHTF%20Application_1182519729.pdf
http://www.cityofknoxville.org/development/currentdocs/actionplan_draft_031811.pdf
http://www.easttennesseefoundation.org/grants/housing.html
Page142
Neighborhoods create and form communities that affect the residents and their city.
6% of the Nashville population uses public transportation as their primary source of
transportation, 18% walk or ride bikes and 74% drive alone or carpool.
The quality of public amenities like parks and recreation centers, the effectiveness of
institutions of public services, and the degree of exposure to violence tend to relate to
where one lives.
Three main qualities attract residents to neighborhoods are social offerings,
(entertainment venues and places to meet, openness), safe and welcome atmosphere,
and the area’s aesthetics (physical beauty, green spaces, etc.).
Over the past four decades, the percentage of families living in middle‐income
neighborhoods has declined.
Residents of poor segregated neighborhoods have less political influence than
residents of neighborhoods with more racial and economic diversity.
Addressing social and economic disparities and improving the conditions in which
people are born are essential to improving quality of life.
The U.S. Department of Housing Urban Development (HUD) defines a neighborhood as “a
geographic location designated in comprehensive plans, ordinances, or other local government
documents as a neighborhood."
The quality of life varies among neighborhood and is
related to factors such as poverty. In the 2012 Statistical
Abstract of the United States, the U. S. Census Bureau
analyzed 2009 data on occupied housing units nationwide.
In general, owners experienced more positive factors than
renters, among the general population and particularly in
the renters and owners who were below the poverty
level.
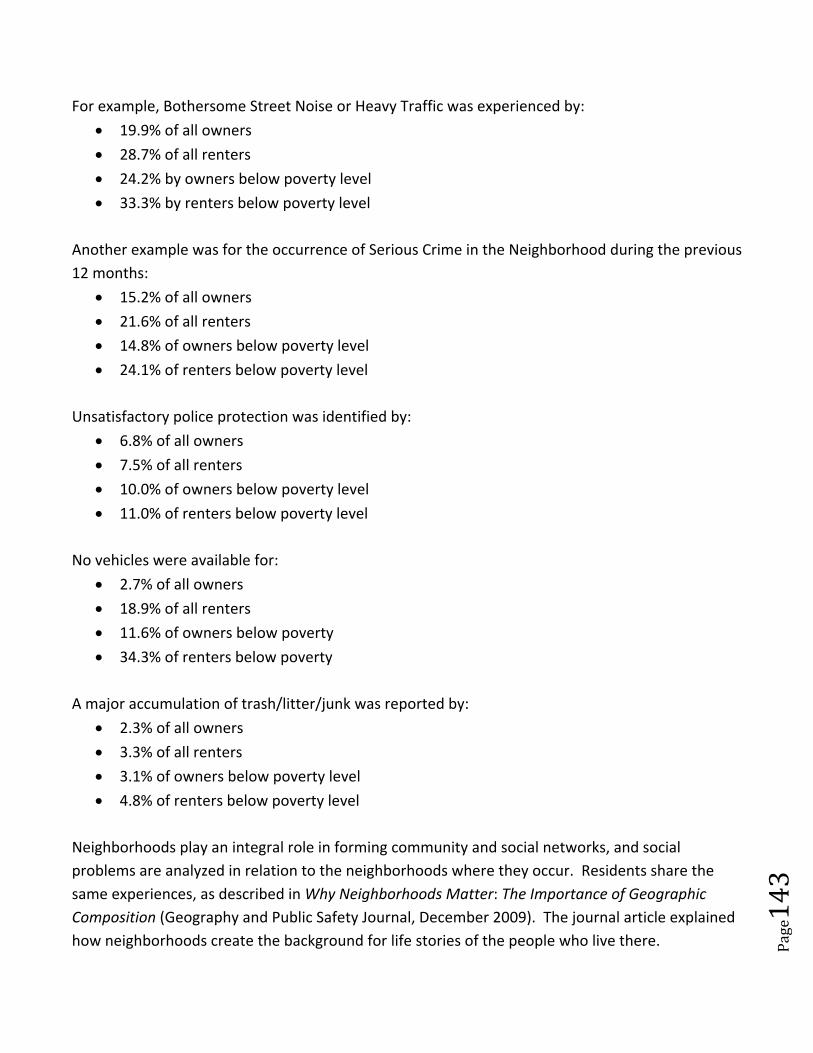
Page143
For example, Bothersome Street Noise or Heavy Traffic was experienced by:
19.9% of all owners
28.7% of all renters
24.2% by owners below poverty level
33.3% by renters below poverty level
Another example was for the occurrence of Serious Crime in the Neighborhood during the previous
12 months:
15.2% of all owners
21.6% of all renters
14.8% of owners below poverty level
24.1% of renters below poverty level
Unsatisfactory police protection was identified by:
6.8% of all owners
7.5% of all renters
10.0% of owners below poverty level
11.0% of renters below poverty level
No vehicles were available for:
2.7% of all owners
18.9% of all renters
11.6% of owners below poverty
34.3% of renters below poverty
A major accumulation of trash/litter/junk was reported by:
2.3% of all owners
3.3% of all renters
3.1% of owners below poverty level
4.8% of renters below poverty level
Neighborhoods play an integral role in forming community and social networks, and social
problems are analyzed in relation to the neighborhoods where they occur. Residents share the
same experiences, as described in Why Neighborhoods Matter: The Importance of Geographic
Composition (Geography and Public Safety Journal, December 2009). The journal article explained
how neighborhoods create the background for life stories of the people who live there.
Page144
Neighborhoods leave lasting impressions on residents about what life is like in a community, and
the time they spend in neighborhoods is related to the degree of the effect on residents.
The neighborhood becomes the focal point for residents,
businesses, visitors, and government to take action and
resolve problems using immediate and practical solutions.
For instance, crime studies use the concept of a neighborhood
to help understand why crime occurs more in some places
than in others. Nationwide data is available for interactive
maps: http://www.crimemapping.com/about.aspx
Neighborhood and Community Involvement
Community involvement is a very important aspect of revitalization for any neighborhood,
regardless of the geographic area. Concept 2010: A General Plan for Nashville‐Davidson County
was developed by the Metropolitan Planning Department as a general plan for the Metropolitan
Government of Nashville and Davidson County to preserve and enhance the local quality of life and
coordinate the anticipated growth and development with the city’s resources. Concept 2010
described how a good residential environment helps to attract businesses, preserve and enhance
the integrity of residential neighborhoods and plan services and amenities for a growing and
diverse population. It notes that it is important to balance the demands of the residential areas,
businesses, and the natural environment to enhance the overall quality of life for Davidson County
residents.
Concept 2010 Plan was initially developed in 1992, with the related Community Character Manual
(CCM) created and adopted in 2008 by the Metropolitan Planning Commission as the functional
planning component to the Nashville Concept 2010. The CCM expanded the focus of planning
from land use and density to a greater emphasis on form and character of development, ranging
from orientation and scale of buildings to the location of access and parking.
The result of work through the Concept 2010 Plan and CCM was to delineate specific community
divisions of Davidson County for planning purposes. Each Community’s Plan is updated every 7‐10
years through a process that engages community stakeholders (residents, property owners, busi‐
ness owners, institutional representatives, developers and elected officials). The process allows
for planning of future growth, development and preservation in Nashville communities.
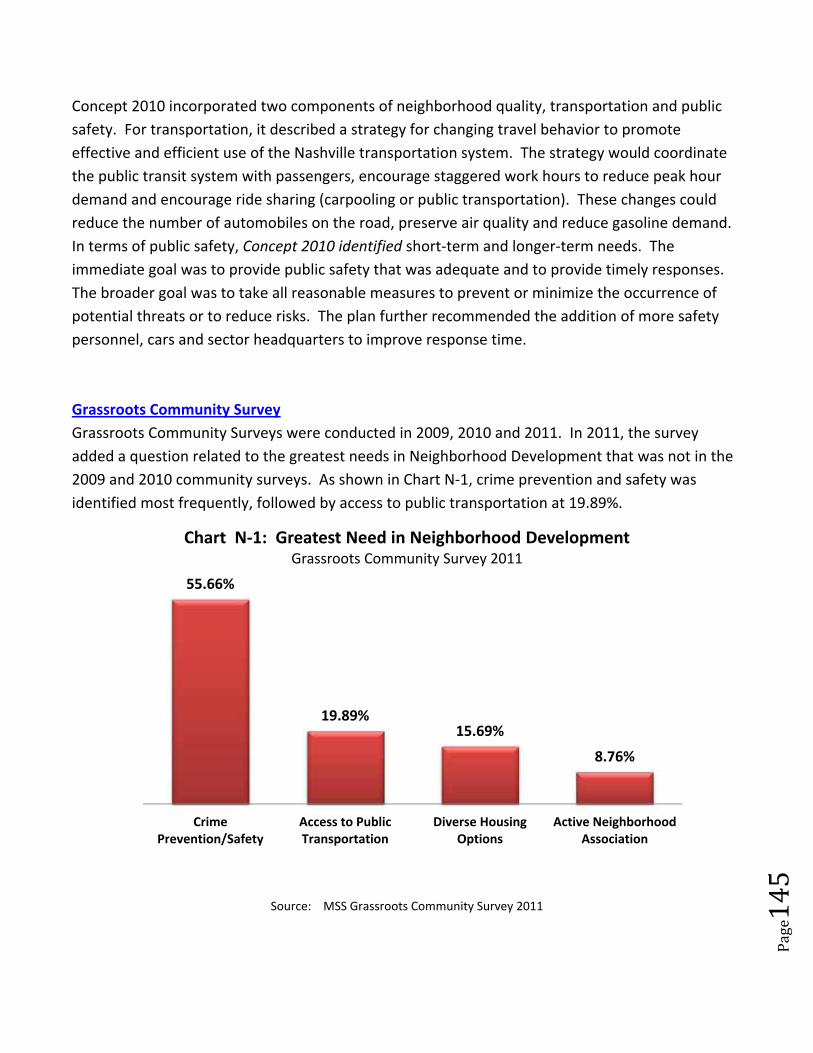
Page145
Concept 2010 incorporated two components of neighborhood quality, transportation and public
safety. For transportation, it described a strategy for changing travel behavior to promote
effective and efficient use of the Nashville transportation system. The strategy would coordinate
the public transit system with passengers, encourage staggered work hours to reduce peak hour
demand and encourage ride sharing (carpooling or public transportation). These changes could
reduce the number of automobiles on the road, preserve air quality and reduce gasoline demand.
In terms of public safety, Concept 2010 identified short‐term and longer‐term needs. The
immediate goal was to provide public safety that was adequate and to provide timely responses.
The broader goal was to take all reasonable measures to prevent or minimize the occurrence of
potential threats or to reduce risks. The plan further recommended the addition of more safety
personnel, cars and sector headquarters to improve response time.
Grassroots Community Survey
Grassroots Community Surveys were conducted in 2009, 2010 and 2011. In 2011, the survey
added a question related to the greatest needs in Neighborhood Development that was not in the
2009 and 2010 community surveys. As shown in Chart N‐1, crime prevention and safety was
identified most frequently, followed by access to public transportation at 19.89%.
Source: MSS Grassroots Community Survey 2011
55.66%
19.89%15.69%
8.76%
CrimePrevention/Safety
Access to PublicTransportation
Diverse HousingOptions
Active NeighborhoodAssociation
Chart N‐1: Greatest Need in Neighborhood DevelopmentGrassroots Community Survey 2011
Page146
Neighborhood Diversity
The United States is becoming more diverse, according to The Changing Demographic Profile of the
United States (U. S. Government Congressional Research Service, March 2011). It was reported
that the U.S. population is becoming both racially and ethnically more diverse. It described how
immigration has been a major influence on the age structure of the U.S. population. That is
because immigrants are often young adults, when people are most likely and willing to assume the
risks of moving to a new country.
The publication also noted that the changing demographic profile would affect a range of social
and economic issues in the United States such as:
The increasing financial pressure faced by public pension systems, such as Social Security,
which is often attributed to demographic trends that have led to aging populations.
However decreasing labor force participation rates have contributed to financial imbalances
within pension programs.
There are persistent differences in household incomes among racial/ethnic groups in the
United States (economic inequities). The 2010 American Community Survey has shown that
there are persistent income disparities between whites and people of color in the U.S.
Poverty is increasing while the median household income is declining.
The increase in poverty reflects deteriorating economic conditions since the onset of the
economic recession in December 2007 and is expected to remain somewhat elevated as the
economy recovers.
Urban neighborhood poverty that has been
persistent from one generation to the next is
impacted by the lack of opportunities found in poor,
racially segregated urban neighborhoods, according
to The Economic Mobility Project, of the Pew
Foundation.
The Urban Institute reported in the article Broad Improvements Mask Stark Differences in
Metropolitan Racial Segregation, August 2011 that that both cities and suburbs of most
metropolitan areas are more diverse. It also reported that historically, public policies played a
central role in establishing and enforcing patterns of racial segregation in American
Page147
neighborhoods. Discrimination, stereotypes, fears, disparities, and inequities of purchasing power
attribute to segregation in neighborhoods.
Gentrification
There is sometimes confusion about gentrification and the various ways it affects communities. As
summarized in Gentrification and Displacement (Janelle Vandergrift, Calvin College, 2006) various
descriptions can be use about gentrification:
Low‐income working class residents may be displaced from their neighborhood (Atkinson).
Gentrification is a process experienced by deprived inner‐city neighborhoods as they evolve
with new prestigious residential and consumption areas begin to be occupied by a new
class of highly skilled and highly paid residents. The new residents are typically business
service professionals who live in small, non‐familial households that may displace the
neighborhood’s initial population. (Van Criekingen and Decroly)
Gentrification is a neighborhood evolutionary process in which affluent, usually young,
households move into and upgrade distressed neighborhoods, with many of the
neighborhood’s original residents being displaced. (Bostic and Martin)
Gentrification may be driven by economic change and can involve racial components, as discussed
in New to the Neighborhood (Wilson Quarterly, Spring, 2011). It also noted that that gentrification
is considered as displacement and the impact could affect inner city efforts to revitalize.
Research for the Economic and Social Research Council (ESRC) Council for Neighborhood Research
sought to evaluate the impact of gentrification and revealed the following findings:
The negatives of gentrification compared with benefits for low‐income residents were
household displacement through increased rent and property prices, community conflict
and racial tension, landlord harassment, and lower population densities.
The positive neighborhood impacts of gentrification cited by the research were boost to city
tax revenues, increased property values, increased social mix, improvements to local
services, and improvement to the physical environment.
The research findings concluded that there is a danger that gentrification and private sector
investment are seen as solutions to the problems of deprived neighborhoods but the research
evidence also suggested that it could become socially divisive.
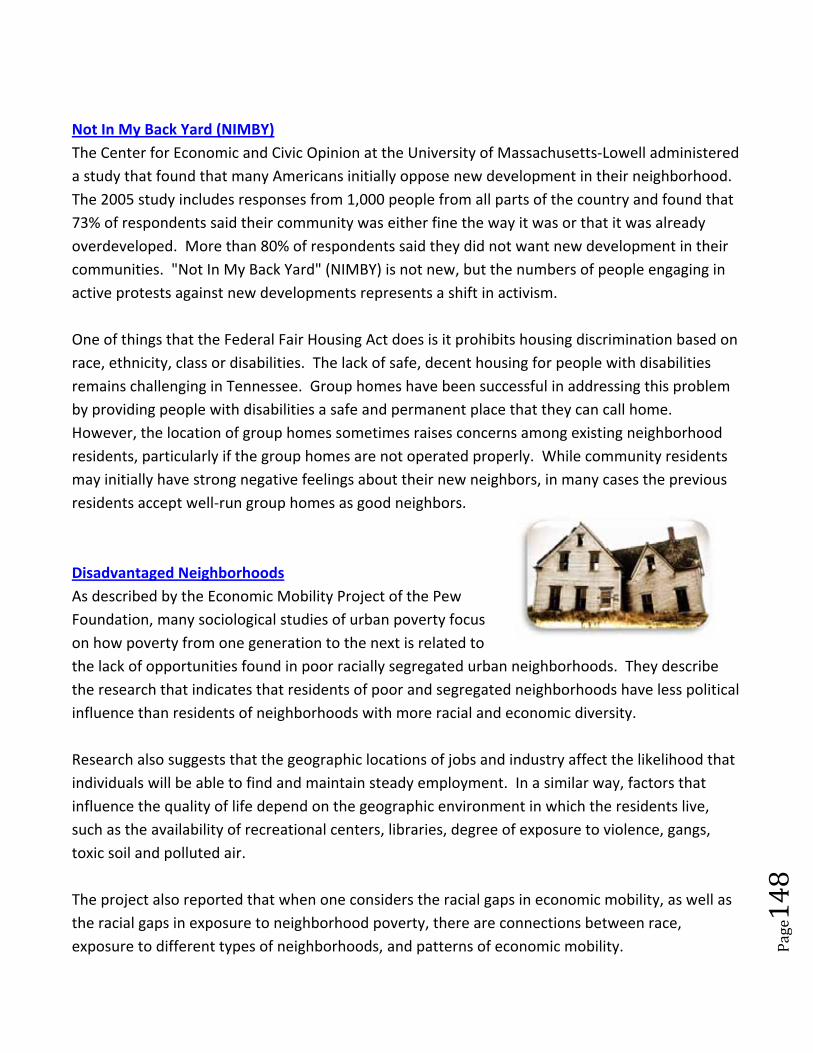
Page148
Not In My Back Yard (NIMBY)
The Center for Economic and Civic Opinion at the University of Massachusetts‐Lowell administered
a study that found that many Americans initially oppose new development in their neighborhood.
The 2005 study includes responses from 1,000 people from all parts of the country and found that
73% of respondents said their community was either fine the way it was or that it was already
overdeveloped. More than 80% of respondents said they did not want new development in their
communities. "Not In My Back Yard" (NIMBY) is not new, but the numbers of people engaging in
active protests against new developments represents a shift in activism.
One of things that the Federal Fair Housing Act does is it prohibits housing discrimination based on
race, ethnicity, class or disabilities. The lack of safe, decent housing for people with disabilities
remains challenging in Tennessee. Group homes have been successful in addressing this problem
by providing people with disabilities a safe and permanent place that they can call home.
However, the location of group homes sometimes raises concerns among existing neighborhood
residents, particularly if the group homes are not operated properly. While community residents
may initially have strong negative feelings about their new neighbors, in many cases the previous
residents accept well‐run group homes as good neighbors.
Disadvantaged Neighborhoods
As described by the Economic Mobility Project of the Pew
Foundation, many sociological studies of urban poverty focus
on how poverty from one generation to the next is related to
the lack of opportunities found in poor racially segregated urban neighborhoods. They describe
the research that indicates that residents of poor and segregated neighborhoods have less political
influence than residents of neighborhoods with more racial and economic diversity.
Research also suggests that the geographic locations of jobs and industry affect the likelihood that
individuals will be able to find and maintain steady employment. In a similar way, factors that
influence the quality of life depend on the geographic environment in which the residents live,
such as the availability of recreational centers, libraries, degree of exposure to violence, gangs,
toxic soil and polluted air.
The project also reported that when one considers the racial gaps in economic mobility, as well as
the racial gaps in exposure to neighborhood poverty, there are connections between race,
exposure to different types of neighborhoods, and patterns of economic mobility.
Page149
BEST PRACTICE – Example for Neighborhood Development
Measuring Neighborhood Quality With Indicators
Description
The Neighborhood Quality of Life Index was developed to measure neighborhood quality of life by
evaluating indicators of social, crime, physical and economic conditions in Charlotte, North
Carolina. The indicators from the Quality of Life Index created benchmarks for ongoing
monitoring, and/or renewals to address the neighborhoods of Charlotte.
Starting with the publication of the City Within A City (CWAC) Neighborhood Assessment in 1993,
city leaders and policy makers in Charlotte, had had a mechanism that enabled them to take a
detailed look at key issues related to neighborhood vitality. In 1997, they developed the Quality of
Life Index and evaluated the quality of life in 73 inner‐city neighborhoods by analyzing a wide
ranging set of locally determined indicators. In turn, these indicators were aggregated into social,
physical, crime, and economic dimensions that comprised quality of life score for each
neighborhood.
Individual neighborhoods were labeled Stable, Threatened, or Fragile, based upon the cumulative
indicator scores. The data presented resulted in a baseline of information that enabled the city to
carry out an ongoing review of neighborhood level quality of life, while measuring the outcomes of
initiatives to improve the neighborhoods.
Rationale
Evaluating neighborhood quality using specific indicators from the Quality of Life Index has been
used effectively for city planning and renewal in Charlotte. By objectively tracking neighborhood
conditions related to crime, physical setting and the economic status, they can target efforts to
address the specific problems in each neighborhood.
The index has been an effective tool used to develop action/work plans, determine resource
allocation, Identify capacity‐building opportunities, and inspires disparate groups to work
collaboratively on a shared set of goals. Neighborhood associations also use the information to
understand their communities and develop their work plans.
Page150
Potential Challenges for Davidson County
The quality of life study uses 20 indicators to evaluate the conditions of the neighborhoods.
With the limited data access and time constraints, it may not be feasible to track this
number of measures.
Low‐income neighborhoods residents in Davidson County are often not actively involved in
the evaluation of their neighborhood needs, development of plans or capacity building with
the local government officials. For these areas that may have lower measures of
neighborhood quality than other areas, it is important that the residents be involved
throughout the process.
Steps to Operate in Davidson County
Specific and relevant quality of life indicators should be selected that impact social, crime,
physical and economic conditions of neighborhoods, especially in low‐income areas that
have fewer services and amenities.
Engage universities in developing the process of tracking and measuring neighborhoods.
Gather data from appropriate government and other sources to analyze the indicators in
neighborhoods.
Engage neighborhood associations, local government and others from the community to
develop action plans and capacity building.
Provide regular monitoring of indicators in neighborhoods to assess progress and identify
areas that need additional attention.
Page151
After the Great Recession, there was a continued employment decline with the longest
duration of unemployment since the early 1980s. Some studies suggest that the current
economic slowdown is not just cyclical but also structural, in which fundamental changes
occur on how we produce goods and services and what is produced.
The local economy is now growing, but it is not accompanied by increased employment
that would affect the unemployment rate. The recent recession followed a typical
historical pattern of decreased employment in the manufacturing sector and light
assembly jobs. While in the past, this type of situation provided job opportunities for the
low‐skilled, low‐income population, it is less likely in the current knowledge economy.
In moving toward global competitiveness and modes of production with advanced
technology, it is more challenging for workers who have limited skills to compete. There
is a mismatched workforce, where large pools of unemployed workers do not possess the
skill sets needed in high‐demand high‐paying jobs that are available in some leading
industries.
Many who live in poverty do not have access to opportunities that would help them
acquire these skills, so they remain unprepared for many of the job opportunities that
become available. However, a recent shift on policy at the State level calls for more
Tennesseans to be better educated and trained, which ties funding to outcomes for
higher education institutions.
Those in physically demanding jobs such as manufacturing and construction were also hit
harder by the economic downturn than those in professional jobs. Occupations in service
sectors have consistently been the leading type of employment in the local economy.
Younger workers of all ages and races have been disproportionally impacted. In
comparing racial differences, both male and female African Americans were most
seriously affected.
For those with lower incomes, it is important that they be able to use their financial
resources in ways that most effectively benefit their financial stability. Financial literacy
can help these families avoid exploitive financial alternatives and choose more affordable
and appropriate banking services. Better utilization of limited resources is an important
step toward financial stability and the opportunity to build assets.

Page152
Economic Recovery
Although the Great Recession was officially over by June of 2009, the nation’s economic growth
has been sluggish, as has the rate of job growth. According to the Bureau of Economic Analysis of
the U.S. Department of Commerce, the national Gross Domestic Product (GDP) is the output of
goods and services produced by labor and property located in the United States. The GDP grew
only 0.4% in the first quarter and 1.3 percent in the second quarter of this year (seasonally‐
adjusted annual rates).
A recent report by the Center for Business and Economic Research of University of Tennessee’s
College of Business Administration, Fall 2011 Tennessee Business and Economic Outlook, described
the depressed housing market, a labor market that cannot produce meaningful job gains, and
uncertainty and anxiety about the future as the
sources of the insufficient economic growth of
the United States economy.
The report indicates that inflation‐adjusted GDP
will see only 1.5% percent growth in 2011 and
1.8% growth in 2012, and less than 50% chances
of a negative GDP growth.
The national unemployment rate is expected to
remain above 9% at least through 2012. The
report describes how the growth of Tennessee’s
economy largely mirrors with that of the nation.
Non‐farm employment growth will remain weak, and the unemployment rate will average 9.7% in
2011 and 9.4% next year. However, the report also highlights some positive growth in Tennessee’s
revenues for this fiscal year. Local governments in Tennessee will continue to struggle to balance
their finances for the foreseeable future, as property taxes appear to be suffering from the housing
bubble.
http://cber.utk.edu/tefs/fall11.pdf
Nashville‐Davidson‐Murfreesboro‐Franklin Metropolitan Statistical Area shows a steady increase of
the local GDP in millions of current dollars. As Chart W‐1 shows, data from the Bureau of
Economic Analysis indicates that from 2009 to 2010 the GDP of this area has increased from about
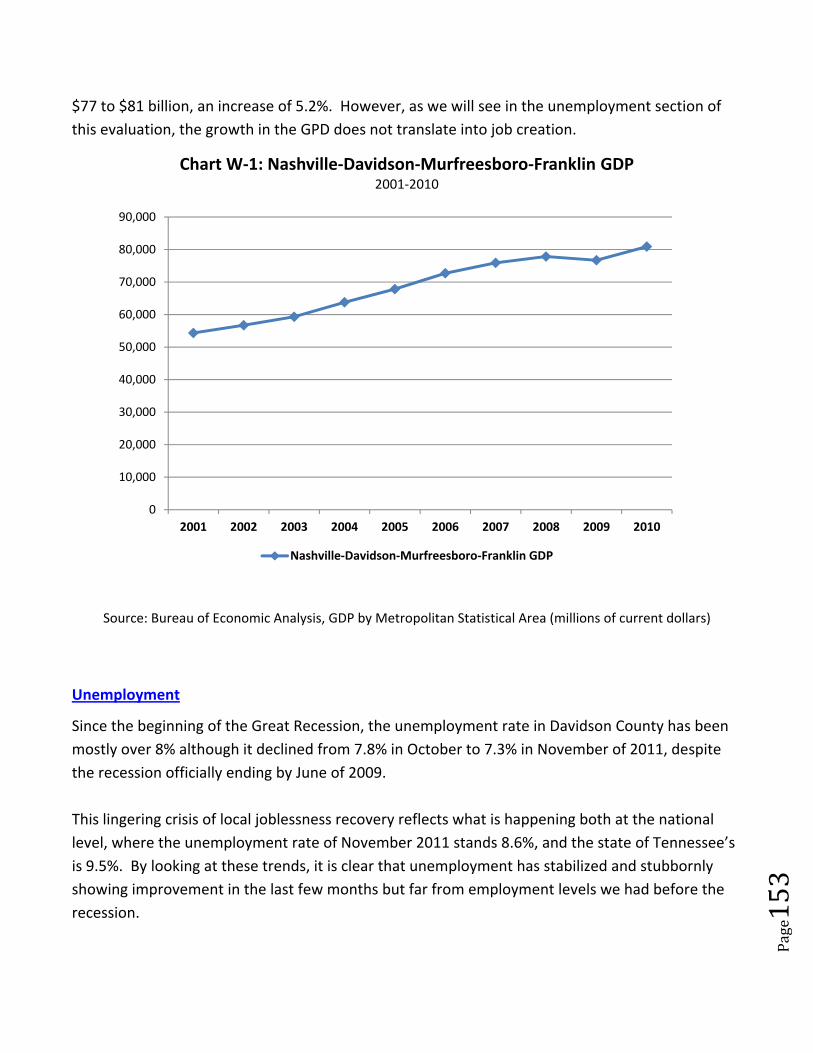
Page153
$77 to $81 billion, an increase of 5.2%. However, as we will see in the unemployment section of
this evaluation, the growth in the GPD does not translate into job creation.
Source: Bureau of Economic Analysis, GDP by Metropolitan Statistical Area (millions of current dollars)
Unemployment
Since the beginning of the Great Recession, the unemployment rate in Davidson County has been
mostly over 8% although it declined from 7.8% in October to 7.3% in November of 2011, despite
the recession officially ending by June of 2009.
This lingering crisis of local joblessness recovery reflects what is happening both at the national
level, where the unemployment rate of November 2011 stands 8.6%, and the state of Tennessee’s
is 9.5%. By looking at these trends, it is clear that unemployment has stabilized and stubbornly
showing improvement in the last few months but far from employment levels we had before the
recession.
0
10,000
20,000
30,000
40,000
50,000
60,000
70,000
80,000
90,000
2001 2002 2003 2004 2005 2006 2007 2008 2009 2010
Chart W‐1: Nashville‐Davidson‐Murfreesboro‐Franklin GDP2001‐2010
Nashville‐Davidson‐Murfreesboro‐Franklin GDP
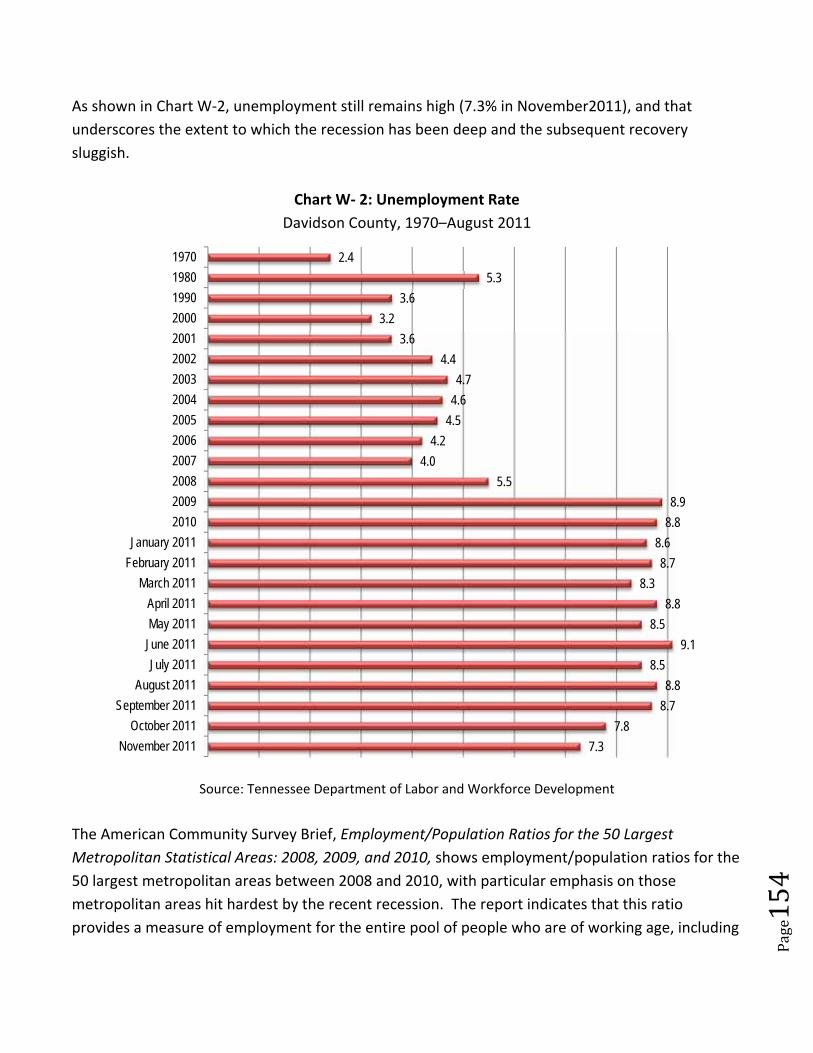
Page154
As shown in Chart W‐2, unemployment still remains high (7.3% in November2011), and that
underscores the extent to which the recession has been deep and the subsequent recovery
sluggish.
Chart W‐ 2: Unemployment Rate
Davidson County, 1970–August 2011
Source: Tennessee Department of Labor and Workforce Development
The American Community Survey Brief, Employment/Population Ratios for the 50 Largest
Metropolitan Statistical Areas: 2008, 2009, and 2010, shows employment/population ratios for the
50 largest metropolitan areas between 2008 and 2010, with particular emphasis on those
metropolitan areas hit hardest by the recent recession. The report indicates that this ratio
provides a measure of employment for the entire pool of people who are of working age, including
7.3
7.8
8.7
8.8
8.5
9.1
8.5
8.8
8.3
8.7
8.6
8.8
8.9
5.5
4.0
4.2
4.5
4.6
4.7
4.4
3.6
3.2
3.6
5.3
2.4
November 2011
October 2011
September 2011
August 2011
July 2011
June 2011
May 2011
April 2011
March 2011
February 2011
January 2011
2010
2009
2008
2007
2006
2005
2004
2003
2002
2001
2000
1990
1980
1970
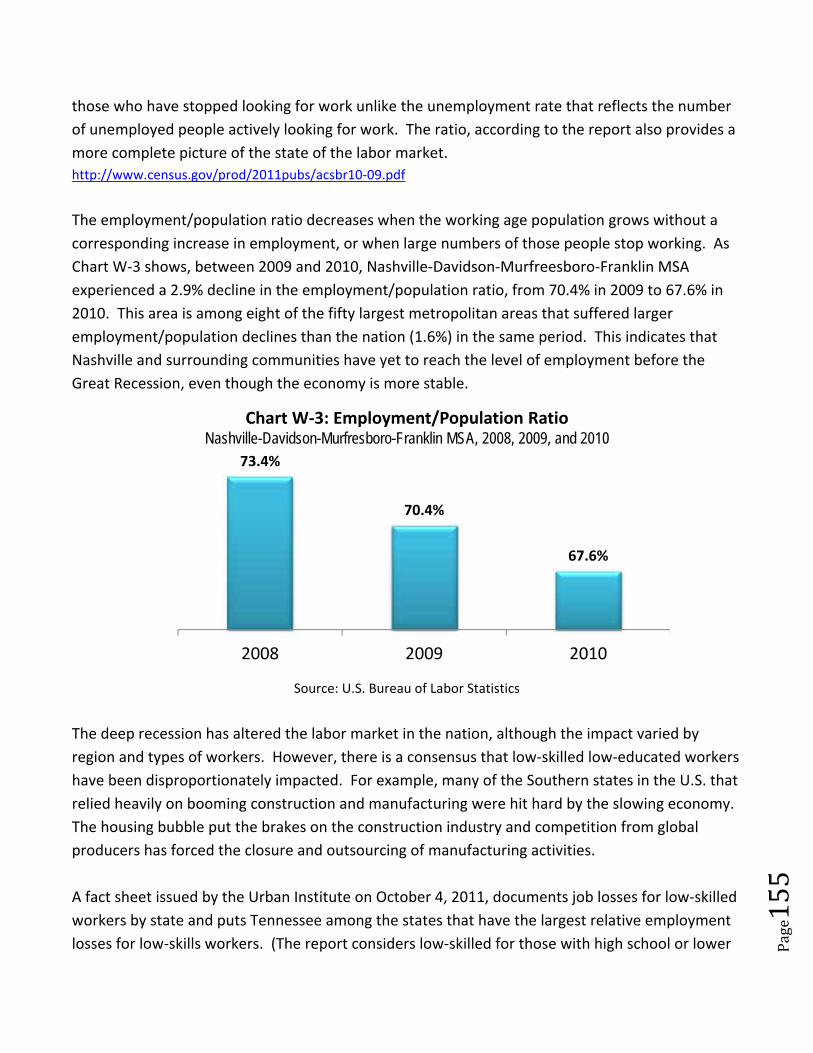
Page155
those who have stopped looking for work unlike the unemployment rate that reflects the number
of unemployed people actively looking for work. The ratio, according to the report also provides a
more complete picture of the state of the labor market.
http://www.census.gov/prod/2011pubs/acsbr10‐09.pdf
The employment/population ratio decreases when the working age population grows without a
corresponding increase in employment, or when large numbers of those people stop working. As
Chart W‐3 shows, between 2009 and 2010, Nashville‐Davidson‐Murfreesboro‐Franklin MSA
experienced a 2.9% decline in the employment/population ratio, from 70.4% in 2009 to 67.6% in
2010. This area is among eight of the fifty largest metropolitan areas that suffered larger
employment/population declines than the nation (1.6%) in the same period. This indicates that
Nashville and surrounding communities have yet to reach the level of employment before the
Great Recession, even though the economy is more stable.
Source: U.S. Bureau of Labor Statistics
The deep recession has altered the labor market in the nation, although the impact varied by
region and types of workers. However, there is a consensus that low‐skilled low‐educated workers
have been disproportionately impacted. For example, many of the Southern states in the U.S. that
relied heavily on booming construction and manufacturing were hit hard by the slowing economy.
The housing bubble put the brakes on the construction industry and competition from global
producers has forced the closure and outsourcing of manufacturing activities.
A fact sheet issued by the Urban Institute on October 4, 2011, documents job losses for low‐skilled
workers by state and puts Tennessee among the states that have the largest relative employment
losses for low‐skills workers. (The report considers low‐skilled for those with high school or lower
73.4%
70.4%
67.6%
2008 2009 2010
Chart W‐3: Employment/Population RatioNashville-Davidson-Murfresboro-Franklin MSA, 2008, 2009, and 2010
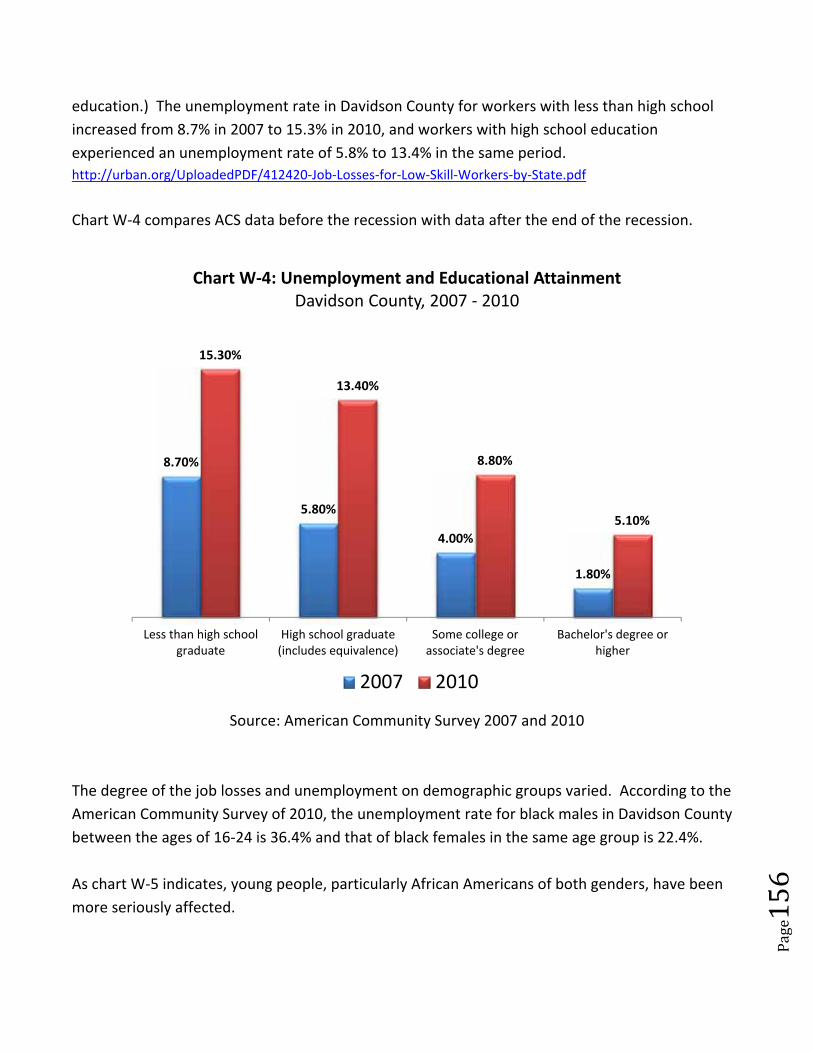
Page156
education.) The unemployment rate in Davidson County for workers with less than high school
increased from 8.7% in 2007 to 15.3% in 2010, and workers with high school education
experienced an unemployment rate of 5.8% to 13.4% in the same period.
http://urban.org/UploadedPDF/412420‐Job‐Losses‐for‐Low‐Skill‐Workers‐by‐State.pdf
Chart W‐4 compares ACS data before the recession with data after the end of the recession.
Source: American Community Survey 2007 and 2010
The degree of the job losses and unemployment on demographic groups varied. According to the
American Community Survey of 2010, the unemployment rate for black males in Davidson County
between the ages of 16‐24 is 36.4% and that of black females in the same age group is 22.4%.
As chart W‐5 indicates, young people, particularly African Americans of both genders, have been
more seriously affected.
8.70%
5.80%
4.00%
1.80%
15.30%
13.40%
8.80%
5.10%
Less than high schoolgraduate
High school graduate(includes equivalence)
Some college orassociate's degree
Bachelor's degree orhigher
Chart W‐4: Unemployment and Educational Attainment Davidson County, 2007 ‐ 2010
2007 2010
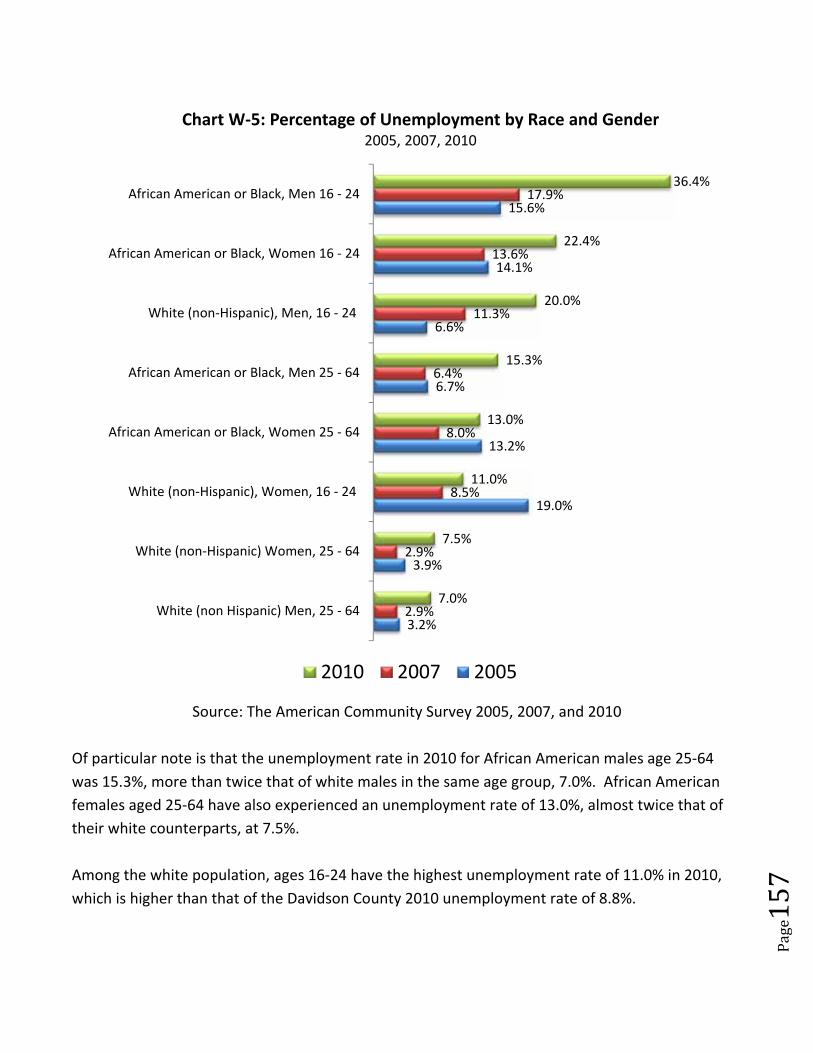
Page157
Source: The American Community Survey 2005, 2007, and 2010
Of particular note is that the unemployment rate in 2010 for African American males age 25‐64
was 15.3%, more than twice that of white males in the same age group, 7.0%. African American
females aged 25‐64 have also experienced an unemployment rate of 13.0%, almost twice that of
their white counterparts, at 7.5%.
Among the white population, ages 16‐24 have the highest unemployment rate of 11.0% in 2010,
which is higher than that of the Davidson County 2010 unemployment rate of 8.8%.
3.2%
3.9%
19.0%
13.2%
6.7%
6.6%
14.1%
15.6%
2.9%
2.9%
8.5%
8.0%
6.4%
11.3%
13.6%
17.9%
7.0%
7.5%
11.0%
13.0%
15.3%
20.0%
22.4%
36.4%
White (non Hispanic) Men, 25 ‐ 64
White (non‐Hispanic) Women, 25 ‐ 64
White (non‐Hispanic), Women, 16 ‐ 24
African American or Black, Women 25 ‐ 64
African American or Black, Men 25 ‐ 64
White (non‐Hispanic), Men, 16 ‐ 24
African American or Black, Women 16 ‐ 24
African American or Black, Men 16 ‐ 24
Chart W‐5: Percentage of Unemployment by Race and Gender2005, 2007, 2010
2010 2007 2005
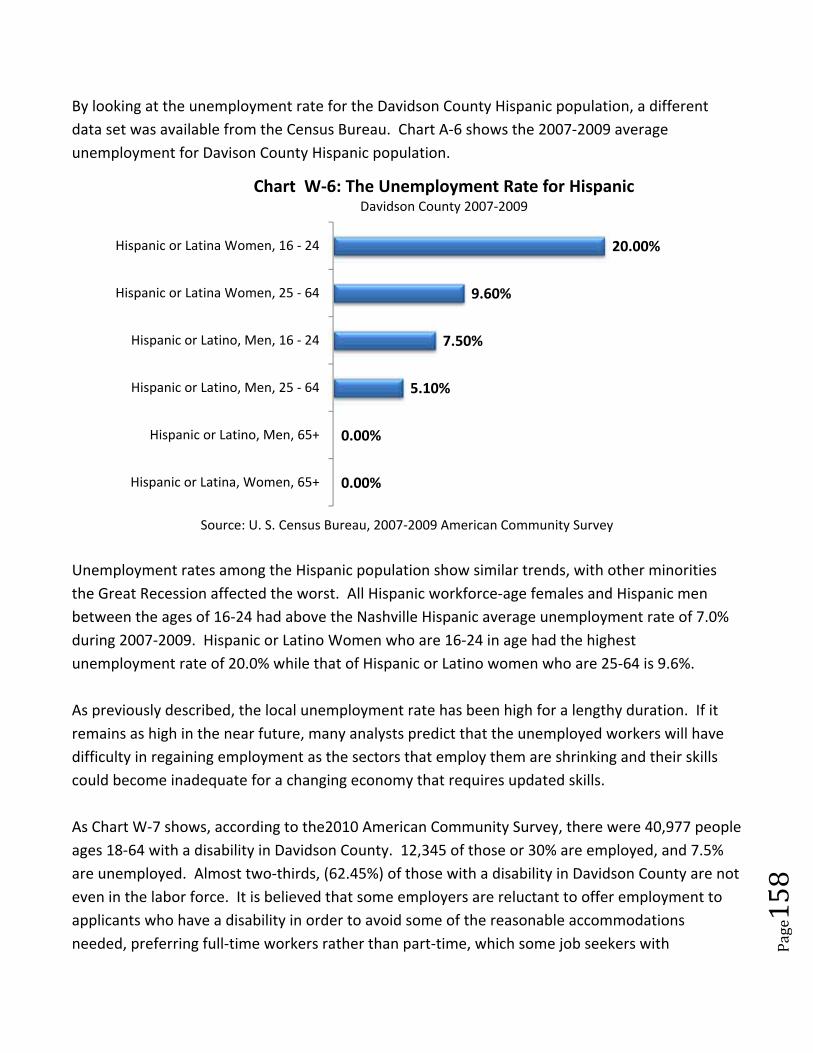
Page158
By looking at the unemployment rate for the Davidson County Hispanic population, a different
data set was available from the Census Bureau. Chart A‐6 shows the 2007‐2009 average
unemployment for Davison County Hispanic population.
Source: U. S. Census Bureau, 2007‐2009 American Community Survey
Unemployment rates among the Hispanic population show similar trends, with other minorities
the Great Recession affected the worst. All Hispanic workforce‐age females and Hispanic men
between the ages of 16‐24 had above the Nashville Hispanic average unemployment rate of 7.0%
during 2007‐2009. Hispanic or Latino Women who are 16‐24 in age had the highest
unemployment rate of 20.0% while that of Hispanic or Latino women who are 25‐64 is 9.6%.
As previously described, the local unemployment rate has been high for a lengthy duration. If it
remains as high in the near future, many analysts predict that the unemployed workers will have
difficulty in regaining employment as the sectors that employ them are shrinking and their skills
could become inadequate for a changing economy that requires updated skills.
As Chart W‐7 shows, according to the2010 American Community Survey, there were 40,977 people
ages 18‐64 with a disability in Davidson County. 12,345 of those or 30% are employed, and 7.5%
are unemployed. Almost two‐thirds, (62.45%) of those with a disability in Davidson County are not
even in the labor force. It is believed that some employers are reluctant to offer employment to
applicants who have a disability in order to avoid some of the reasonable accommodations
needed, preferring full‐time workers rather than part‐time, which some job seekers with
0.00%
0.00%
5.10%
7.50%
9.60%
20.00%
Hispanic or Latina, Women, 65+
Hispanic or Latino, Men, 65+
Hispanic or Latino, Men, 25 ‐ 64
Hispanic or Latino, Men, 16 ‐ 24
Hispanic or Latina Women, 25 ‐ 64
Hispanic or Latina Women, 16 ‐ 24
Chart W‐6: The Unemployment Rate for HispanicDavidson County 2007‐2009
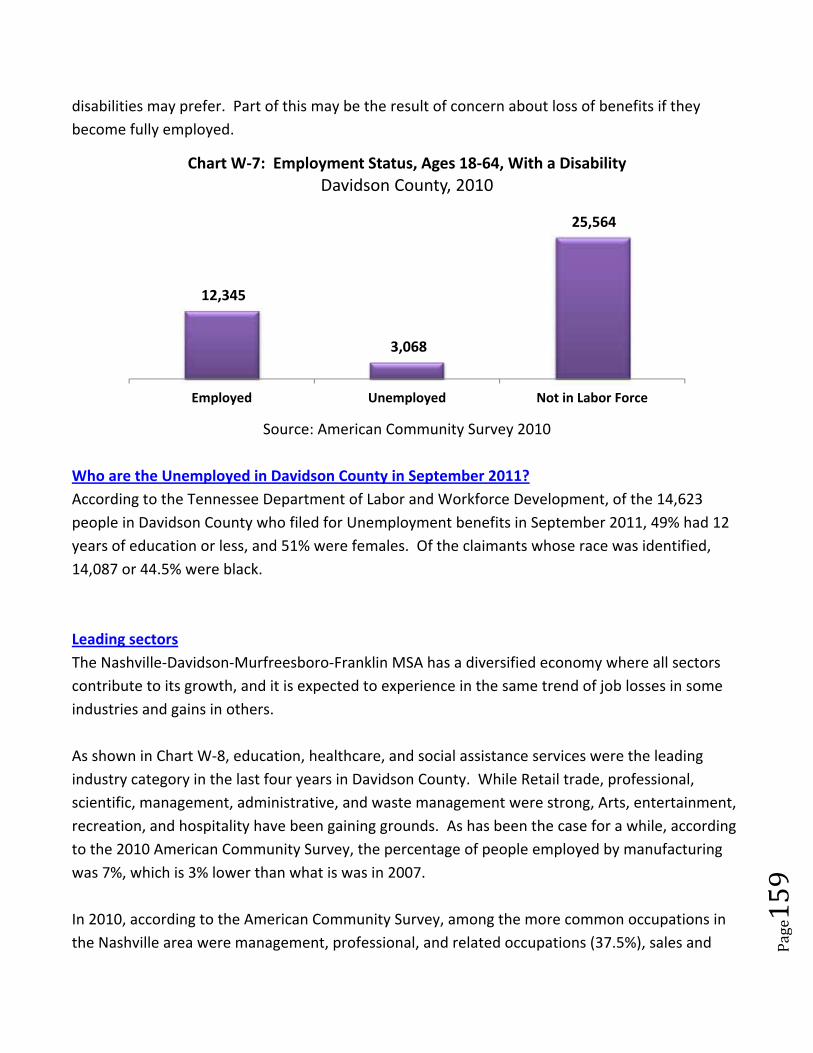
Page159
disabilities may prefer. Part of this may be the result of concern about loss of benefits if they
become fully employed.
Source: American Community Survey 2010
Who are the Unemployed in Davidson County in September 2011?
According to the Tennessee Department of Labor and Workforce Development, of the 14,623
people in Davidson County who filed for Unemployment benefits in September 2011, 49% had 12
years of education or less, and 51% were females. Of the claimants whose race was identified,
14,087 or 44.5% were black.
Leading sectors
The Nashville‐Davidson‐Murfreesboro‐Franklin MSA has a diversified economy where all sectors
contribute to its growth, and it is expected to experience in the same trend of job losses in some
industries and gains in others.
As shown in Chart W‐8, education, healthcare, and social assistance services were the leading
industry category in the last four years in Davidson County. While Retail trade, professional,
scientific, management, administrative, and waste management were strong, Arts, entertainment,
recreation, and hospitality have been gaining grounds. As has been the case for a while, according
to the 2010 American Community Survey, the percentage of people employed by manufacturing
was 7%, which is 3% lower than what is was in 2007.
In 2010, according to the American Community Survey, among the more common occupations in
the Nashville area were management, professional, and related occupations (37.5%), sales and
12,345
3,068
25,564
Employed Unemployed Not in Labor Force
Chart W‐7: Employment Status, Ages 18‐64, With a Disability
Davidson County, 2010
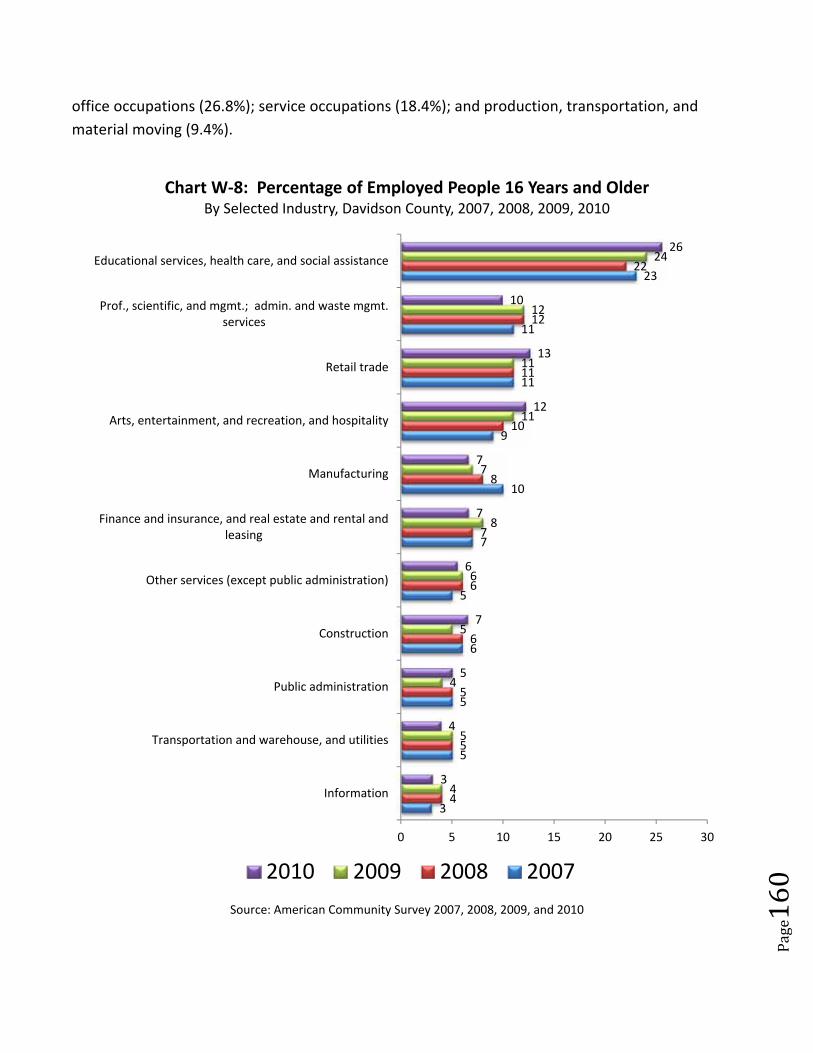
Page160
office occupations (26.8%); service occupations (18.4%); and production, transportation, and
material moving (9.4%).
Source: American Community Survey 2007, 2008, 2009, and 2010
3
5
5
6
5
7
10
9
11
11
23
4
5
5
6
6
7
8
10
11
12
22
4
5
4
5
6
8
7
11
11
12
24
3
4
5
7
6
7
7
12
13
10
26
0 5 10 15 20 25 30
Information
Transportation and warehouse, and utilities
Public administration
Construction
Other services (except public administration)
Finance and insurance, and real estate and rental andleasing
Manufacturing
Arts, entertainment, and recreation, and hospitality
Retail trade
Prof., scientific, and mgmt.; admin. and waste mgmt.services
Educational services, health care, and social assistance
Chart W‐8: Percentage of Employed People 16 Years and OlderBy Selected Industry, Davidson County, 2007, 2008, 2009, 2010
2010 2009 2008 2007
Page161
Economic Opportunity
Many low‐income workers spend a higher proportion of their incomes on costly items and
services, which presents a significant barrier to the asset building that is necessary for financial
stability to improve their lives. Many of them face the overwhelming task of allocating their
limited resources to the many competing needs with which they struggle. There are opportunities
for wealth‐building that could greatly benefit those in need. However, many low‐income workers
are unable to take advantage of avenues for saving and qualifying for conventional loans. If
affordable banking services are available to this demographic group, it could have a positive impact
on their financial stability. Many non‐traditional banking companies may use exploitive
techniques, to the financial detriment of those who use them.
One of the most beneficial programs for low‐income working households is the Earned Income Tax
Credit (EITC). The Internal Revenue Service (IRS), describes the EITC as a tax credit for certain
people who work and have low wages. A tax credit reduces the amount of tax owed, resulting in a
greater refund for income‐eligible families. Unfortunately, many low‐income families who may be
eligible for EITC do not claim this tax credit. According to NAFI, many families are unaware that
they qualify for this credit. NAFI estimates that each year about $25 million in EITC refunds are not
claimed in Davidson County by eligible filers.
There is a need in the community for financial literacy resources to help low‐income persons
choose appropriate personal financial opportunities and avoid predatory lending and exploitation.
The Nashville Alliance for Financial Independence (NAFI) works with many community partners to
increase the number of eligible low‐income individuals and families who use this program.
The Nashville Alliance for Financial Independence (NAFI) also coordinates
Volunteer Income Tax Assistance (VITA) volunteers who provide free income
tax preparation assistance to low‐income, elderly, disabled, and limited‐
English‐speaking people. There are several VITA sites throughout Nashville,
which helps working families file for the tax credits they have earned, while
also saving them money by avoiding the tax preparation fees and instant
refund fees of businesses that often use predatory practices.
NAFI also provides services through the My Money Plan program. This includes a free, one‐on‐
one, one‐hour session with a trained My Money Planner, to provide participants with a realistic
budget to help create an action plan and information on additional resources to help you along the
way. My Money Planners can meet with participants at a variety of locations in Davidson County,
such as nonprofit organizations, banks, and public libraries.
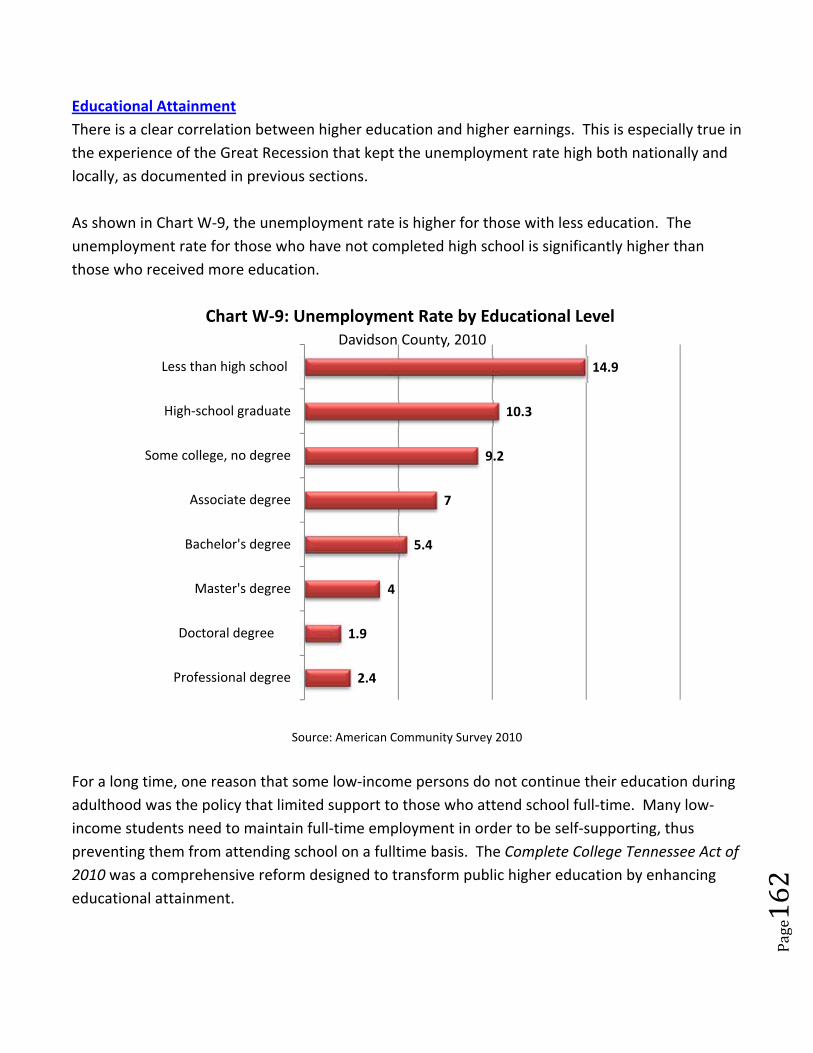
Page162
Educational Attainment
There is a clear correlation between higher education and higher earnings. This is especially true in
the experience of the Great Recession that kept the unemployment rate high both nationally and
locally, as documented in previous sections.
As shown in Chart W‐9, the unemployment rate is higher for those with less education. The
unemployment rate for those who have not completed high school is significantly higher than
those who received more education.
Source: American Community Survey 2010
For a long time, one reason that some low‐income persons do not continue their education during
adulthood was the policy that limited support to those who attend school full‐time. Many low‐
income students need to maintain full‐time employment in order to be self‐supporting, thus
preventing them from attending school on a fulltime basis. The Complete College Tennessee Act of
2010 was a comprehensive reform designed to transform public higher education by enhancing
educational attainment.
2.4
1.9
4
5.4
7
9.2
10.3
14.9
Professional degree
Doctoral degree
Master's degree
Bachelor's degree
Associate degree
Some college, no degree
High‐school graduate
Less than high school
Chart W‐9: Unemployment Rate by Educational LevelDavidson County, 2010

Page163
According to the Tennessee Higher Education Commission, the changed policy anticipates that
more Tennesseans will be better educated and trained. The new funding formula tied to outcomes
and not just enrollment, will force the higher education institutions to align programs to fit the
schedule of fulltime workers who intend to pursue educational programs in order to increase the
graduation rate.
http://tn.gov/thec/complete_college_tn/ccta_files/ccta/Pub%20Chap%203%20‐%201st%20Ex%20Sess.PDF
The U. S. Census Bureau’s map (M1501) shows the percentage of people 25 years and over who
have completd high school (or equivalent). Lighter shaded sections have smaller percentages of
people with a high school education, becoming darker as the level of education increases. Eleven
states, including Tennessee, are in the category with 78.9‐82.2% with a high school educatoin.
Only Puerto Rico is in a lower category at 66.7%. As darker shadings are used, the categories are
82.9‐85.8%, 86.5‐89.0%, and 89.4‐91.1% for the 12 states with the highest percentage of people
with high school educations.
Map M‐1501: Percentage of People Over Age 25 With High School or Equivalent
By State, 2005‐2009
Source: U. S. Census Bureau, 2005‐2009 American Community Survey
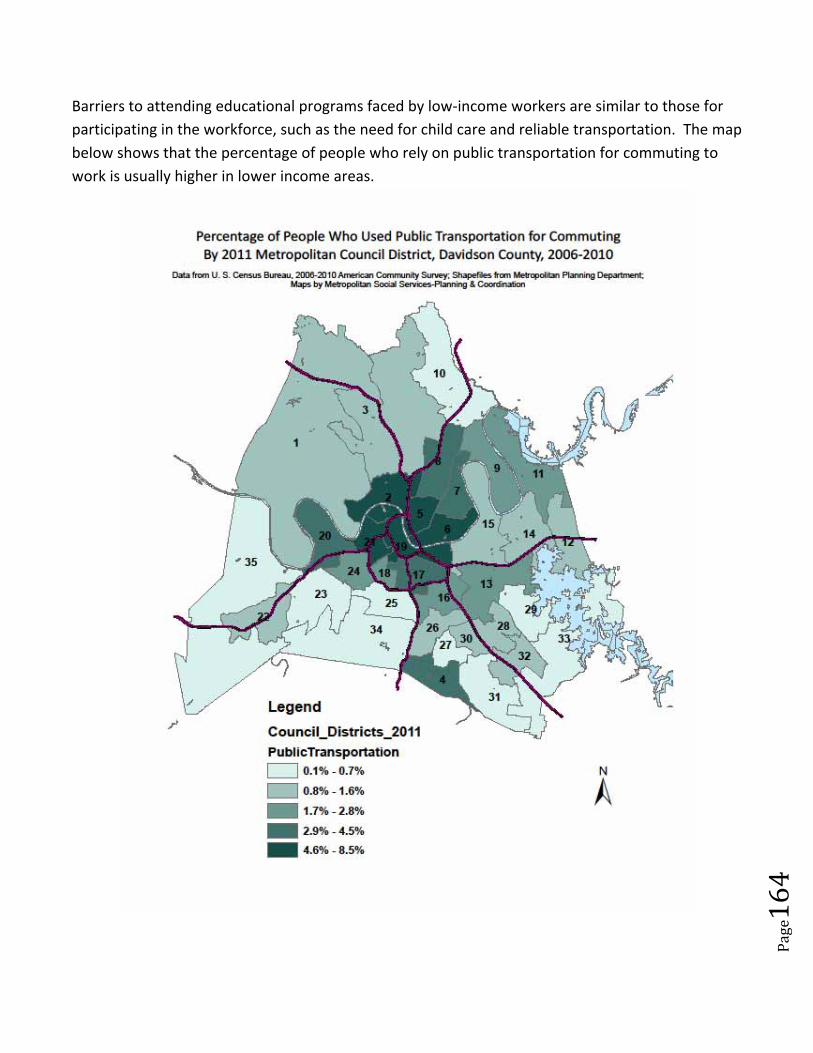
Page164
Barriers to attending educational programs faced by low‐income workers are similar to those for
participating in the workforce, such as the need for child care and reliable transportation. The map
below shows that the percentage of people who rely on public transportation for commuting to
work is usually higher in lower income areas.
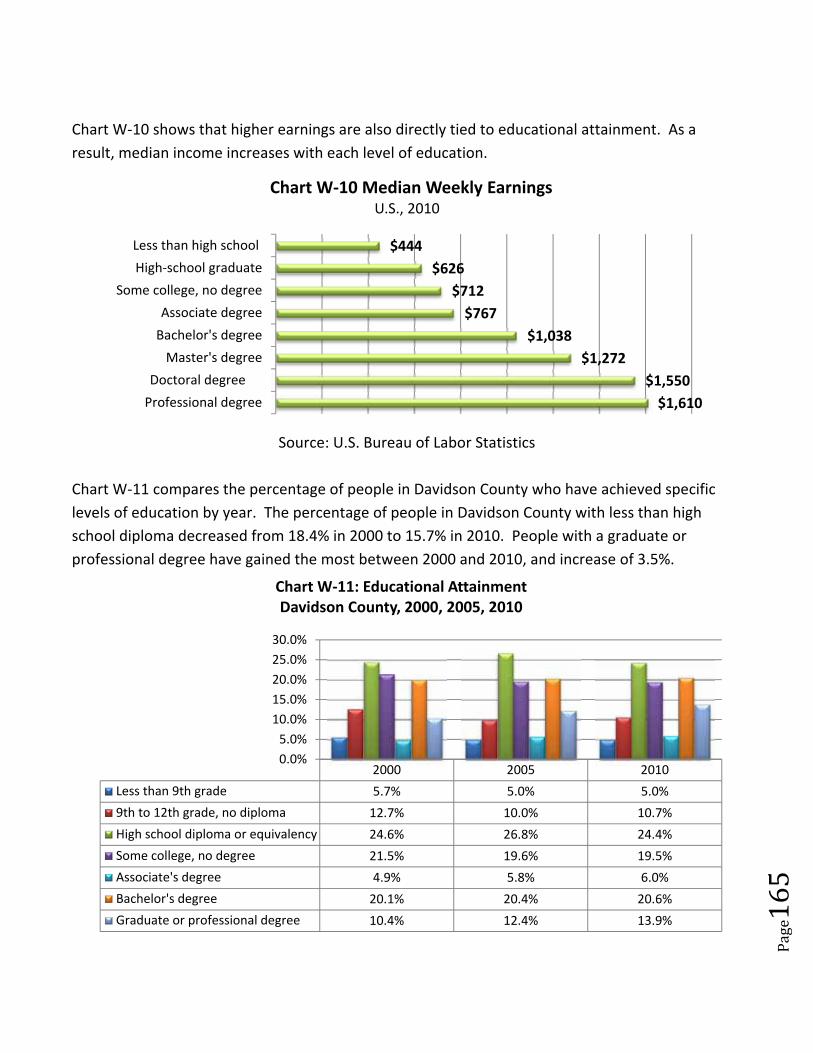
Page165
Chart W‐10 shows that higher earnings are also directly tied to educational attainment. As a
result, median income increases with each level of education.
Source: U.S. Bureau of Labor Statistics
Chart W‐11 compares the percentage of people in Davidson County who have achieved specific
levels of education by year. The percentage of people in Davidson County with less than high
school diploma decreased from 18.4% in 2000 to 15.7% in 2010. People with a graduate or
professional degree have gained the most between 2000 and 2010, and increase of 3.5%.
$1,610
$1,550
$1,272
$1,038
$767
$712
$626
$444
Professional degree
Doctoral degree
Master's degree
Bachelor's degree
Associate degree
Some college, no degree
High‐school graduate
Less than high school
Chart W‐10 Median Weekly EarningsU.S., 2010
2000 2005 2010
Less than 9th grade 5.7% 5.0% 5.0%
9th to 12th grade, no diploma 12.7% 10.0% 10.7%
High school diploma or equivalency 24.6% 26.8% 24.4%
Some college, no degree 21.5% 19.6% 19.5%
Associate's degree 4.9% 5.8% 6.0%
Bachelor's degree 20.1% 20.4% 20.6%
Graduate or professional degree 10.4% 12.4% 13.9%
0.0%
5.0%
10.0%
15.0%
20.0%
25.0%
30.0%
Chart W‐11: Educational AttainmentDavidson County, 2000, 2005, 2010
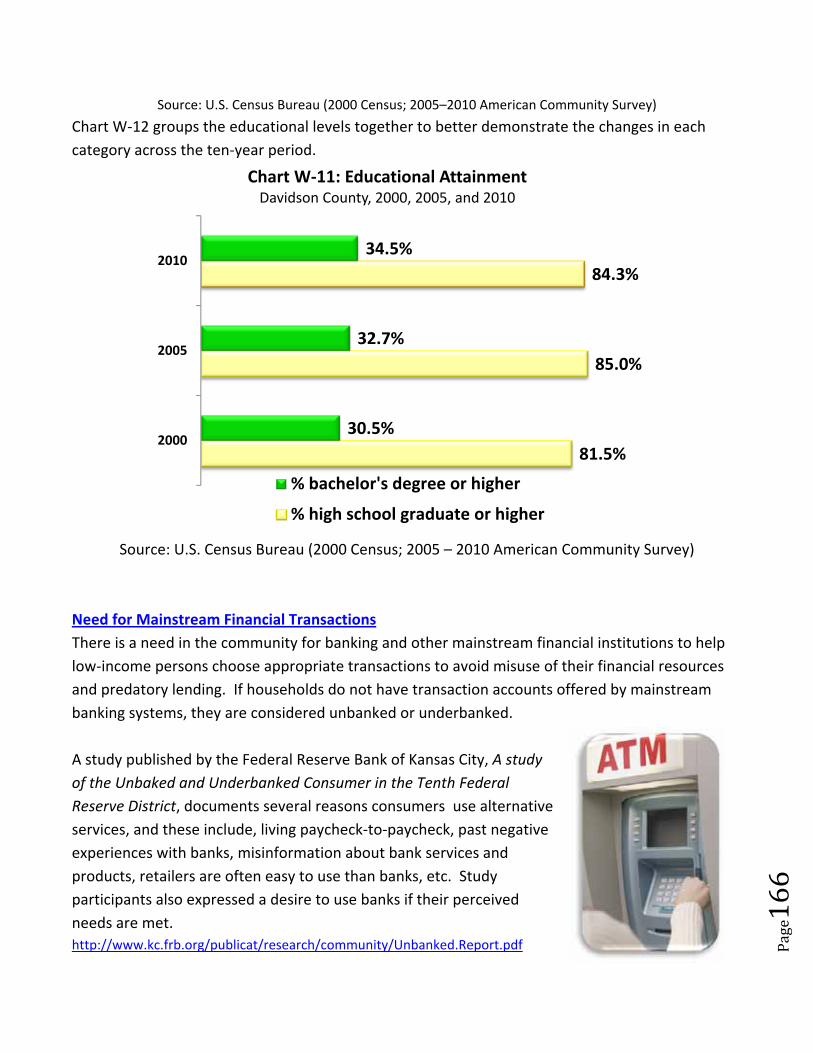
Page166
Source: U.S. Census Bureau (2000 Census; 2005–2010 American Community Survey)
Chart W‐12 groups the educational levels together to better demonstrate the changes in each
category across the ten‐year period.
Source: U.S. Census Bureau (2000 Census; 2005 – 2010 American Community Survey)
Need for Mainstream Financial Transactions
There is a need in the community for banking and other mainstream financial institutions to help
low‐income persons choose appropriate transactions to avoid misuse of their financial resources
and predatory lending. If households do not have transaction accounts offered by mainstream
banking systems, they are considered unbanked or underbanked.
A study published by the Federal Reserve Bank of Kansas City, A study
of the Unbaked and Underbanked Consumer in the Tenth Federal
Reserve District, documents several reasons consumers use alternative
services, and these include, living paycheck‐to‐paycheck, past negative
experiences with banks, misinformation about bank services and
products, retailers are often easy to use than banks, etc. Study
participants also expressed a desire to use banks if their perceived
needs are met.
http://www.kc.frb.org/publicat/research/community/Unbanked.Report.pdf
81.5%
85.0%
84.3%
30.5%
32.7%
34.5%
2000
2005
2010
Chart W‐11: Educational AttainmentDavidson County, 2000, 2005, and 2010
% bachelor's degree or higher
% high school graduate or higher
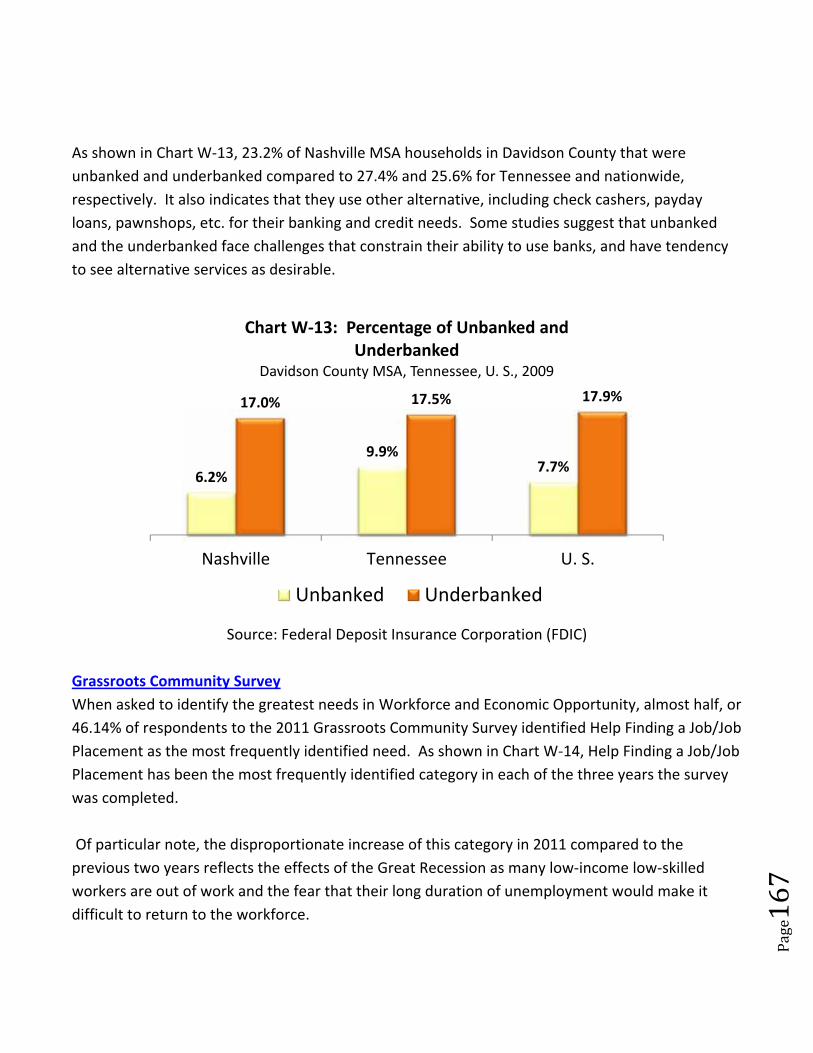
Page167
As shown in Chart W‐13, 23.2% of Nashville MSA households in Davidson County that were
unbanked and underbanked compared to 27.4% and 25.6% for Tennessee and nationwide,
respectively. It also indicates that they use other alternative, including check cashers, payday
loans, pawnshops, etc. for their banking and credit needs. Some studies suggest that unbanked
and the underbanked face challenges that constrain their ability to use banks, and have tendency
to see alternative services as desirable.
Source: Federal Deposit Insurance Corporation (FDIC)
Grassroots Community Survey
When asked to identify the greatest needs in Workforce and Economic Opportunity, almost half, or
46.14% of respondents to the 2011 Grassroots Community Survey identified Help Finding a Job/Job
Placement as the most frequently identified need. As shown in Chart W‐14, Help Finding a Job/Job
Placement has been the most frequently identified category in each of the three years the survey
was completed.
Of particular note, the disproportionate increase of this category in 2011 compared to the
previous two years reflects the effects of the Great Recession as many low‐income low‐skilled
workers are out of work and the fear that their long duration of unemployment would make it
difficult to return to the workforce.
6.2%
9.9%7.7%
17.0% 17.5% 17.9%
Nashville Tennessee U. S.
Chart W‐13: Percentage of Unbanked and Underbanked
Davidson County MSA, Tennessee, U. S., 2009
Unbanked Underbanked
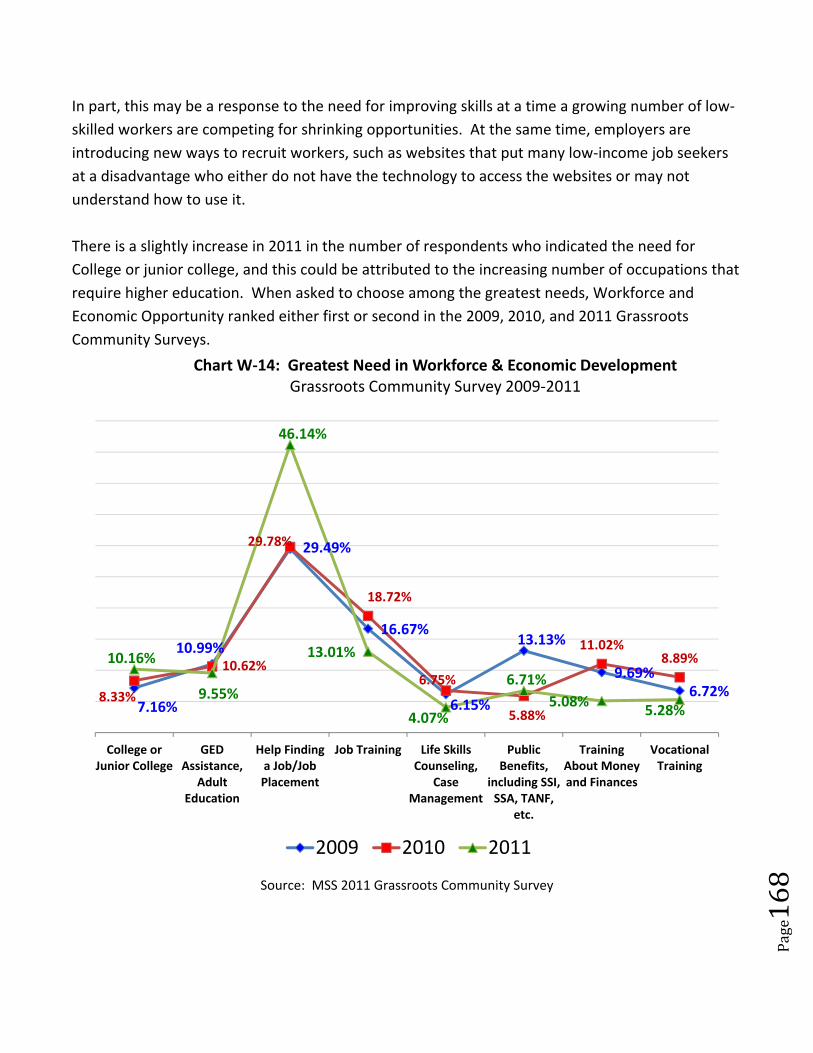
Page168
In part, this may be a response to the need for improving skills at a time a growing number of low‐
skilled workers are competing for shrinking opportunities. At the same time, employers are
introducing new ways to recruit workers, such as websites that put many low‐income job seekers
at a disadvantage who either do not have the technology to access the websites or may not
understand how to use it.
There is a slightly increase in 2011 in the number of respondents who indicated the need for
College or junior college, and this could be attributed to the increasing number of occupations that
require higher education. When asked to choose among the greatest needs, Workforce and
Economic Opportunity ranked either first or second in the 2009, 2010, and 2011 Grassroots
Community Surveys.
Source: MSS 2011 Grassroots Community Survey
7.16%
10.99%
29.49%
16.67%
6.15%
13.13%
9.69%6.72%8.33%
10.62%
29.78%
18.72%
6.75%
5.88%
11.02%8.89%10.16%
9.55%
46.14%
13.01%
4.07%
6.71%
5.08%5.28%
College orJunior College
GEDAssistance,
AdultEducation
Help Findinga Job/JobPlacement
Job Training Life SkillsCounseling,
CaseManagement
PublicBenefits,
including SSI,SSA, TANF,
etc.
TrainingAbout Moneyand Finances
VocationalTraining
Chart W‐14: Greatest Need in Workforce & Economic DevelopmentGrassroots Community Survey 2009‐2011
2009 2010 2011
Page169
BEST PRACTICES – Example for Workforce Development
Focusing on Sectoral Employment
Description
With the decline of manufacturing and other low‐skilled jobs such as construction, many
community‐based organizations that assist low‐income low‐skilled job seekers find it difficult
securing jobs for these clients. Even jobs that were once available to people with high school
diplomas disappeared because of the recession and global competition. New job opportunities
have been created in sectors of the economy, and these usually require skill sets that could be
obtained only through specific training in these industries (such as health care and education).
Research describes how this brought attention to sectoral employment, which is defined as
training programs that are industry‐specific where unemployed and unskilled workers develop
skills needed in growth sectors. It is important that accurate assessment of the local labor market
information guide the design of the most appropriate employment training programs for each
community.
Rationale
The changing economy forced job developers to become more effective in order to show positive
outcomes for the low‐income workers they assist. They also show the added value for businesses
that are looking for skilled workers. Using this approach, job developers use labor market
information to design their training programs to meet the needs of local businesses. These sector‐
focused jobs would help job seekers obtain available jobs, especially those that pay higher wages
with benefits, and that can be retained longer periods.
Potential Challenges for Davidson County
The success of this approach depends on the effectiveness of the organizations that provide
workforce development and their capacity to adapt to the changing demand for skilled workers by
businesses. Organizational flexibility is necessary to create training programs that target the
sectors most in demand. Many nonprofit job service providers may lack adequate resources to
add this level of capacity.
Steps to Operate in Davidson County
Collaboration is essential among many institutions, including private and public workforce
development organizations, community colleges, Career Centers, Nashville Area Chamber of
Commerce, and businesses. Although it does not have the resources to address all the unmet
Page170
need, the Workforce Implementation Team of the Nashville Poverty Reduction Council created
limited collaborations among some businesses and providers through workshops. This could be
expanded to reach a larger group of providers and employers to enhance the success of a Sectoral
Employment Approach.
BEST PRACTICES – Example for Workforce Development
Employer Engagement
Description It is important to engage and connect the needs of employers with job service providers and with
potential employees. This involves a number of activities intended to meet the needs of
employers in meaningful ways, including recruiting skilled workforce and retaining workers. This
approach allows job service providers to establish and strengthen their relationships with
employers. In this approach, providers ensure that all job seekers are prepared, committed,
interested and motivated. It also requires that providers are business‐oriented and that they
understand the employers as their customers.
Rationale Employers do not primarily provide job opportunities because they want to do good things for the
community. Instead, their businesses require workers who are capable of producing the goods
and services expected by their customers and market shares. When businesses work with job
developers, they want the relationship to lead to value and profits for their business. By
presenting well‐prepared job seekers and counseling them when conflicts arise to enhance job
retention, job developers have a competitive edge over other job seekers with the employer who
has to sort out an unknown number of applicants.
Potential Challenges for Davidson County
The current characteristics of the local economy may be a significant impediment to effectively
engaging employers. As a result of the worst recession since the Great Depression, most of the
local providers of workforce development are assisting the long‐time unemployed who may not
have the advanced skills needed. Most job growth in recent years was in the health care and
education sectors, with both sectors requiring a higher level of education and training than many
unemployed people who may have low educational attainment.
Page171
One local provider recently noted that employers in other parts of Middle Tennessee are recruiting
workers from Nashville, as the geography for business opportunity has expanded. However, the
lack of a reliable transportation system would be a prohibitive factor to those who need to seek
jobs farther from their homes.
Steps to Operation in Davidson County
Despite the current economic turndown, the historic relationship between employers and the
community organizations that assist job seekers continues to be advantageous arrangement. By
surveying area businesses, employment services providers can adapt to the changing modes of
production and the skills needed in these growing sectors, so that they can ensure that the
partnership remains a valuable one from business perspective.
BEST PRACTICES – Example for Workforce Development
Employer/Provider Networking
Description
This approach brings together workforce providers and employers. Providers not only help job
seekers obtain jobs but they also provide support services, such as referrals to childcare, help with
public benefits, and other services low‐income individuals and families need. They also share
valued information about businesses and their recruiting expectations. When providers come
together, it serves as a mechanism and venue to share valuable resources, including strategies that
work for the unemployed to obtain jobs.
Rationale
Most community employment and training services providers work together and share practices
that help their clients obtain jobs. However, most of these informal arrangements are done in a
way that focuses on relationships among service providers. Effective practices to enhance
employment opportunity for low‐skilled workers involves engaging employers and creating official
networks to learn more about their prospective job seekers.
When employers attend workshops designed to specifically focus on the population the providers
serve (often people with barriers to gainful employment), they become more knowledgeable
about their strengths and address stereotypes that further hinder their employment chances.
Similarly, providers obtain valuable information about topics such as employer expectations and
Page172
area labor market data that affect their services. In many cases, individual organizations may not
have the capacity to gather this type of data, which is facilitated by a collective effort.
Potential challenges Davidson County
Not all providers are part of these networks so further outreach is necessary to involve a wider
range of providers. Similarly, the number of business available to participate may be limited.
There is a need for leadership, because most providers have limited resources, focus on immediate
tasks and cater specifically to their own clients, rather than using an initiative that serves
everybody.
Steps to Operation in Davidson County
A beginning model of the Employer/Provider Networking Approach was developed through the
Workforce Implementation Team of the Nashville Poverty Reduction Initiative. It developed a
Workforce Advisory Council, which is at an initial stage of identifying and organizing topics for
provider workshops. However, there are demonstrated effective practices in job services that
many service providers do have the capacity to provide. Some of these examples would include
ongoing on‐the‐job follow‐up, long‐term supports to promote longevity in employment and
customized services for populations with additional barriers. Additional capacity and enhanced
awareness are needed to expand this approach to a larger number of employers and providers and
to provide additional services to enhance success of those who are placed in employment.
BEST PRACTICES – Example for Economic Opportunity
Workplace‐Based Financial Education
Description
This model is a workplace‐based financial education program for adults, which employers can
incorporate as part of the workday, so that employees can easily participate and instructors have
access to a ready group of participants. The benefit to employers is that it would help them have a
financially stable productive workforce that would not be disrupted when their workers face
financial problems that affect attendance, productivity, and turnovers. In addition, it is an added
expense to employers if they have to enforce child support, wage garnishments or other court
orders.
Page173
Rationale
This approach provides a well‐designed and targeted financial education package to program
participants. According to research, it facilitates the delivery of the three critical components of
successful financial education programs, which involve:
Competent trainers experienced in teaching financial education to adults
Certified financial planners to help households develop financial goals and plans
Program delivery in the workplace
Potential challenge for Davidson County
The planners of the financial education have to have all the three components of the program in
place if it is to succeed. Many programs fail because they are based on the idea of “one size fits
all,” rather than customizing a sustainable delivery method. Therefore, a public‐private
partnership is essential in order to commit to the longevity for a successful financial education
program.
Steps to Operation in Davidson County
One successful local initiative involved a business (a large meat processing company) that hosted a
Volunteer Income Tax Assistance filing site. The employer also is part of the Advisory Council of
NAFI (Nashville Alliance for Financial Independence), and allowed the site to be used for workplace
financial education practice. This was an effective way to provide an additional benefit to the
employees, with a convenient way to file their income tax returns and receive knowledge to
enhance their economic stability. Such benefits could enhance job stability and satisfaction for
greater retention of workers.
There is widespread need for financial education, especially among those who have limited
incomes. Certified financial planners could be identified to design specific programs targeted to
different types of participants. Financial planners would be beneficial in presenting some
segments, but other trained personnel could present other segments. The programs would be an
ongoing series to address the various issues in the program. Outreach and encouragement to
employers is also needed in order to create additional workplace venues for this model to occur.
http://www.economist.com/node/21526915
http://www.ppv.org/ppv/publication.asp?section_id=26&search_id=0&publication_id=327
http://www.aspenwsi.org/Publications/11‐020.pdf
http://www.kc.frb.org/publicat/cap/carwp09‐01.pdf
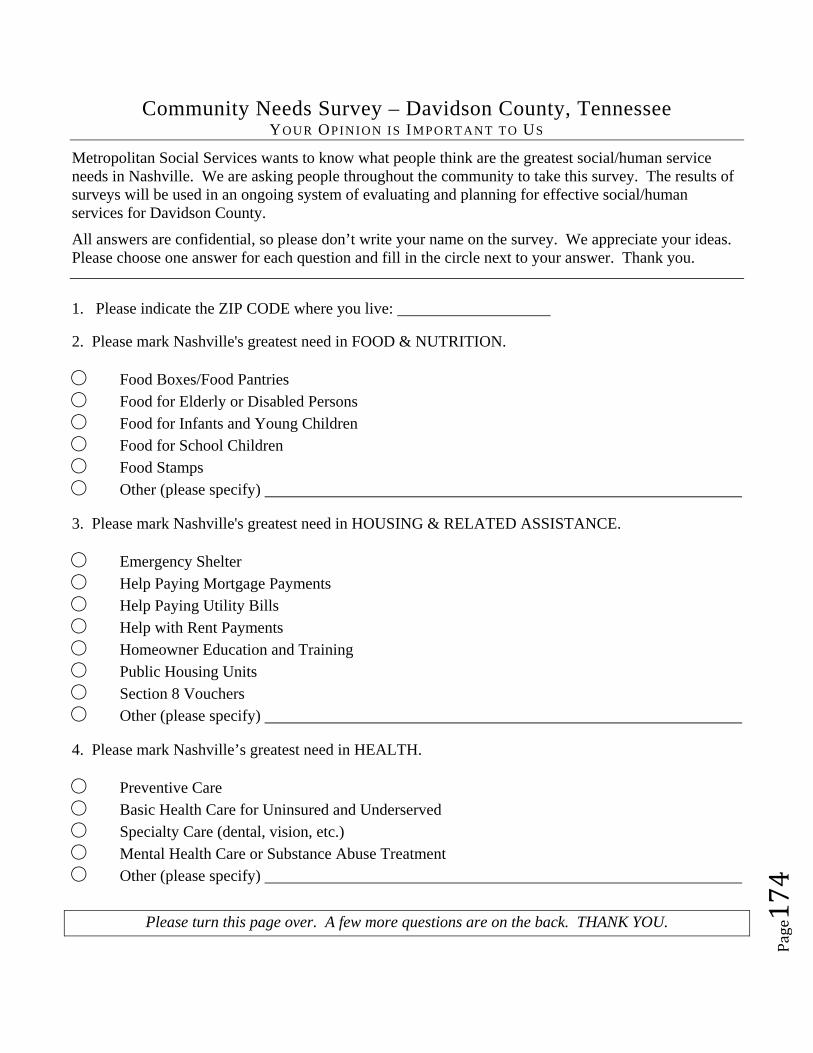
Page174
Community Needs Survey – Davidson County, Tennessee YOUR OPINION IS IMPORTANT TO US
Metropolitan Social Services wants to know what people think are the greatest social/human service needs in Nashville. We are asking people throughout the community to take this survey. The results of surveys will be used in an ongoing system of evaluating and planning for effective social/human services for Davidson County.
All answers are confidential, so please don’t write your name on the survey. We appreciate your ideas. Please choose one answer for each question and fill in the circle next to your answer. Thank you.
1. Please indicate the ZIP CODE where you live:
2. Please mark Nashville's greatest need in FOOD & NUTRITION.
Food Boxes/Food Pantries Food for Elderly or Disabled Persons Food for Infants and Young Children Food for School Children Food Stamps Other (please specify)
3. Please mark Nashville's greatest need in HOUSING & RELATED ASSISTANCE.
Emergency Shelter Help Paying Mortgage Payments Help Paying Utility Bills Help with Rent Payments Homeowner Education and Training Public Housing Units Section 8 Vouchers Other (please specify)
4. Please mark Nashville’s greatest need in HEALTH.
Preventive Care Basic Health Care for Uninsured and Underserved Specialty Care (dental, vision, etc.) Mental Health Care or Substance Abuse Treatment Other (please specify)
Please turn this page over. A few more questions are on the back. THANK YOU.
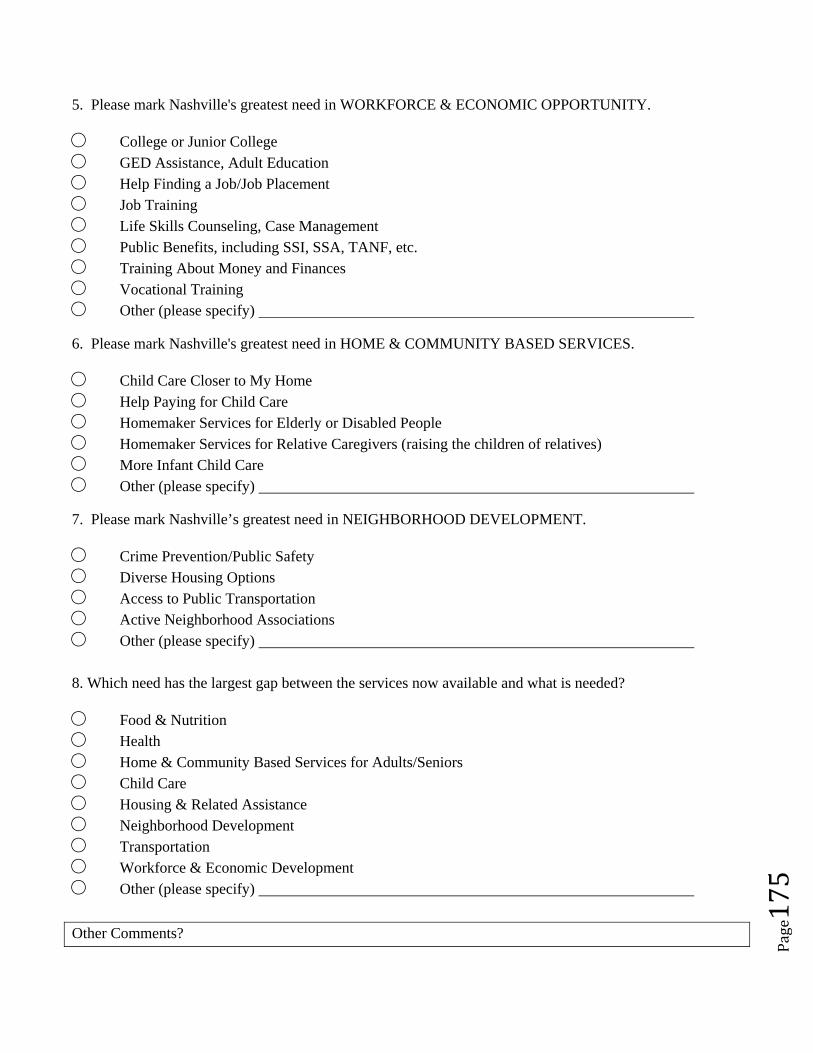
Page175
5. Please mark Nashville's greatest need in WORKFORCE & ECONOMIC OPPORTUNITY.
College or Junior College GED Assistance, Adult Education Help Finding a Job/Job Placement Job Training Life Skills Counseling, Case Management Public Benefits, including SSI, SSA, TANF, etc. Training About Money and Finances Vocational Training Other (please specify)
6. Please mark Nashville's greatest need in HOME & COMMUNITY BASED SERVICES.
Child Care Closer to My Home Help Paying for Child Care Homemaker Services for Elderly or Disabled People Homemaker Services for Relative Caregivers (raising the children of relatives) More Infant Child Care Other (please specify)
7. Please mark Nashville’s greatest need in NEIGHBORHOOD DEVELOPMENT.
Crime Prevention/Public Safety Diverse Housing Options Access to Public Transportation Active Neighborhood Associations Other (please specify) 8. Which need has the largest gap between the services now available and what is needed?
Food & Nutrition Health Home & Community Based Services for Adults/Seniors Child Care Housing & Related Assistance Neighborhood Development Transportation Workforce & Economic Development Other (please specify)
Other Comments?