Embed Size (px)
Citation preview
1
Back to menu
Retour au sommaire
2
Back to menu
Retour au sommaire
3
Back to menu
Retour au sommaire

4
Back to menu
Retour au sommaire
5
Back to menu
Retour au sommaire
6
Back to menu
Retour au sommaire
7
Back to menu
Retour au sommaire
8
Back to menu
Retour au sommaire
9
Back to menu
Retour au sommaire
10
Back to menu
Retour au sommaire
11
Back to menu
Retour au sommaire
12
Back to menu
Retour au sommaire
13
Back to menu
Retour au sommaire

14
Back to menu
Retour au sommaire

15
Back to menu
Retour au sommaire

16
Back to menu
Retour au sommaire
17
Back to menu
Retour au sommaire
18
Back to menu
Retour au sommaire
19
Back to menu
Retour au sommaire
20
Back to menu
Retour au sommaire
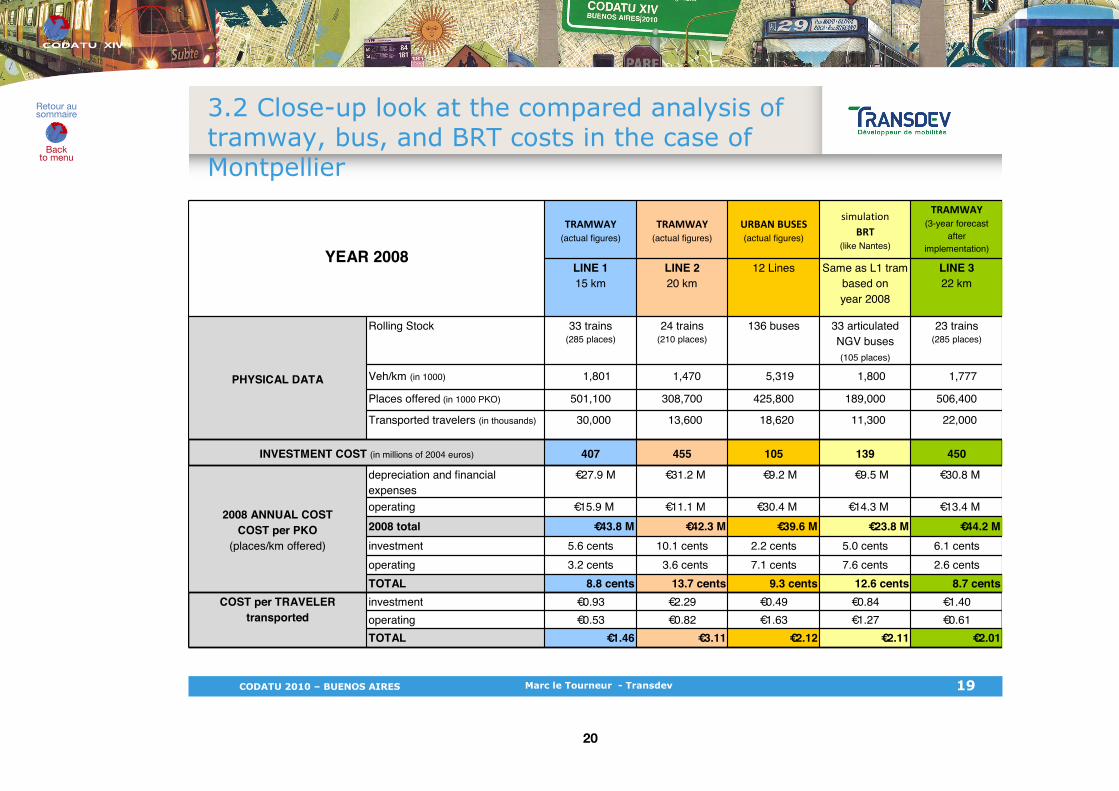
YEAR 2008
TRAMWAY (actual figures)
TRAMWAY (actual figures)
URBAN BUSES (actual figures)
simulationBRT
(like Nantes)
TRAMWAY (3-year forecast
afterimplementation)
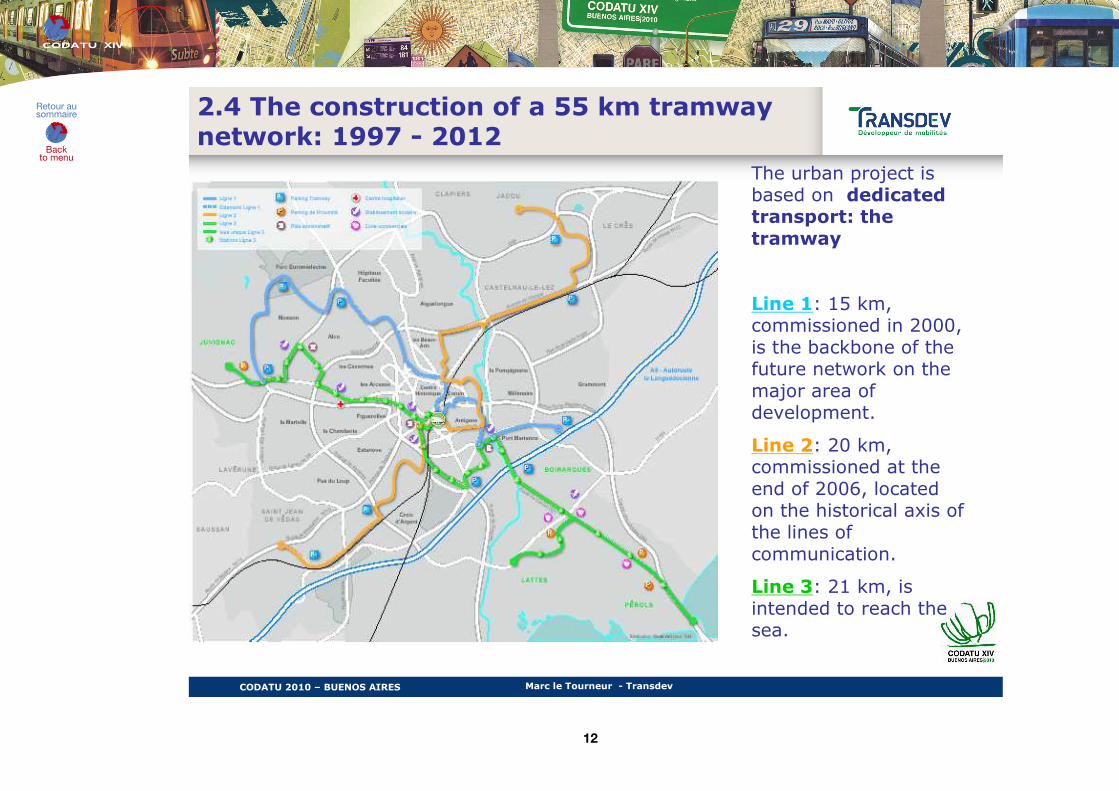
LINE 1 15 km
LINE 2 20 km
12 Lines Same as L1 tram based on year 2008
LINE 3 22 km
PHYSICAL DATA
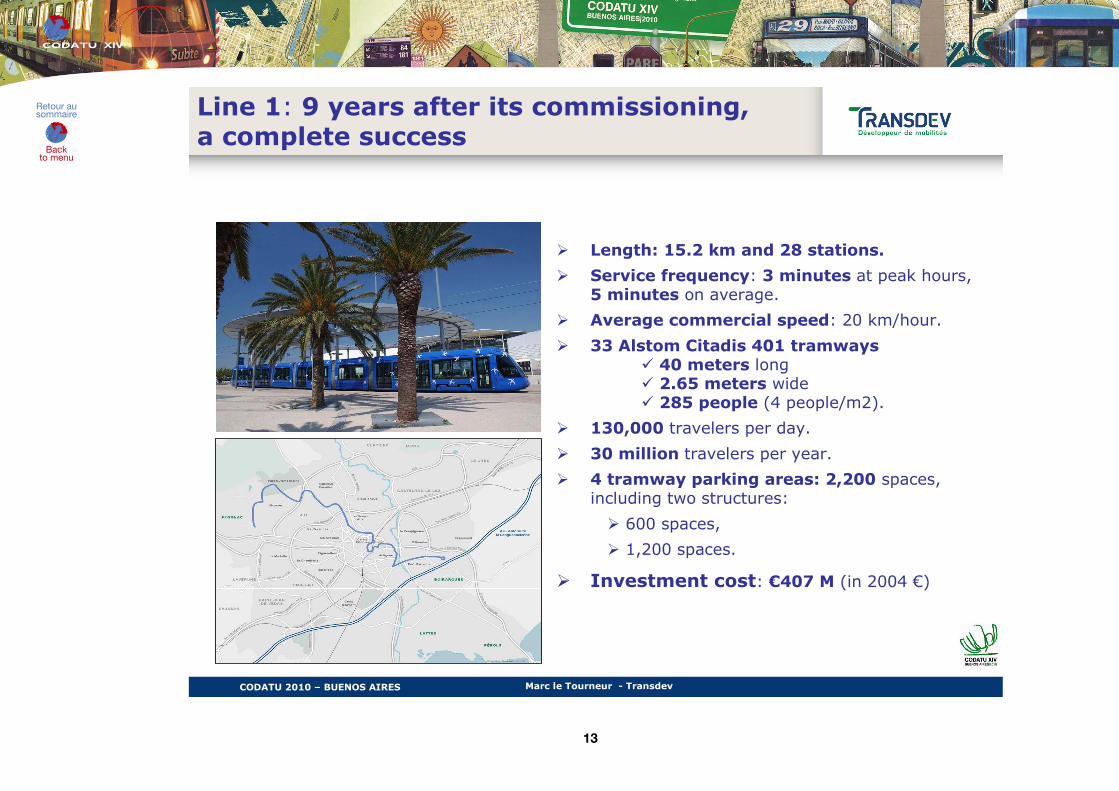
Rolling Stock 33 trains (285 places)
24 trains (210 places)
136 buses 33 articulatedNGV buses (105 places)
23 trains (285 places)
Veh/km (in 1000) 1,801 1,470 5,319 1,800 1,777
Places offered (in 1000 PKO) 501,100 308,700 425,800 189,000 506,400
Transported travelers (in thousands) 30,000 13,600 18,620 11,300 22,000
INVESTMENT COST (in millions of 2004 euros) 407 455 105 139 450
2008 ANNUAL COSTCOST per PKO
(places/km offered)
depreciation and financialexpenses
€27.9 M €31.2 M €9.2 M €9.5 M €30.8 M
operating €15.9 M €11.1 M €30.4 M €14.3 M €13.4 M2008 total €43.8 M €42.3 M €39.6 M €23.8 M €44.2 Minvestment 5.6 cents 10.1 cents 2.2 cents 5.0 cents 6.1 centsoperating 3.2 cents 3.6 cents 7.1 cents 7.6 cents 2.6 centsTOTAL 8.8 cents 13.7 cents 9.3 cents 12.6 cents 8.7 cents
COST per TRAVELER transported
investment €0.93 €2.29 €0.49 €0.84 €1.40operating €0.53 €0.82 €1.63 €1.27 €0.61TOTAL €1.46 €3.11 €2.12 €2.11 €2.01
21
Back to menu
Retour au sommaire


![]KM^m - bunri-u.ac.jp](https://img.pdfslide.us/doc/110x75/61bd11df61276e740b0f0ab0/kmm-bunri-uacjp.jpg)