Embed Size (px)
Citation preview

УДК 528.48:626
СОВРЕМЕННОЕ СОСТОЯНИЕ РЕШЕНИЯ ЗАДАЧ ГЕОДЕЗИЧЕСКОГО МОНИТОРИНГА СООРУЖЕНИЙ ДЛЯ ПЛОТИН ГЭС
Джоел ван КроненброкLeica Geosystems AG, Heinrich Wild Strasse – CH 9435, Швейцария, директор отдела развития бизнес-технологий, тел. +32 474 98 61 93, факс: +32 81 41 26 02, e-mail: [email protected]
Анализом деформаций практически перестали заниматься. Сегодня эксперты даже не интересуются, есть ли смещения в критических точках сооружения. А, между прочим, из-за тепловых загрузок и изменения горизонта воды каждое сооружение и в частности ГЭС смещается. Но хорошо если изменение общего состояния предупредит об опасности, тогда и появится необходимость в проведении больших исследований...
Рекомендуется робастное уравнивание результатов измерений различными автоматическими геодезическими инструментами, что гарантирует высокую точность и надежность. Многократные проверки статистической гипотезы позволяют выявлять грубые ошибки и нестабильность опорных точек. Очень важно для задач геодезического мониторинга иметь интегрированную систему, которая бы позволила отличать смещения сооружения от смещений пунктов опорной сети и выявлять, насколько стабильны эти пункты.
В статье дан обзор новых геодезических сенсоров и анализ методов в контексте решения в интересах экспертов.
Ключевые слова: анализ целостности конструкции, ГЛОНАСС, GPS, централизованная обработка данных, RTK, электронные тахеометры, инклинометры, уравнивание методом наименьших квадратов, автоматическое распознавание цели, геодезический мониторинг.
STATE OF THE ART IN STRUCTURAL GEODETIC MONITORING SOLUTIONS FOR HYDRO POWER DAMS
Joël van CranenbroeckNew Business Division of Leica Geosystems AG, Heinrich Wild Strasse – CH 9435 Heerbrugg, Switzerland, Business Technology Manager, tel. +32 474 98 61 93, fax +32 81 41 26 02, e-mail: [email protected]
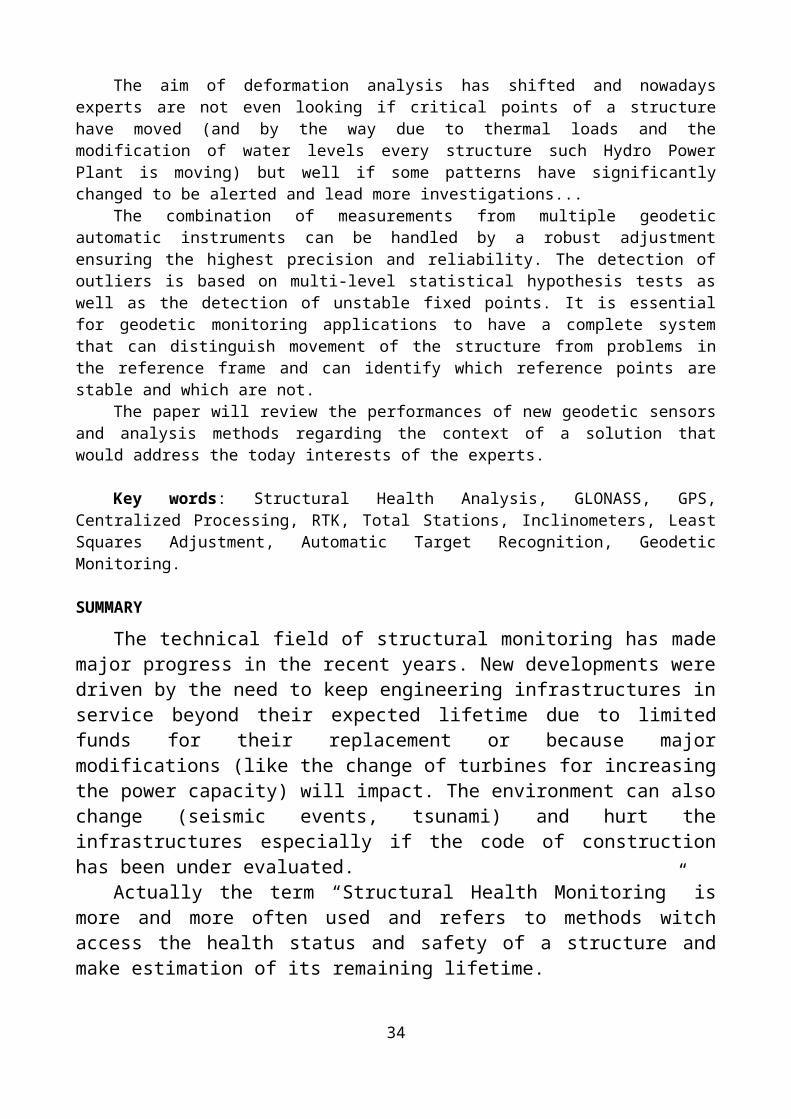
The aim of deformation analysis has shifted and nowadays experts are not even looking if critical points of a structure have moved (and by the way due to thermal loads and the modification of water levels every structure such Hydro Power Plant is moving) but well if some patterns have significantly changed to be alerted and lead more investigations...
The combination of measurements from multiple geodetic automatic instruments can be handled by a robust adjustment ensuring the highest precision and reliability. The detection of out-liers is based on multi-level statistical hypothesis tests as well as the detection of unstable fixed points. It is essential for geodetic monitoring applications to have a complete system that can distin-guish movement of the structure from problems in the reference frame and can identify which refer-ence points are stable and which are not.
The paper will review the performances of new geodetic sensors and analysis methods regard-ing the context of a solution that would address the today interests of the experts.
33
Key words: Structural Health Analysis, GLONASS, GPS, Centralized Processing, RTK, To-tal Stations, Inclinometers, Least Squares Adjustment, Automatic Target Recognition, Geodetic Monitoring.
SUMMARY
The technical field of structural monitoring has made major progress in the re-cent years. New developments were driven by the need to keep engineering infra-structures in service beyond their expected lifetime due to limited funds for their re-placement or because major modifications (like the change of turbines for increasing the power capacity) will impact. The environment can also change (seismic events, tsunami) and hurt the infrastructures especially if the code of construction has been under evaluated.
Actually the term “Structural Health Monitoring” is more and more often used and refers to methods witch access the health status and safety of a structure and make estimation of its remaining lifetime.
However, structures can only be kept in service if they do not put the safety of the users at risk. Critical parts of a structure as well as global behaviour have to be monitored in continuous intervals with high precision.
The aim of deformation analysis has shifted and nowadays experts are not even looking if critical points of a structure have moved (and by the way due to thermal loads and the modification of water levels every structure such Hydro Power Plant is moving ) but well if some patterns have significantly changed to be alerted and lead more investigations ...
With highest resolution and highest recording rate of today's instruments the small deformations caused by the daily temperature changes, water levels etc. can be observed.
The paper will review the performances of new geodetic sensors and analysis methods regarding the context of a solution that would address the today interests of the experts.
1. FACING NEW CHALLENGE
Engineering companies and contractors are facing challenges never experienced before. They are being charged with – and being held liable for – the health of the structures they create and maintain.
To surmount these challenges, engineers need to be able to measure structural movements to millimeter level accuracy. Accurate and timely information on the sta-tus of a structure is highly valuable to engineers. It enables them to compare the real-world behavior of a structure against the design and theoretical models.
When empowered by such data, engineers can effectively and cost efficiently measure and maintain the health of vital infrastructure. The ability to detect and react to potential problems before they develop helps in the reduction of insurance costs and the prevention of catastrophic failures that may results in injury, death or signifi-cant financial loss.
34

A structural monitoring system will help reduce both the current and long term maintenance cost associated with structural movement and will reduces risks, as data analysis can be used to aid the understanding of current and future implications of structural movements. Safety and structural integrity concerns can be minimized. Po-tential problems can be detected and rectified before a critical situation develops.
2. FROM AUTOMATIC SURVEYING TO PRECISE CONTINUOUS MONITORING
Based on surveying sensors like GNSS receivers and Automatic Total Stations, Geodetic Monitoring solutions are integrating also wireless communication tools, ac-quisition software’s, PC servers, accessories, power supply, solar panels, weather sta-tion, warning sensors, web interfaces and analysis to become complex systems.
And if the engineers today are considering often the surveying instrumentation just like “sensors” to be plugged and connected to even their real time analysis soft-ware’s, they shouldn’t forget that the key for succeeding in their monitoring projects is first to consider instrumentation and equipments that can deliver high accurate and reliable measurements 24 hours a days and 365 days a year through any communica-tion media under any weather conditions and remotely controlled.
All modern automatic geodetic instruments can be combined in various systems where GNSS antennas collocated with 360° reflector are acting as “Active Control Points” for Automatic Total Stations networked.
If multiple total stations are able to make measurements to a common set of prisms, the measurements can be combined in a mathematically optimal way known as network adjustment.
By combining the measurements in a network adjustment it is possible to in-crease the precision of the solution’s estimates and determine a common reference frame for all total stations even in the case that some of total stations cannot observe stable control points or are themselves unstable.
It has been proved also that the combination of a very precise inclinometer with a GNSS antenna and receiver can consist a stand-alone basic monitoring station for high rise buildings and dams monitoring and that the performances of such precise dual-axis inclinometer can fairly compete in the frequency domain with an accelero-meter.
Recently the benefit of GNSS Network RTK corrections to provide unbiased po-sitioning information from GPS and GNSS monitoring receivers has been demon-strated for several monitoring projects in Hong Kong and reported in several Interna-tional Conferences such as ION (USA) and the FIG International World Congress in Sydney 2010.
But it’s not only concerning the Geodetic instrumentation and actually today there is a growing interest to collocate and correlate the information’s from the geo-technical sensors and with the geodetic sensors to develop an integrated deformation model. The GNSS receivers have the capacity to time synchronize all the other sensors by their PPS output and the geotechnical sensors can be considered to “off-set” the geodetic locations.
35

3. AUTOMATIC NETWORK ADJUSTMENT AND DEFORMATION ANALYSIS
Continuous Geodetic Monitoring systems must also have the capacity to process in timely manner the huge amount of data gathered in a central computing centre to deliver in simple ways (graphically and with clear reports) the reliable warnings and alarms.
It’s therefore just mandatory to consider an automatic least squares network ad-justment where the single epoch automatic deformation analysis is based on a rigor-ous statistical approach and can also be used for designing a monitoring project to match the expected accuracy requirements.
The combination of measurements from multiple geodetic automatic instruments can be handled by a robust adjustment ensuring the highest precision and reliability. The detection of outliers is based on multi-level statistical hypothesis tests as well as the detection of unstable fixed points. It is essential for geodetic monitoring applica-tions to have a complete system that can distinguish movement of the structure from problems in the reference frame and can identify which reference points are stable and which are not.
It is also of the prime importance for the engineers managing monitoring pro-jects to have the tool to design the setup of the instruments in such a way that the en-semble will fit with the expected accuracy. Least Squares Adjustment can simulate the mathematical geometry to optimize the network accuracy and reliability.
4. HYDRO POWER PLANT STRUCTURAL GEODETIC MONITORING
Each site where a Hydro Power plant has been designed and built is unique and it’s why a geodetic monitoring solution should be carefully designed taking into ac-count various parameters in the setting of the stations, the control points and the most appropriated technology to locate the points of interest.
The technical characteristics of facilities and contractor network design are to provide generally the accuracy of planned coordinates of monitoring points after processing by specialized software with errors (root-mean-square deviation – RMSD) not exceeding the values below:
Horizontal: ±3mm (two times standard deviation).Vertical: ±5 mm (two times standard deviation).The solution suggested nowadays for achieving such requirements is a combina-
tion of GNSS and Automatic Total Station (TPS) technologies into a data fusion sys-tem where a strict Least Squares Adjustment model is the processing kernel.
Such combination of GNSS and TPS technologies has already proven its effi-ciency in several projects (mining, building construction, ground surface monitoring etc.) but it was in 2005 that for the first time that such system has been developed successfully for addressing the challenging accuracy specifications of the Burj Khal-ifa’s tower construction in Dubai (the tallest worldwide building).
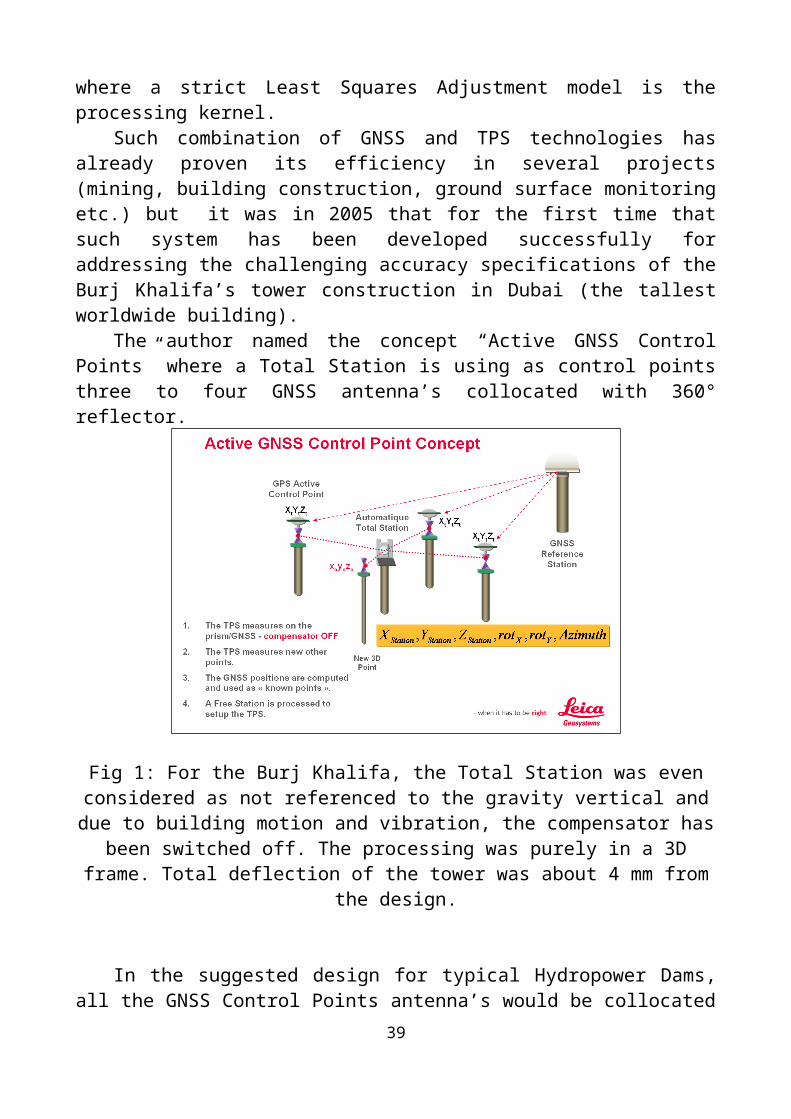
The author named the concept “Active GNSS Control Points” where a Total Sta-tion is using as control points three to four GNSS antenna’s collocated with 360° re-flector.
36

Fig 1: For the Burj Khalifa, the Total Station was even considered as not referenced to the gravity vertical and due to building motion and vibration, the compensator has been switched off. The processing was purely in a 3D frame. Total deflection of the
tower was about 4 mm from the design.
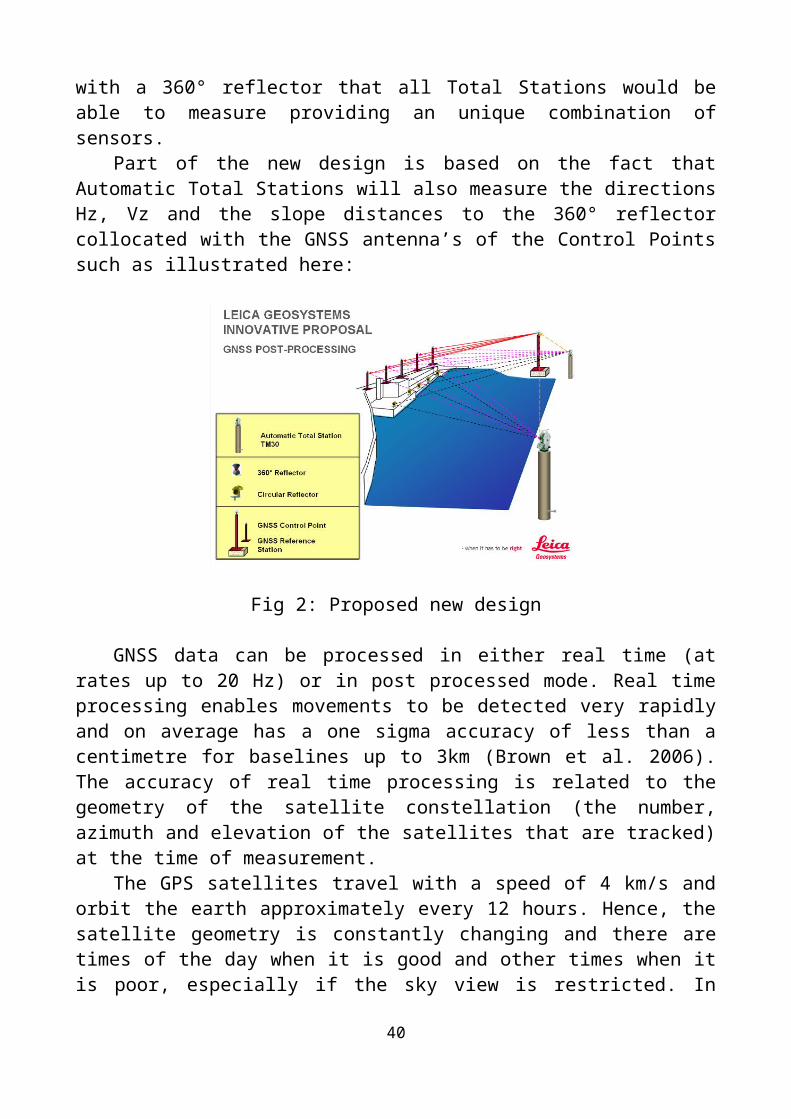
In the suggested design for typical Hydropower Dams, all the GNSS Control Points antenna’s would be collocated with a 360° reflector that all Total Stations would be able to measure providing an unique combination of sensors.
Part of the new design is based on the fact that Automatic Total Stations will also measure the directions Hz, Vz and the slope distances to the 360° reflector col-located with the GNSS antenna’s of the Control Points such as illustrated here:
Fig 2: Proposed new design
37

GNSS data can be processed in either real time (at rates up to 20 Hz) or in post processed mode. Real time processing enables movements to be detected very rapidly and on average has a one sigma accuracy of less than a centimetre for baselines up to 3km (Brown et al. 2006). The accuracy of real time processing is related to the geo-metry of the satellite constellation (the number, azimuth and elevation of the satellites that are tracked) at the time of measurement.
The GPS satellites travel with a speed of 4 km/s and orbit the earth approxim-ately every 12 hours. Hence, the satellite geometry is constantly changing and there are times of the day when it is good and other times when it is poor, especially if the sky view is restricted. In times of poor satellite geometry it may not be possible to compute a high accuracy (ambiguity fixed) solution and the reliability of the solution (the probability that the ambiguities are resolved correctly) will be lower.
If high accuracy and reliability is critical, a better option is to collect data over a defined period (e.g. 10 minutes, 1 hour, and 24 hours) and post process. In post pro-cessing more data can be used to estimate the parameters (coordinates, ambiguities, error models) mitigating short term problems due to poor satellite geometry and res-ulting in a more reliable and accurate solution. Usually the result of post processing is a single high accuracy coordinate, essentially an average over the time period. Long data periods (e.g. one hour or more) also enable additional parameters to be estimated to account for atmospheric (troposphere) influences, which are strongly correlated with the station height, further improving the accuracy. As an additional step, a me-dian can be computed from the post processing results over a longer time period in order to avoid any potential problems due to outliers.
Post processing combined with a median calculation is a very stable and accur-ate method for computing and updating reference coordinates using GNSS data. The downside of this approach is that if a sudden movement occurs, it will take some time for the system to react. The solution is then to compute multiple position estimates: a rapid estimate using real time data or a short post processing interval to detect sudden movements to provide alarms to the operator; and a slower estimate using a longer post processing interval to correct for the gradual movements of the pillars.
The standard mode of precise differential positioning is for one reference re-ceiver to be located at a reference station whose coordinates are known, while the second receiver's coordinates are determined relative to this reference receiver. The use of carrier phase data in real-time, single baseline mode (one reference station and one rover or user receiver’s coordinates to be determined in a relative sense) – also known as “single-base” mode – is now common place.
These systems are also referred to as RTK systems (“real-time-kinematic”), and make feasible the use of GPS/GNSS-RTK for many time-critical applications such as engineering surveying, GPS/GNSS-guided earthworks/excavations, machine control and structural monitoring applications.
Over the last decade and a half the use of GPS (and now GNSS) for structural monitoring, of dams, bridges, buildings and other civil structures, has grown consid-erably (see Ogaja et al., 2007, for a recent review), and nowadays the GNSS-RTK technique is widely used around the world. Such systems output continuous streams
38
of coordinate results (or time series). The dynamics of the structure typically defines the nature of the coordinate analysis. For example, if a structure vibrates or deflects due to wind or surface loading the time series analysis is conducted in the frequency domain (see, e.g., Li et al., 2007), otherwise standard geodetic deformation monitor-ing techniques based on advanced network least squares analysis are used (Ogaja et al., 2007).
Fig 3: Leica GNSS Spider Positioning is centralized RTK processing “multi-baseline” software.
The interest of having at least two GNSS Reference Stations in a monitoring project is that both GNSS Reference Stations can also check each other in a relative mode to detect eventual movements that would be disastrous on the GNSS Monitor-ing points. Last but not least a second GNSS Reference Station is also part of back-ing-up the system. This is clearly an “Integrity Control” solution.
The other significant advantage of having a “centralized” processing approach is that for the processing of the various baselines, the GNSS Reference Station can be selected freely and all combination of baselines can be considered.
Even more interesting is that the position between the GNSS Control Points or monitoring stations can also be processed using different combination and mode. Each baseline for instance can be processed in dual frequency (L1 and L2) mode but also in the single frequency mode (L1) and considering only GPS or GPS and GLONASS.
The resolution of the ambiguities has been also extended with the “Quasi-Static” initialisation method where the variance of the GNSS monitoring station is con-sidered for speeding up the initialisation time to fix.
39
5. GNSS POST-PROCESSING AND TOTAL STATIONS FUSION DESIGN
If GNSS positioning technology allows various mode of processing such as “Real Time Kinematic” only the “Post-Processing or “Near Real Time” mode is able to combine closely and at a compatible accuracy the measurements GNSS receivers with those obtained by the Total Stations an integrated rigorous Least-Squares Ad-justment model.
The final design the author would suggest is then the following:
Fig 5 : Author’s final design proposal considering two GNSS Reference Stations surrounding the Hydropower Dam’ sites to be integrated with the Total Stations
measurements by using 360° reflectors collocated with the GNSS Antenna’s Control Points into a global Least Squares Adjustment model.
To summarize the value proposition to consider more than only one GNSS Ref-erence Station in that model:
The computation of single baselines from the GNSS Reference Station to the GNSS Control Points cannot be controlled (no redundancy) independently and will depend entirely of the performances of that GNSS Reference Station. Simply said, there is no”back-up” no double check. Karl Friedrich Gauss favourite’s sentence was “Eine messung is keine messung!” that could be translated by “One measurement is not a measurement!”
One can argue that already in the design, the Total Station’s measurements can control the performances of the GNSS processing (comparing the directions Hz, Vz and the slope distances Ds). But that will not bring enough contrast in the solution to clearly indentify possible “outliers” and much more important to discriminate if it is a movement induced by the deformation of the structure or simply by the noise level of the solution.
40

The Total Station measurements will also be affected by the refraction caused by the water surface and the high humidity level. It’s suggesting to install meteo sensor outside the hut protecting the Total Station to mitigate some part of the refrac-tion influence (using the well known Barrel and Sears model) but comparing the dis-tance from the GNSS Receivers and the distance deduced from the solution obtained from the Total Station will “scale-up” the distance biased by the remaining un-mod-elled effects of the refraction. Therefore the following design will allow experts to study and derive the correct refraction model applicable in such very local case and tune the network processing accordingly the results.
We cannot pretend that the areas where Hydro Power dams are located will not be subject to deformation as well. There is a large interest today in the “reservoir induced earthquake”. In numerous parts of the world today, including some of the most highly developed countries, many dam designers and operators have tended to close their eyes to the engineering problems posed by reservoir-induced earthquakes. Virtually every careful study has concluded that there is indeed a cause-and-effect re-lationship between some earthquakes and some reservoirs, and two dams (Koyna, In-dia, and Hsinfengkiang, China) have in fact come uncomfortably close to disastrous failure during such events. Furthermore, it is precisely in the regions of low natural seismicity where the major existing problems lie, because in areas of high seismicity dams are usually designed for substantial earthquake resistance anyway. For those reasons, the author is advocating to have one of the GNSS Reference Station as “Master” Reference Station to be part of a Regional Integrity monitoring program that would ideally be lead by the institution that has such positioning infrastructure under his responsibility.
We would like to stress that for “safety” driven projects, the results provided by a Deformation Permanent Monitoring System must be un-ambiguous and definitively not subject to contestation or justification by “force majeure” elements.
6. PROCESSING WORKFLOW
All the data streams from the GNSS Receivers are gathering in real time mode into software such Leica GNSS Spider and share with different modules.
Leica GNSS Spider Site Server is managing the incoming observation streams to archive and convert the data into the RINEX file format for quality check, transfer to the Integrity Monitoring processing centre and used for GNSS Post-Processing se-quences.
At an interval defined after the pre-run analysis of the network, all the data streams from the GNSS receivers are converted into the standardized data exchange format RINEX.
As soon those RINEX files will be produced (every 10 minutes, 1 hour, 6 hour, … daily), the software will automatically post-processed the various combinations of baselines defined and will write the results into the SQL database for being pulled out by the monitoring software and combined automatically into a rigorous Least Squares Adjustment with the Automatic Total Stations measurements.
41

Fig 6: Workflow processing for GNSS RTK-Processing. The samebaseline can be processed in parallel using different parameters.
Fig 9: Workflow GNSS Post-Processing with integration of Total Station measurements into a global model of Adjustment.
42

The software is also driving the geodetic sensors such as GNSS receivers and Total Stations and processing - after reduction - the observations separately to provide estimated coordinates, while the automatic adjustment module is integrating all the observations into a global model.
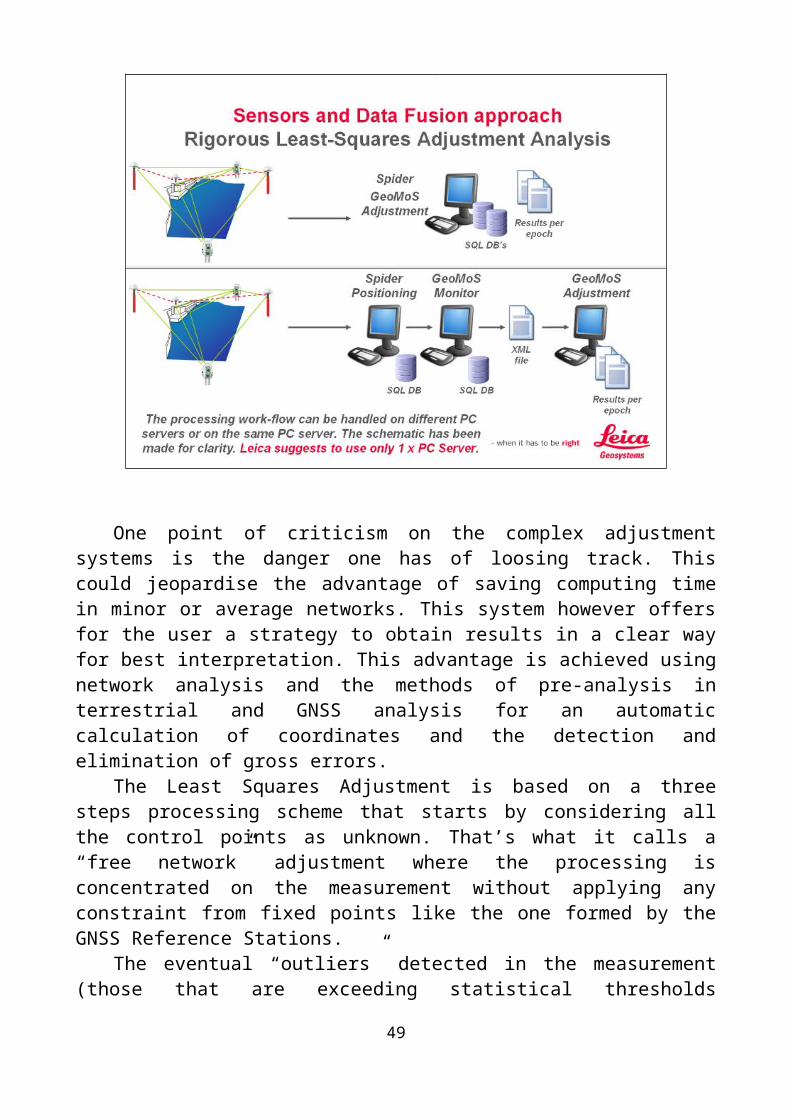
One point of criticism on the complex adjustment systems is the danger one has of loosing track. This could jeopardise the advantage of saving computing time in minor or average networks. This system however offers for the user a strategy to ob-tain results in a clear way for best interpretation. This advantage is achieved using network analysis and the methods of pre-analysis in terrestrial and GNSS analysis for an automatic calculation of coordinates and the detection and elimination of gross er-rors.
The Least Squares Adjustment is based on a three steps processing scheme that starts by considering all the control points as unknown. That’s what it calls a “free network” adjustment where the processing is concentrated on the measurement without applying any constraint from fixed points like the one formed by the GNSS Reference Stations.
The eventual “outliers” detected in the measurement (those that are exceeding statistical thresholds determined by hypothesis test confidence levels and flagged by a global F-test and a individual T-test) will be de-weight and therefore their influences will not impact the processing of the coordinates.
The second step is the “weighted constraint” adjustment, where the fixed points will be characterized with a corresponding variance-covariance matrix (stochastical
43

model) to constraint ad minima the coordinates and therefore validate the stability of the datum.
Finally the third step is the “full constraint” adjustment where all the fixed points will condition the observations to produce the last set of coordinates for the control points.
Along all those steps, a multiple hypothesis test is carry to analyse the congru-ency of the functional model (supposed to be linear while systematic errors such those induced by un-modelled effects of the refraction), the stochastical model (as-suming the a priori variance factor and the covariance are reflecting the effective ac-curacy of the observations) and the observations.
Fig 10: The automatic adjustment module is processing a rigorous Least Squares Adjustment in several steps to insure best linear unbiased estimators
for all the control points.
The automatic deformation analysis is based on epoch-by-epoch scheme by con-sidering the initial set of coordinates as the reference epoch. Each adjustment is pro-ducing a coordinates vector and its corresponding variance-covariance matrix with the a-posteriori variance factor that are first aligned using a similarity transformation type often named “S-Transformation” from which the residuals are analysed using hypothesis tests to check the “normality” of the corresponding distribution associated at each epoch.
44
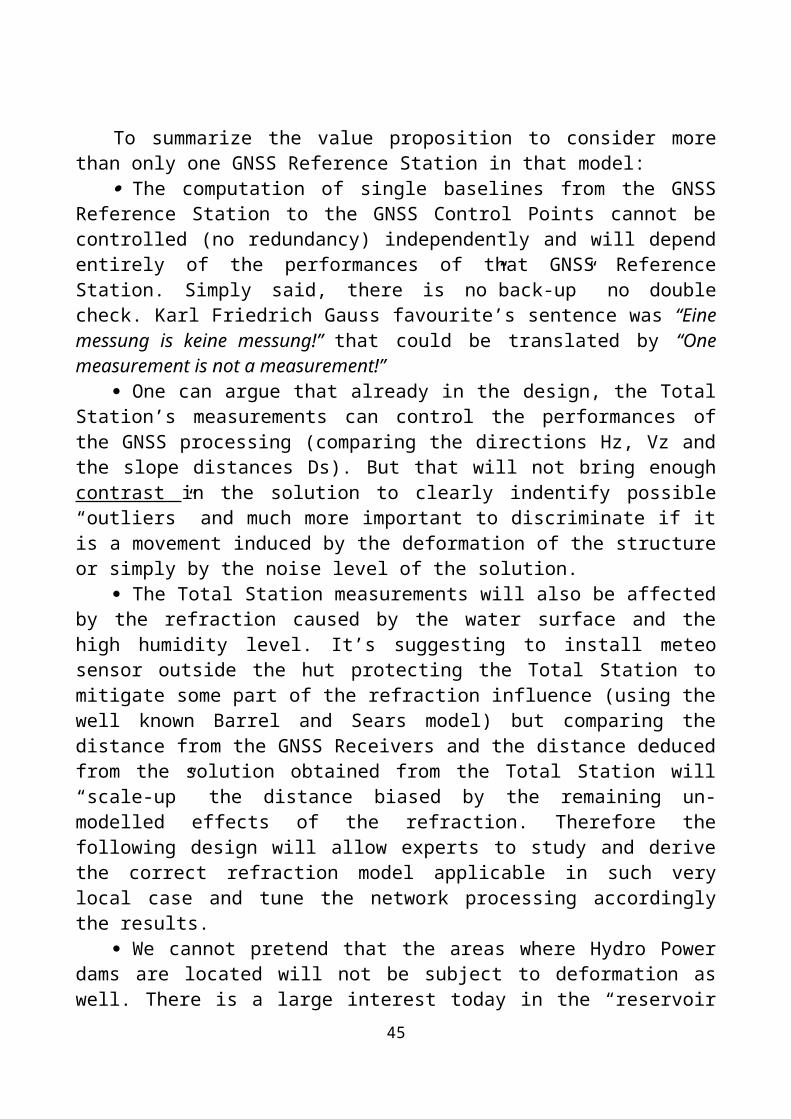
Fig 11: The automatic adjustment module is able to check if control points have moved as well as if fixed points (GNSS Reference Stations) are still stable.
7. FEASIBILITY STUDY OF A CASE DESIGN
We will examine first the situation where we could deploy three GNSS Refer-ence Stations, then we will decrease to two GNSS Reference Stations and we will ex-amine at the end what would be the performances with only one GNSS Reference Stations.
Fig 12: Design with three GNSS Reference Stations – Accuracy is meeting and exceeding the specifications.
45
Fig 13: Design with two GNSS Reference Stations – Accuracy is meeting and exceeding the specifications. Difference with three GNSS Reference Stations
is only about 0.2 mm!
From this design, we have estimated the position of every sensor as well as the position of several circular reflectors. The level of all the points has been estimated from the graphics delivered with the initial specifications.
Having all the coordinates into a grid datum arbitrary defined we simulated all the observations that would be carried in the reality.
Adjustment software has the capacity to simulate a Least Squares Adjustment ignoring the real values of the observations but considering the associated stochastical model closed to the reality and based on the instrumentation and per-formances that could be achieved in real conditions.
46

In that simulation mode the size and direction of the error ellipsoids are indicat-ors of how the design could impact on the final coordinates accuracy.
We can deduce from their numerical values that the results will be precise and homogeneous indicating that the proposed design based on three GNSS Reference Stations and the combination of GNSS Control Points collocated 360° reflector with the Total Stations meets and exceeds the accuracy requirements of the tender spe-cifications.
The output of the simulation gave us also for each observation an estimate about the capacity each of them will have to detect a deformation of the related point.
The average standard deviation for the monitored object points in plane is about 1mm for the height 1.4 mm. This allows detecting movements – deformation in the engineering object better 2mm.The local redundancy is between 30 and 70 % and al-lows a reliable detection of deformations.
Finally the selected network geometry and defined instruments (GNSS and Total Station type) allows achieving a real reliable network for a long term monitoring.
In that table we have put for that given situational design the different values for the RMS xy and RMS z as performance criteria. The point C1 is compared with the point C2 (used as a reference and processed with 3 x GNSS + 2 x TPS).
So we can see that a network based on 2 x GNSS + 2 x TPS is offering theoret-ically the same performance level in term of point’s accuracy than the 3 x GNSS + 2 x TPS.
Even in case of failure the situation 1 x GNSS + 1 x TPS is acceptable. At the end, the proposed instrument and software for a typical design guarantees to meet the specification in term of accuracy at 2 level.
In that new design proposal for a Deformation Permanent Monitoring System, the author has described the best possible way to engage the most advanced scalable and flexible geodetic monitoring solution for the various sites where again safety is the prime focus.
47

3 x GNSS + 2 x TPS
Pt Id Ellipse Or. A B Mx Mx RMS XY RMS Z RMS XY RMS ZC1 207.4 0.9 0.8 0.8 0.9 1.2 1.8 0.0 0.1C2 217.4 0.8 0.8 0.8 0.8 1.1 1.7
2 x GNSS + 2 x TPS
Pt Id Ellipse Or. A B Mx Mx RMS XY RMS Z RMS XY RMS ZC1 207.9 0.9 0.8 0.8 0.9 1.2 1.8 0.0 0.1C2 217.8 0.8 0.8 0.8 0.8 1.2 1.8
1 x GNSS + 1 x TPS
Pt Id Ellipse Or. A B Mx Mx RMS XY RMS Z RMS XY RMS ZC1 250.0 1.1 1.0 1.1 1.1 1.5 2.4 0.3 0.6C2 218.2 0.9 0.8 0.8 0.9 1.2 1.8
2 x GNSS
Pt Id Ellipse Or. A B Mx Mx RMS XY RMS Z RMS XY RMS ZC1 200.0 2.2 2.2 2.2 2.2 3.2 7.1 2.0 5.3C2 218.3 0.9 0.8 0.8 0.9 1.2 1.8
1 x GNSS
Pt Id Ellipse Or. A B Mx Mx RMS XY RMS Z RMS XY RMS ZC1 200.0 3.2 3.2 3.2 3.2 4.5 10.0 3.3 8.2C2 218.3 0.9 0.8 0.8 0.9 1.2 1.8
ACKNOWLEDGMENTS
The author would like first to express his special thanks to Dr Ivo MILEV who contributed to the simulation of the various design and also to the people who has ad-opted and are supporting Leica Geosystems geodetic monitoring solutions.
It is all the time and for every project a team work to find the best combination of instruments, processing software’s to design the most appropriated solutions for standard, critical or challenging projects.
The author knows also that in geodetic monitoring there is simply no “tradi-tional” project and for the case of the Hydro Power plant where each site is unique that sentence is particularly true.
REFERENCES
[1] Brown, N., Kaloustian, S., Roeckle M. (2008). Monitoring of Open Pit Mines using Combined GNSS Satellite Receivers and Robotic Total Stations.
48
[2] Brown, N., Troyer Lienhart, Zelzer, O., Van Cranenbroeck, J. (2006). Ad-vanced in RTK and Post Processed Monitoring with Single Frequency GPS. Journal of Global Positioning Systems, Vol 5, N°. 1-2:145-151
[3] Van Cranenbroeck, J., Brown N. (2004). Networking Motorized Total Sta-tions and GPS Receivers for Deformation Measurement. FIG Working Week, Athens, Greece.
[4] Zog, H-M., Lienhart, W., Nindl D. (2009). Leica TS30 – The Art of Achiev-ing Highest Accuracy and Performance.
[5] Van Cranenbroeck. J., Aschroft. N. (2007). Single to Multi Frequency GNSS Signal Processing Solutions for Engineering Structure Monitoring Applications. The International Global Navigation Satellites Systems Society Inc. (IGNSS) IGNSS2007 Symposium – The University of New South Wales, Sydney Australia.
[6] Van Cranenbroeck. J., Lui. V., Wu. X. (2007). ICE 5th International Confer-ence Bridge – Beijing, supported by the FIG Commission 6 WG4.
[7] Van Cranenbroeck. J. (2007). Continuous Beam Deflection Monitoring Us-ing Precise Inclinometers. Strategic Integration of Surveying Services FIG Working Week, Hong Kong SAR, China.
[8] Van Cranenbroeck, J. (2007). An Integrated Geodetic Measurement and Analysis System for Large Dams Monitoring. Hydropower & Dams issue 2 : IN-STRUMENTATION SYSTEMS FOCUS.
[9] Van Cranenbroeck, J. (2006). Core Wall Survey Control System. Opening paper – 3rd IAG Symposium on Geodesy for Geotechnical and Structural Engineer-ing, 12th FIG Symposium on Deformation Measurement.
[10] Lienhart, W. (2007). Analysis of Inhomogeneous Structural Monitoring Data. Engineering Geodesy – TU Graz, Austria. Shaker Verlag
BIOGRAPHICAL NOTES
Joël van Cranenbroeck is currently Business Technology Manager at the New Business Division of Leica Geosystems AG, Heerbrugg, Switzerland. He led the de-velopment of hardware and software solutions for GNSS Network-RTK since 2001 and made significant contributions in geodetic monitoring development and applica-tions such as the method for aligning high rise structures (such as the Burj Dubai). Joel is Chair of Working Group 6.2 in FIG Commission 6, was awarded in 2009 the title of Honored Lecturer of the Siberian State Academy of Geodesy in Novosibirsk, and is senior scientist consultant for two universities in Belgium. He designed numer-ous projects for structural monitoring applications such as bridges, dams, tunnels, etc. He worked at the Belgian Cadastre organization, at the Geodetic Department of the Belgian National Geographical Institute and in Star Informatic – a GIS software based Belgian company – before he joined Van Hopplynus, the Leica Geosystems ex-clusive representative in Belgium in 1993 as product specialist in GPS, GIS, Engi-neering and Industrial applications.
49

CONTACTS
Joël van CranenbroeckLeica Geosystems AGHeinrich Wild StrasseCH-9435 HEERBRUGGSWITZERLANDTel. +32 474 98 61 93Fax +32 81 41 26 02Email: [email protected] site: www.leica-geosystems.com
© Joël van Cranenbroeck, 2012
50

УДК 528:629.783
АВТОМАТИЗИРОВАННЫЙ ГЕОДЕЗИЧЕСКИЙ МОНИТОРИНГ С ПРИМЕНЕНИЕМ НЕДОРОГОЙ GNSS
Фолькер ШвигерТехнический университет Штутгарта, Институт инженерной геодезии, Geschwister-Scholl-Str. 24D, 70174, Штутгарт, Германия, директор института, доктор-инженер, профессор, тел. ++49/711-68584041, e-mail: volker . schwieger @ ingeo . uni - stuttgart . de , web-site: http :// www . uni - stuttgart . de / ingeo /
Ли ЧжанТехнический университет Штутгарта, Институт инженерной геодезии, Geschwister-Scholl-Str. 24D, 70174, Штутгарт, Германия, научный сотрудник, тел. ++49/711-68584049, e-mail: li . zhang @ ingeo . uni - stuttgart . de
В статье описывается использование приемников ГНСС и произвольных сетей для задач мониторинга. В эти задачи входит геодезический мониторинг зданий и инженерных сооружений и природных объектов, например оползни. Последнее время стали активно использоваться недорогие приемники. Наряду с обзором существующих систем мониторинга с использованием ГНСС приводятся и первые результаты, полученные новой системой, разработанной Институтом инженерной геодезии в Техническом университете Штутгарта. Точность определения положения составляет 2 см для измерений с интервалом 10 минут.
Ключевые слова: ГНСС, мониторинг, беспроводная сеть передачи данных, произвольная сеть, топология сетки.
AUTOMATED GEODETIC MONITORING BY LOW-COST GNSS
Volker SchwiegerUniversity of Stuttgart, Institute of Engineering Geodesy, Geschwister-Scholl-Str. 24D, 70174 Stuttgart, Germany, Director of Institute, Professor, Dr.-Ing, tel. ++49/711-68584041, e-mail: [email protected], web-site: http://www.uni-stuttgart.de/ingeo/
Li ZhangUniversity of Stuttgart, Institute of Engineering Geodesy, Geschwister-Scholl-Str. 24D, 70174 Stuttgart, Germany, Research Associate, tel. ++49/711-68584049, e-mail: [email protected]
The contribution deals with the use of GNSS (Global Navigation Satellite System) receivers and ad-hoc networks for monitoring tasks. These tasks enfold the monitoring of buildings and struc-tures as well as natural objects, e.g. landslides. The current trend is to operate plenty of low-priced receivers. Beside an overview of available GNSS monitoring systems, first results of a new system developed at the Institute of Engineering Geodesy of University Stuttgart (IIGS) are presented. The accuracy is characterized by a maximum positional deviation of 2 cm for a measurement interval of 10 minutes.
Key words: GNSS, monitoring, WLAN, ad-hoc network, mesh topology.
51

INTRODUCTION
In general, a monitoring concept has to be realized for any civil structure (Welsch et al. 2000). The monitoring itself is one of the conceptual pillars to guaran-tee the reliability and the stability of structures. The other pillars are a measure and emergency concept for occurring irregularities and possible constructive measures. Monitoring can be subdivided into visual inspection, function tests on a regular basis, and the monitoring surveys. The measurements control the state and, if a high data rate is chosen, the reaction of the monitored objects. From a geodetic point of view, monitoring deals with geometric quantities and therefore rigid body movements and deformations of the object. Since this contribution focuses on GNSS, the monitoring from outside the civil structure is of interest only. The internal view into the object is not possible using GNSS.
The dominating trends for monitoring are automation and continuity. In the past years monitoring surveys were realized in defined time epochs (e.g. once a month or once a year, so-called epoch-wise measurements). Nowadays, information concerning the state of the monitored object should be available at any time (and at any place). In emergency cases, this allows a reaction in near realtime. To ensure continuous mea-surements the measuring instruments have to stay at the monitoring site and high in-vestment costs are required compared to epoch-wise measurements. Total stations and GNSS receivers are the only possibility to continuously and automatically ac-quire three-dimensional positions. Up to now, the price of the GNSS receivers forbids their object-wide (e.g. bridges, dam walls, landslides) installation. Due to the fact that low-cost receivers are available, which deliver measurements of high quality, new possibilities arise. Currently, GNNS receivers may be purchased for definitely less than 100 €. If correct evaluation strategies and methods are used, the accuracy level is comparable to the one of expensive geodetic level receivers (Weston & Schwieger 2010).
MONITORING BY GNSS
Since 1970, GNSS have been used for geodetic tasks. At the beginning, exclu-sively the American Global Positioning System (GPS) was used; meanwhile the Rus-sian GLONASS is completely operable. The European Galileo and the Chinese Com-pass are currently in development. In the near future, the users may use 4 GNSS com-prising more than 100 navigation satellites (e.g. Kleusberg 2010).
Absolute GNSS positioning is not useful for monitoring tasks, since the accu-racy available is around some meters RMS. In contradiction, geodetic receivers can deliver positions in the sub-cm level, since they measure relatively using the precise carrier phase as observation. These geodetic receivers were used very early for geo-detic monitoring issues. As written before, the development has gone from epoch-wise to continuous measurements. For the latter, GNSS receivers are ideal, since their data acquisition is always continuous and automatic. First experiences were gained
52

by Bäumker & Fitzen (1996). In the sequel a multitude of automated GPS monitoring systems were developed. In addition to measurement and evaluation, the system GOCA comprises communication and deformation analysis (Kälber et al. 2000). Be-sides, a GPS monitoring system was investigated at TU Graz (Hartinger 2001). In re-cent years the relevant research came into accelerated motion. Particularly the Uni-versity of the Armed Force Munich has developed a system based on low-priced No-vatel receivers. It has been used for monitoring of landslides in near-realtime (Glab-sch et al. 2009). In the following, the authors describe the development and the opera-tion of mass-market GPS receivers within a WLAN ad-hoc monitoring network at IIGS. First results will be presented too.
WLAN AD-HOC MONITORING GNSS NETWORK
Normally, monitoring systems are controlled centrally and a router takes over all tasks as access point. Consequently, data acquisition is controlled by this cen -tral station and all clients transmit their data to this central station. This is the typi -cal network structure that is applied within WLAN networks, too. Principally, the nodes within wireless ad-hoc networks are organized in a different way. Hereby the dynamic mesh topology is the central element (Johnson et al. 2007). Each node comprises a router and an antenna and communicates with the nearest neighbor node. This means that any node may serve as access point. Crucial to the monitor -ing system is the fact that the data can search for their own way through the net, independent from the path. Therefore it is without importance which path the data have taken. Besides, this way is not detectable without an intervention into the net -work system. As a rule, the communication in ad-hoc networks as well as in cen-trally controlled networks is based on standards of the Institute of Electronic and Electronical Engineers IEEE802.11X and uses the WLAN frequency 2.4 GHz. The major advantages of the mesh topology are the improved robustness and the in -creased band width. Both is possible due to the parallel data communication on al -ternative paths within the network. Consequently, ad-hoc routing algorithms are required. These are the essential base for self-organisation and self-networking of the individual nodes.
In general, the band width is no drawback with respect to monitoring problems, since individual measurement values like inclinations and temperatures or classical geodetic quantities like distances and angles are transmitted. In the case of GNSS the data volume is definitely higher: for each receiver 4.7 kbit/s are transmitted for a sampling rate of 1 Hz. These requirements are fulfilled by the CabLynx Wireless Router that is integrated into an ad-hoc network for recent investigations at the IIGS. The router is used as WLAN router, but has the possibility to realize data transport via UMTS and GPRS, too. Since the network is self-organized, the receiving and the transmitting directions for the data are not known a-priori. Additionally, these direc-tions may change, if e.g. a link is disturbed by external influences. Hence, an omni-directional antenna is required (for the described system the respective antenna of the
53

company VIMCOM is used). The autonomous system is completed for each node by a solar panel, a charge controller, and a battery. The heart of the router are the U-Blox GPS antenna ANN-MS and the newest U-Blox GPS receiver LEA-6T. The LEA-6T delivers GPS raw data like code and phase measurements through a clearly defined interface into a proprietary data format. This is the foundation for the evalua-tion possibility of the GPS data in the cm-accuracy-level. Fig. 1 shows an overview of the system components, Fig. 2 presents the equipment of one node. The low-cost GPS antenna was upgraded with a metal shielding (ground plate) to reduce multipath effects.
Figure 1: Realised system architecture
54

Figure 2: Equipment of one autonomous node
Fig. 3 presents the advantages of the dynamic mesh topology using the example of the IIGS GPS monitoring system. Three GPS-equipped nodes were built up. It could be shown that WLAN communication still works for distances longer than 1 km, if the WLAN antennas are installed in a height of approximately 3 m. The ac-quired data should reach the central station that is responsible for evaluation and anal-ysis. Between client 1 and the central station line-of-sight was not available. Never-theless all data reached the central station. If now client 2 was shut down and there-fore excluded from the network topology, the central station did not get any data from client 1. Hereby two facts could be shown empirically: At first that a disturbed line-of-sight does not permit communication; at second that the mesh topology au-tonomously finds a suitable alternative.
55

Figure 3: Test area in Stuttgart-Vaihingen
FIRST RESULTS
To evaluate raw data, the following steps of the procedure are realized in the central station (Roman 2011):
- Identification of the node for any data set and generation of node resp. station-related files in proprietary format (own software),
- Generation of files in a defined exchange format (RINEX-Format) per station using the freeware TEQC (TEQC, 2012),
- Determination of relative station co-ordinates with respect to the central using the GPS evaluation software WA1 (WA1, 2012).
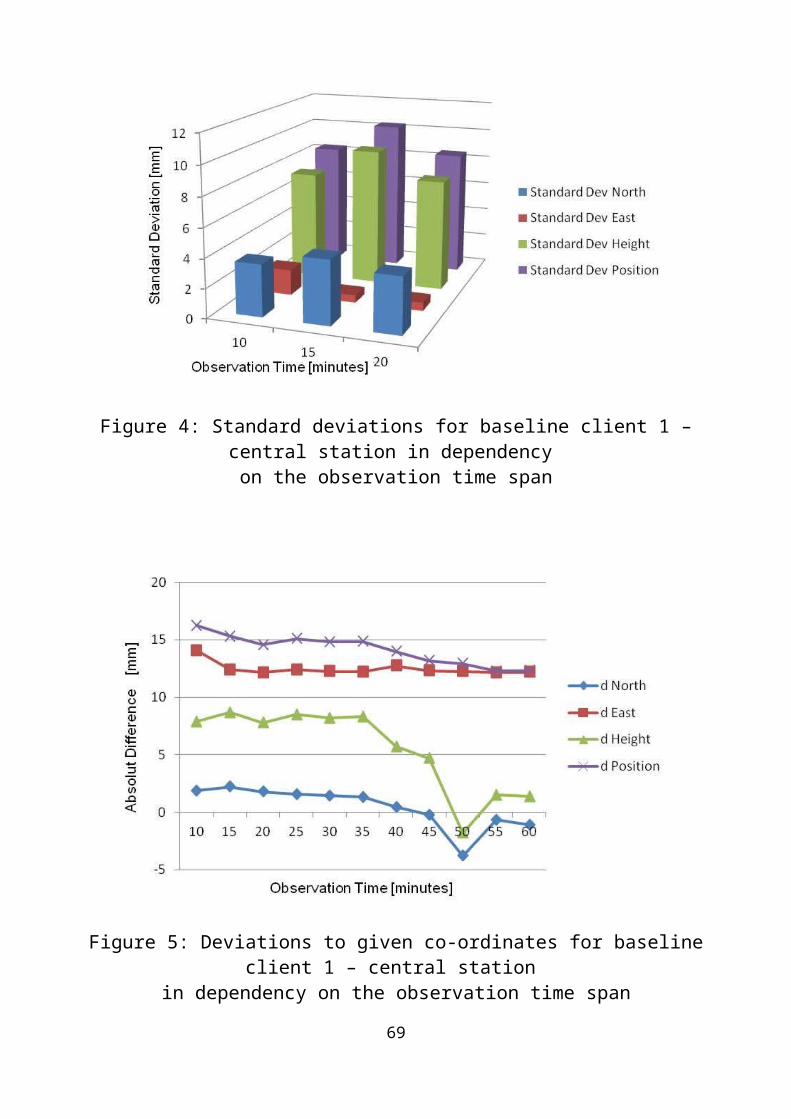
Using the example of the measurement configuration shown in the last section (Fig. 3) the accuracy of positioning is determined for different observation time inter-vals. The co-ordinates of all stations are known at sub-mm-level for evaluation pur-pose. Two one-hour sessions were measured, meaning that 6 baselines (three-dimen-sional relative co-ordinates) could be evaluated. First one hour was completely evalu-ated. Subsequently, the observation interval was reduced in 5 minute steps up to a value of 10 minutes. Fig. 4 presents the repeatability standard deviations for the time spans between 10 and 20 minutes for the baseline between client 1 and the central station. For horizontal co-ordinates standard deviations below 4 mm are reached, in-dependent of the observation time span. The vertical component, the height, leads to a worst three-dimensional standard deviation below 1 cm.
Since the co-ordinates of the individual stations are given with sub-mm accu-racy, a measure of accuracy can also be determined with respect to these given co-or-dinates. Fig. 5 shows the deviation of the average to the given co-ordinates for all ob-servation time spans for the same baseline. For the north component and the height a marginal dependence from the time span can be seen. The east component shows higher values and no dependence of this sort. Altogether, the deviations stay below 2 cm for the three-dimensional positional deviation. The systematic east deviation may
56

have its cause in the use of non-calibrated antennas. The calibration should improve the results (see e.g. Schwieger & Wanninger 2006).
Figure 4: Standard deviations for baseline client 1 – central station in dependency on the observation time span
Figure 5: Deviations to given co-ordinates for baseline client 1 – central station in dependency on the observation time span
57

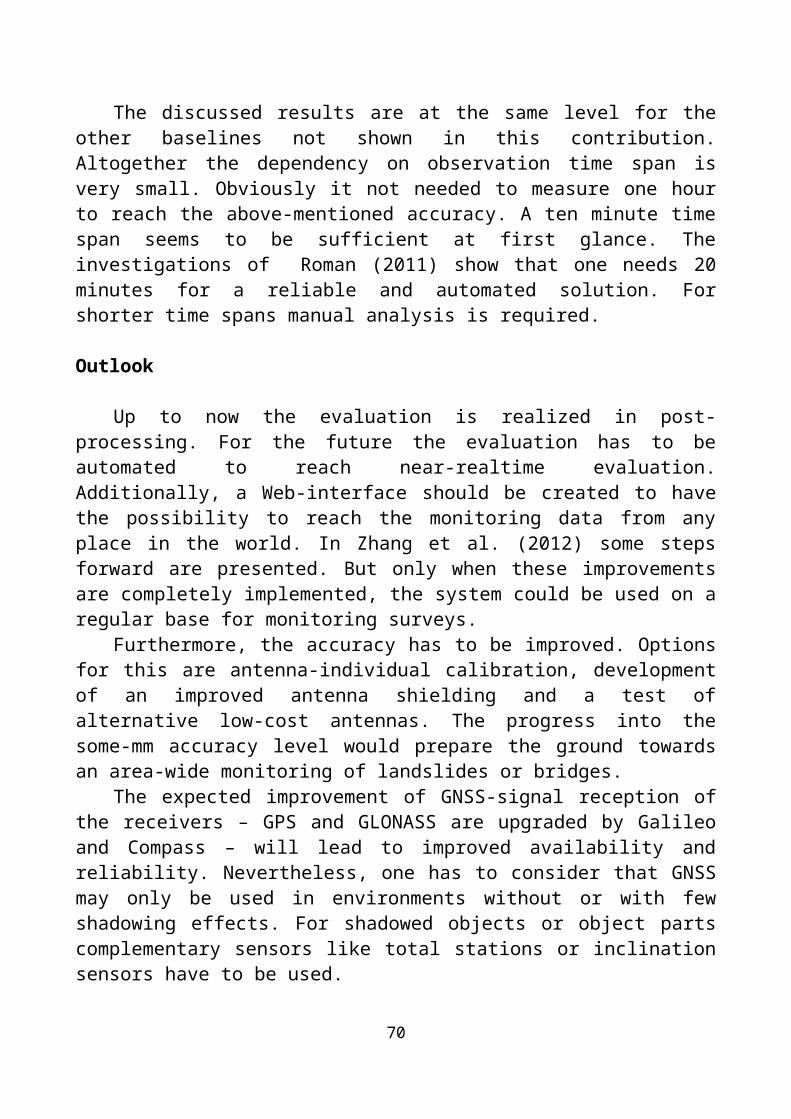
The discussed results are at the same level for the other baselines not shown in this contribution. Altogether the dependency on observation time span is very small. Obviously it not needed to measure one hour to reach the above-mentioned accuracy. A ten minute time span seems to be sufficient at first glance. The investigations of Roman (2011) show that one needs 20 minutes for a reliable and automated solution. For shorter time spans manual analysis is required.
Outlook
Up to now the evaluation is realized in post-processing. For the future the evalu-ation has to be automated to reach near-realtime evaluation. Additionally, a Web-in-terface should be created to have the possibility to reach the monitoring data from any place in the world. In Zhang et al. (2012) some steps forward are presented. But only when these improvements are completely implemented, the system could be used on a regular base for monitoring surveys.
Furthermore, the accuracy has to be improved. Options for this are antenna-indi-vidual calibration, development of an improved antenna shielding and a test of alter-native low-cost antennas. The progress into the some-mm accuracy level would pre-pare the ground towards an area-wide monitoring of landslides or bridges.
The expected improvement of GNSS-signal reception of the receivers – GPS and GLONASS are upgraded by Galileo and Compass – will lead to improved avail-ability and reliability. Nevertheless, one has to consider that GNSS may only be used in environments without or with few shadowing effects. For shadowed objects or ob-ject parts complementary sensors like total stations or inclination sensors have to be used.
Remark
The content of this contribution was before published to a large extent in Ger-man language in Schwieger & Zhang (2012).
References
Bäumker, M., Fitzen, H.P. (1996): Permanente Überwachungsmessungen mit GPS. In: Brandstätter, Brunner, Schelling: Ingenieurvermessung 96 - Beiträge zum XII. Internationalen Kurs für Ingenieurvermessung, Dümmler, Bonn, 1996.
Glabsch, J., Heunecke, O., Schuhbäck, S. (2009): Monitoring of the Hornbergl landslide using recently developed low cost GNSS sensor network. Journal of Ap-plied Geodesy, de Gruyter Verlag, Issue 4, 2009.
Hartinger, H. (2001): Development of a Continuous Deformation Monitoring System using GPS. Shaker Verlag, Aachen 2001.
Johnson, D., Matthee, K., Sokoya, D., Mboweni, L., Makan, A., Kotze, H. (2007): Building a rural wireless mesh network, Version 0.8. Wireless Africa Team of the Meraka Institute, Südafrika, 30. Oktober 2007.
58
Kälber, S., Jäger, R., Schwäble, R. (2000): A GPS based online control and alarm system. GPS Solutions, Vol. 3, Issue 2, 2000.
Kleusberg, A. (2010): GNSS – Überblick. In: GNSS 2010 – Vermessung und Navigation im 21. Jahrhundert 100. DVW-Seminar, 04./05. October 2010, Köln, Schriftenreihe des DVW, Vol. 63, Wißner Verlag, Augsburg.
Niemeier, W. (2007): Monitoring – was ist der Beitrag der Geodäsie. Inge-nieurvermessung 07, Beiträge zum 15. Internationalen Ingenieurvermessungskurs Graz, 2007, Wichmann Verlag, Heidelberg.
Roman, M.A. (2011): Commissioning and Investigations regarding a Low-Cost GPS Monitoring System. Master Thesis, Faculty of Geodesy – Technical University of Civil Engineering Bucharest & Institute of Engineering Geodesy – University of Stuttgart (not published).
Schwieger, V., Wanninger, L. (2006): Potential von GPS Navigation-sempfängern. In: GPS und Galileo. 66. DVW-Seminar, 21./ 22. February 2006, Darmstadt, Schriftenreihe des DVW, Vol. 49, Wißner Verlag, Augsburg, 2006.
Schwieger, V., Zhang, L. (2012): Automatisches geodätisches Monitoring mit Low-Cost GNSS. In: Messtechnik im Bauwesen, Wilhelm Ernst & Sohn Special, Berlin, in print.
TEQC (2012): http://facility.unavco.org/software/teqc/teqc.html. Last accessed: February 2012.
Ubéda, S. (2008): Ad Hoc Networks: Principles and Routing, in Wireless Ad Hoc and Sensor Networks (ed. H. Labiod), Wiley-ISTE, London, UK.
WA1 (2012): http://www.wasoft.de/wa1/index.html. Last accessed: February 2012.
Welsch, W., Heunecke, O., Kuhlmann, H. (2000): Auswertung geodätischer Überwachungsmessungen. Vol. 2, Reihe Handbuch Ingenieurgeodäsie, Herbert Wichmann Verlag, Heidelberg.
Weston, N.D., Schwieger, V. (2010): Cost Effective GNSS Positioning Tech-niques. FIG Publication No 49, FIG Commission 5 Publication. The International Federation of Surveyors, Copenhagen, Denmark.
BIOGRAPHICAL NOTESProf. Dr.-Ing. habil. Volker Schwieger1983 – 1989 Studies of Geodesy in Hannover1989 Dipl.-Ing. Geodesy (University of Hannover)1998 Dr.-Ing. Geodesy (University of Hannover)2004 Habilitation (University of Stuttgart)2010 Professor and Head of Institute of Engineering Geodesy,University of StuttgartDipl.-Ing. Li Zhang2002 – 2003 Studies of Geodesy in China (University of Wuhan)2004 – 2009 Studies of Geodesy in Germany (University of Stuttgart)2009 Research Associate at Institute of Engineering Geodesy,University of Stuttgart
59

CONTACTSProf. Dr.-Ing. habil. Volker Schwieger / Dipl.-Ing. Li ZhangUniversity of StuttgartInstitute of Engineering GeodesyGeschwister-Scholl-Str. 24 DD-70174 StuttgartGERMANYTel. + 49/711-685-84040 /-84049Fax + 49/711-685-84044Email: [email protected] / [email protected]
gart.deWeb site: http://www.uni-stuttgart.de/ingeo/
© V. Schwieger, Li Zhang, 2012
60

УДК 528:629.783
ПРИЧИНЫ УСПЕХА И НЕУДАЧ ПРОЕКТА ГНСС ИНФРАСТРУКТУРЫ ДЛЯ ПОЗИЦИОНИРОВАНИЯ В РЕЖИМЕ РЕАЛЬНОГО ВРЕМЕНИ
Джоел ван КроненброкLeica Geosystems AG, Heinrich Wild Strasse – CH 9435, Швейцария, директор отдела развития бизнес-технологий, тел. +32 474 98 61 93, факс: +32 81 41 26 02, e-mail: joel . vancra - nenbroeck @ leica - geosystems . com
Винсент ЛуиLeica Geosystems Ltd, Unit 1701-3, DCH Commercial Centre, 25 Westlands Raod, Quarry Bay, Hong Kong, Китай, специалист по техническим вопросам и менеджер по продажам (Гонконг, Тайвань и Монголия), тел: +85-296-848571, e-mail: vincent . lui @ leica - geosystems . com . hk
Большинство проектов GNSS Network RTK («ГНСС для работы в режиме реального времени») разрабатывались только с целью сокращения затрат на содержание и обслуживание традиционной геодезической сети, в которой значительная часть бюджета владельца тратилась на содержание опорных реперов. В местах, где отсутствует геодезическая сеть, но ставится задача создания и содержания инфраструктуры пространственных данных, необходимая для управления землей и кадастровыми операциями GNSS Network RTK может оказаться неоценимой.
Авторы руководили разработкой технологии, ее рекламированием, проектированием и внедрением различных инфраструктур позиционирования с использованием GNSS Network RTK в разных странах мира.
В статье рассматриваются причины, которые, по мнению автора, могут сделать проект ГНСС инфраструктуры для позиционирования в режиме реального времени успешным или убыточным.
Есть ли будущее для такой инфраструктуры сети, и каковы должны быть условия для их устойчивости? Какова реальная экономия? Действительно ли продажа поправок является единственным продуктом и насколько пользователи готовы платить за сервис, который бы поставлялся при условии создания собственной ГНСС активно действующей станции?
Рассматриваются вопросы, касающиеся необходимых мер по инвестициям в GNSS Net-work RTK и изменению конструкции существующей сети, чтобы сделать такую сеть наиболее выгодной.
Ключевые слова: GLONASS, GPS, ГНСС, централизованная обработка данных, поправки RTCM, NTRIP, инфраструктура позиционирования, мониторинг целостности, бизнес, оператор, концессия, маркетинг, управление проектом.
THE REASONS TO SUCCEED AND TO FAIL A GNSS RTK POSITIONING INFRASTRUCTURE PROJECT
Joël van CranenbroeckNew Business Division of Leica Geosystems AG, Heinrich Wild Strasse – CH 9435 Heerbrugg, Switzerland, Business Technology Manager, tel. +32 474 98 61 93, fax +32 81 41 26 02, e-mail: [email protected]
Vincent LuiLeica Geosystems Ltd, Unit 1701-3, DCH Commercial Centre, 25 Westlands Raod, Quarry Bay, Hong Kong SAR China, Technical Specialist Sales Manager (GPS, Engineering Solutions - Hong
61

Kong, Taiwan & Mongolia Region), tel: +85-296-848571, e-mail: [email protected]
Most of the GNSS Network RTK projects have been developed by the economical justifica-tion that an active geodetic network would reduce the cost of maintaining a traditional geodetic net-work where the maintenance of the benchmarks and the control survey were a significant part of the owner’s budget. GNSS Network RTK can also be justified where there was no geodetic network to assist the creation and the maintenance of a Spatial Data Infrastructure to support land governance and cadastre operations.
The authors have been in charge of both the development of the technology and also on the promotion, the design and the implementation of numerous GNSS Network RTK positioning infra-structures worldwide.
That paper is dealing with the reasons the author has indentified to make such project a suc-cess or a failure.
Is there still a future for such infrastructure and what would be the conditions to make them sustainable? What is the real economy? Is selling corrections the only product and how the users are prepared to pay for a service that could be still delivered by setting up their own local GNSS Base Station?
Those questions will be reviewed to conclude about the possible changes needed to consider still an investment in a GNSS Network RTK of a great value and how re-engineering an existing GNSS Network RTK can be beneficial.
Key words: GLONASS, GPS, GNSS, Centralized Processing, RTK, RTCM corrections, NTRIP, Positioning Infrastructure, Integrity Monitoring, business, operator, concession, marketing, project management.
SUMMARY
Most of the GNSS Network RTK projects have been developed by the economi-cal justification that an active geodetic network would reduce the cost of maintaining a traditional geodetic network where the maintenance of the benchmarks and the con-trol survey were a significant part of the owner’s budget.
A GNSS Network RTK can also be justified where there was no geodetic net-work to assist the creation and the maintenance of a Spatial Data Infrastructure to support land governance and cadastre operations. We also have seen the decision to deploy such technology as part of prestige from governmental organizations but with-out a clear analysis of user’s need and business plan leaving such positioning infra-structure with only few users and a request to re-engineer the approach.
The authors have been in charge of both the development of the technology and also on the promotion, the design and the implementation of numerous GNSS Net-work RTK positioning infrastructures worldwide. That paper is dealing with the rea-sons the authors have indentified to make such project a success or a failure.
Is there still a future for such infrastructure and what would be the conditions to make them sustainable? What is the real economy? Is selling corrections the only product and how the users are prepared to pay for a service that could be still deliv-ered by setting up their own local GNSS Base Station? How to deal with the security that most countries are concerned with in term of releasing precise coordinates? Will we be able to cope with the new constellations signals? Is Precise Point Positioning
62

the technology that will make the GNSS Network RTK obsolete? Where are the hid-den costs and how much the communication infrastructure is affecting the operation expensive?
Most of those questions are open and must be reviewed to conclude about the possible changes needed to consider an investment in a GNSS Network RTK of a great value and how optimizing and re-engineering an existing GNSS Network RTK can be carried out and beneficial for the owners of such positioning infrastructure.
1. INTRODUCTION
A continuously operating GNSS reference station - or permanent reference sta-tion as it is often called - comprises a GNSS receiver and antenna set up in a stable manner at a safe location with a reliable power supply. The receiver operates continu-ously, logging raw data, perhaps also streaming (continuously outputting) raw data, and often outputting RTCM and DGPS data for transmission to RTK, GIS and GPS and GNSS navigation devices. The receiver is usually controlled by a computer that can be located remotely if necessary. The PC will usually download data files at regu-lar intervals and pass them to a bulletin board or web site for access by the GPS user community.
One or more single reference stations supplying GNSS services in the immedi-ate surrounding areas may be all that is required by some organizations. Other author-ities, however, may need to establish networks of reference stations - perhaps, 5, 10, 20, 50, or even more - to provide complete GNSS services over entire regions and even countries. A single server running a GNSS reference station software and com-municating by telephone, LAN, WAN or Internet can control all the stations in the network (PC’s are not required at the receivers). If required, the entire network can be computed automatically to determine the positions of the antennas and even to de-rive ionosphere-free area corrections for enhanced RTK performance.
This brief introduction illustrates that reference stations and networks can vary considerably in extent and complexity.
Organizations that are studying the establishment of reference stations should consider carefully what they will be used for, what services they will have to provide, and what will be the appropriate levels of sophistication and cost.
2. WHAT ARE GNSS REFERENCE STATIONS USED FOR?
The first reference stations, in the days when GPS was in its infancy, were set up along coastlines to transmit DGPS corrections to improve the accuracy of ship navi-gation.
Today, with the widespread acceptance of high-precision GNSS measurement techniques, GNSS reference stations are being established all over the world in ever increasing numbers to monitor the earth’s crust, to provide geodetic control, to sup-port surveying, engineering, GIS and precise positioning, as well as to monitor natu-
63

ral and man-made structures and to support machine guidance systems in agriculture and construction sites.Geodetic control for surveying, engineering and GIS
A network of continuously operating GNSS reference stations can easily replace a traditional triangulation/traverse network. The stations can be set up at convenient locations in areas where they are needed (rather than on remote hilltops). Network geometry is not as critical as with traditional networks, and the accuracy is higher and more consistent. Users set up their field receivers in the areas in which they are work-ing, download reference station data via the Internet, and compute their positions. The stations can also transmit RTK and DGPS data for direct use by RTK and GIS field rover equipment.
Such a network can be of almost any size. Whilst one or two stand-alone refer-ence stations may be all that is required for a local area, town and municipality, open-cast mine or engineering site, a multi-station network will usually be needed to pro-vide full GNSS service coverage for a large county, region or entire country.
Endless permutations
GNSS reference stations and networks can be used in many ways for many ap-plications.
Stations and networks can be set up and configured for just one particular appli-cation and one user group. Or they can be designed to be multi-functional to support a wide range of applications and a multitude of users.
A single reference station may be perfectly sufficient for a small locality. A multi-station, multi-purpose network will often be preferred for an entire region.
The permutations are endless.
3. POINTS TO TAKE INTO ACCOUNT WHEN DECIDING WHAT TYPE OF STATIONS AND NETWORK ARE NEEDED
GPS reference stations and networks are readily scalable. They can be easily en-hanced and upgraded as requirements change and the number of users increases. Thus, initially, it will often be quite sufficient to establish only the stations and ser-vices that are really needed.
Afterwards, as the requirements increase, the number of users grows and addi-tional funds are available, new stations and features can be added and the services that are provided can be improved and enlarged.
The initial investment is never lost.What is required?What applications have to be supported?What will the stations and/or network be used for?What is needed today?What will be needed in future?
64

The area to be coveredWhere to establish the stations?What can be the separation distance between stations?The need for suitable sites with an open view of the skyPower, communication, securityThe infrastructure that is readily available and can be usedThe new infrastructure that has to be addedThe type of users that have to be supportedThe number of users that have to be supported Is it sufficient simply to log data and provide RINEX files? Is it also required to transmit RTK/DGPS data?The most suitable methods of communication between the receivers and the
serverThe most suitable methods for distributing RTK/DGPS dataThe most suitable communication for distributing RTK/DGPS dataThe cost of establishing the stations and/or networkThe cost of running the stations and/or networkThe running costs for RTK and GIS roversComputing the baselines between stations to check the positions of the anten-
nasThe budget that is available todayThe budget that will be available in futureCharging for services and dataWho is effectively the ownerWho from the organisation will be effectively in charge of supervising the sys-
temWhat is planned for promoting the servicesWhat is the vision over the next 5 yearsDoes a business plan and a financial plan available
4. CHARGING FOR PRODUCTS SUCH AS RINEX AND RTK/DGNSS DATA.
Reference stations and networks require significant investments.Running costs, particularly for networks, have to be considered.Some organizations establish standalone reference stations or networks purely
for their own use. Other organizations provide products and services for the GPS user community: they allow access to RINEX files and possibly raw data files on an FTP server, they distribute RTK and DGPS data, and they may even provide transforma-tion parameters in order that RTK and GIS rovers can easily transform WGS84 val-ues into the local coordinate system.
If users of GNSS rover receivers are able to obtain the required data easily and reliably from permanent reference stations, they derive benefits from the services and do not need to invest in additional receivers for use as temporary field references.
65

Many organizations that operate reference stations and networks are interested in recovering at least part of their investment and covering their running costs. They would like to charge for the data and the services that they provide.
With the advent of new satellite constellations (COMPASS/BEIDOU, GA-LILEO) provisional budget must be consider to upgrade the installation on both hard-ware and software knowing that replacing the most sensitive element – the GNSS an-tenna – will force for having a new set of very precise coordinates.
5. ECONOMICAL JUSTIFICATION FOR A GNSS POSITIONING INFRASTRUCTURE
It is well recognized today that a reference network comprised of permanent GNSS stations provides the fundamental infrastructure required to meet the needs of professional GPS users in many areas of surveying and mapping. Examples of ap-plications are found in survey control work, densification of existing geodetic net-works, acquisition of data for GIS applications, cadastral operations, determination of fiducial points for photogrammetric work, monitoring of engineering works, mapping of utility corridors, assets, etc. In fact, the number of applications benefiting from the establishment of permanent networks seems to be growing daily.
The widespread use of RTK GNSS and DGNSS techniques has encouraged de-cision-makers to look for ways to replace traditional geodetic networks with networks of permanent GPS reference stations. For example, a tighter control of the networks can be achieved from the data supplied by permanent reference stations both in post-processing and in real-time. With streaming data, the influence of those spatial and temporal errors affecting GPS measurements can be estimated in real-time. This in turn means the quality of the transmitted corrections is improved and the range of RTK GNSS increased.
6. CAN THE COSTS ASSOCIATED WITH PERMANENT GNSS NETWORK BE RECOVERED?
The majorities of permanent GPS networks have been, and will continue to be for some time to come, initiatives primarily from government agencies.
These government entities have been able to justify the costs of implementing GPS networks by citing the approach of "preventable costs"; similar to the strategy used to finance the establishment of classical geodetic networks decades earlier. The return on the original investment is not measured in nominal terms of hard revenue but in keeping the costs borne by the industry lower than the alternative. This ap-proach also encourages network standardization and avoids the appearance of a patchwork of private, customized networks for project-specific purposes.
The net result of these free, but limited, services has been to give the user the impression that the distribution of differential GPS corrections should remain free of charge, and that the cost of establishing and maintaining the networks, and providing services should be assumed by the network operators.
66

This statement is supported by the marked decrease in the number of paying users for the GNSS correction services provided by companies a few years ago. They have since struggled to remain competitive in the face of the U.S. presidential de-cision to turn off Selective Availability on the GNSS signal.
Even today, agencies are facing an uphill battle in trying to convince potential users to subscribe to their GNSS corrections services. The primary reason is the dis-proportionate cost for the offered services with regard to the limited number of cus-tomers.
It may be useful to compare our present situation with that of cellular phone ser-vice providers several years ago. There is no denying that these companies are now seeing healthy profits from the various levels of wireless service they offer today. However, when the products were first introduced to the public, the companies gambled on the presupposed reliability and variety of services to lure the customers, and offset an often complex and costly infrastructure.
Evidence that their investments paid off can be found in the steady increase in the number of users over the years and the attraction for new service offerings being rolled out on a regular basis. These services are indeed new applications that users have been willing to pay for.
7. NEED FOR NEW INFORMATION BROADCAST SERVICE BASED ON GNSS NETWORK
This is not wishful thinking resulting from our infatuation with communication technologies, but truly an achievable goal. Decision-makers wish to control the qual-ity of services based on the type of products their networks provide.
They are also committed to providing GNSS network solutions in the appropri-ate reference system. Coordinate transformations should not been seen purely as side products: the very purpose of permanent GPS networks is to offer a complete integ-rated datum-consistent solution. To those who argue that the transformation al-gorithms could be integrated into the rover units, and that a certain level of control can be achieved by forcing the user to calibrate his system on existing control points; we answer that in doing so, we have eschewed our responsibility for providing a complete solution.
We must add also that the software applications used to manage permanent GPS networks could, and even should, incorporate functions to monitor usage and/or charge users for services.
Provider companies have already begun to integrate user monitoring applica-tions into their software products by including the display of user positions, recording the number of requests for specific services, and generating statistical information that form the basis for charging users.
This type of functionality is now considered essential by the GNSS Network op-erators giving them the ability to exercise control over their networks in order to en-hance the value of their services.
67

The subject of increased data integrity is then creating considerable interest among GPS network operators. What if they could provide a service that bypassed the problems that users routinely encounter in processing their own data?
A reliable network service providing high-quality and high-fidelity solutions would no doubt generate significant revenue.
8. TO SUCCEED OR TO FAIL WITH A GNSS NETWORK PROJECT
All the previous considerations should however not hide the scope of this paper concerning the way to succeed or to fail a GNSS Network RTK project.
There is a clear indicator to measure the success or the failure of a GNSS Net-work project and that is the number of users actually connected to the services. Being setup as a free of charge or pay service, the number of users must generally be greater than 10 by GNSS Reference Station. For a GNSS Network of let’s say 25 GNSS Ref-erence Stations, the operator should question himself is the number of users is less than 250 while networks of 100 stations actually are not far to support 2500 users.
And with new interest of the non surveying communities such farmers and con-tractors it’s clear that that rule of thumb must be adapted and reviewed.
If we often prefer to listen about the success, it’s also in our human nature to learn by our mistakes and failures and the case of a GNSS Network does not differ than any other project with some specifics that must be carefully considered.
The most important is to remind the sentence that “how a project starts, a project ends”. If a GNSS Network starts without serious investigation on user’s needs and expected services delivered in term of accuracy and availability, reliability and format, it will fail. If a GNSS Network starts without reviewing and consulting with all the potential users, it will fail. Marketing is certainly important and no one will be surprised to assist a failure when few people were aware about the proposed services.
What do you mean by infrastructure?
We often refer a GNSS Network RTK as a positioning infrastructure while in general the services delivered are mainly RINEX files, corrections streams and cent-ralized post-processing facility. Except for that last case, a GNSS Network RTK is not delivering the user’s position. In Japan and in Germany there are GNSS Network RTK operators that allow the use of a Client Server RTK service where the users are streaming their rover observations to a central site and from where they get their posi-tions processed centrally in real time.
If we compare a GNSS Network RTK with a well known communication infra-structure such a high way we could say that the road and tool gates are what we have with the system. Services can complement such gas station and shopping centre, re-creational area and at first for sure emergency services, police and rescue.
That doesn’t mean that the high way owner will prevent any driver to eventually crash his car or to cause an accident. The drivers are fully responsible about the way
68
they drive. Education and sanction for strange behaviour and high speed are often used to prevent accidents but again at the end the driver is alone.
In our case, the driver is the GNSS rover user and he should first know how to use his equipment at its best, understanding that a minimum number of satellites must be in view and that the configuration (GDOP) is a key success factor.
The highway authority is our GNSS Network RTK operator and is responsible for delivering on real time the best corrections, integrity and availability. Communic-ation is the most sensitive factor for both player and we can in our example assimilate the communication with the weather conditions if the telecommunication partner is not under control or not integrated as partner. While weather (ionosphere) can cer-tainly also be a disturbing factor especially when we reach a peak in the solar activity which is the case today.
Also it is becoming a good practice for a GNSS Network operator to deploy sev-eral permanent rover RTK in order to monitor exactly as the users the performances of the system otherwise discussions will flow in and out about who is right and wrong.
Normally any kind of vehicles are allowed on a high way and that must be the rule here as well. Often the GNSS Network RTK infrastructure supports any brand of GNSS RTK rover by distributing standard formats such RINEX, RTCM and NTRIP protocol. But that must be explained and there is a great benefit for the GNSS Net-work RTK owner to deliver extensive documentation for the potential new user.
Too many times we have questions about how the existing equipment is compat-ible or not…
Pre-analysis, investigation and market research
That is the starting point and methods exist to not only put in face what will be available in term of service and what kind of different classes of users will be served.
That is often an easy mistake to start from the today capacity of a GNSS Net-work RTK in term of functionalities to derive the expected target community. That will not make the infrastructure evaluating over the time.
The right way is to question all the organisations and individual about their need in term of positioning. Accuracy, reliability, availability, cost, charging mechanism, rover equipment needed with the associated communication device and the transmis-sion services are several of the questions that helps to drive the preliminaries.
Then a map can be drawn and at the start the future owner will have an idea about the number of potential users and what the functionalities he has to consider satisfying the needs.
Unfortunately we know cases where that analysis has not carried out properly and when the project is released there is a big disappointment when the potential users seem not interested by the services and are still considering setup their own local GNSS Reference Station.
69
It may be helpful to ask the support from consultants or from other organisations that did such projects successfully. The role of a consultant is critical for building a complex infrastructure so why not to consider?
Normally at that stage a business plan, a financial plan and the business model(s) must be drafted and regularly reviewed.
The network operator is not necessarily the owner
Organisations traditionally in charge of geodetic operations are often responsible for studying and deploying GNSS Networks to turn their geodetic passive network into an active one. Most of the time and by nature (governmental agencies) those or-ganisations are not business or profit oriented and should consider in the operations a tier operator who will be responsible for making the services profitable.
We have seen cases where even the system provider or telecommunication part-ner has been charged for the operations and for charging the services or simply to de-liver the subscriptions.
The idea to place the infrastructure for concession should be considered when the owner doesn’t have experience and capacity for charging and managing the rev-enue of the services.
It’s all about marketing
Questions rose also about how to target more users. We know projects where after several years of operation, responsible asks us how to bring more users connect-ing to the system.
There are professional organisations that should be informed and most probably have some interest that their members are part of the user community.
We never waste our time to educate people and to teach them what exactly the system will deliver in term of benefit and also what the system will never be able at that present time to deliver.
In some place there is an annual meeting with all the users to review the services and to derive where improvements are requested and what kind of new services will be appreciated to leverage the number of users.
When users are happy with the services it’s also good marketing to let them share their experiences with new coming members.
The most common reasons to fail
If we cannot list in that paper all the reasons such project will with a great prob-ability encounter some failures there are however several points that are very sensit-ive
Communications is one of the major reasons. The users complain that they cannot get the corrections all the time leading them to discouragement and lost in ef-ficiency on the field. If not addressed properly on timely manner, such users will con-
70

sider to setup back their own local GNSS Reference Station. But communication problem can also be on the infrastructure side where regularly several GNSS Refer-ence Stations are not streaming their raw data.
Improper coordinates is another reason to fail. Not only must the coordinates of all the GNSS Reference Stations be accurately determined in the same reference frame that the satellites precise orbits are but the transformation from that reference frame to the local grid coordinate system must be accurately addressed as well. We do know GNSS Network RTK where there is no user just because the coordinates that they can derive don’t match with the geodetic control points.
Who is operator? If the organisation in charge of delivering the associated ser-vices of a GNSS Network RTK infrastructure doesn’t have 24/7 a call centre with an expert reaction to address the user’s issues or to repair the system in case of down op-erations, the project will fail. Often there is not enough man power allocated to the project and if there is only one champion he will quickly burn out especially with success and more and more users. The people who are installing and serving the sys-tem must have a deep knowledge on the GNSS technology, communication, IT infra-structure, on site intervention etc. Last no least, we have also seen unfortunately or-ganisation where the initiator left by leaving no one capable to take over. In that case all the investment is fading away.
Charging too much or just for free. Organisations that has no confidence in the deliveries or organisations who most of the time don’t want to take responsibility, will offer the service for free with the net result that if something is going wrong, after all no one is paying for the service when it works. On the other side, charging too much will prevent people to consider the costs if they exceed what they can man-age themselves by using a local GNSS Reference Station setup.
The reasons to succeed
The good news is that there are also reasons to succeed and we would like to summarise what we have identified as key factors for successful projects.
The main reason to succeed is to have a deep understanding about the need to have such infrastructure and associated services.
Often no people are questioning about the importance to have a proper geodetic frame especially when GIS is part of the main activity of the organisation. Coordin-ates are just vital to carry the information. But traditionally the geodetic points were delivering for a small amount of money hidden by the public investment to maintain the geodetic network.
When the users are adopting massively GNSS RTK technique to provide posi-tioning, the need is there because potential users are already looking for lowering costs, improving the quality and efficiency.
In general the reasons to succeed are found in a careful deployment of the GNSS Network RTK and the associated services. The so called “hotspot” strategy is paying off most of the time. Looking to serve first the community of users who are interested by the services will lead the organisation to phase its services.
71

The second reason to succeed is to plan for the success with business plan, fin-ancial plan, various business models and long term vision. Having an infrastructure where every user is “connected” must leverage the interest to provide much more ser-vices. After all, the communication is established and it would be a shame to leave it without taking the opportunity to use the “carrier” to provide much more than just the corrections.
The third reason is to correctly lead the project (previous proper planning will prevent piss poor performances) and to have competent people and common goals. Again there is nothing new as any project success is based on those remarks. But we are often surprised to see that such common senses are not necessarily present every-where.
Finally the success of such project is reflecting how performing an organisation is managing successfully other projects.
There is no question about the need for such infrastructure today and in the fu-ture as every place with an intense economical activity that needs positioning, a GNSS Network RTK will be just what is needed. Every city, airport, harbour, region, country will face that needs anyway. Our civilisation is digital and we are looking for being ubiquitous in our social transaction.
The responsible for setting up and maintaining GNSS Network RTK infrastruc-tures will have to follow up also the technology and have a critical review. Today the academics are bringing PPP (Precise Point Positioning) as a panacea to suggest that such infrastructure may become obsolete.
Also with the advent of new satellite constellations it has been quoted that the distance between the GNSS Reference Stations will become greater than the recom-mended 80-100 km in medium latitude areas while actually no one can still get access to those future signals. However 20 years ago, no one would have even imagined run-ning GPS in real time mode over long distance. Communications were radio based and even Internet was not considered as a data streaming media.
At the end of the day, that is the user’s new applications and challenges that will decide the operators to implement more sophistication, while on the other side stay-ing close to the research world is definitively the place to anticipate the future.
9. CONCLUSIONS
After having been technology driven from the last decade to convince large or-ganisations to consider the deployment of GNSS Network and with the soon coming new GNSS constellations such COMPASS/BEIDOU and GALILEO, questions are raised about how finally justify the costs of such positioning infrastructure and even-tually to make them profitable.
The crucial question is however how to make such project successful?There is no doubt that in that paper the authors are just questioning the matter
and they will continue to elaborate on that topic based on their quite unique and ex-tensive experience in other publications.
72

Projects are the fact and based on people and organisation and we may not won-der that rules exist to make them successful or failure. Common sense are often neg-lected when people are blind by technology and forget finally that a solution is an an-swer to a problem or a need that must be clearly expressed and declined in term of expecting functionalities.
The good news is that any of such projects can be re-analysed and re-engineered to turn eventually any issue or failure into success.
The authors will warmly welcome any remark, experience; question and request related to that sensitive topic and would be pleased to contribute to any project con-fronted with questions raised in their paper.
BIOGRAPHICAL NOTES
Joël van Cranenbroeck is currently Business Technology Manager at Leica Geosystems AG, Heerbrugg, Switzerland. He led the development of hardware and software solutions for GNSS Network-RTK since 2001 and made significant contri-butions in geodetic monitoring development and applications such as the method for aligning high rise structures (such as the Burj Dubai). Joel is Chair of Working Group 6.2 in FIG Commission 6, awarded in 2009 the title of Honored Lecturer of the Siberian State Academy of Geodesy in Novosibirsk, and senior scientist consultant for two universities in Belgium. He designed numerous projects for structural moni-toring applications such as bridges, dams, tunnels, etc. He worked at the Belgian Cadastre organization, at the Geodetic Department of the Belgian National Geograph-ical Institute and in Star Informatic – GIS software based Belgian company – before he joined Van Hopplynus, the Leica Geosystems exclusive representative in Belgium in 1993 as product specialist in GPS, GIS, Engineering and Industrial applications.
Vincent Lui is Sales Manager and Technical Specialist at Leica Geosystems Hong Kong office, in charge of GNSS products, GNSS network system and engineer-ing solution including structural deformation monitoring for Hong Kong, Macau, Taiwan and Mongolia. Vincent is currently developing a GNSS network infrastruc-ture and a number of positioning services and systems in Hong Kong that serve for many applications including deformation monitoring in the area of subsidence, land-slide, bridge, water dam and high-rise building.
He has over 17 years of experience in the field of GNSS, navigation, reference station infrastructure and tunnel & subsidence monitoring in Hong Kong and China.
CONTACTSJoël van CranenbroeckBusiness Technology ManagerNew Business Division - Leica Geosystems AGHeinrich Wild StrasseCH-9435 Heerbrugg
73

SwitzerlandMobile : +32 474 98 61 93Email: [email protected] site: www.leica-geosystems.com
Vincent LuiLeica Geosystems LtdUnit 1701-3, DCH Commercial Centre,25, Westlands Road, Quarry Bay,Hong Kong SARChinaTel. +852-2161-3882Mobile: +852-9684-8571Email: [email protected]
© Joël van Cranenbroeck, Vincent Lui, 2012
УДК 528.721.222:656.21
74

ПРИМЕНЕНИЕ МОБИЛЬНОЙ СКАНИРУЮЩЕЙ СИСТЕМЫ RIEGL VMX-450 ДЛЯ СЪЕМКИ ОБЪЕКТОВ ЖЕЛЕЗНОДОРОЖНОЙ ИНФРАСТРУКТУРЫ
Иво Милевtechnet-rail 2010 GmbH, Берлинский университет прикладных наук им. Бойта, Германия, Goethestr. 42,10625 Berlin, доктор наук, генеральный директор, тел: +49 (0)30 5484 0785, факс: +49 (0)30 5482 6798, моб: +49(0)1772276273, email: [email protected]
Николас ШтудницкаRIEGL Laser Measurement Systems GmbH, Austria, Riedenburgstraße 48, 3580 Horn, магистр наук в области коммуникации и СВЧ техники, менеджер по коммерческому развитию и международным продажам, тел. +43 2982 4211, факс: +43 2982 4210, e-mail: [email protected]
Геральд ЗахRIEGL Laser Measurement Systems GmbH, Riedenburgstraße 48, 3580 Horn, Austria, менеджер по продукции, мобильному лазерному сканированию, тел. +43 2982 4211, факс: +43 2982 4210, e-mail: [email protected]
Последние годы мобильное лазерное сканирование стали использовать в разных областях. Основное его назначение – определение маршрутов движения железнодорожного и автодорожного транспорта.
В ноябре 2011 был реализован совместный проект фирм RIEGL LMS GmbH, Deutsche Bahn Netz AG и technet-rail 2010 GmbH на трассе Франкфурт-на-Майне - Германия. Для работы использовалась мобильная сканирующая система RIEGL VMX-250 [RIEGL2012], установленная на дрезине, для съемки всего железнодорожного полотна, рельсов, линий передач и соседние рельсовые пути.
Поперечно расположенный лазер системы RIEGL VMX-250 позволяет обнаруживать тонкие объекты, даже если они расположены перпендикулярно направлению пути.
Анализ данных выполнялся с помощью специального ПО фирмы technet-rail 2010 GmbH. Программы позволяют преобразование 3D геоданных в систему координат рельсовых путей Deutsche Bahn AG с помощью существующих данных о маршруте. Здесь нет необходимости в контрольных точках. Для этих целей есть широкий набор данных: контроль на отсутствие столкновений, допуск и другие данные, которые делают систему более производительной.
Ключевые слова: mobile laser scanning, эксплуатация железной дороги, створ, инженерная геодезия, Европейская норма.
RAIL INFRASTRUCTURE MEASUREMENT SYSTEM BASED ON RIEGL VMX-450 MLS
Ivo Milevtechnet-rail 2010 GmbH, Beuth University of Applied Science Berlin, Germany, Goethestr. 42,10625 Berlin, Dr., Managing Director, tel: +49 (0)30 5484 0785, fax: +49 (0)30 5482 6798, Mo-bile: +49(0)1772276273, email: [email protected]
Nikolaus StudnickaRIEGL Laser Measurement Systems GmbH, Riedenburgstraße 48, 3580 Horn, Austria, Master de-gree on communications and radio-frequency engineering, Business Development Manager, Inter-national Sales, tel. +43 2982 4211, fax +43 2982 4210, e-mail: [email protected] Zach
75

RIEGL Laser Measurement Systems GmbH, Austria, Riedenburgstraße 48, 3580 Horn, к.т.н., Product Manager, Mobile Laser Scanning, tel. +43 2982 4211, fax +43 2982 4210, e-mail: [email protected]
Looking on the last years back the usage of mobile laser scanning has risen up in several fields. The main scope of mobile laser scanning is the detection of traffic routes such as road- and railway-networks.
In November 2011 a project was realised as cooperation of RIEGL LMS GmbH, Deutsche Bahn Netz AG and technet-rail 2010 GmbH near Frankfurt/Main - Germany.
By using the RIEGL VMX-250 System [RIEGL2012] at railcar the complete rail embank-ment, the rails itself and the power lines were captured. The detection covered even the neighbour-hood tracks.
The crossed placed laser of RIEGL VMX-250 System enables the detection of thin objects even in perpendicular adjustment to track direction.
The analysis of data was realised with rail specific software of technet-rail. The programs en-able exact transformation of geodetic 3D data sets into rail-coordinate system of Deutsche Bahn AG with the help of existing track data. Own measured control points are unnecessary. With wide range of rail orientated functions such as collision test, clearance- and rail based-measurements the system enables a productive instrument, designed for permanent use.
Key words: mobile laser scanning, railway maintenance, alignment, engineering surveying, European norm.
ZUSAMMENFASSUNG
Mobiles Laser Scanning von land- und wassergebundenen Fahrzeugen erlebte in den letzten Jahren einen rasanten Aufschwung in den verschiedensten Anwendungs-gebieten. Dazu zählen unter anderem Vermessung von Autobahnen, Straßen, Schienenwegen und Städteräumen sowie Küstengebieten und Häfen.
Im November 2011 fand in Kooperation zwischen RIEGL LMS GmbH, Deutsche Bahn Netz AG und technet-rail 2010 GmbH ein Projekt beim Hauptbahn-hof Frankfurt statt. Ziel war es, den Schienenraum mit modernster mobiler Laser Scanning Technologie von einem fahrenden Eisenbahnwaggon aus zu vermessen. Es konnte gezeigt werden, dass mit dem eingesetzten RIEGL VMX-250 System [RIEGL2012], , nicht nur die Gleiskörper selbst sondern auch Oberleitungen und Nachbargeleise präzise und zuverlässig vermessen werden können. Die kreuzweise Anordnung der beiden voll integrierten Laser Scanner ermöglicht außerdem die Erfassung von senkrecht zur Fahrtrichtung stehenden Schildern.
Bahnspezifische Software der Firma technet-rail ermöglicht in der Weiterverar-beitung der Scandaten eine exakte automatische Überführung des 3D-Datensatzes aus geodätischen Koordinaten ins Gleis-Koordinatensystem der Deutschen Bahn mithilfe von Soll-Trassen-Daten, ohne eigens vermessene Kontrollpunkte zu benötigen. Im Zusammenspiel mit weiteren Funktionen, wie achsbasierten Messungen zu aus-gewählten Objekten oder einem Kollisionstest mit frei definierbarem und geschwindigkeitsabhängigem Lichtraumrahmen, eignet sich das Gesamtsystem für den produktiven Dauereinsatz im Eisenbahnwesen.1 Das System
76

Der Vorteil der kompakten Bauweise und der leichten Transportierbarkeit des Laser Scanning Systems RIEGL VMX®-250 System ermöglicht die Montage auf einem Standard-Gleisarbeitsfahrzeug der Deutschen Bahn (DB) „GAF 100“ [WIKIPEDIA 2012] mit Ladekran (siehe Abbildung 1). Das Scanning System besteht aus zwei RIEGL VQ-250 Laser Scannern, die gemeinsam 600.000 Messungen pro Sekunde nach dem Impuls-Laufzeit durchführen, und einer IMU/GNSS-Einheit. Die starre Kopplung der Komponenten erlaubt eine stabile Kalibrierung des Gesamtsys-tems ab Werk. Das System wird auf eine Trägerplattform montiert, welche auch das modulare Kamera-Subsystem VMX-250-CS6 unterstützt.
Mit einem einzelnen Kabel wird das System mit der Kontrolleinheit verbunden, welche sich bei dieser Anwendung gemeinsam mit Stromgenerator, Netzteil, Backup-Batterie und Traversengestell auf der Ladefläche des Waggons befand. Die Stromver-sorgung des Systems gestaltete sich völlig autark und war somit unabhängig vom Bordnetz des Gleisfahrzeuges. Der Kontrolleinheit-Koffer selbst beinhaltet u.a. er-forderliche Spannungskonverter, einen Computer mit der Software RiACQUIRE für die Datenaufnahme, mehrere Wechselfestplatten, sowie einen Touchscreen für den Operator. Da der Aufenthalt von Personen auf dem Waggon während der Fahrt unter-sagt ist, wurde das System bei diesem Einsatz via Ethernet (LAN) Datenschnittstelle aus dem Führerstand ferngesteuert. Für die gesamte Vermessungsfahrt waren also nur zwei Personen notwendig: der Lokführer und ein Operator. Eine GPS Basisstation kam direkt beim Ausgangspunkt zum Einsatz.
Abb. 1: Laser Scanning System RIEGL VMX®-250 System auf einemGleisarbeitsfahrzeug der Deutschen Bahn „GAF 100“ mit Ladekran.
2 Datenaufnahme
Nachdem das System in einem 1,5-stündigen Aufbau auf dem Waggon montiert worden war, wurden die vier kalibrierten 5-Megapixel Kameras den Projektan-forderungen entsprechend positioniert und optimal eingestellt. Die Parametrierung er-folgte in der Weise, dass alle 10 Meter Bilder zeitsynchron von allen vier Kameras ausgelöst wurden.
77

Die Vermessungsstrecke wurde zulassungsbedingt mit einer Höchst-geschwindigkeit von 25 km/h befahren. Da die Vermessungsfahrt zwischen dem fahrplanmäßigen Betrieb der DB stattfand, mussten immer wieder Gleisfreigaben abgewartet werden, was zu Fahrtunterbrechungen führte. Durch Befahrung mehrerer paralleler Gleise wurden vom gesamten Streckenabschnitt mit einer Ausdehnung von ca. 5 km in einer Fahrstunde 10 GByte Scandaten und 26 GByte Bilddaten vom RIEGL VMX-250 aufgenommen. Die Dichte der resultierenden Punktewolke beläuft sich nahe den Geleisen auf etwa 3.600 Punkte pro Quadratmeter.
Um die Qualität und Vollständigkeit der Aufnahmen zu evaluieren, wurden die Daten, wie im anschließenden Kapitel beschrieben, noch vor Ort prozessiert und als Punktewolke farbcodiert mit den entfernungsunabhängigen relativen Reflexion-swerten (engl.: Reflectance) visualisiert (siehe Abbildung 2).
3 Prozessierung der Punktewolke
Nach erfolgreichem Abschluss der Vermessungsfahrt wurde umgehend mit der Prozessierung der erfassten Daten begonnen. Noch während der Abbauarbeiten des Systems vom Eisenbahnwaggon wurden die Daten der vor Vermessungsbeginn fix auf einem Dreibeinstativ platzierten mobilen GPS-Basisstation ausgelesen. Beim Laptop handelte es sich um denselben, mit dem auch das System während der Vermessungsfahrt fernbedient wurde. Innerhalb weniger Minuten wurde auch das RiACQUIRE-Projekt mit den aufgezeichneten Rohdaten von den Wechselfestplatten der Kontrolleinheit auf diesen Laptop übertragen.
Innerhalb von weiteren fünf Minuten wurde das Post-Prozessieren der Trajektorie unter Verwendung der Korrekturdaten (nach Konversion ins RINEX-Format) und Anwenden der genauen geodätischen Koordinaten, über denen der mobile Basisstations-Empfänger aufgestellt gewesen war, abgeschlossen. Obwohl GPS- und GLONASS-Observationen aufgezeichnet worden sind, wurde nur vom erstgenannten Set an Satelliten Gebrauch gemacht. Das RiACQUIRE-Projekt kann für die weitere Prozessierung der Scan- und Bilddaten ohne jegliche Konvertierung direkt von RiPROCESS geöffnet werden. Im nächsten Schritt wurde die post-prozessierte Trajektorie ins Projekt importiert und die Berechnung der gesamten Punktewolke, die sich aus knapp einer Milliarde 3D-Messpunkte zusammensetzt, mit dem „Scan Data Processing Wizard“ gestartet. Dieser selbständig ablaufende Vorgang war in knapp einer halben Stunde abgeschlossen.
Ein erster Blick auf das Ergebnis zeigte schon vor Ort die Vorzüge des Messsystems und der eingesetzten Laserscanner-Technologie (siehe Abbildung 3). Beispielsweise sind die glatt-geschliffenen Schienenköpfe von beiden Laserscannern erfasst worden und deren Punktewolken nahezu deckungsgleich.
78

Abb. 2: Farbcodierte 3D Punktwolke. Die Farbe repräsentiert denentfernungsunabhängigen relativen Reflexionsgrad der jeweiligen Zieloberfläche.
Abb. 3: Exakte Kalibrierung der Laserscanner zueinander (Scanner 1 rot, Scanner 2 cyan) ersichtlich im Querschnitt durch die Punktewolke mit (von links) Bahnsteig,
Gleiskörper und Oberleitungsmast.
Letzteres zeigt die Qualität der permanenten Systemkalibrierung. Diese gewährleistet auch nach Transport bzw. Montage/Demontage des Systems einwand-freie Ergebnisse ohne Nachkalibrierungsarbieten. Oberleitungsdrähte, Nachbarg-leiskörper und Details an Signalen sowie weiterer Eisenbahninfrastruktur sind mit hohem Detailgrad wiedererkennbar (siehe Abbildung 4).
79

Abb. 4: Detailgetreue Wiedergabe der Bahn-Infrastruktur in der Punktewolke.
Lediglich geringfügige Diskrepanzen in der Größenordnung von wenigen Millimetern sind an manchen Stellen zu erkennen, wo sich Kurswinkel-Fehler auswirken. Grund dafür ist die kreuzweise Anordnung der Scanner, welche zwar einerseits die Erfassung von senkrecht zur Fahrtrichtung stehenden Schildern ermöglicht, andererseits aber auch impliziert, dass dasselbe entfernte Zielobjekt von beiden Scannern zu unterschiedlichen Zeitpunkten wahrgenommen wird. Trajektorie-bedingte Fehler, die sich über der Zeit verändern, kommen dadurch zur Geltung. Hauptursache dieser Fehlerquelle sind vorwiegend Limitierungen durch die GPS-Genauigkeit sowie Ausbreitungseffekte der Satellitensignale. Für den Fall, dass Daten von derselben Strecke durch mehrfache Befahrung aufgenommen werden, treten dadurch auch hier im Allgemeinen Differenzen zwischen den einzelnen Punktewolken zum Vorschein.
Um Punktewolken aus mehreren Fahrten dennoch zur Deckung zu bringen, stehen dafür Werkzeuge in RiPROCESS zur Verfügung. Damit lassen sich Trajektorie-bedingte Einflüsse durch Auffinden von korrespondierenden Flächen-Beobachtungen korrigieren. Wie häufig bei Projekten im Straßenverkehrswesen und Tunnelbau angewendet, könnten an dieser Stelle zusätzlich Kontrollpunkte zur exakten lokalen Georeferenzierung verwendet werden.
Dank dem Zusammenspiel von, im Wesentlichen, guter Sicht zu GPS Satelliten, den präzisen Laserentfernungsmessungen und der Kalibrierung der Systemkomponenten musste an dieser Stelle aber nicht auf diese weiteren Werkzeuge zurückgegriffen werden. Wie sich bei dieser Anwendung zeigte, verursachen Oberleitungsdrähte, wenn überhaupt, nur vernachlässigbare Mehrwegeausbreitungseffekte der GPS-Satellitensignale. Auch ist eine exakte lokale Georeferenzierung über Kontrollpunkte nicht notwendig, wie durch die Soll-Ist-Trassenkorrektur im nächsten Abschnitt hervorgehen wird.
80

Somit kann die Punktewolke zwecks Datenaustauschs ohne weitere Bearbeitungsschritte direkt ins LAS-Format exportiert werden. Der Exportvorgang war für die komplette Datenmenge des gegenständlichen Projekts innerhalb von 10 Minuten abgeschlossen. Zur exemplarischen Weiterverarbeitung wurde lediglich ein Teilstück um die Station Griesheim mit der Länge von 0,6 km ausgewählt. Dieses Teilstück enthält etwa 26 Millionen Messpunkte, was einer Rohdatenmenge von 0,5 GByte Scandaten und 1,5 GByte Bilddaten entspricht.
4 Der Weg ins Koordinatensystem der Bahn4.1 Extraktion der Ist-Gleisachse aus der Punktwolke
Mit der Software SiRailScan der Firma technet-rail kann die Ist-Gleisachse an-hand der Punktwolke ermittelt werden. Bezugselement sind hierbei die beiden Schienen der zu bearbeitenden Strecke, wobei die Gleisachse als Mittelpunkt der Spurweite (engl.: track gauge) zwischen den Schienen definiert ist (siehe Abbil-dung 5) (LINDAHL 2001).
Abb. 5: Definition der Gleisachse über die Extraktion derSchienenkopf-Oberseite
Die Achsbestimmung erfolgt in zwei Genauigkeitsstufen, welche sich aus den verwendeten Linien, die die Schienen repräsentieren, ergeben:
1. Bestimmung der Gleisachse anhand der detektierten Schienenkopf-Oberseite (niedere Genauigkeit).
2. Bestimmung der Gleisachse anhand der modellierten inneren Schienenoberkanten (höchste Genauigkeit).
Bei der Anwendung der Methode mit höchster Genauigkeit (Methode 2) muss die Achse bereits näherungsweise vorliegen, beispielsweise aus den detektierten Schienenoberseiten (Methode 1). Nach Auswahl eines Startpunktes, auch differen-tieller Anschlusspunkt genannt, erfolgt in einem voll-automatischen Ablauf die De-tektion jener Punkte, die die Schienenoberseite repräsentieren (siehe Abbildung 6).
In die selektierten Punkte des Schienenkopfes wird zunächst eine Polylinie geschätzt, die dann im zweiten Schritt dazu verwendet wird, das bekannte Profil der Schiene möglichst genau in die Punkte einzupassen. Davon abgeleitet lässt sich nun
81
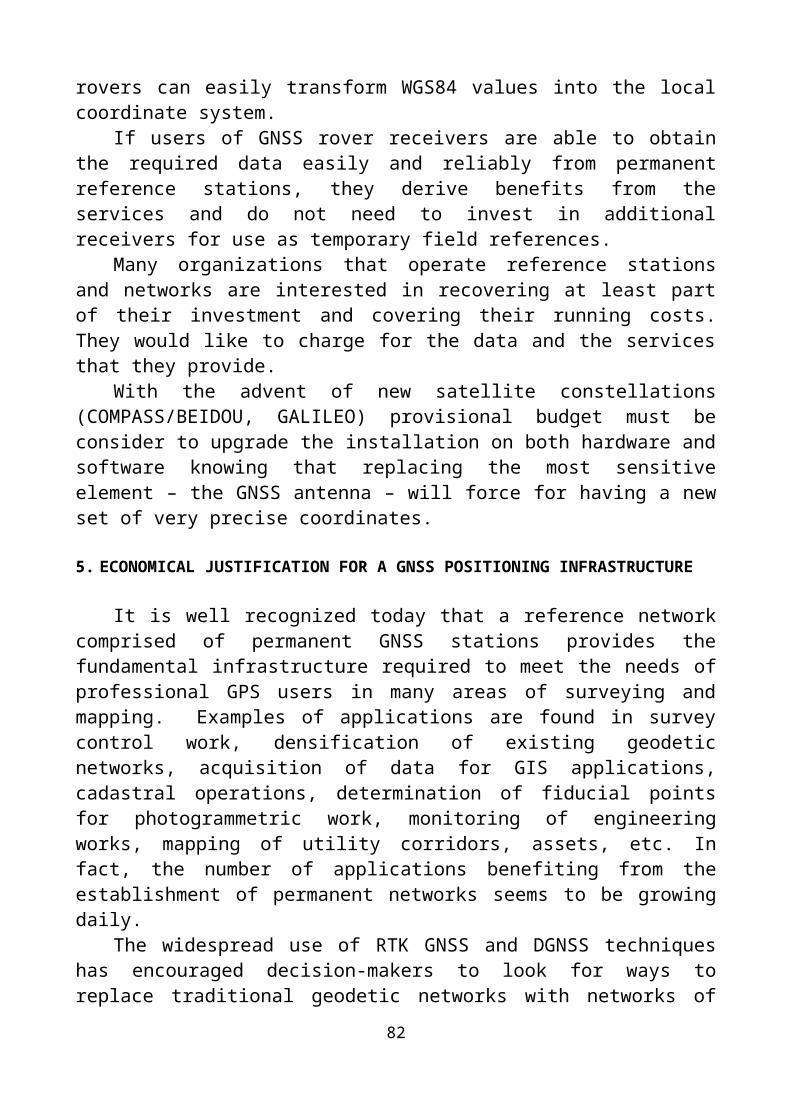
die innere Schienenoberkante mit hoher Genauigkeit bestimmen. Sobald beide Schienen modelliert sind, kann die Achse des Schienenstrangs berechnet werden, womit die Repräsentation durch die Ist-Gleisachse gegeben ist. Dieser Model-lierungsvorgang genügt den Regeln der Mathematik der fahrdynamischen Trassierung.
Abb. 6: Automatische Detektion der Schienenkopf-Oberseite in SiRailScan.
4.2 Transformation in Bahnkoordinaten
Mit dem Vergleich von Soll- zur Ist-Gleisachse lassen sich für jeden Punkt ent-lang der Gleisachse Korrekturwerte ermitteln. Dies ist die eigentliche Transformation ins Bahn-Koordinatensystem. Nach einem solchen Ausgleichsvorgang sind Strecken-nummer, Kilometrierung und Abstand zum Soll bekannt, wobei die Korrekturwerte, ermittelt durch SiRailScan, zunächst im Bahnreferenzsystem vorliegen. Das Ergebnis der Analyse und Berechnung ist in Tabelle 1 für 0,5m-Abstände exemplarisch angeführt. Dabei wird die Station in Kilometern plus einem weiteren Versatz in Metern angegeben. Der Versatz in Richtung nächster (steigender) Station wird positiv gezählt und stellt die Bezugsrichtung dar. Ebenso ist das Vorzeichen für einen (Korrektur-)Abstand in Richtung rechter Schiene positiv definiert (siehe Abbildung 7).
82

Abb. 7: Gleisachse und Definitionder Stationen und Abstände.
Tabelle 1: Ist/Soll-Korrekturdaten (Abstand) aus Sicht desBahnreferenzsystems
Lfd.Nr.
X [m](ETRS8
9)
Y [m](ETRS
89)
Z [m](ETRS8
9)
StreckenNr.
Station Abstand [m]
1 4053718,776
613708,978
4869641,868
3631 7,4+67,792
-0,068
2 4053718,725
613709,308
4869641,870
3631 7,4+68,292
-0,078
Das Anbringen der Werte aus der Korrekturtabelle steigert zwar die Genauigkeit und Reproduzierbarkeit der Geopositionierung, wird aber für diese Anwendung als sekundär wichtig angesehen. Der Hauptvorteil dieser Herangehensweise liegt in der Tatsache, dass alle Daten nach diesem Schritt exakt im Bahn-Koordinatensystem referenziert sind und darin auch weiter ausgewertet werden können.
4.3 Anwenden der Korrekturen auf die Punktewolke
Über die bekannte räumliche Beziehung des Messsystems zur Gleisachse und den exakten UTC-Zeitstempeln lässt sich eine eindeutige Zuordnung der Korrekturw-erte im Bahnreferenzsystem zur Trajektorie herstellen und somit in eine Korrekturtabelle für das RiPROCESS-Projekt umrechnen. Diese Tabelle enthält den Zeitstempel und alle 6 Freiheitsgrade wie Latitude, Longitude, Altitude, Roll-, Nick-, und Kurswinkel. Bei der Erstellung werden die entlang der Strecke äquidistant vorliegenden Korrekturwerte in den Zeitbereich übergeführt. Es ist völlig ausreichend, wenn diese für die Anbringung an der Trajektorie in etwas größeren, sinnvoll gewählten Intervallen, wie etwa im Sekundenabstand (siehe Tabelle 2), vor-liegen.
Die horizontal-transversalen Korrekturwerte (Abstände) entlang der Trajektorie müssen in einem Zwischenschritt noch umgerechnet werden, um sie in dieser Tabelle getrennt in Latitude und Longitude anbringen zu können. Es ist anzumerken, dass durch den nahezu in Ost-West-Richtung verlaufenden Bahnabschnitt die Latitude-Komponente hier sehr gering ausfällt. Die Höhenwerte erfahren in diesem ersten Schritt keine Korrektur, da der differentielle Anschlusspunkt bereits im orthometrischen System bekannt ist. Ebenso bleibt die Orientierung des Systems zu jedem Zeitpunkt unkorrigiert.
Tabelle 2: Schema einer Korrekturtabelle für RiPROCESS
Zeitstemp ∆Latitud ∆Longitu ∆Altitud ∆Roll ∆Nick ∆Kurs
83

el [s] (UTC)
e [m] de [m] e [m] [deg] [deg] [deg]
205576,0 0,001 0,077 0,000 0,000 0,000 0,000205577,0 0,001 0,084 0,000 0,000 0,000 0,000⋮
Ein erneutes Prozessieren des RiPROCESS-Projekts aktualisiert die Punktewolke und bringt sie somit ins Bahnreferenzsystem (siehe Abbildung 8).
Abb. 8: Ablauf bei der Prozessierung der Daten.
Abb. 9: Eingefärbte Punktewolke
Nach diesen Ausgleichsvorgängen und einer erneuten Prozessierung der Punktewolke mithilfe der korrigierten Trajektorie wurden die Bilddaten der vier 5-Megapixel-Kameras aufeinander abgeglichen. RiPROCESS bietet dazu die nötigen Werkzeuge. Die Bildinformation der kalibrierten und georeferenzierten Fotos kann u.a. dafür verwendet werden, um die Punktewolke anschließend einzufärben und somit anschaulicher darzustellen (siehe Abbildung 9).
5 Extraktion und Datenmanagement von Information für die Bahn
Mit dem SiRailViewer (Abbildung 10) können die Nutzer georeferenzierte Scans in ihrem geografischen Umfeld abbilden. Die Software harmonisiert zudem Daten verschiedenster Herkunft und Genauigkeit und gewährleistet einen eindeutigen Zugriff. Dies erlaubt einen bequemen Umgang mit sehr großen Datenmengen. Ferner stehen intelligente Auswertefunktionen, im Speziellen für die Lichtraumanalyse,
84

Messfunktionen für Lichtraumrahmen sowie Kollisionstests nach Euronorm zur Ver-fügung (Abbildung 11). Dabei sind die Waggon-Profile frei definierbar und werden automatisch der Fahrgeschwindigkeit angepasst. Auch ist die Einspeisung von um-fangreichem Kartenmaterial möglich und es lassen sich Parameter für frei konfig-urierbare Trassenabschnitte ermitteln.
Abb. 10: Eisenbahn GIS inkl. Laserscandaten.
Abb. 11: Achsbasierte Lichtraum-und Fahrdynamikanalysen.
Abb. 12: Markierte Kollisionspunkte, die in dasLichtraumprofil ragen
85
Mit dem Modul SiRailManager kann ein komplettes Gleisnetz angezeigt und digital verwaltet werden. Die Nutzeroberfläche des Programms greift dabei auf eine serverbasierte Kunden-Datenbank zu. Neben einer fest installierten Version ist SiR-ailManager auch als Webapplikation erhältlich. So können gespeicherte Informatio-nen zu beliebigen Streckenabschnitten bequem per Smartphone, Tablet-PC oder Lap-top an jedem beliebigen Ort abgerufen und ausgewertet werden, wie beispielsweise das Ergebnis eines Kollisionstests in Abbildung 12 zeigt.
6 Zusammenfassung
Durch das mobile 3D-Laserscanning sind schnelle, präzise und nahezu lücken-lose Aufnahmen der Umgebung möglich geworden. Flexible Einsatzmöglichkeit des verwendeten Systems sowie rasche Datenauswertung sind charakteristisch für den vorliegenden Anwendungsnachweis im Eisenbahnbereich. Mit dem Beispielprojekt wurde gezeigt, dass für die Schienenraumaufnahme ein hoher Automationsgrad in der Vermessung und Auswertung möglich ist, und dies mit bereits am Markt verfügbarer Hard- und Software. Die Endprodukte, wie Lichtraumauswertung, Echtzeit-Kolli-sionstests, Abstandsmes-sung zu Nachbargeleisen sowie Analyse des relativen Ver-laufs der Oberleitung in Bezug zur Gleisachse, können großflächig und effizient eingesetzt werden. Abgestimmte Software zum Datenmanagement verwaltet die End-produkte und garantiert die Verfügbarkeit der Informationen über Kommunikations-mittel der heutigen Zeit.
Literatur
RIEGL (2012): Datenblatt RIEGL VMX-250, RIEGL Laser Measurement Systems GmbH, www.riegl.com
Lindahl, M. (2001): Track geometry for high-speed railways: A literature survey and simula - tion of dynamic vehicle response , TRITA-FKT Report, Royal Institute of Technology, Stockholm
Wikipedia (2012): GBM GAF:http://de.wikipedia.org/wiki/GBM_GAFtechnet-rail 2010 GmbH: http://www.technet-rail.deDB Netz AG: www.dbnetze.com
© I. Milev, N. Studnicka, G. Zach, 2012
86