Embed Size (px)
Citation preview

This slide is used for start page and chaptering.
Insert your image here(The image should cover the whole grey square by doing that you automatically follow the new graphic manual)
RumsakustikErling Nilsson, Akustiker
ECOPHON Saint-Gobain

Community school no 15, Gdynia, Poland. Architect: Adam Drochomiercki. Photo: Szymon Polanski.
System: Ecophon Master A/alpha

Production unit
Distribution center
European supply chain
Forssa
A sound effect on people Our mission and vision The Ecophon Story Company facts Part of Saint-Gobain Care for environment
Our way to the market Products and systems References EndingMarket segments Production and logistics
Næstved
Hyllinge
Gliwice
Chalon

Saint-Gobain
• One of the world’s 100 leading industry groups
• Focusing on habitat and construction
• Established in 1665
• Present in 64 countries
• 190 000 employees
• ~ €40 billion in sales
Spegelsalen i Versailles

Four market segments
• Long experience of how sound affects people
• Specialised knowledge about segment specific activities
• Systems developed for specific needs
Education Modern Office Healthcare Clean Industry

Benefits of good acoustics
• Increased wellbeing and satisfaction
• Less tiredness
• Easier to concentrate
• Fewer errors
• Less stress hormones
• Easier to communicate
• More positive energy
• Increased creativity

Innehåll
• Något om Ecophon
• Rumsakustik i praktiken
• Betydelsen av god akustik
• Rumsakustik och ljudabsorption
• “Activity based acoustic design”
• Rumsakustiska mått
• Effekt av akustikreglering I klassrum
• Öppna kontorslandskap
• Några exempel på akustikreglering

This slide is used for start page and chaptering.
Insert your image here(The image should cover the whole grey square by doing that you automatically follow the new graphic manual)
Room Acoustic design in practise

Schools:
Positive effects of a good sound environment in educational premises include:
• Reduced vocal strain and voice disorders for teachers
• Improved concentration
• Reduced tiredness, fatigue and stress levels
• Easier to hear and be heard with improved speech clarity
• Optimised environment for multi-communicational activities such as group work
• Improved student behaviour and reduced burden on school and classroom
management

Healthcare:
Better sound environment contributes to:
• Lowering of blood pressure
• Improving quality of sleep
• Reducing intake of pain medication
• Reducing the number of re-admissions
• Improving the wellbeing of staff and increasing perceived performance

Open-plan offices:
• In a modern flexible OPO, the creation of a functional work station is a complex
process in which acoustic planning is only one part of a series of considerations
having to be addressed. The open-plan office should support both communication
and concentrated work. Thus, for an OPO to be an efficient and comfortable
place of work there are several other requirements than acoustic treatment that
have to be fulfilled.

Public health experts agree that environmental risks constitute 24% of the burdenof disease. Widespread exposure to environmental noise from road, rail, airportsand industrial sites contributes to this burden. One in three individuals is annoyedduring the daytime and one in five has disturbed sleep at night because of trafficnoise. Epidemiological evidence indicates that those chronically exposed to high levelsof environmental noise have an increased risk of cardiovascular diseases such asmyocardial infarction. Thus, noise pollution is considered not only an environmentalnuisance but also a threat to public health.
WHO report

Wallace Clement Sabine(June 13, 1868 – January 10, 1919)
American physicist who founded the field
of architectural acoustics
Architectural acoustics

Definition: Reverberation time
Sound pressure level, dB
Time, seconds
60 dB
T60

His formula
where
T=the reverberation time (s)
V=the room volume (m3)
A=the total equivalent absorption area (m2 sabin)
where
A
VT 16.0
T
VA 16.0
or
The equivalent absorption area A for a surface with area S m2
is equal to α x S where α is the absorption coefficient for the
surface

The broadband
reverberation time,
which considers all
frequencies
simultaneously, was
75 seconds – the
figure certified as a
world record by
Guinness.
The oil-storage complex at Inchindown, near Invergordon in
Scotland, was built during the Second World War
https://soundcloud.com/tags/sonic%20wonderland

The oil-storage complex at Inchindown

Standards and regulations

Absorption coefficient at normal incidence
AbsorberIncident sound energy
Reflected sound energy
Absorbed sound
energy
𝐴𝑏𝑠𝑜𝑟𝑝𝑡𝑖𝑜𝑛 𝑐𝑜𝑒𝑓𝑓𝑖𝑐𝑖𝑒𝑛𝑡 𝛼 =𝐴𝑏𝑠𝑜𝑟𝑏𝑒𝑑 𝑠𝑜𝑢𝑛𝑑 𝑒𝑛𝑒𝑟𝑔𝑦
𝐼𝑛𝑐𝑖𝑑𝑒𝑛𝑡 𝑠𝑜𝑢𝑛𝑑 𝑒𝑛𝑒𝑟𝑔𝑦

Absorption coefficient as a function of frequency
20 mm glass
wool absorber
directly
mounted in
front of a hard
surface
(concrete)

Glass wool

Open and closed structures
Closed cell Open cell Simple model
of porous
absorber

Microscopic structure

Sabine formula
where
T=the reverberation time (s)
V=the room volume (m3)
A=the total equivalent absorption area (m2 sabin)
where
A
VT 16.0
T
VA 16.0
or
The equivalent absorption area A for a surface with area S m2
is equal to α x S where α is the absorption coefficient for the
surface

On the use of practical absorption coefficients

On the use of practical absorption coefficients

S,
VA=equivalent absorption area, m2 sabine
V= room volyme, m3
T= reverberation time, s
absorption coefficient
α = ΔA/S
Measurement of absorption coefficients
according to EN ISO 354
α
withoutT
V
withT
VAAA
withoutwith
16.016.0

FHU - Acoustic specification
S
A
Equivalent absorption area (ISO 354)
A (m2)
Absorption factor (ISO 354)
S ?
Absorbent ceiling FHU – free hanging unit

V
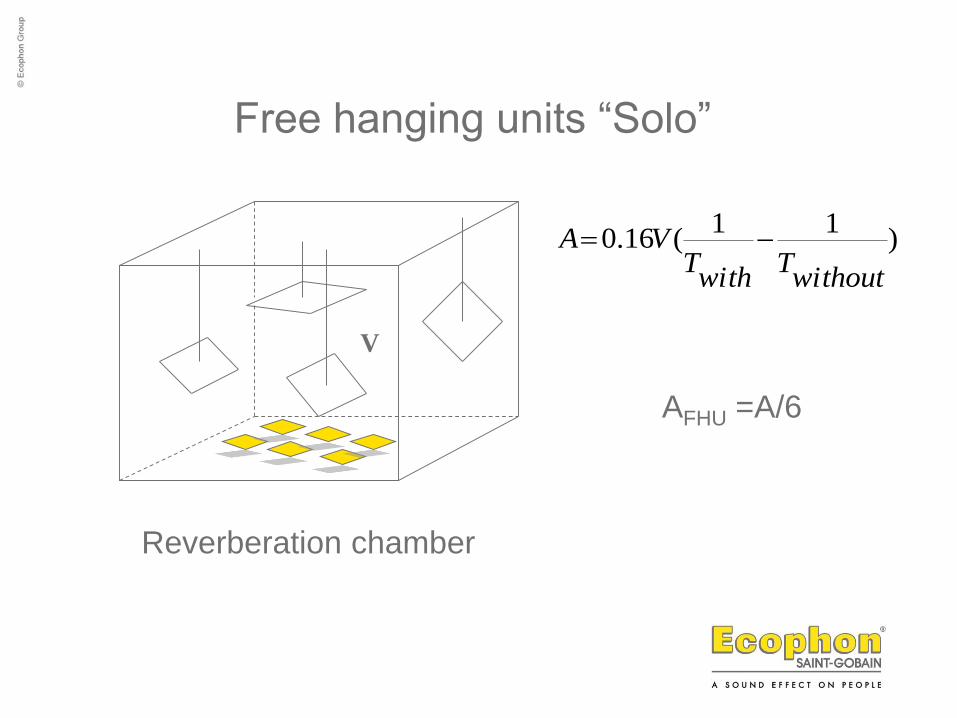
Reverberation chamber
)11
(16.0
withoutT
withT
VA
AFHU =A/6
Free hanging units “Solo”

Typical classroom

Effect of furniture
absorption
scattering
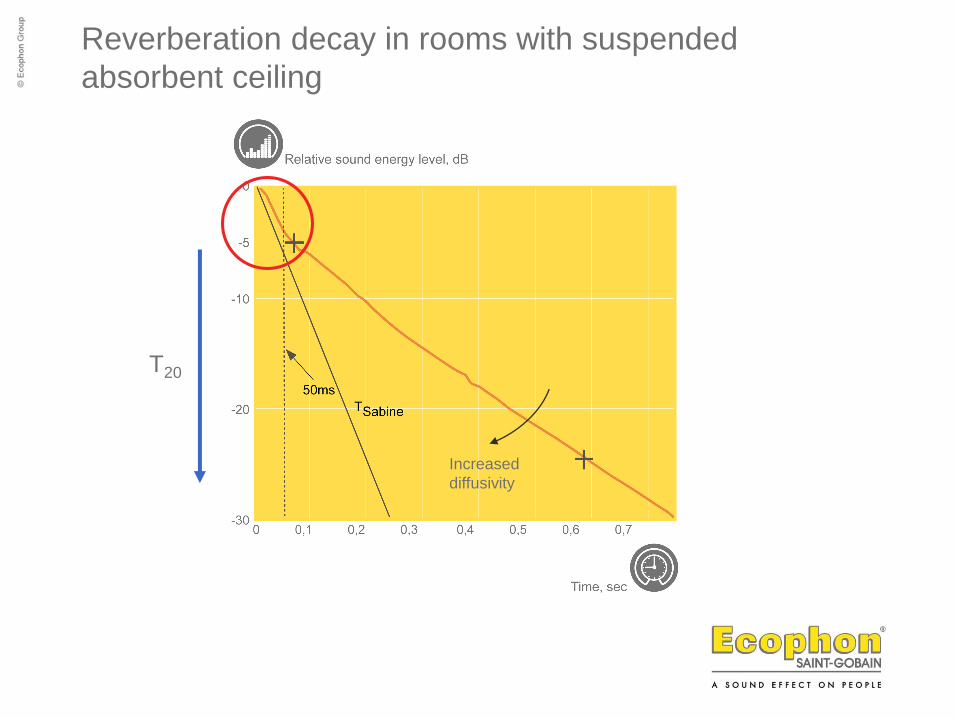
Reverberation decay in rooms with suspended
absorbent ceiling
T20
Increased
diffusivity

No boxes
Boxes on the wall
Sabine
Scattering – why is it important?
Glass wool

Absorption and scattering
𝛼 + 1 − 𝛼 ∙ 1 − 𝑠 + 1 − 𝛼 ∙ 𝑠 = 1
absorbed specularly reflected diffusely reflected

Simulation of sound fields

Lambert’s law:
𝐼 𝜃 = 𝐼 0 cos(𝜃)
Acoustical radiosityThe image source method
PARISM – simulation tool for ordinary roomsIndustrial PhD project together with DTU
Forskning

Auralisation with loudspeaker array using higher order
ambisonics
Forskning
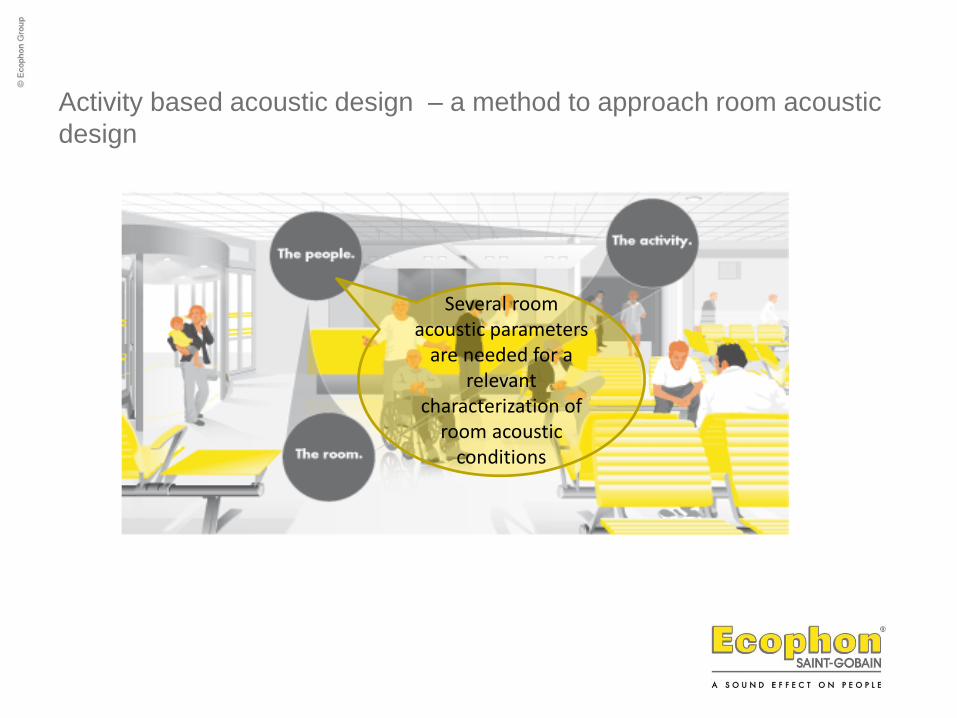
Activity based acoustic design – a method to approach room acoustic
design
Several room acoustic parameters
are needed for a relevant
characterization of room acoustic
conditions

Assessment of sound in rooms
Sound source
Physical regionPhysiological and
psychological
region Room
Sensation• Sound strength
• Clarity
• Sharpness
• …
Preference

Assessment of sound in rooms

Room types
Reverberant room
(Sabine room)
Open-plan spaces
Room with absorbent
ceiling

Room acoustic quality aspects
• Reverberation
• Speech clarity
• Auditory strength
• Spatial decay

Efterklang
• Relaterar till hur snabbt ljudenergin försvinner i ett rum
Lång efterklang
Kort efterklang

Parameters for performance spaces ISO 3382-1
Subjective quality Objective measure
Clarity Clarity index (C80)
Reverberance Early decay time (EDT))
Intimacy Sound strength (level)
Source broadening Early lateral fraction and strength
Loudness Sound strength and source-receiver distance
M. Barron, The development of concert hall design – A 111 year experience, Proceedings of the Institute of Acoustics, Vol. 28. Pt. 1. 2006
Ämnesområdet: Rumsakustik för arbetsmiljöer

ISO 3382-2: Reverberation
time in ordinary rooms
ISO 3382-3: Open plan offices
(T20 not included)
Schools
Offices
Hospitals
Ämnesområdet: Rumsakustik för arbetsmiljöer

Room acoustic quality aspects and parameters
Ordinary rooms:
• Reverberation: T20 (s), ISO 3382-2
• Speech clarity: C50 (dB), ISO 3382-1
• Auditory strength: G (dB), ISO 3382-1
Open plan spaces:
• Spatial decay: according to ISO 3382-3
Ämnesområdet: Rumsakustik för arbetsmiljöer

Useful reflections
Detrimental reflections
)end)Energy(50
50ms)Energy(0log(10C50
, dB
Definition of room acoustic measures: Speech Clarity C50 (dB)

Room acoustic measures: Sound strength G (dB)
G = LpRoom – Lp10m =Lp – Lw + 31 dB (omni-directional sound source)
10 m
G=70 dB - 60 dB= 10 dB

Calibrated Sound Power Source

Subjective listener
aspect
Room acoustic
quantity
Just noticeable
difference
Subjective level of
sound
Sound Strength G in dB 1 dB
Perceived
reverberance
Reverberation time T20 in
seconds
5%
Perceived clarity of
sound
Speech Clarity C50 in dB 1 dB
Just noticeable difference of room acoustic quantities
according to ISO 3382-1

Microphone
Loudspeaker
Reverberation
time, T20
Speech
clarity, C50
Sound
Strength, G
Impulse response
time, s
Room acoustic measurements

Small meeting rooms
Two similar rooms with different
ceiling treatment.
Room 1: Ceiling absorber αw = 1.0
Room 2: Ceiling absorber αw = 0.1
Floor area = 12 m2
Height = 2.7 m

Semantic differential
questionnairesExtremely Very Fairly Partly Fairly Very Extremely
Distinct Indistinct
Pleasant Unpleasant
Dry Reverberant
Best possiblelisteningenvironment
Worst possiblelisteningenvironment
Best possiblespeakingenvironmen
Worst possiblespeaking
environmen
X

Semantic differential
questionnairesExtremely Very Fairly Partly Fairly Very Extremely
Distinct Indistinct
Pleasant Unpleasant
Dry Reverberant
Best possiblelisteningenvironment
Worst possiblelisteningenvironment
Best possiblespeakingenvironmen
Worst possiblespeaking
environmen
X

Listening test

Listening test

Listening test

Listening test

Listening test

Measurement results
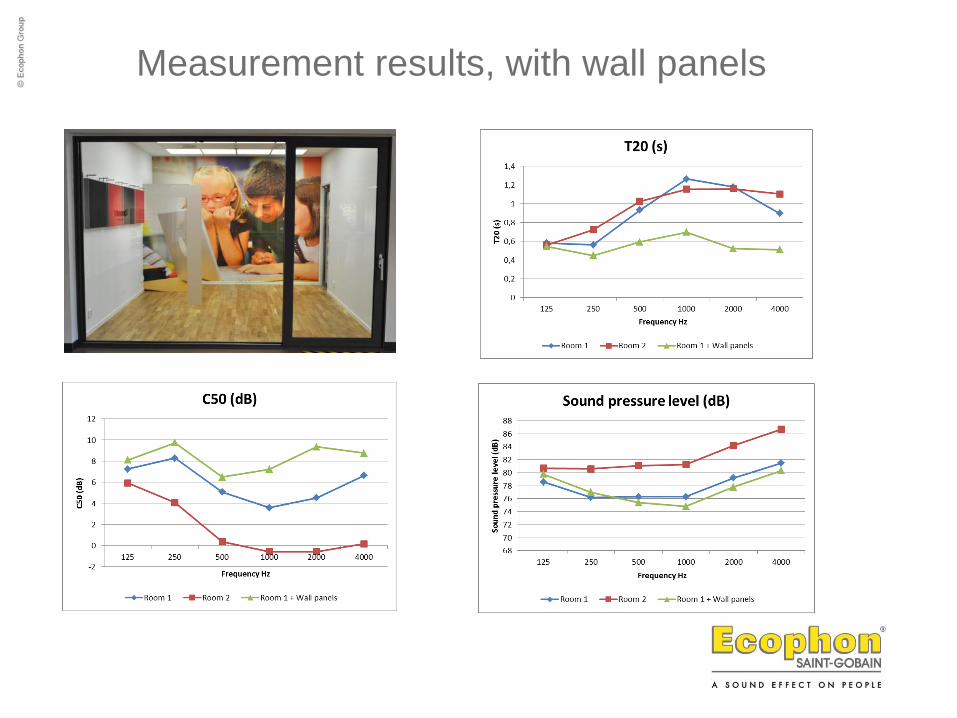
Measurement results, with wall panels

Ecophon recommendation: Schools
Criteria Parameter* Target values
Speech clarity C50 (dB) 6 – 8 dB
Sound
strength
G (dB) 15 – 17 dB
Reverberation T20 (s) 0,40 – 0,50 s
* Average 125 to 4000 Hz
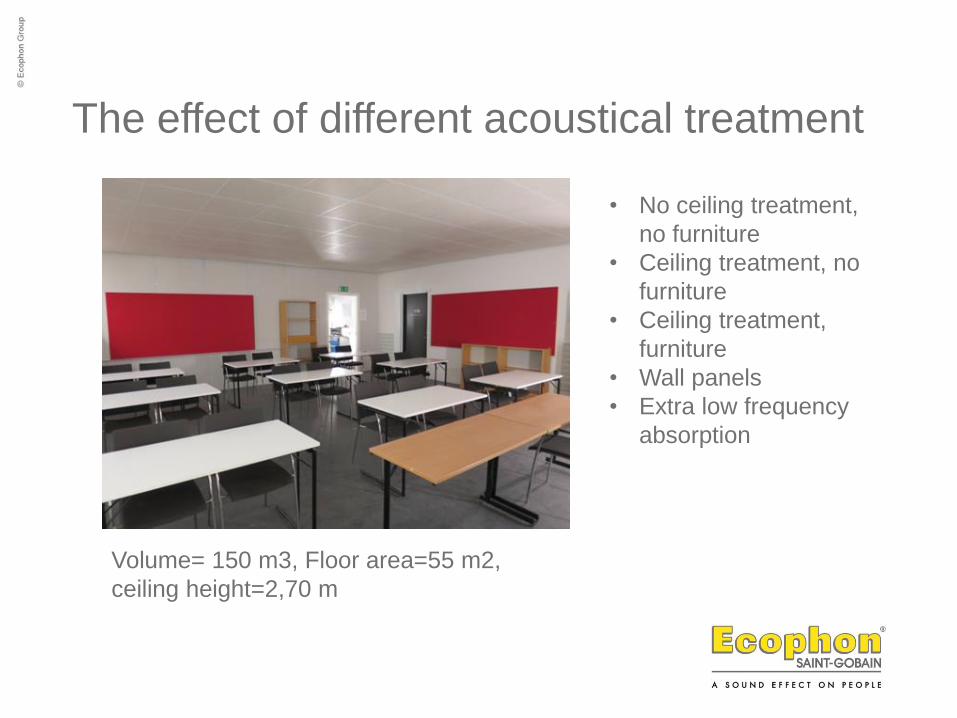
The effect of different acoustical treatment
Volume= 150 m3, Floor area=55 m2,
ceiling height=2,70 m
• No ceiling treatment,
no furniture
• Ceiling treatment, no
furniture
• Ceiling treatment,
furniture
• Wall panels
• Extra low frequency
absorption

Classroom in different configurations
Without furniture and ceiling Without furniture, with ceiling
With furniture and ceiling With furniture, ceiling and wall panels

Without furniture and ceiling
0,00
0,50
1,00
1,50
2,00
2,50
3,00
3,50
4,00
4,50
125 250 500 1000 2000 4000
Re
verb
era
tio
n t
ime
(s)
Frequency (Hz)
Reverberation time T20 (s)
-9,00
-7,00
-5,00
-3,00
-1,00
1,00
3,00
5,00
125 250 500 1000 2000 4000
Spe
ech
Cla
rity
C5
0 d
B
Frequency Hz
Speech Clarity C50 dB
0,00
5,00
10,00
15,00
20,00
25,00
30,00
125 250 500 1000 2000 4000
Sou
nd
str
en
gth
G d
B
Frequency Hz
Sound Strength G dB
Average absorption coefficient of the room
surfaces is 0,05

Practical absorption coefficient of Gedina A
0
0,2
0,4
0,6
0,8
1
1,2
125 250 500 1000 2000 4000
Pra
ctic
al a
bso
rpti
on
co
eff
icie
nt
Frequency Hz
Gedina A

Without furniture with ceiling
0,00
0,50
1,00
1,50
2,00
2,50
3,00
3,50
4,00
4,50
125 250 500 1000 2000 4000
Re
verb
era
tio
n t
ime
(s)
Frequency (Hz)
Reverberation time T20 (s)
-9,00
-7,00
-5,00
-3,00
-1,00
1,00
3,00
5,00
125 250 500 1000 2000 4000
Spe
ech
Cla
rity
C5
0 d
B
Frequency Hz
Speech Clarity C50 dB
0,00
5,00
10,00
15,00
20,00
25,00
30,00
125 250 500 1000 2000 4000
Sou
nd
str
en
gth
G d
B
Frequency Hz
Sound Strength G dB

Without furniture with ceiling
-9,00
-7,00
-5,00
-3,00
-1,00
1,00
3,00
5,00
125 250 500 1000 2000 4000
Spe
ech
Cla
rity
C5
0 d
B
Frequency Hz
Speech Clarity C50 dB
0,00
0,50
1,00
1,50
2,00
2,50
3,00
3,50
4,00
4,50
125 250 500 1000 2000 4000
Re
verb
era
tio
n t
ime
(s)
Frequency (Hz)
Reverberation time T20 (s)
Calculation
according
Sabine
formula
0,00
5,00
10,00
15,00
20,00
25,00
30,00
125 250 500 1000 2000 4000
Sou
nd
str
en
gth
G d
B
Frequency Hz
Sound Strength G dB

With furniture and ceiling
0
0,2
0,4
0,6
0,8
1
1,2
1,4
1,6
1,8
2
125 250 500 1000 2000 4000
Re
verb
era
tio
n t
ime
(s)
Frequency (Hz)
Reverberation time T20 (s)
-2
-1
0
1
2
3
4
5
125 250 500 1000 2000 4000Spe
ech
Cla
rity
C5
0 d
B
Frequency Hz
Speech Clarity C50 dB
0
2
4
6
8
10
12
14
16
18
125 250 500 1000 2000 4000
Sou
nd
str
en
gth
G d
B
Frequency Hz
Sound Strength G dB

With furniture and ceiling
-2
-1
0
1
2
3
4
5
125 250 500 1000 2000 4000Spe
ech
Cla
rity
C5
0 d
B
Frequency Hz
Speech Clarity C50 dB
0
2
4
6
8
10
12
14
16
18
125 250 500 1000 2000 4000
Sou
nd
str
en
gth
G d
B
Frequency Hz
Sound Strength G dB
0
0,2
0,4
0,6
0,8
1
1,2
1,4
1,6
1,8
2
125 250 500 1000 2000 4000
Re
verb
era
tio
n t
ime
(s)
Frequency (Hz)
Reverberation time T20 (s)

The effect of wall panels
0,00
0,20
0,40
0,60
0,80
1,00
1,20
125 250 500 1000 2000 4000
Re
verb
era
tio
n t
ime
(s)
Frequency Hz
Reverberation time T20 (s)
0
1
2
3
4
5
6
7
8
9
125 250 500 1000 2000 4000
Spe
ech
Cla
rity
C5
0 d
B
Frequency Hz
Speech Clarity C50 dB
0
2
4
6
8
10
12
14
16
125 250 500 1000 2000 4000
Sou
nd
Str
en
gth
G d
B
Frequency Hz
Sound Strength G dB

Ecophon Gedina A with Extra Bass

The effect of extra low frequency absorptionWith 50% Ecophon Extra Bass
0,00
0,20
0,40
0,60
0,80
1,00
1,20
125 250 500 1000 2000 4000
Re
verb
era
tio
n t
ime
(s)
Frequency Hz
Reverberation time T20 (s)
0
1
2
3
4
5
6
125 250 500 1000 2000 4000
Spe
ech
Cla
rity
C5
0 d
B
Frequency Hz
Speech Clarity C50 dB
0
2
4
6
8
10
12
14
16
125 250 500 1000 2000 4000
Sou
nd
Str
en
gth
G d
B
Frequency Hz
Sound Strength G dB

Wall panels and Ecophon Extra Bass
With 50% Ecophon Extra Bass
0,00
0,20
0,40
0,60
0,80
1,00
1,20
125 250 500 1000 2000 4000
Re
verb
era
tio
n t
ime
(s)
Frequency Hz
Reverberation time T20 (s)
0
1
2
3
4
5
6
7
8
9
125 250 500 1000 2000 4000
Spe
ech
Cla
rity
C5
0 d
B
Frequency Hz
Speech Clarity C50 dB
0
2
4
6
8
10
12
14
16
125 250 500 1000 2000 4000
Sou
nd
Str
en
gth
G d
B
Frequency Hz
Sound Strength G dB

Acoustic design and architecture
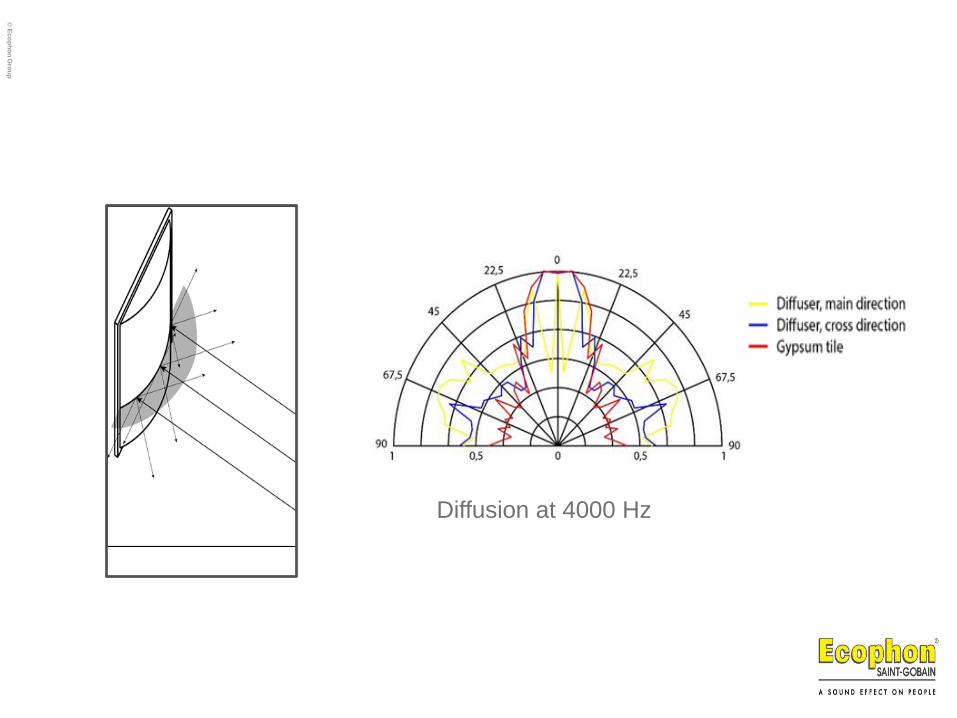
Directional diffusion

Sain
tGo
bain
Eco
ph
on
© E
co
ph
on
Gro
up
Acoustic design and
architecture
© E
co
ph
on
Gro
up

© E
co
ph
on
Gro
up
Effects of directional diffusion in a room with
absorbing ceiling
Internship: Tim Näsling 2017
40 different configurations
© E
co
ph
on
Gro
up
Diffusion at 4000 Hz

© E
co
ph
on
Gro
up
0,0
1,0
2,0
3,0
4,0
5,0
6,0
7,0
8,0
9,0
10,0
0% 10% 20% 30% 40% 50% 60% 70% 80% 90% 100%
0,00
0,10
0,20
0,30
0,40
0,50
0,60
0,70
0,80
0,90
1,00
C5
0(d
B)
Diffusor coverage
T 20
(dB
)
Effect of diffusion direction and amount on room acoustic parameters. Dotted line = Just Noticable Difference.
Dc - T20 (s) Dc - C50 (dB)

© E
co
ph
on
Gro
up
http://www.ecophon.com/en/about-ecophon/e-tools/ecophon-acoustic-calculator/

Sain
tGo
bain
Eco
ph
on
© E
co
ph
on
Gro
up
Acoustic measurements
in open-plan offices
© E
co
ph
on
Gro
up
ISO 3382-3

Content
• ISO 3382-3
• Sound propagation in open-plan offices
• Room acoustic parameters for open-plan offices
• Radius of comfort
• The effect of ceilings, screens and wall panels in open-plan offices
• Conclusions

Acoustic measurements in open-plan offices
ISO 3382-3

Open-plan Offices

ISO 3382-3
Acoustics measurements in
open-plan offices.
ISO 3382-1: Performance
spaces
ISO 3382-2: Reverberation
time in ordinary room


Sound propagation in reverberant rooms

Reverberation time vs. distance
2 4 6 8 10 12 140
0.1
0.2
0.3
0.4
0.5
0.6
0.7
Distance from sound source, m
Re
verb
era
tion
tim
e T
20,
s

1 2 3 4 5 6 7 8 910 15 20 30-45
-40
-35
-30
-25
-20
-15
-10
-5
Distance from sound source (m)
Lp -
Lw
(d
B)
Dicentia before refurbishment, path A
Free field
Dicentia after refurbishment, path A
Dicentia before refurbishment, path B
Dicentia after refurbishment, path B
Vattenfall helpdesk before refurbishment, path A
Vattenfall helpdesk after refurbishment, path A
Vattenfall helpdesk before refurbishment, path B
Vattenfall helpdesk after refurbishment, path B
Vattenfall economic department, path B
Vattenfall economic department, path A
Statoil, path A
Statoil, path B
RIL
Sound propagation in open
plan offices
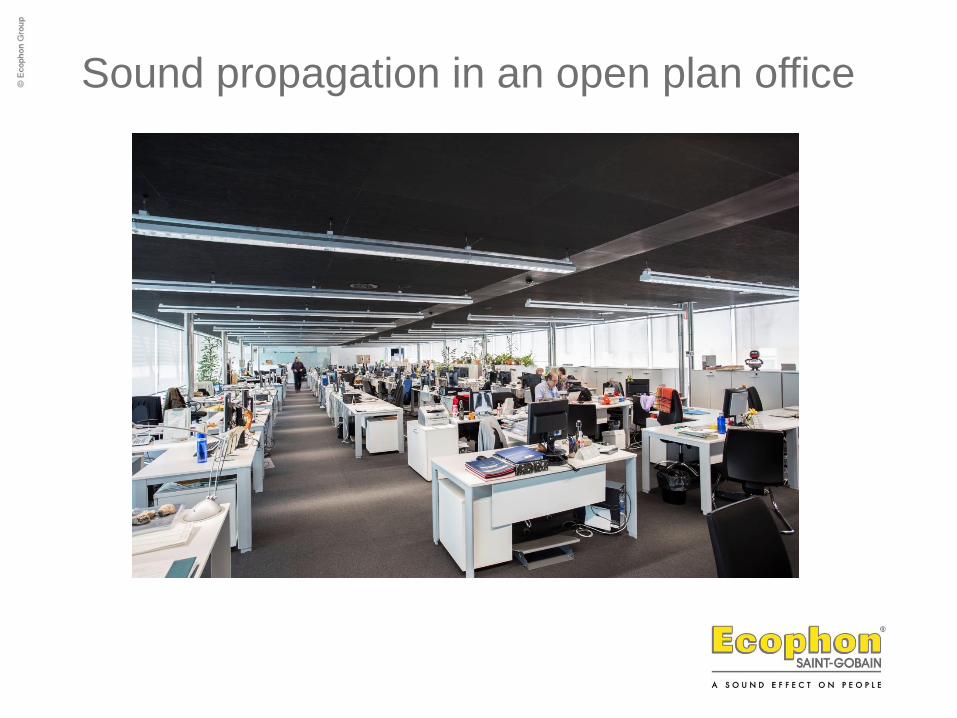
Sound propagation in an open plan office
-10
-20
-30
-40
-50
-60
1.0 10 100
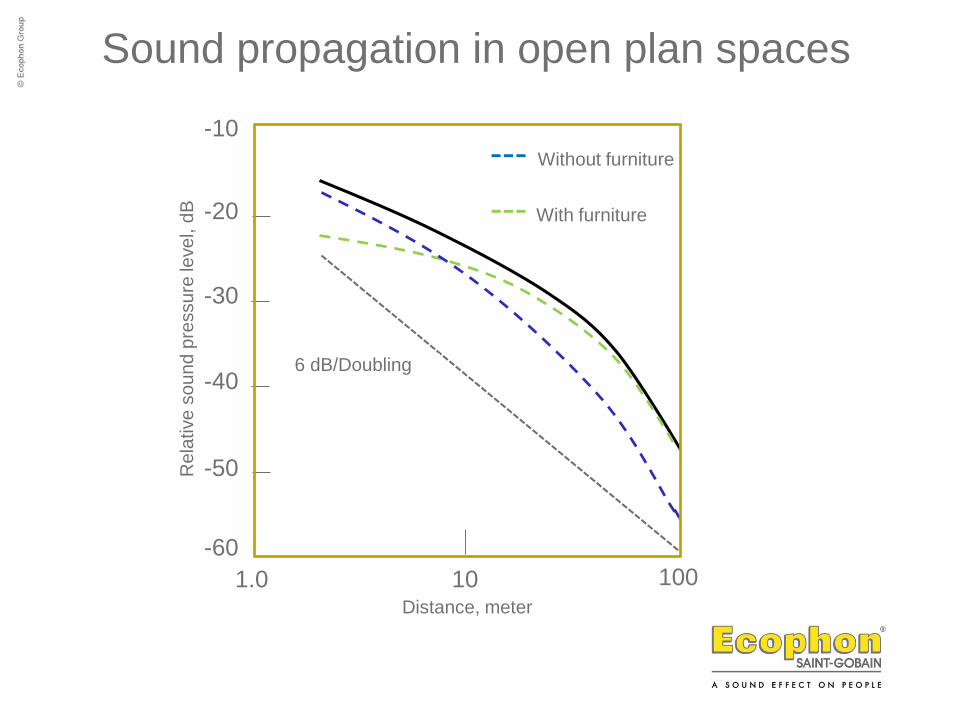
Sound propagation in open plan spaces
Re
lative
so
un
d p
ressu
re le
ve
l, d
B
Distance, meter
--- With furniture
--- Without furniture
6 dB/Doubling6 dB/Doubling

-10
-20
-30
-40
-50
-60
1.0 10 100
Sound propagation in open plan spaces
Re
lative
so
un
d p
ressu
re le
ve
l, d
B
Distance, meter
Increased absorption
6 dB/Doubling6 dB/Doubling

Room acoustic parameters for open-plan offices
• Spatial decay rate of A-weighted SPL of speech D2,S
• A-weighted SPL of speech at 4 meter, Lp,A,S,4m
• Distraction distance, rD (STI)
• Average A-weighted background noise level, Lp,A
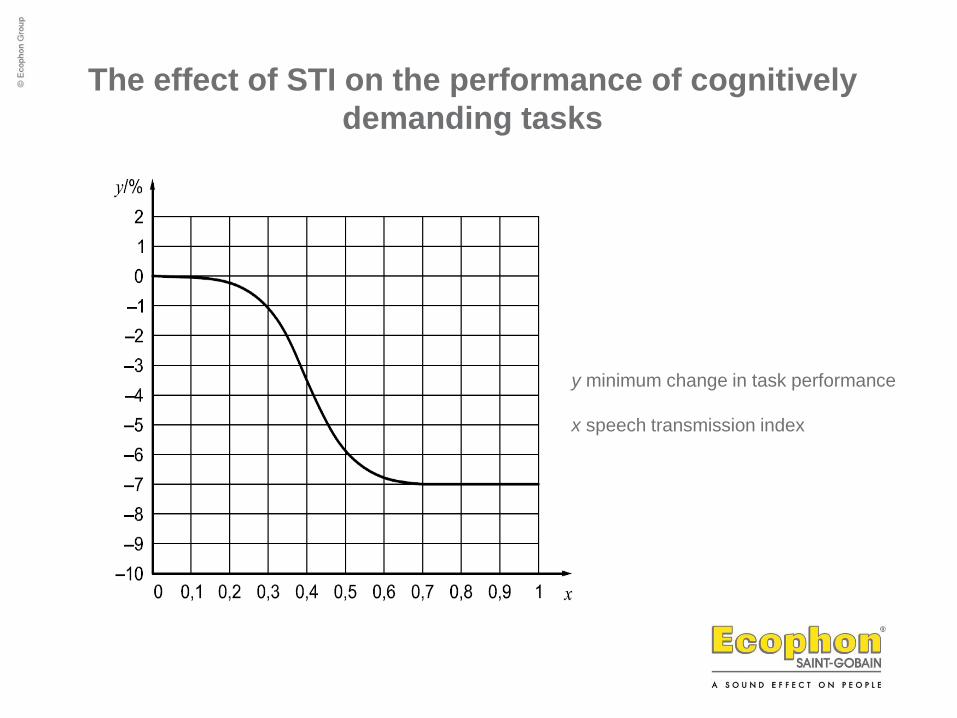
The effect of STI on the performance of cognitively
demanding tasks
y minimum change in task performance
x speech transmission index

STI
The determination of D2,S, Lp,A,S,4m and rd

Evaluation of office acoustics:
Single value - Radius of comfort rc (m)
• Definition: the distance for a 10 dB decrease of normal “office” speech. Normal
speech level in an office is about 58 dB(A) at 1 meter distance.
• rc is calculated from parameters defined in the measurement standard for open-
plan offices: ISO 3382-3.
Interpretation:short radius of comfort (rc) means increased privacy
and less disturbance between workplaces
𝑟𝑐 = 4 ∙ 100.3(𝐿𝑝,𝐴,𝑆,4𝑚−48)/𝐷2,𝑆

Distance of comfort rc
D2,S Lp,A,S,4 m