Embed Size (px)
Citation preview
© JB Caen, 2006 & + 1
Economic Capital, IFRS and Solvency 2
From a Book to a Market-based management of Life Insurance Companies?
Jean-Bernard Caen – DEXIA Head of Economic Capital
<This document presents the point of view of its author, which may differ from DEXIA’s.It supports an oral presentation and is incomplete without it.
This support is protected by copyright laws..>
October 16th, 2006

© JB Caen, 2006 & + 2
at a glance
“A European Banking Group, World Leader in Public Finance”• Resulting from the merger of 4 institutions in France, Belgium, Luxembourg and US• Credit exposure reaches 715b€ (900b$), 2/3 in Europe, and 1/3 in the USA
A diversified Financial Group• A Retail network in Benelux and Turkey• Investment Management Services in Luxembourg• Insurance activities in Belgium• Capital Market activities
Highly profitable• Net Income reached 2.0b€ (2.5b$) in 2005, 20% ROE• Market Capitalization is 24b€ (30b$) – well in the top 20 European banks

© JB Caen, 2006 & + 3
Context of the presentation
The context of this presentation is that of a European Insurance Company, wholly owned by a larger Financial Institution
• 2005: Life premiums 3.3b€ (4.1b$) and non-life 0.4b€ (0.5b$); Reserves 9b€ (11b$).
Economic Capital status• A full Economic Capital model, covering all risks and the group consolidated – including the
Insurance subsidiary – is up and running• Disclosure by business line in the Quarterly Activity Report.
IFRS status• IFRS has been applied since January 1st, 2005• IFRS 1 for the insurance (assets at fair value, but most liabilities are not)
Regulatory status• Solvency 1 currently active but its constraint is weak• Solvency 2 official “Framework Directive” is expected in July 2007
Full test number 2 (QIS2) feed-back expected by October 2006 As a consequence, the Companies will anticipate the changes Full application by 2010?

© JB Caen, 2006 & + 4
Key messages
REGULATORY and ACCOUNTING referentials are converging towards an ECONOMIC, market-driven framework.
This will lead to deep changes :• Cultural and strategic changes
• A pricing policy more coherent with strategy and value creation
• Improved products quality for the customers
• More effective use of capital
• Higher returns to shareholders
A challenging but rewarding process• Lets get prepared!
© JB Caen, 2006 & + 5
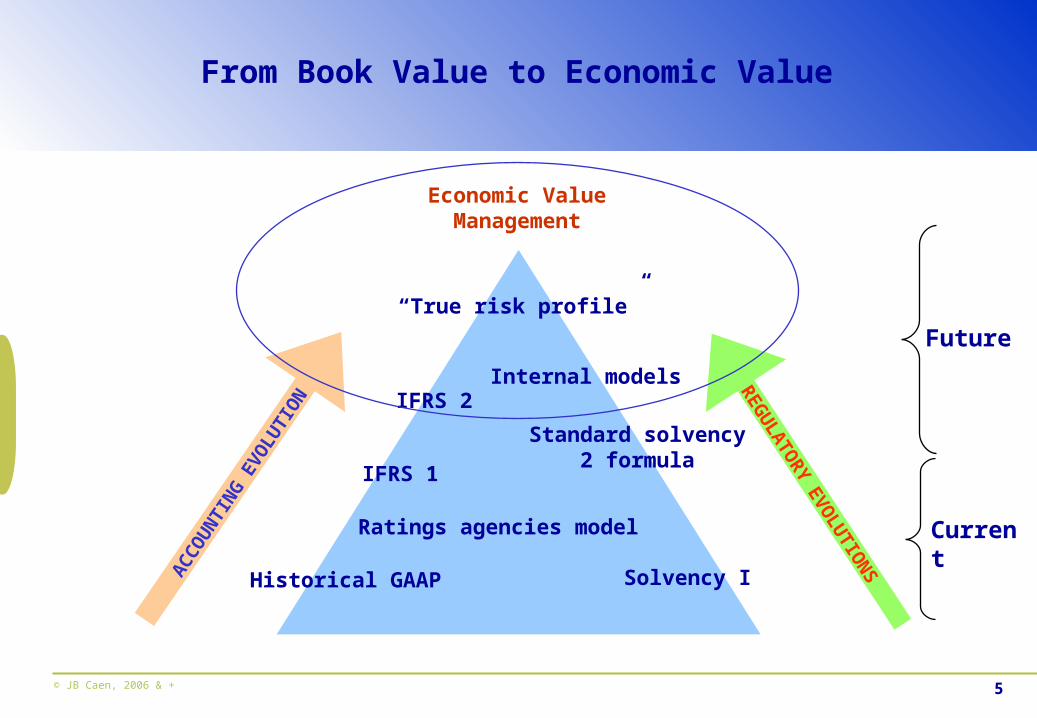
Future“True risk profile”
Ratings agencies model
Solvency I
REG
ULA
TOR
Y EVO
LUTIO
NS
Economic Value Management
Current
From Book Value to Economic Value
Internal models
Standard solvency 2 formula
Historical GAAPAC
CO
UN
TIN
G E
VOLU
TIO
N
IFRS 1
IFRS 2

© JB Caen, 2006 & + 6
Economic Capital: What for ?
To manage two opposite pressures
Increase capital backup
Search of Safety
PRESSURE OF REGULATORS FOR A BETTERPROTECTION OF POLICY HOLDERS AND
RATINGS AGENCIES FOR BOND HOLDERS
Reduce capital usage
CAPITAL
PRESSURE OF SHAREHOLDERS FOR ANINCREASED RETURN ON CAPITAL
Search of Profitability

© JB Caen, 2006 & + 7
Maximal value creation requires optimal capital allocation
√ Capital allocation supports long term value creation√ Explicit allocation of long term resources
√ Supporting allocation requires to weight risk against return√ This requires a neutral and transverse metrics for measuring risks
High
Expected Return
Low
Areas of Excellence
Competitors Arena
HighLow Aggregate Risk
CapitalAllocation
1 2 3
4
5
6
© JB Caen, 2006 & + 8
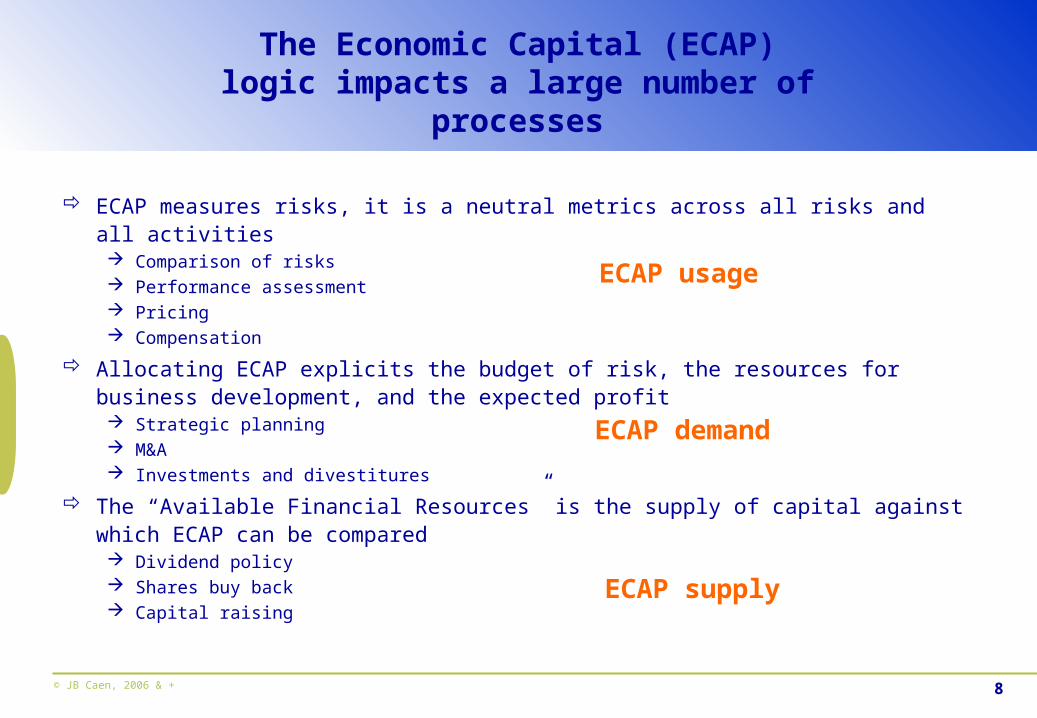
The Economic Capital (ECAP) logic impacts a large number of processes
ECAP measures risks, it is a neutral metrics across all risks and all activities Comparison of risks Performance assessment Pricing Compensation
Allocating ECAP explicits the budget of risk, the resources for business development, and the expected profit Strategic planning M&A Investments and divestitures
The “Available Financial Resources” is the supply of capital against which ECAP can be compared Dividend policy Shares buy back Capital raising
ECAP usage
ECAP demand
ECAP supply
© JB Caen, 2006 & + 9
ECAP potential benefits are huge
ECAP creates value• Better strategic development decisions
• Improved tactical management, product definition, resources allocation
• Incentives in line with shareholders interests
ECAP brings in higher returns• Effective pricing policy
• Effective reinsurance policy
• Effective internal funds transfer pricing
ECAP reduces risk• Identification and management of concentration effects
• Identification and management of embedded options
• Disclosures transparency reduces risk for shareholders
The sooner the better• Learning process is long and implies cultural changes
• Improved vision and skills is all the more beneficial when competitors stay behind

© JB Caen, 2006 & + 10
Numerical example: What excess capital?
Historical balance sheet
Bonds 100 Provisions 130Equity 100 Beneficiary participation 30
Own funds 40
200 200
Assets LiabilitiesFor equity, ECAP is assessed at 40% of value; no risk for bonds
-> Just the right level of own funds!
Excess ECAP Capital
40 0
When the value of equity raises
-> RECAPITALIZE ?!
Bonds 100 Provisions 130Equity 150 Beneficiary participation 30
Own funds 40Equity reserve 50
250 250
Assets LiabilitiesExcess
ECAP Capital
60 -20
© JB Caen, 2006 & + 11
But implementing ECAP will require managers to cope
with volatility – and they don’t like it
Economic or market-based approach implies more volatility• Seldom understood as early warning systems
Managers prefer stability• They work day-to-day with regulators, ratings agencies and accountants
• And they have to produce masses of documents, analysis and explanations
To make life easier, each major management functions (accounting, communication, risk management,…) fight to impose its view of the universe
• In systems, organization, communication … and decision-making
The executive management maintains a subtle equilibrium between these – to often - antagonist forces
• Because each one is necessary IF ONLY THEY WOULD CONVERGE!...

© JB Caen, 2006 & + 12
Currently each referential has its own objective and logic
Regulators Ratings agencies Shareholders and
the Management
Board
Defend the interest of… Policy holders Debt holders Shareholders
Are searching for… Limits to the ability
to take risk
Solvency Return
Put limits in terms of… Minimum
regulatory capital
Minimum ratio of
accounting capital
to regulatory capital
for a given rating
Return volatility i.e.
Economic Capital
Expect management to… Add capital Add capital Maximize value
creation
Increasingly sophisticated risk management tools
© JB Caen, 2006 & + 13
What level of capital should the Company have?
From the shareholders / Management Board viewpoint• What minimum capital to avoid failure?
In the context of sharing both risks and return with policy-holders• What sharing of profits and risks?
In France, the law implies that policy holders must receive at least 85% of profits In Belgium, no such law exist Up to where risk can be carried by policyholders and return be collected by
shareholders?• What excess capital?
To fuel development, hefty dividends and share buy-back What decision without an Economic Capital framework?
From the regulators viewpoint• Banking regulators: Is the Company part of a larger group?
What capital under Basel 2 Pillar 2?• Insurance regulators: Compliance with Solvency 2?
Posture regarding ratings agencies? Solvency 2 VaR-type logic is very close to the Economic Capital logic

© JB Caen, 2006 & + 14
From Statutory Equity to Available Financial Resources
Uncovered Capital
Presentation concept by Mercer Oliver Wyman
Statutory balance sheet Statutory Equity vs. AFR Economic balance sheet
. Local regulations
. Tax and statutory based. Internal steering. Economic risk and performance measurement framework
Solvency 2
Towards an Economic Capital framework
IFRS 2 IFRS 1

© JB Caen, 2006 & + 15
Solvency 2 is the European effort for pushing Insurance Companies towards using an Economic framework
It follows Solvency 1, issued in 2002
It benefits from existing models• Financial Assessment Framework FTK (NL), Swiss Solvency Test (CH), FSA Model (UK),
National Association of Insurance Commissioners (USA), German Insurance Undertakings GDV (D), Jukka Rantala Model (Former chairman of Solvency 2 Working group),…
It joins efforts currently undertaken in other parts of the world:
Australia• Insurance Reform Act (APRA).
Canada• The Office of the Superintendent of Financial Institutions Canada (OSFI) Minimum Continuing
Capital and Surplus Requirement (MCCSR) for Life Insurance Companies and Minimal Capital Test (MCT) for Federally Regulated Property and Casualty Insurance Companies.
Singapore• Risk-based Capital Framework for Insurance Business (MAS).

© JB Caen, 2006 & + 16
The structure of Solvency 2 offers many similarities with Bâle 2
Three same pillars as Basel 2
Quantitative rules Supervisory review process Market discipline
• Technical provisions regime• Minimum capital requirements• Investments rules• Rules for assessing assets value• Explicit list of risks• Risk assessment constraints• Opening toward internal models
• Internal control• Risk management• Corporate governance
• Minimum public disclosures in order to reinforce market discipline
• Transparency
Pillar 1 Pillar 2 Pillar 3

© JB Caen, 2006 & + 17
How will Solvency 2 clear the pathfrom a statutory to economic framework?
Solvency 2 will require an economic assessment of technical provisions
Solvency 2 will define 2 levels of solvency, both based upon the economic risks of the Company
• Minimum Capital Requirement (MCR). Below that level sanctions are immediate.
• Solvency Capital Requirement (SCR). Acts as a target, consolidated. Should be considered as a minimum for Companies targeting a good rating.
Solvency 2 will explicit risk aversion• The Solvency Capital Requirement should be equal to a one year 99,5% global VaR
Roughly equivalent to a BBB-/BBB rating

© JB Caen, 2006 & + 18
Technical provisions assessment under Pillar I
Today there are a variety of technical provisions assessments regimes depending on the country
• And various explicit – or implicit – levels of risk aversion
• In France: 4% of Mathematical Provisions for guaranteed products + 1% of Unit-Linked products.
Pillar I will homogenize technical provisions assessments and risk aversion levels• Technical provisions will have to be assessed as the NPV of future cash-flows, with a prudent
stance “Prudently” meaning either 75th percentile (regulators preference) or best estimates,
that is NPV actualized at risk free rate + cost of capital (Companies preference) The QIS underway should clarify the options.
Coherent with the future calculation of provisions such as required by IFRS “phase 2” (liabilities in fair–value)
Difficult and ambitious challenge
© JB Caen, 2006 & + 19
The major risks facing a Life Insurance Company
Typically, European Life Insurance Company have two major activities, with different risk profiles
• Unit-linked funds The Company acts as an asset manager Risk and return are both held by policy holders The Company bears the operational risks
• Euros-denominated funds The Company legally guarantees a minimum return on assets Both risks and return are shared between the Company and the policyholders
Assessing a global VaR requires to identify and measure the risks, and aggregate them
• Market risk: Assets value volatility and Assets : Liabilities mismatches
• Credit risk: Bonds ratings changes and concentration
• Operational risks
For solvency 2, the major challenges concern the market risk of assets (volatility of market value) and the relationship between assets and liabilities
Same challenges as for setting up an Economic Capital framework!

© JB Caen, 2006 & + 20
Asset and liability risks are closely linked
They cannot be treated independently
One given asset allocation may generate a very high or a very low global risk depending upon the nature of the liability
• such as the nature and level of guarantees and the characteristics of the options given to the policy-holders
Moreover, part of the profit and part of the risk are transferred to policy holders• Sharing rules are not necessarily explicit
• But even if it is, it leaves many axis of freedom to manage it Surplus reserves, some of which is not disclosed, can be used
to improve the yield served to the customer to offer fat dividends to shareholders or kept for future uses
With IFRS, fair-value of reserves are disclosed as most assets are classified in “Available For Sales” reserves.
© JB Caen, 2006 & + 21
Profit and risk sharing
The Insurance specificity is that the policy holder bear a part of the risks (i.e. of the capital)
• Which part is usually not explicit for easier management of the trade-off between financial and commercial goals
Managing Insurance risks is managing one big ALM• But share- and policy-holders do not have the same risk aversion and expected return
Defining a profit sharing rule is the backbone for modeling Insurance ALM• It will form the back-bone of sound economic management

© JB Caen, 2006 & + 22
Numerical example: What profit and risk sharing with policy holders?
Bonds 100 Provisions 130Equity 150 Beneficiary participation 30
Own funds 40Equity reserve 50
250 250
Assets LiabilitiesExcess
ECAP Capital
60 -20
Profit and risk are shared with policy holders 20/80 ECAP & Excess surplus
Bonds 100 Provisions 130Equity 150 Beneficiary participation 70 48 22
Own funds 50 12 38
250 250
Assets Liabilities
Profit and risk are shared with policy holders 50/50 ECAP & Excess surplus
Bonds 100 Provisions 130Equity 150 Beneficiary participation 55 30 25
Own funds 65 30 35
250 250
Assets Liabilities
High ROE (56%), but as risk is fully carried by shareholders, the need for
recapitalization appears quickly
Lower ROE (38%), but sharing the risk (and the profit) with
policyholders safeguards much own funds
ROE decreases (20%) when a still larger chunk of the profit (and risk)
is transferred to policy-holders
-> what optimal profit sharing?
THAT QUICKLY?!No, IFRS includes the equity reserves in the perimer -> Excess capital is 30
© JB Caen, 2006 & + 23
ALM issues differ from those of a bank
Insurance: Pack of options against lower than market guaranteed rates• Bank: Duration gap
Insurance: Naturally exposed to raise in interest rates• Banks: Naturally exposed to decrease in interest rates
Insurance: A large chunk of risks is on the liability side• Banks: Most risks are on the asset side
Insurance: Yields are defined afterwards (subordinated model)• Banks: Yields are usually defined beforehand

© JB Caen, 2006 & + 24
The level of solvency capital will depend upon the quality of the risk assessment
Basically, the more precise and robust the risk models are, the less regulatory capital will be required
By default, one standard formula• Applicable to all companies, simple, based upon existing data
• Solvency capital = R1 * K1 + R2 * K2 + R3 * K3… Ri are risk factors Ki are risk weightings
Then replaced, globally or step by step, by an internal model• Assessing 1 year VaR 99,5%
© JB Caen, 2006 & + 25
Treatment of asset risks and ALM in the standard formula
Three steps
1. Assess a solvency capital (SCR) for individual categories of risks• Price risk of equity: depending upon the volatility of their market value
• Price risk of bonds: depending upon the potential changes of the issuers solvency
• Interest rate risk, depending upon the spread in duration between assets and liabilities
2. Correct individual SCRs depending on the potential risk absorption by policy-holders surplus
• These are the « K » factors
3. Aggregation of risks is additive• A prudential approach that does ignore all benefits of diversification

© JB Caen, 2006 & + 26
Internal models
The standard formula should remain more capital intensive than internal models
Whatever the parametric solution retained for the standard formula (which aim is to remain simple), it will hardly grasp the inherent complexity of Insurance Companies assets – liabilities relationship.
• On the asset side: Derivatives, structured products,…
• On the liability side: Minimum interest rate guarantee, outflow and transfer options (many of which are influenced by policy holders changes in behavior),…
Options…options…options• Understanding and modelling the options is a tough challenge … but unavoidable. Under IFRS, all derivatives – including embedded derivatives – must be accounted for at their
fair- / market-value
Almost all Companies now have an ALM model that can be enhanced• To include options, derivatives and structured instruments
• To power energy intensive Monte-Carlo type simulations
• To make it easier and safer to use, with an audit trail,…

© JB Caen, 2006 & + 27
Implications include renovating pricing policy
Internal models will be required to relax the regulatory constraint on capital And also to assess internal economic capital, coherent with ratings target And to make adequate valuation of complex assets and liabilities, such as those requested
for disclosure under IFRS (and these valuations must pass the auditors tests…)
Internal models will reveal unexpected risk hot spots• Capital cost of guarantees
• « Out of the Money » options that become black holes at 99,5% interval of confidence
This will lead to reviewing pricing policies• To adequately price guarantees and options
And upgrading the usage of risk mitigation techniques• Reinsurance
• Securitization

© JB Caen, 2006 & + 28
Proper articulation of the parallel referentials with which the Company lives is key
ACCOUNTING REGULATORY ECONOMIC
Used
(risk measure)
Accounting Equity
Solvency Capital
Minimum and Solvency Capital Requirements
Economic Capital
Required
(by regulators, rating agencies, planned investments)
Allocated Capital
Available (maximum loss coverage)
Available Solvency Capital
Available Financial Resources (AFR)
© JB Caen, 2006 & + 29
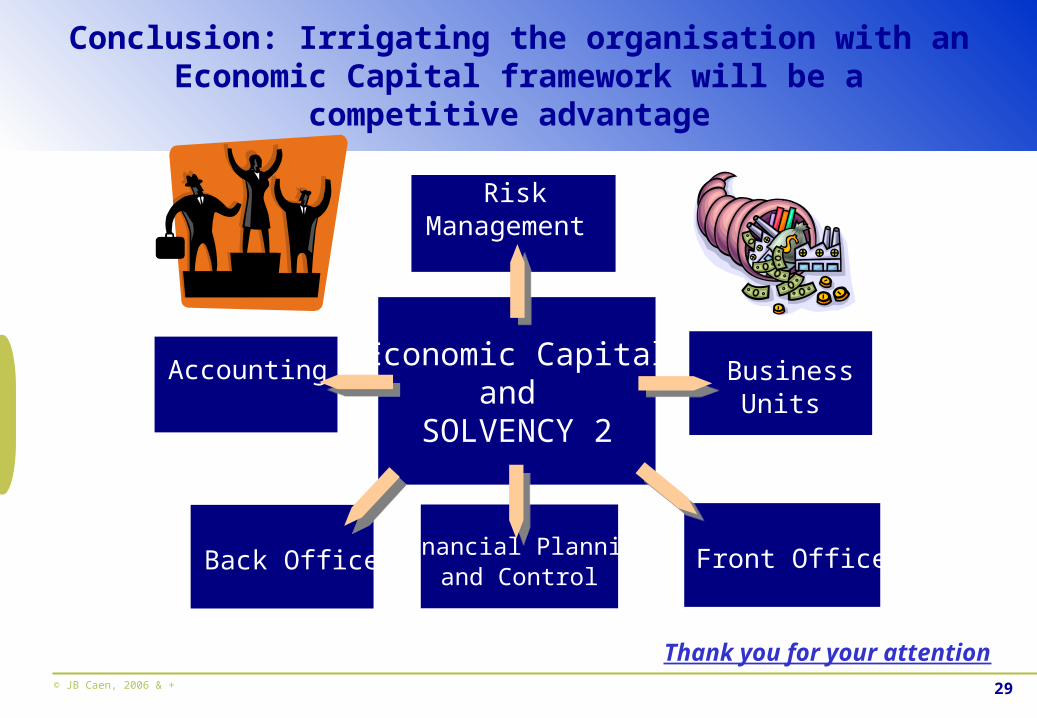
Conclusion: Irrigating the organisation with an Economic Capital framework will be a competitive advantage
Economic Capitaland
SOLVENCY 2
Accounting
Risk Management
BusinessUnits
Back Office Financial Planning and Control
Front Office
Thank you for your attention