Embed Size (px)
Citation preview


ECONOMY

Country Figures
Size: 5 Largest
8,511,965 km²
Population: 5 Largest
190 million
47% of South America’s territory
th
th
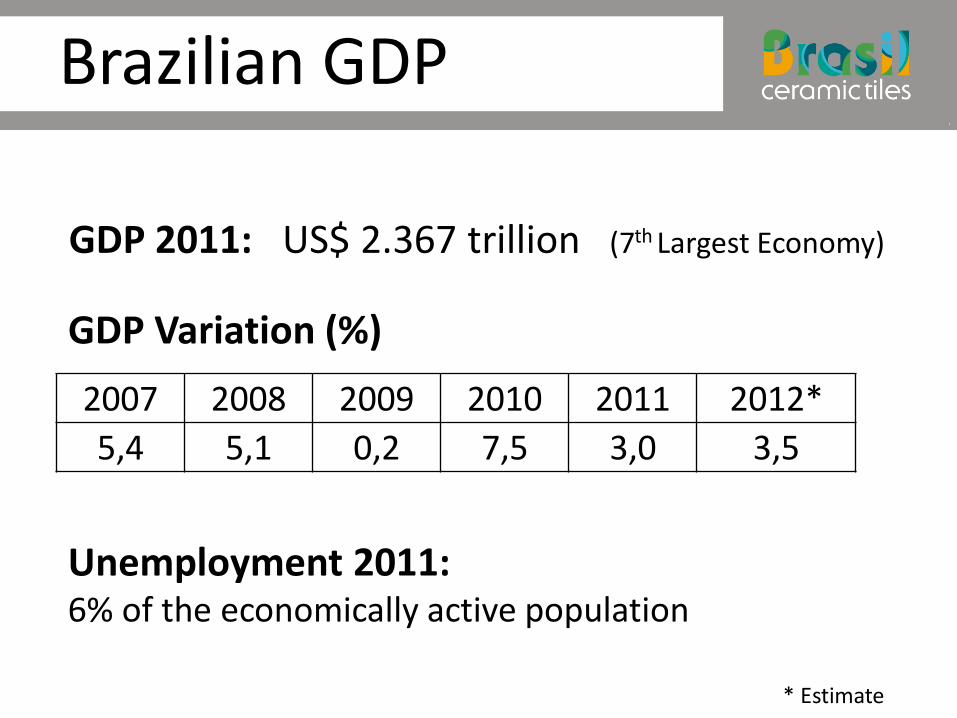
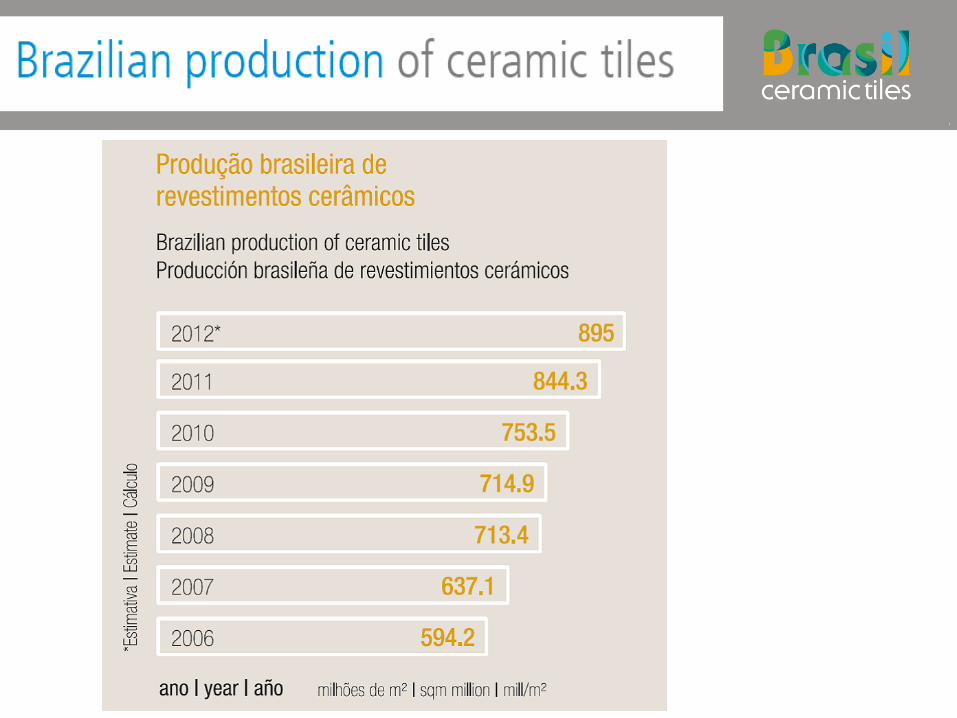
Brazilian GDP
GDP 2011: US$ 2.367 trillion (7 Largest Economy)
Unemployment 2011: 6% of the economically active population
GDP Variation (%)
* Estimate
th
2007 2008 2009 2010 2011 2012*
5,4 5,1 0,2 7,5 3,0 3,5
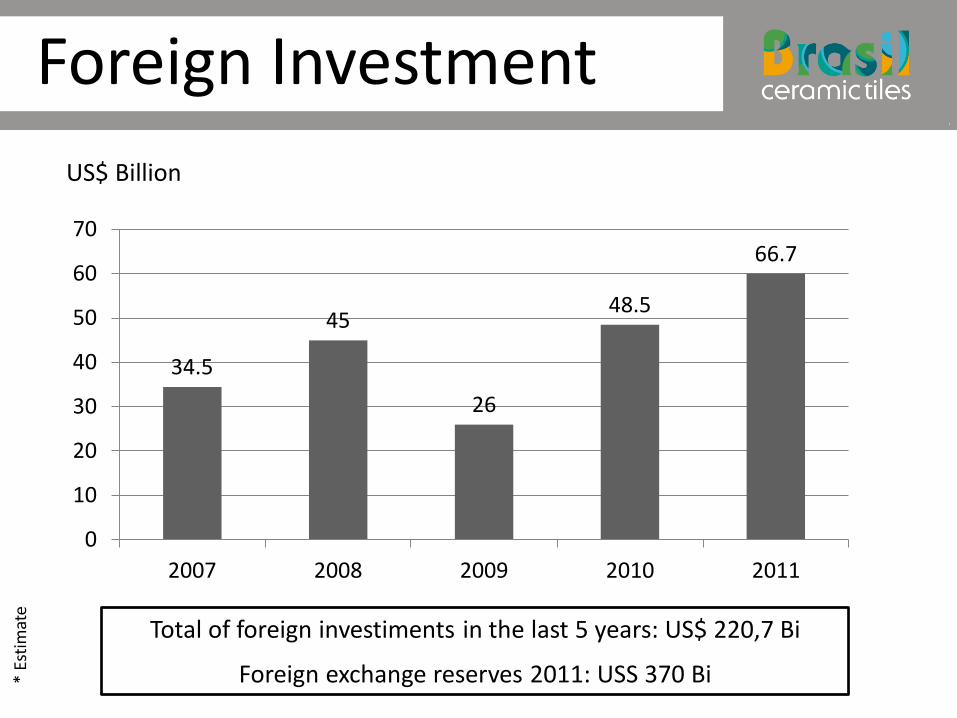
Foreign Investment
Total of foreign investiments in the last 5 years: US$ 220,7 Bi
Foreign exchange reserves 2011: USS 370 Bi
US$ Billion
34.5
45
26
48.5
66.7
0
10
20
30
40
50
60
70
2007 2008 2009 2010 2011
* Es
tim
ate

Ukrainians in Brazil

Ukrainians in Brazil
• From 1895 to 1951 more than 24,400 Ukrainian families migrated to Brazil;
• Today, more than 1 million Ukrainians and Ukrainians descendents live in Brazil
• Ukrainian have contributed greatly to the economic and social formation of Brazil;
• It is usual to have Ukrainian descendents related to the development of literature, theater, journalism, sport, agriculture, industrial and financial activities (names such as Lispector, Babenco, Mindlin, Sobis, Stocklos, Block, Petrek, Krivey, Michaelichen, etc).

Ukranian imigration
Ukrainians in Brazil

Festival celebrating the 120th anniversary of Ukraine imigration to Brazil
Ukrainians in Brazil

Festival celebrating the 120th anniversary of Ukraine imigration to Brazil
Ukrainians in Brazil

Ukranian Memorial in Curitiba/Brazil
Ukrainians in Brazil

Ukrainians descendents
Ukrainians in Brazil

CONSTRUCTION

Construction
• Construction Chain represents 12,2% of GDP
2006 2007 2008 2009 2010 2011 2012
4,7 4,9 7,9 (6,5) 11,6 6 6*
• Construction Growth (%) - Added Value
* estimate

CERAMIC TILE INDUSTRY


Brazilian imports of ceramic tiles (million sq. m.)
Source: ANFACER
*


69%
20%
3% 8%
Floor Tile
Wall Tile
Façade
Porcelain
2011

ENERGY

BIOMASS
HYDRO AND ELETRICAL
POWER
URANIUM
MINERAL COAL
NATURAL GAS
OIL PRODUCTS
BIOMASS:
Wood: 9,5%
Cane Products: 17,7
Others: 4,0%
RENEWABLE:
Brazil: 45,3%
OECD: 7,2%
World: 12,9%
Brazilian Energy Matrix

WIND ENERGY
INDUSTRIAL GAS
BIOMASS
OIL PRODUCTS
IMPORTS
MINERAL COAL
NATURAL GAS
NUCLEAR
HYDRO
RENEWABLE:
Brazil: 85,8%
OECD: 16,6%
World: 18,7%
Domestic Sources of Electricity

Final Price to Industry
Consumption Range US$ MMBTU
1 – 10 Thousand 13,6 – 21,4
11 – 100 Thousand 12,3 – 17,5
101 – 1.000 Thousand 11,9 – 15,0
Natural Gas Cost

STANDARDS AND REGULATIONS
Standards and Regulations
• Brazil is committed with international Standards and regulations – ISO
• In 2007 Brazil published the ABNT NBR 15463 – Porcelain Tiles
• In 2012 ISO revised and published the 13006 (Ceramic Tiles: Definitions, classification, characteristics and marking) defining also porcelain tile
• Brazil will revise its porcelain tile standard in accordance to 13006 fully

FUTURE CHALLENGES

Country
In spite of its great economic potential, Brazil
must still address same important issues:
• Investment on infrastructure;
• Reduce industrial taxation;
• Increase educational levels;
• Address housing deficit.

Ceramic Tile Sector
Future Challenges:
• Develop energy savings technologies;
• Address sustainability;
• Add value to end product;
• Increase international integration.