Embed Size (px)
Citation preview

Monthly Oil Market ReportO P E C
12 June 2014
Feature article:World oil market prospects for the second half of the year
Oil market highlights
Feature article
Crude oil price movements
Commodity markets
World economy
World oil demand
World oil supply
Product markets and refinery operations
Tanker market
Oil trade
Stock movements
Balance of supply and demand
1
3
5
11
17
37
45
58
65
69
76
84

Organization of the Petroleum Exporting Countries
Helferstorferstrasse 17, A-1010 Vienna, AustriaE-mail: [email protected]: www.opec.org

OPEC Monthly Oil Market Report – June 2014 1
Oil market highlights Crude Oil Price Movements The OPEC Reference Basket increased by $1.17 to stand at $105.44/b in May amid firming sentiment in the crude oil market. ICE Brent rose $1.15 to $109.24/b, while Nymex WTI slipped 24¢ to $101.79/b. The Brent-WTI spread ended the month at an average around $7.45/b, after settling at a seven-month low of $6.05/b in the previous month.
World Economy World economic growth figures remain unchanged at 3.4% for 2014 and 2.9% in 2013. No revisions have been made in the major OECD economies. OECD growth is forecast at 2.0% in 2014. The forecasts for China and India also remain unchanged at 7.5% and 5.6%, respectively. Risks to the growth forecast have emerged recently as industrialised economies are facing some headwinds, amid slowing momentum in the emerging economies.
World Oil Demand World oil demand is expected to increase by 1.14 mb/d in 2014, in line with the previous month’s forecast. More than half of oil demand growth this year is seen coming from China and the Middle East. Estimated world oil demand growth in 2013 was also left unchanged at 1.05 mb/d.
World Oil Supply Non-OPEC oil supply growth in 2014 now stands at 1.44 mb/d, representing an upward revision of around 60 tb/d from the previous report. Growth is seen coming mainly from the US, Canada, and Brazil. US liquids supply in 2014 is projected to grow by 0.95 mb/d to reach 12.13 mb/d. The 2013 non-OPEC supply growth estimate was left unchanged at 1.35 mb/d. OPEC NGL production is forecast to average 5.81 mb/d in 2014. In May, OPEC crude production according to secondary sources averaged 29.76 mb/d, an increase of 142 tb/d from a month ago.
Product Markets and Refining Operations Product markets in the Atlantic Basin received support from increasing gasoline demand with the start of the US driving season, although higher refinery runs and increasing gasoline inventories have pressured margins. The Asian market lost ground in May due to weakening middle distillates and gasoline crack spreads, which more than offset the positive performance of the bottom of the barrel.
Tanker Market Tanker market sentiment was mixed in May, with VLCC rates dropping on all reported routes, while Suezmax and Aframax freight rates were flat from a month before. Tankers on all dirty segments suffered from low market activities, while clean spot freight rates declined by 4% on average, compared to the previous month.
Stock Movements OECD commercial inventories rose sharply in April, but still remained 80 mb below the five-year average. Crude and products showed deficits of 16 mb and 64 mb, respectively. In terms of forward cover, OECD commercial stocks stood at 57.5 days. Preliminary data shows that US total commercial oil stocks rose by 17.5 mb in May, remaining in line with the five-year average. Crude stocks were 16 mb over the five-year average, while products were 16 mb below.
Balance of Supply and Demand Demand for OPEC crude remained unchanged in 2013 from the previous report to stand at 30.1 mb/d, representing a decrease of 0.4 mb/d compared with the previous year. The forecast for required OPEC crude in 2014 was revised down by 0.1 mb/d to stand at 29.7 mb/d, a decline of 0.4 mb/d from the previous year.

2 OPEC Monthly Oil Market Report – June 2014

OPEC Monthly Oil Market Report – June 2014 3
World oil market prospects for the second half of the year With the first half of 2014 having almost passed, available data now provides the opportunity for a better understanding of oil market developments for the remainder of the year. Since the start of 2014, crude oil price volatility has eased, with the range between minimum and maximum daily prices for the OPEC Reference Basket averaging around $6/b, the lowest since 2003. Upward pressures from oil supply disruptions in some producing countries and improving growth in many economies have largely been offset by production increases and cuts in refinery crude runs, which have weighed on prices. In addition, geopolitical factors have driven prices in both directions. There is sufficient evidence that higher economic growth in the current quarter will materialize, helping to compensate for the subdued performance of the global economy in 1Q14. This, along with expectations of higher growth in the second half of the year, is seen resulting in annual growth of 3.4%. Indeed, the expected rebound in the US economy and slight acceleration of growth in China – as indicated by manufacturing PMIs (Graph 1) – provides a positive signal for a rebound in the global economy in the second half of the year, although with some uncertainties regarding the pace of growth. Graph 1: Manufacturing PMIs Graph 2: US commercial crude oil stocks
World oil demand in 2H14 is anticipated to increase by 1.2 mb/d over the same period last year to average 92.1 mb/d. OECD demand is projected to decline by around 60 tb/d, despite positive growth in OECD Americas, mainly due to a general improvement in the US economy. OECD Europe and OECD Asia Pacific are expected to see a lesser contraction than a year earlier. However, oil demand growth in OECD Asia Pacific will largely be impacted by any restart of nuclear power plants in Japan. Non-OECD countries are projected to lead oil demand growth this year and forecast to add 1.3 mb/d in 2H14 compared to the same period a year ago. Nevertheless, risks to the forecast include the pace of economic growth in major economies in the OECD, China, India and Russia, as well as policy reforms in retail prices and substitution toward natural gas. On the supply side, non-OPEC oil supply in the second half of the year is expected to increase by 1.2 mb/d over the same period last year to average around 55.9 mb/d, with the US being the main driver for growth, followed by Canada. Production in Russia and Brazil is also expected to increase in 2H14. However, oil output from the UK and Mexico is projected to continue to decline. The forecast for non-OPEC supply growth for 2H14 is seen lower than in the first half of the year, but could increase given forecasts for a mild hurricane season in the US Gulf. Less field maintenance in the North Sea and easing geopolitical tensions could also add further barrels in the coming two quarters. OPEC NGLs are also projected to continue to increase, adding 0.2 mb/d in 2H14 to stand at 5.9 mb/d. Taking these developments into account, the supply-demand balance for 2H14 shows that the demand for OPEC crude in the second half of the year stands at around 30.3 mb/d, slightly higher than in the first half of the year. This compares to OPEC production, according to secondary sources, of close to 30.0 mb/d in May. Global inventories are at sufficient levels, with OECD commercial stocks in days of forward cover at around 58 days in April. Moreover, inventories in the US – the only OECD country with positive demand growth – stand at high levels (Graph 2). Non-OECD inventories are also on the rise, especially in China, which has been building Strategic Petroleum Reserves (SPR) at a time when apparent demand is weakening due to slowing economic activities.
Overall, the ongoing rise in supply would be adequate to satisfy the growth in oil demand in 2H14, resulting in a well-balanced market.
44
46
48
50
52
54
56
US Euro-zone China Global
Index
Jan 14 Feb 14 Mar 14 Apr 14 May 14
Sources: China Federation of Logistics & Purchasing, Institute for Supply Management, JP Morgan, Markit and Haver Analytics.
0102030405060
300325350375400425
Jan
12
Mar
12
May
12
Jul 1
2
Sep
12
Nov
12
Jan
13
Mar
13
May
13
Jul 1
3
Sep
13
Nov
13
Jan
14
Mar
14
mbmb
Difference to 5-year average (RHS)US commercial crude (LHS)
Source: OPEC Secretariat.

4 OPEC Monthly Oil Market Report – June 2014

Crude Oil Price Movements
OPEC Monthly Oil Market Report – June 2014 5
Crude Oil Price Movements The OPEC Reference Basket increased $1.17 to $105.44/b in May, amid a firmed crude oil market and as escalating violence in Ukraine exacerbated supply concerns. The delayed return of Libyan exports and increasing Asia-Pacific buying interest also supported prices. Crude oil futures were mixed over the month, with the European benchmark ICE Brent gaining $1.15 to average $109.24/b, while the US Nymex WTI slipped marginally by 24¢ to average $101.79/b. Crude oil prices were supported as geopolitical concerns outweighed data pointing to slowing global economic growth and an all-time high in US Gulf Coast (USGC) stocks. Data from the US Commodity Futures Trading Commission (CFTC) and the ICE Exchange showed that money managers increased their bullish bets in crude oil futures, increasing their net long futures and options positions during May, as prices increased. The transatlantic spread flipped its narrowing streak and widened in May on tension in Ukraine and Libya. The prompt Brent/WTI spread ended the month at an average of around $7.45/b, after settling at $6.05/b in the previous month, which was the narrowest since September 2013. OPEC Reference Basket The OPEC Reference Basket (ORB) rose in May on a firming crude oil market, particularly that of North Sea Dated Brent. Crude oil prices rose as healthy demand and escalating violence in Ukraine exacerbated supply concerns. The delayed return of Libyan exports, increasing Asia-Pacific buying interests, along with positive refining margins and open arbitrage to South Korea have buoyed Brent-linked light sweet crudes. A drop in Mexican crude output pushed up values for heavy sour USGC crudes, while medium sour crude prices rebounded as the test release of 5 mb of mostly sour crude from the US Strategic Petroleum Reserve (SPR) drew to a close. Meanwhile, strong presences of alternative sour grades and narrower refining margins have worked to further pressure the Mediterranean sour market. Middle East crudes were supported as the refinery maintenance season drew to a close in Asia. Graph 1.1: Crude oil price movement, 2014
90
95
100
105
110
115
90
95
100
105
110
115
02 J
an
09 J
an
16 J
an
23 J
an
30 J
an
06 F
eb
13 F
eb
20 F
eb
27 F
eb
06 M
ar
13 M
ar
20 M
ar
27 M
ar
03 A
pr
10 A
pr
17 A
pr
24 A
pr
01 M
ay
08 M
ay
15 M
ay
22 M
ay
29 M
ay
05 J
un
US$/bUS$/b
OPEC Basket WTI Brent Dated

Crude Oil Price Movements
6 OPEC Monthly Oil Market Report – June 2014
On a monthly basis, the ORB improved to an average of $105.44/b in May, up $1.17/b or 1.12% over the previous month. On a year-to-date basis, the Basket was lower compared to the same period last year. The ORB year-to-date value stood at $104.79/b compared to the $105.85/b average of last year, $1.24 or 1.17% lower. Table 1.1: OPEC Reference Basket and selected crudes, US$/b
All Basket component values increased in May, though at varying intensities. Brent-related light sweet crude component values increased the most. Renewed unrest in Libya has trimmed hopes that production will increase in the near term. Output has fallen to 245 tb/d after unrest shut in more oil fields. Supplies from the North Sea market were also tight. Loadings declined by 6% in June compared with May, just as European refineries returned from maintenance. But a drop in refining margins in Europe offset this, limiting price gains. Further support came from the departure of 2 mb of crude to South Korea aboard a VLCC, the first such export since February. Moreover, in most of May, Asia-Pacific demand has been firm for West African light sweet crudes. Asian refining margins have strengthened, while most refinery maintenance in China will have ended when June-loading supplies arrive, which further boosted demand. Brent-related crudes, Saharan Blend, Es Sider, Girassol and Bonny Light rose $1.95, on average. Latin American Basket component performances were once again mixed, though all were up from the previous month. Ecuador’s Oriente spot prices improved slightly over the month, particularly the first two decades of the month, following the gains in the
ChangeApr 14 May 14 May/Apr 2013 2014
OPEC Reference Basket 104.27 105.44 1.17 105.85 104.79 Arab Light 104.87 105.80 0.93 106.85 105.50 Basrah Light 102.11 103.16 1.05 103.54 102.69 Bonny Light 110.19 112.22 2.03 110.95 110.60 Es Sider 107.39 109.42 2.03 108.31 108.06 Girassol 108.80 110.21 1.41 108.90 109.03 Iran Heavy 104.32 105.40 1.08 104.94 104.72 Kuwait Export 103.13 104.21 1.08 104.85 103.67 Marine 104.53 105.44 0.91 105.03 104.58 Merey 93.99 96.06 2.07 96.92 94.21 Murban 107.75 108.35 0.60 107.84 108.00 Oriente 94.73 95.47 0.74 99.40 95.18 Saharan Blend 108.09 110.36 2.27 108.97 109.58Other Crudes Brent 107.69 109.67 1.98 108.27 108.41 Dubai 104.68 105.55 0.87 105.18 104.72 Isthmus 101.29 102.59 1.30 107.99 99.90 LLS 104.15 104.27 0.12 110.05 104.30 Mars 98.81 99.81 1.00 105.20 100.21 Minas 111.12 107.22 -3.90 108.98 110.19 Urals 106.91 107.84 0.93 107.38 107.04 WTI 102.02 102.03 0.01 93.90 100.01Differentials Brent/WTI 5.67 7.64 1.97 14.37 8.40 Brent/LLS 3.54 5.40 1.86 -1.77 4.11 Brent/Dubai 3.01 4.12 1.11 3.09 3.70
Year-to-date
Note: Arab Light and other Saudi Arabian crudes as well as Basrah Light preliminarily based on AmericanCrude Market (ACM) and subject to revision.
Source: Platt's, Direct Communication and Secretariat's assessments.

Crude Oil Price Movements
OPEC Monthly Oil Market Report – June 2014 7
US sour market. Late in the month, weaker prices for Mars in the USGC and more supply of prompt Vasconia out of the Cano Limon pipeline pressured Oriente and Vasconia prices lower. Mars differentials fell as Marathon Petroleum shut a crude distillation unit at its 520 tb/d refinery in Garyville, Louisiana, after a tornado damaged the plant. Ecuador’s Oriente value increased 74¢ compared to the previous month. Meanwhile, Venezuela’s Merey edged up $2.20 over the month, supported by its formula elements’ improved performances and a strong heavy sour crude market in the USGC amid tumbling Mexican heavy crude production. Middle Eastern spot prices rose as trade in the Asia-Pacific market shifted to July-loading cargoes of Middle East crudes, and demand rose as the refinery maintenance season drew to a close. Middle East benchmark Dubai’s widening discount to North Sea Brent crude curbed the amount of North Sea Dated linked cargoes moving to Asia, boosting demand for Middle East grades and lifting the values. Meanwhile, strong presences of alternative sour grades and narrower refining margins have worked to further pressure Ural differentials over the month. Middle Eastern spot components and multi-destination grades improved by around 75¢ and $1.04, respectively. On 11 June, the ORB stood to $106.20/b. The oil futures market Crude oil futures were mixed over the month, with the European benchmark ICE Brent gaining $1.50 on average, while the US Nymex WTI slipped marginally by 25¢. Crude oil prices were supported as geopolitical concerns trumped data pointing to slowing global economic growth and an all-time high in USGC stocks. Chinese manufacturing data came in slightly below expectations, while an initial estimate of US economic figures showed virtually no GDP growth in 1Q14, and the US Federal Reserve (US Fed) tapered its economic stimulus programme, in line with expectations. Nevertheless, lower US midcontinent crude oil inventories, supply disruptions in Libya, ongoing tensions in eastern Ukraine, and the start of the US summer driving season have underpinned crude oil prices. Meanwhile, as manufacturing activity gathered pace late in the month, particularly in China and the US, it boosted crude demand in both countries, supporting prices. The Nymex WTI front-month slipped 24¢ over the month to average $101.79/b in May. Compared to the same period in 2013, the WTI value was significantly higher by $5.97 or 6.4% at $99.96/b. ICE exchange Brent front-month increased $1.15 to an average of $109.24/b. Year-to-date, ICE Brent was slightly lower in value compared to the same period last year. Its value weakened by 72¢ or 0.7% to $108.21/b from $108.93/b. On 11 June, ICE Brent stood at $109.95/b and Nymex WTI at $104.40/b. Data from the CFTC showed that hedge funds and money managers raised their bullish bets in US crude oil futures, increasing their net long US crude futures and options positions by 17,358 lots to 348,069 contracts during May as prices rose. Similarly, the net-length positions of the speculative community in ICE Brent grew by 8,876 lots to 213,364 contracts, the highest since the record high in September 2013 when prices reached $115/b. Moreover, the total futures and options open interest volume in the two markets decreased in May by 60,595 contracts to 3.97 million lots.

Crude Oil Price Movements
8 OPEC Monthly Oil Market Report – June 2014
Graph 1.2: Nymex WTI price vs. speculative activity, 2013-2014
Graph 1.3: ICE Brent price vs. speculative activity, 2013-2014
The daily average traded volume during May for WTI Nymex contracts decreased by 56,367 lots to average 489,658 contracts. ICE Brent daily traded volume also dropped by 40,893 lots to 529,999 contracts. The daily aggregate traded volume in both crude oil futures markets decreased by 97,260 lots in May to around 1.02 million futures contracts, equivalent to around one billion barrels per day. The total traded volume in Nymex WTI and ICE Brent contracts was 10.28 and 11.66 million contracts, respectively, over the month. The futures market structure The Nymex WTI front-month continues to be at a premium over the future months’ contracts supported by ongoing drawdowns of crude stocks at the WTI delivery hub. Supplies in Cushing have fallen in 16 out of the last 17 weeks and are down more than 20 mb since late January, when a new pipeline opened to ship oil out of storage to refineries along the USGC. As a result, the prompt-month Nymex WTI futures contract saw its premium vs. the second month contract almost unchanged from the previous month at elevated levels of around 70¢/b. The backwardation in the Brent market structure rebounded over the month as Forties arbitrage volumes began to ship to Asia, while European refinery turnaround rates fell to their lowest levels so far this year, providing a boost to prompt differentials. Supply disruptions in Libya and concerns regarding the situation in Ukraine also continued to support the backwardation. The spread between the second and the first month of the ICE Brent contract average jumped to around 70¢/b in May compared to 15¢/b in the previous month.
100
150
200
250
300
350
80859095
100105110115
May
13
Jun
13Ju
l 13
Aug
13Se
p 13
Oct
13
Nov
13
Dec
13
Jan
14Fe
b 14
Mar
14
Apr 1
4M
ay 1
4
US$/b
Managed money net long positions (RHS)WTI (LHS)
'000 Contracts
Source: CFTC.
0
50
100
150
200
250
90
95
100
105
110
115
120
May
13
Jun
13Ju
l 13
Aug
13Se
p 13
Oct
13
Nov
13
Dec
13
Jan
14Fe
b 14
Mar
14
Apr 1
4M
ay 1
4
US$/b
Managed money net long positions (RHS)ICE Brent (LHS)
'000 Contracts
Source: IntercontinentalExchange, Inc.

Crude Oil Price Movements
OPEC Monthly Oil Market Report – June 2014 9
Table 1.2: Nymex WTI and ICE Brent forward curves, US$/b
The transatlantic spread or the Brent-WTI spread flipped its narrowing trend and widened in May on tensions in Ukraine and Libya. Brent oil climbed on concern that increasing violence in Ukraine will lead to a disruption of shipments of oil and gas from Russia. Oil supply from Libya, a source of high-quality, light crude, remained near a tenth of capacity with output continuing to be disrupted. The prompt Brent-WTI spread ended the month at an average of around $7.45/b, after settling at $6.05/b in the previous month, which was the narrowest since September 2013. Graph 1.4: Nymex WTI and ICE Brent forward curves, 2014
The light sweet/medium sour crude spread Global sweet/sour differentials were mixed over the month, widening significantly in Europe while narrowing in the USGC and remaining almost flat in Asia. The Tapis/Dubai spread in Asia remained almost unchanged at a premium of around $6.70/b for Tapis over Dubai, 15¢ better than the previous month. The light sweet Asia Pacific crude oil market stayed weak amid lacklustre demand for Dated Brent-linked grades. Asian refiners bought cheaper Dubai-linked grades as Brent's premium to Dubai stayed near $5/b for most of last month. Sweet crude supply in the Asia-Pacific was also ample as Vietnam started selling its new Thang Long crude, while it also had a tender to sell spot Bach Ho for a third month due to maintenance at a local refinery. Meanwhile, the Middle East crude market firmed on robust demand in Asia and as sellers diverted excess supply held over from previous months into the Mediterranean region. About 2 mb of Murban headed to the Mediterranean, reducing length in the Asian market.
90
95
100
105
110
90
95
100
105
110
1FM 2FM 3FM 4FM 5FM 6FM 7FM 8FM 9FM 10FM 11FM 12FM
US$/bUS$/b
ICE Brent: 28 Apr 14 ICE Brent: 28 May 14Nymex WTI: 28 Apr 14 Nymex WTI: 28 May 14
FM = future month.
Nymex WTI 1st FM 2nd FM 3rd FM 6th FM 12th FM
28 Apr 14 100.84 100.11 99.21 96.56 92.2628 May 14 102.72 101.99 101.02 98.05 93.55
ICE Brent1st FM 2nd FM 3rd FM 6th FM 12th FM
28 Apr 14 108.12 107.64 107.11 105.42 102.8228 May 14 109.81 109.11 108.43 106.88 104.36
FM = future month.

Crude Oil Price Movements
10 OPEC Monthly Oil Market Report – June 2014
In Europe, the discount of the Russian medium sour Urals in the Mediterranean to North Sea Dated widened significantly amid a strong presence of alternative sour grades and narrower refining margins. Intraregional sour crude arbitrage, particularly from rare shipments of grades from Latin America, including Maya from Mexico and Vasconia from Colombia, and weak fuel oil markets have also helped to push the Russian medium sour Urals crude to the largest discounts to North Sea Dated seen in years. The Urals crack in the Mediterranean averaged around 10¢/b in May, down from $1.54/b in April. Meanwhile, the delayed return of Libyan exports has buoyed light sweet crudes in Europe, particularly Brent. Further support came from field maintenance in the North Sea and the departure of 2 mb of North Sea crude to South Korea. On average, the Dated Brent/Urals spread in May widened by $1.05 to $1.83/b. In the US, medium sour Mars’ discount to light sweet LLS narrowed by 88¢ to $4.45/b as the test release of 5 mb of mostly sour crude from the US SPR drew to a close. About 4.5 mb of SPR crude had been delivered by mid-May. A drop in Mexican crude output has also underpinned the values of sour crudes in the USGC. Meanwhile, USGC sour crudes were supported by data showing oil imported into the energy hub fell to 2.95 mb/d, the lowest figure since September 2008. On the other hand, USGC llight sweet grades were pressured after energy data showed that US domestic crude oil production soared to a 28-year high at 8.43 mb/d, the highest level since October 1986. Graph 1.5: Brent Dated vs. Sour grades (Urals and Dubai) spread, 2014
0
1
2
3
4
5
6
7
0
1
2
3
4
5
6
7
02 J
an
09 J
an
16 J
an
23 J
an
30 J
an
06 F
eb
13 F
eb
20 F
eb
27 F
eb
06 M
ar
13 M
ar
20 M
ar
27 M
ar
03 A
pr
10 A
pr
17 A
pr
24 A
pr
01 M
ay
08 M
ay
15 M
ay
22 M
ay
29 M
ay
05 J
un
US$/bUS$/b
Dubai Urals

Commodity Markets
OPEC Monthly Oil Market Report – June 2014 11
Commodity Markets Average commodity prices have remained stable in May, with a slight appreciation in energy prices driven by increasing oil and coal prices, offset by declining natural gas prices that continued a correction started in March. Non-energy commodities remained flat for the second consecutive month with increases in base metals on reports of improving industrial production prospects in China and the continuation of supply disruptions in key suppliers. Meanwhile, average agricultural prices remained flat during the month, while experiencing falls at the end of the month on improving weather conditions in the US. Gold prices remained weak, following the trend, which started in March, on improving global economic outlook. Trends in selected commodity markets After experiencing significant volatility during the first quarter, commodity price movements moderated in the first two months of the second quarter. Uncertainties about slowing industrial production in China have receded after recent PMI readings showed improving conditions in the manufacturing sector. However, recent government data also points to a deceleration of raw material imports in May on higher-than-average inventories and stricter trade financing requirements. At the same time, recent improvements in service and manufacturing indicators in advanced economies are still to be weighed against the risks of declining inflation in Europe, which may reduce the appeal of commodities for hedging purposes. Close monitoring will be required of the impact across asset classes of the special measures undertaken by the ECB aimed at spurring lending and consumption in the Euro-zone. Weather-related concerns have also receded during the last month. Improving weather conditions in the US and expectations for ample global supplies have put pressure on grain prices. The USDA has reported better-than-expected conditions for corn and wheat growers during the month. In addition, higher-than-expected wheat production in the Black Sea region due to the milder winter also put pressure on wheat prices at the end of the month. However, it remains to be seen if the deteriorating Russian and Ukrainian economies will have an impact on the next planting season in the region. Energy prices have remained steady with US natural gas continuing the decline from the peak in February on increasing inventories, while concerns of above-average temperatures during the summer may trigger increasing cooling demand, lending some support in the coming months. Meanwhile, in Europe, above-average gas inventory levels of 60% at the end of May ‒ compared to a 2010-2013 average of 50% ‒ due to a milder-than-normal winter, as well as cheaper coal prices and substitution by renewable sources, continue preventing natural gas prices from rising, despite potential supply disruptions arising from the political situation in Ukraine. Supply disruptions continue to support key base metals, with production in New Caledonia’s Goro nickel plant halted after an acid spill on one of the island’s rivers and the continuation of a ban on ore exports placed by the Indonesian government. Nickel prices have risen close to 40% in 2014 so far. The Indonesian government wants foreign companies to invest in new smelters in order to export more refined metal. However, March and April data showing Indonesia’s trade balance shifting from a surplus to larger-than-expected trade deficit, may pressure reconsideration of the measure.

Commodity Markets
12 OPEC Monthly Oil Market Report – June 2014
Factors that will require close watch in the following months are the impact of the ECB and Federal Reserve decisions on inflation and interest rates in the European and US economies, respectively, and investment flows to emerging markets. It is also important to follow the impact of measures undertaken by Chinese authorities in order to restrict lending practices involving commodities as collateral – which could decrease the willingness of banks to provide credit support to Chinese commodity importers – and the impact of weather conditions on agricultural and natural gas prices. Table 2.1: Commodity price data, 2014
Average energy prices increased by 0.4% m-o-m in May. However, natural gas prices declined by 1.9% m-o-m, on faster-than-expected inventory rebuilds. Agricultural prices were almost flat during the period, increasing only marginally by 0.1% m-o-m. However, although food prices increased by 0.6% m-o-m, grains decreased –especially in the second half of the month – by 0.2% m-o-m on improving weather conditions in the US and record wheat production in Ukraine. Base metals increased by 1.7% m-o-m with support from copper that increased by 3.3% m-o-m on improved China manufacturing prospects and nickel that is still affected by supply disruptions. Meanwhile, iron ore declined significantly by 12.2% on high inventories and concerns over a regulatory crackdown on collateral borrowing practices in China. Within precious metals, average gold and silver prices declined by 0.7% m-o-m and 2.0% m-o-m, respectively, with large declines at the end of the month, on an improving
Mar 14 Apr 14 May 14 Mar/Feb Apr/Mar May/Apr
Energy 127.4 128.4 128.9 -2.7 0.8 0.4Coal, Australia $/mt 73.3 72.8 73.7 -3.9 -0.7 1.2Crude oil, average $/bbl 104.0 104.9 105.7 -0.8 0.8 0.8Natural gas, US $/mmbtu 4.5 4.7 4.6 -28.1 4.8 -1.9Non Energy 100.0 100.0 99.9 0.2 0.0 0.0Agriculture 108.2 107.3 107.5 1.9 -0.8 0.1Food 114.0 112.5 113.2 0.8 -1.3 0.6Soybean meal $/mt 584.0 566.0 578.8 -1.7 -3.1 2.3Soybean oil $/mt 1,002.0 999.0 965.3 1.7 -0.3 -3.4Soybeans $/mt 500.0 516.0 521.3 -15.4 3.2 1.0Grains 114.5 113.1 112.9 3.8 -1.2 -0.2Maize $/mt 222.3 222.4 217.3 6.2 0.0 -2.3Wheat, US, HRW $/mt 323.6 324.9 334.7 10.7 0.4 3.0Sugar, world $/kg 0.4 0.4 0.4 7.8 -1.6 3.7Base Metal 84.4 87.1 88.5 -2.8 3.1 1.7Aluminum $/mt 1,705.4 1,810.7 1,751.1 0.6 6.2 -3.3Copper $/mt 6,650.0 6,673.6 6,891.1 -7.0 0.4 3.3Iron ore, cfr spot $/dmtu 111.8 114.6 100.6 -7.9 2.5 -12.2Lead $/mt 2,053.1 2,087.1 2,097.3 -2.6 1.7 0.5Nickel $/mt 15,678.1 17,373.6 19,401.1 10.4 10.8 11.7Tin $/mt 23,024.3 23,405.2 23,271.3 0.9 1.7 -0.6Zinc $/mt 2,007.9 2,027.2 2,059.0 -1.3 1.0 1.6Precious MetalsGold $/toz 1,336.1 1,298.5 1,288.7 2.8 -2.8 -0.7Silver $/toz 20.7 19.7 19.3 -0.6 -4.7 -2.0
Source: World Bank, Commodity price data.
World Bank commodity price indices for low and middle income countries (2010 = 100)
UnitCommodity Monthly averages % Change

Commodity Markets
OPEC Monthly Oil Market Report – June 2014 13
US economic outlook and reports of a drop in Chinese gold imports through Hong Kong in April for the second consecutive month. Graph 2.1: Major commodity price indices, 2012-2014
In May, the Henry Hub (HH) natural gas price index trended lower and continued its correction from the February peak, but at a slower pace than the previous two months. The index declined by 9¢, or 1.9%, at $4.59 per million British thermal units (mmbtu), after trading at an average of $4.68/mmbtu the previous month. The US Energy Information Administration (EIA) said utilities put 119 billion cubic feet (Bcf) in storage in the week ended 30 May, 3 Bcf above the market expectation for a 116 Bcf increase. Gas in storage stands at 1,499 Bcf, which is 37.4% below the five-year average. The EIA expects end of October working inventory levels of 3,405 Bcf, requiring average weekly injections of 87 Bcf. However, analysts point out that a potential pickup in summer demand could pose a threat to achieving such inventory levels. Graph 2.2: Inventories at the LME
20406080100120140160
20406080
100120140160
Jun
12
Jul 1
2
Aug
12
Sep
12
Oct
12
Nov
12
Dec
12
Jan
13
Feb
13
Mar
13
Apr
13
May
13
Jun
13
Jul 1
3
Aug
13
Sep
13
Oct
13
Nov
13
Dec
13
Jan
14
Feb
14
Mar
14
Apr
14
May
14
IndexIndex
Energy Non-energy Agriculture Food
Base metals HH natural gas Gold
Source: World Bank, Commodity price data.
Base year 2010 = 100
6,200
6,400
6,600
6,800
7,000
7,200
7,400
7,600
7,800
6,200
6,400
6,600
6,800
7,000
7,200
7,400
7,600
7,800
May
13
Jun
13
Jul 1
3
Aug
13
Sep
13
Oct
13
Nov
13
Dec
13
Jan
14
Feb
14
Mar
14
Apr 1
4
May
14
'000 Tonnes'000 Tonnes
Sources: London Metal Exchange and Haver Analytics.

Commodity Markets
14 OPEC Monthly Oil Market Report – June 2014
Investment flows into commodities The total open interest volume (OIV) in major US commodity markets decreased by 2% m-o-m to 8.4 million contracts in May. On the energy side, natural gas OIV decreased significantly by 7.6% while crude oil OIV decrease slightly by 1.3%. Precious metals OIV expanded by 4.8%, while copper and agricultural OIVs declined by 2% and 1.7%, respectively. Graph 2.3: Total open interest volume
Total net-length speculative positions in commodities decreased by 8.2% m-o-m to 1,507,666 contracts in May amid declines in managed money net-length positions in natural gas, agriculture and precious metals. However, with regard to copper, money managers switched to a net long position from a net short position in the previous month, reflecting increasingly bullish sentiment on improving prospects for the Chinese economy. Graph 2.4: Speculative activity in key commodities, net length
Agricultural OIV was down 2% m-o-m to 4,444,347 contracts in May. Meanwhile, money manager net long positions in agriculture declined for the first time in 2014 by 11.2% to 815,271 lots, after four consecutive months of gains, on improving weather conditions, higher inventories and receding geopolitical tensions.
7,000
7,500
8,000
8,500
9,000
9,500
7,000
7,500
8,000
8,500
9,000
9,500
May
13
Jun
13
Jul 1
3
Aug
13
Sep
13
Oct
13
Nov
13
Dec
13
Jan
14
Feb
14
Mar
14
Apr 1
4
May
14
'000 contracts
Source: US Commodity Futures Trading Commission.
'000 contracts
-100
100
300
500
700
900
-100
100
300
500
700
900
May
13
Jun
13
Jul 1
3
Aug
13
Sep
13
Oct
13
Nov
13
Dec
13
Jan
14
Feb
14
Mar
14
Apr 1
4
May
14
'000 contracts'000 contracts
Agriculture Gold WTI Natural gas Livestocks Copper
Source: US Commodity Futures Trading Commission.

Commodity Markets
OPEC Monthly Oil Market Report – June 2014 15
Graph 2.5: Speculative activity in key commodities, as % of open interest
HH natural gas OIV decreased by 7.6% m-o-m to 1,019,070 contracts in May. Money managers cut their net long positions sharply by 25.2% to 82,997 lots on higher-than-expected weekly storage injections during the month. Copper OIV decreased by 2% m-o-m to 149,381 contracts in May. Money managers changed their stance from a bearish net short position of 8,275 lots in April to a bullish net long position of 14,414 lots on improving readings of China’s manufacturing sector during the month and the possible impact of supply disruptions in Asia. Table 2.2: CFTC data on non-commercial positions, ‘000 contracts
Gold’s OIV increased by 8% m-o-m to 399,699 contracts in May. However, money managers cut their bullish bets in gold slightly by 2.7% to 77,953 lots, amid prospects of higher interest rates in the US in the medium-term and continued stock market appreciation during the month.
-10
0
10
20
30
40
-10
0
10
20
30
40M
ay 1
3
Jun
13
Jul 1
3
Aug
13
Sep
13
Oct
13
Nov
13
Dec
13
Jan
14
Feb
14
Mar
14
Apr 1
4
May
14
%%
Agriculture Gold WTI Livestocks Copper Natural gas
Source: US Commodity Futures Trading Commission.
Apr 14 May 14 Apr 14 % OIV May 14 % OIV
Crude oil 1,649 1,627 318 19 309 19Natural gas 1,103 1,019 111 10 83 8Agriculture 4,522 4,444 918 20 815 18Precious metals 526 551 87 16 79 14Copper 152 149 -9 -6 13 9Livestock 672 655 217 32 208 32Total 8,625 8,446 1,642 19 1,508 18Source: US Commodity Futures Trading Commission.
Open interest Net length

Commodity Markets
16 OPEC Monthly Oil Market Report – June 2014
Graph 2.6: Inflow of investment into commodities, 2011-2014
0
20
40
60
80
100
120
140
1Q 2Q 3Q 4Q 1Q 2Q 3Q 4Q 1Q 2Q 3Q 4Q 1Q Apr
2011 2012 2013 2014
US$ bn
Agriculture Copper Gold Natural gas WTI crude oil
Source: US Commodity Futures Trading Commission.

World Economy
OPEC Monthly Oil Market Report – June 2014 17
World Economy Risks to the global growth forecast of 3.4% for this year have recently become apparent again as industrialised economies, amid slowing emerging economies, also face some headwinds. A contraction in the US in the 1Q14, revised low growth in the Euro-zone for the same period and uncertainty about the magnitude of a rebound in these economies in the remainder of the year are all pointing to growth uncertainties. The impact of Japan’s sales tax increase also remains to be seen. Emerging economies continue to grow at lower rates than in the past years, while modest improvements have been observed in recent weeks. The growth forecast remains unchanged this month. But if the current – slightly lower than anticipated – trend continues, global growth will most likely be below the current level. Table 3.1: Economic growth rate and revision, 2013-2014, %
OECD OECD Americas US The fact that there was a downward revision to 1Q14 growth, from only 0.1% q-o-q seasonally adjusted annualized rate (SAAR), did not come as a surprise. However, the magnitude of a revision to -1.0% q-o-q SAAR was unexpected and larger than projected. While most of the impact might be attributable to the unusual cold weather at the beginning of the year, there have been some elements of an underlying drag, mainly coming from the negative impact from exports to China. For the remainder of the year the economy is expected to rebound strongly and to grow by more than 3%. But despite current positive signals, some uncertainties remain. The labour market has continued improving. This positive momentum has also pushed consumer confidence and the very important private household consumption (which accounts for around two-thirds of the economy), which was again showing a supportive trend even in the 1Q14 with a growth rate of 3.1% q-o-q SAAR, after a high rate also in the 4Q13, when it stood at 3.3% q-o-q SAAR. Some distortions, however, in this healthy trend might have been influenced by healthcare spending due to the Affordable Care Act. But even if an adjustment is made for this positive effect, consumption shows a good underlying momentum. Therefore, the GDP dynamic in the current 2Q14 will need close monitoring as the US economy will, indeed, need a significant rebound – not only in the second quarter but also in the second half – in order to achieve the current growth expectations for the year. So far, the positive momentum in the labour market, as well as rising equities and the ongoing rise in
World OECD US Japan Euro-zone China India Brazil Russia
2013E* 2.9 1.3 1.9 1.5 -0.4 7.7 4.7 2.3 1.3
Change from previous month 0.0 0.0 0.0 0.0 0.0 0.0 0.0 0.0 0.0
2014F* 3.4 2.0 2.4 1.3 1.0 7.5 5.6 2.0 0.9
Change from previous month 0.0 0.0 0.0 0.0 0.0 0.0 0.0 0.0 0.0
* E = estimate and F = forecast.

World Economy
18 OPEC Monthly Oil Market Report – June 2014
house prices, continue supporting the expectation of a recovery in the remainder of the year from the low rate of expansion in the 1Q14. The labour market has continued improving. After standing at 6.7% for the second consecutive month in March, the unemployment rate dropped to 6.3% in April and remained there in May. Also, non-farm payroll additions grew by 217,000 in May, after 282,000 in April, again showing solid growth. Negatively, the participation rate remained at 62.8% for a second consecutive month, lower than the March number of 63.2%. On the other hand, the share of long-term unemployed has improved again and now stands at 34.6% after reaching 35.3% in April. But this is substantially below the 37.0% seen in February. House prices, which also constitute a very important wealth factor for US households, have continued to rise. But the record high levels of the past months are coming back a little bit. Data from the Federal Housing Finance Agency (FHFA) shows that 3Q13 price rises of 8.5% y-o-y constituted the peak level, while price rises since then have moved lower to stand at 7.7% in 4Q13 and at 6.9% in 1Q14, with the latest available number for March at 6.5%. Given the expectation of further rising interest rates and with mortgages being the most influential financing tool for the sector, this is an area that will need close monitoring in the future. Given the relatively positive development in the labour market and in household income, consumer confidence also remained at solid levels recently. The Conference Board Consumer Confidence Index stood at 83.0 in May, after 81.7 in April, only slightly lower than in March, when it stood at 83.9. The University of Michigan Consumer Sentiment Index moved back a little bit to 81.9 from 84.1 in April. Graph 3.1: Manufacturing and non-manufacturing ISM indices
The Purchasing Managers’ Index (PMI) for the manufacturing sector, provided by the Institute of Supply Management (ISM), also posted a rising trend once again. It moved to 55.4 in May after a level of 54.9 in April. Industrial production rose by a healthy 3.5% y-o-y in April, almost the same level as in March when it rose by 3.9% y-o-y. In addition, the ISM index for the services sector, which constitutes more than two-thirds of the economy, rose to 56.3 in May from 55.2 in April. Given weak 1Q14 GDP growth so far, near-term developments will provide more indications if the current GDP growth forecast for 2014 of 2.4% remains achievable.
45
50
55
60
Jun
13
Jul 1
3
Aug
13
Sep
13
Oct
13
Nov
13
Dec
13
Jan
14
Feb
14
Mar
14
Apr 1
4
May
14
Index
ISM manufacturing index ISM non-manufacturing index
Source: Institute for Supply Management.

World Economy
OPEC Monthly Oil Market Report – June 2014 19
This would imply that the US economy will need to expand at almost 4% for the remainder of the year – which is, indeed, a challenging task. Canada In Canada, improvements continue as well, but the low growth from 1Q14 in the US – its most important trading partner – have also been felt. The growth rate in the 1Q14 stood at only 1.2% q-o-q SAAR. The positive trend in industrial production, however, continues. In March it expanded by 3.6% y-o-y, slightly higher than the level of February at 3.5% y-o-y. The PMI for manufacturing remains almost unchanged at 52.2 in May, after having reached 52.9 in April. The GDP growth expectation for 2014 remains unchanged at 2.3%, after growth of 2.0% in 2013. OECD Asia-Pacific Japan After the sales tax increase in April the economy’s domestic demand trend has been, as expected, negatively impacted. After a sharp rise in retail sales in March, ahead of the sales tax increase, they then fell in April. Exports have also trended down recently. But given that Japanese exporters seem to have not entirely adjusted prices in line with the depreciation of the yen, there is still some room to manoeuvre on the pricing front, which could also be supportive for exports in the near future. Moreover, although it is a temporary phenomenon, inflation has reached a level of 3.4% y-o-y amid the sales tax increase and is clearly above the level of 2%, which the Bank of Japan (BOJ) sees as the appropriate level by the end of the year. While rising inflation might be a positive development for monetary policymakers, it is also a dangerous dynamic. This is because so far earnings have not risen. This burden of monetarily induced inflation in combination with the sales tax increase might, therefore, be a dampening factor for future domestic demand. Earnings might rise with an unemployment level of only 3.6%, which is basically full employment and a signal to a very tight labour market. But this remains to be seen. Therefore, the 2Q14 GDP growth number will relatively likely be negative and the question will be at which magnitude it may decline. Historical comparison at least shows that a sales tax increase is able to considerably drag the economy afterwards. The magnitude of the drag may also depend on the government’s ability to counterbalance this effect via stimulus measures and on further actions by the BOJ, which will also probably introduce new or extend existing monetary supply facilities. In general, the aim of the government to reduce the large public debt pile via an increase in the sales tax should be considered a necessary move towards healthier debt management. Therefore, as the fiscal room to manoeuvre becomes more limited, the economy’s structural improvements will also have a more important role to play to continue the current progress. While Japanese exports have felt the slowdown in the emerging market trading partners, particularly China, although growth rates in China have improved slightly recently. Export growth increased to a level of 5.1% y-o-y in April, after it reached a low of only 1.8% y-o-y in March, significantly lower than in February and in January, when exports grew by 9.5% and 9.8% y-o-y, respectively. Domestic demand increased significantly ahead of the sales tax increase in April. Retail trade rose by 11.0% y-o-y in March, by far the largest increase in the last decade. However, in April it declined by 4.4%. With this currently challenging environment, lead indicators – in the form of sentiment indices – have also fallen.

World Economy
20 OPEC Monthly Oil Market Report – June 2014
Graph 3.2: Japanese PMI indices Graph 3.3: Japanese consumer price index (CPI) vs. earnings
Lead indicators have declined considerably. The latest PMI numbers, as provided by Markit, show that the manufacturing PMI in May stood again below the 50 level at 49.9, only slightly better than 49.4 in April. Also, the domestically important services sector indicated a contraction. While it improved significantly from 46.4 in April, it remained below the 50 level at 49.3 in May. Moreover, consumer confidence also fell to an index level of only 36.6 in April, lower than the already poor level of 36.9 in March. This compares to an average level of 43.4 for 2013. The GDP growth estimate for 2014 remains unchanged at 1.3%, below last year’s growth level of 1.5%. Developments in domestic demand will need especially close monitoring in the coming weeks to gain further insight into the near-term development of the economy. South Korea The mixed growth in South Korea seems to continue. Industrial production rose by 1.3% in April, after 2.5% y-o-y in March and 1.6% y-o-y in February. The composite leading index of the National Statistical Office, reached a new record high of 118.8 in March, while the manufacturing PMI fell to 50.2 in May on a non-seasonally adjusted base. This compares to 53.7 in both April and March, and 47.0 in February. The growth forecast for 2014 remains unchanged at 3.1%. But given the slow-down in some of South Korea’s main trading partners in Asia, the growth pattern will need close monitoring. OECD Europe
Euro-zone The latest numbers confirm the Euro-zone’s improving but fragile growth trend. The 1Q14 GDP has been revised down from 0.3% q-o-q growth to only 0.2%. The inflation level has also retreated again to only 0.5% y-o-y in May from 0.7% y-o-y in April. And the unemployment rate remains at a high level of 11.7%, though – on a positive note – it is improving. Furthermore, the ECB has acknowledged recently that the growth trend remains subdued and uneven, and has announced a variety of additional monetary supply measures, including negative interest rates on its deposits for banks, and a Targeted Long Term Refinancing Operation (TLTRO) of up to €400 billion, which
46
48
50
52
54
56
58M
ay 1
3Ju
n 13
Jul 1
3A
ug 1
3S
ep 1
3O
ct 1
3N
ov 1
3D
ec 1
3Ja
n 14
Feb
14M
ar 1
4A
pr 1
4M
ay 1
4
Index
Sources: Markit, Japan Materials Management Association and Haver Analytics.
Services
Manufacturing
-3%
-2%
-1%
0%
1%
2%
1Q 1
2
2Q 1
2
3Q 1
2
4Q 1
2
1Q 1
3
2Q 1
3
3Q 1
3
4Q 1
3
1Q 1
4
Sources: Ministry of Internal Affairs and Communications; Ministry of Health, Labour and Welfare; and Haver Analytics.
% change y-o-y
CPI
Quarterly earnings

World Economy
OPEC Monthly Oil Market Report – June 2014 21
provides additional monetary supply until 2018, and further instruments. The ECB president has further pointed at the possibility of quantitative easing, if the current measures are not sufficient. While they are improving, output levels and other output related data have been mixed recently across the various economies. Germany is still leading the recovery, increasingly supported by some peripheral economies, while France continues to be weak. Germany’s 1Q14 GDP growth stood at 0.8% q-o-q, considerably above the Euro-zone’s number, while France recorded no growth at all. Also, Italy moved back into negative territory with a contraction of 0.1% q-o-q, while Spain’s GDP rose by 0.4% q-o-q. In the smaller peripheral countries, Portugal’s GDP fell by 0.6% q-o-q but Greece’s rose by 0.5%. With the expected rebound in the US in the remainder of the year, and with some progress becoming apparent in China, the economies that are traditionally geared towards external trade – that is, Germany, France, Spain, etc. – may see some further improvements. This uneven and gradual recovery has also been mirrored in the latest unemployment numbers of the Euro-zone. The unemployment rate improved slightly to 11.7% in April from 11.8% in March. This compares to last year’s average of around 12.0%. Despite this improvement, this elevated level remains a significant challenge to the economy for a faster recovery. The difference in unemployment rates across economies also continues to highlight the varying speeds of recovery within the Euro-zone. Spain still recorded a high level of 25.1%, while Germany’s unemployment rate stood at only 5.2%, only slightly above the average of around 5% for an advanced economy, therefore reflecting almost full employment. But the high Spanish unemployment rate compares to an even more elevated peak-level in the past year of 26.3%. However, a major concern for Spain’s economy remains the area of youth unemployment which has a rate of 53.5% on average, compared to the already high level of 23.5% for the Euro-zone as a whole. These high unemployment numbers have also been the outcome of the structural changes that have taken place, mainly in the peripheral economies, which needed to adjust their economies in order to improve their competitiveness. This has also led to declining income levels, an important factor behind the relatively low inflation in the Euro-zone, which in May stood again at only 0.5% y-o-y. While the core economies are currently facing relatively low inflation, deflation has so far been a phenomenon of select peripheral economies and, furthermore, should be expected to be overcome, given the latest round of monetary stimulus and given that income levels should have bottomed out in the past several months. Rising wages should also lead to higher core inflation levels. As an outcome of its latest meeting, the ECB has highlighted that it aims to improve inflation levels. This should materialise as a softening euro, which would not only make imports more expensive but could also improve the export competitiveness of the Euro-zone economies. Also, one of the core aims of the ECB is that it wishes to increase the lending of financial intermediaries to private households, a sector which is still declining on a yearly base. It fell by 2.1% y-o-y in April, compared to 2.6% y-o-y in March. While this is still negative on a yearly comparison, it came off its low of -3.2% in November.

World Economy
22 OPEC Monthly Oil Market Report – June 2014
Graph 3.4: Euro-zone PMI indices Graph 3.5: Euro-zone consumer price index and lending activity
Lead indicators still confirm some unevenness in the Euro-zone’s growth pattern. The latest manufacturing PMI, as provided by Markit, stood at 52.2 in May, slightly below the 53.1 in April. It reached 52.3 in Germany but moved below the growth indicating level of 50 in France, where it stood at only 49.6 in May. In Italy, it reached 53.2, only slightly below the April number of 54.0. While the recovery in the Euro-zone has gained some traction lately, the low 1Q14 number highlights the fact that the development of its economy remains fragile. The GDP growth forecast for 2014 remains, therefore, at 1.0%, after the economy contracted in the past year by 0.4%. Uncertainties remain and ongoing developments will need close monitoring. UK The United Kingdom’s most recent economic performance shows continued improvement and stands above the average level of most of its fellow EU countries. Industrial production increased by 2.9% y-o-y in April, its highest growth rate since March 2011. The manufacturing PMI stood at a significant level of 57.0 in May, almost unchanged from April’s 57.4. The same applies to the important services PMI, which was also almost unchanged at 58.6 in May, around the same level as April’s 58.7. While the GDP growth forecast remains unchanged, this recent positive development may lead to some further upward revisions in the coming months from the current GDP growth forecast of 2.4% for the current year.
46
48
50
52
54
56M
ay 1
3Ju
n 13
Jul 1
3Au
g 13
Sep
13O
ct 1
3N
ov 1
3D
ec 1
3Ja
n 14
Feb
14M
ar 1
4Ap
r 14
May
14
Index
Sources: Markit and Haver Analytics.
Services
Manufacturing
-4%
-2%
0%
2%
4%
6%
-1%
0%
1%
2%
3%
4%
May
09
Nov
09
May
10
Nov
10
May
11
Nov
11
May
12
Nov
12
May
13
Nov
13
May
14
CPI (LHS) MFI lending (RHS)
Sources: Statistical Office of the European Communities, European Central Bank and Haver Analytics.
% change y-o-y % change y-o-y

World Economy
OPEC Monthly Oil Market Report – June 2014 23
Emerging and Developing Economies In Brazil, the indicators point once again to a deceleration in exports accompanied by a weakening sentiment among consumers, shrinking investment and lower manufacturing activity. The World Cup, on the other hand, is seen as providing notable support to private consumption in the 2Q and 3Q of 2014. However, the event could have an impact on inflation and thereby possibly counteract an increase in consumption. As the 2013 GDP estimate was revised up from 2.3% to 2.5%, this improved base line provides a positive factor for the 2014 forecast. GDP growth remains unchanged this month at 2.0%, due to relatively balanced upward/downward drivers. While the pace of capital outflow from Russia is not seen continuing as sharply as had occurred in the 1Q14, given the un-escalating of political circumstances, both the services and manufacturing PMI surveys of May clearly point to a downwards movement in the Russian economy, which has not yet touched bottom yet. The forecast for GDP growth in 2014 is 0.9% y-o-y, unchanged from last month. The risk continues to be skewed to the downside with a possible further downwards revision next month, if the downturn continues. India's GDP in real terms expanded only 4.6% in the 1Q14 y-o-y on a factor-cost basis. Manufacturing and investment continue to bear the brunt of India's economic weakness, while consumer demand is also at multi-year lows. In this month the momentum in the manufacturing sector improved marginally, due to higher domestic and export order flows. Growth in China continued to slow in April, with most major indicators showing continued weakness. Fixed asset investment (FAI) and industrial output – two proxies for China's industrial sector and investment growth – saw growth at weaker rates, further deepening a medium-term deceleration. Final China PMI rebounded to 49.4 in May, up from 48.1 in April. New orders also stabilized, while new export orders recorded an impressive expansion of 53.2. Table 3.2: Summary of macroeconomics performance of BRIC countries
Brazil The country’s GDP grew by 0.2% in the 1Q14 compared to the last quarter of last year. This is half the q-o-q rate of expansion registered in the 4Q13. The slower growth was led by investment which fell 2.1% q-o-q. Compared to the 1Q13, however, it shows a 1.9% y-o-y growth occurring at the same speed at which the economy grew in the 1Q13. Government consumption registered the highest rate of growth since the beginning of 2013 at 3.4% y-o-y. The drag on growth in the 1Q14 came from investment, which exhibited the first contraction in four quarters. Gross Fixed Capital Formation (GFCF) contracted by 2.1% y-o-y.
2013E* 2014F* 2013 2014 2013 2014 2013 2014 2013 2014
Brazil 2.3 2.0 6.2 6.2 -81.4 -78.1 -3.2 -4.0 56.8 58.0Russia 1.3 0.9 6.8 6.0 33.5 27.0 -0.5 -0.4 8.1 8.3India 4.7 5.6 10.0 8.0 -49.2 -55.5 -5.0 -5.2 51.5 52.0China 7.7 7.5 2.6 2.5 182.8 182.0 -1.8 -2.2 15.5 16.6
* E = estimate and F = forecast.Sources: OPEC Secretariat, Concensus, Economic Intelligence Unit, Financial Times and Oxford.
GDP growth rate
Consumer price index, % change
y-o-y
Current account balance, US$ bn
Government fiscal balance, % of GDP
Net public debt, % of GDP

World Economy
24 OPEC Monthly Oil Market Report – June 2014
Graph 3.6: Brazilian quarterly GDP growth, NSA
Graph 3.7: Brazilian quarterly GDP composition, NSA
Following last month’s increase, the Central Bank of Brazil left interest rates on hold at 11.0% as the economy remained sluggish. Domestic sentiment deteriorated further last month with the consumer confidence index dropping to 101.3. This marks the lowest reading of the index since April 2009. Exports from Brazil signalled a contraction for the third month running with -4.9% y-o-y in May, following -4.4% and -8.8% in April and March, respectively. Inflation moved upwards during February through April, registering 5.8% in April due to pressure from higher food prices resulting from a drought which affected crops in some regions. Unemployment fell to 4.9% in April from 5.0% a month earlier and from 5.8% in the same month last year. This also marked the lowest rate since January 2013. May data indicated that the business conditions of the Brazilian industrial sector economy as a whole continued to deteriorate. Graph 3.8: Brazilian consumer confidence index, NSA
Graph 3.9: Brazilian manufacturing PMI
The manufacturing PMI fell from 49.3 in April to 48.8 in May, reaching a record low of ten months. This is the second consecutive deterioration in operating conditions. Brazilian manufacturers slowed production due to a reduction in orders received for the second month running. Furthermore, the recent decrease in production was the most
1.9%
Avg. 20112.8%
Avg. 20121.0%
Avg. 20132.3 %
0
1
2
3
4
51Q
11
2Q 1
13Q
11
4Q 1
11Q
12
2Q 1
23Q
12
4Q 1
21Q
13
2Q 1
33Q
13
4Q 1
31Q
14
% change y-o-y
Sources: Instituto Brasileiro de Geografia e Estatística and Haver Analytics.
-6%-4%-2%0%2%4%6%8%
10%
1H 12 2H 12 1H 13 2H 13
Private consumptionGovernment consumptionGFCFExportsImports
Sources: Instituto Brasileiro de Geografia e Estatística and Haver Analytics.
%change y-o-y
102.1
113.8
101.390
95
100
105
110
115
120
125
130
May
08
Nov
08
May
09
Nov
09
May
10
Nov
10
May
11
Nov
11
May
12
Nov
12
May
13
Nov
13
May
14
Index
Sources: Fundação Getúlio Vargas and Haver Analytics.
Nov 13
May 09
May 1449.3
48.9
48
49
49
50
50
51
51
May
13
Jun
13Ju
l 13
Aug
13
Sep
13
Oct
13
Nov
13
Dec
13
Jan
14Fe
b 14
Mar
14
Apr
14
May
14
Index
Sources: HSBC, Markit and Haver Analytics.
World Economy
OPEC Monthly Oil Market Report – June 2014 25
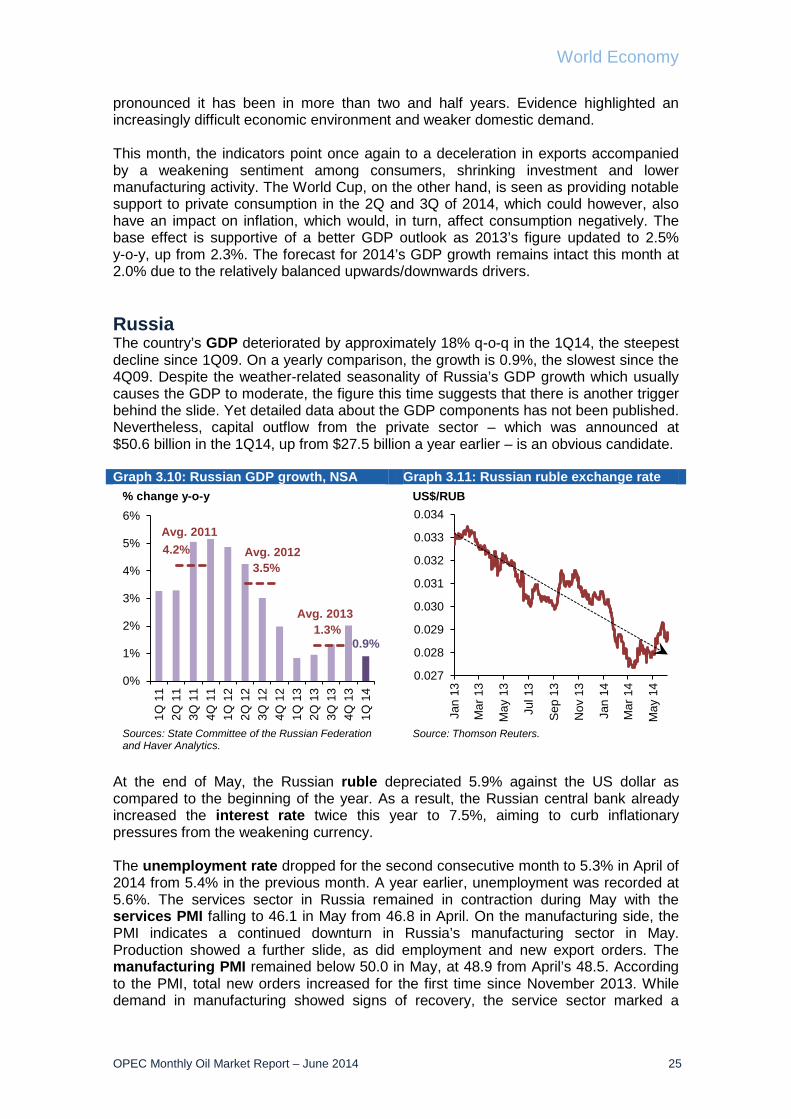
pronounced it has been in more than two and half years. Evidence highlighted an increasingly difficult economic environment and weaker domestic demand. This month, the indicators point once again to a deceleration in exports accompanied by a weakening sentiment among consumers, shrinking investment and lower manufacturing activity. The World Cup, on the other hand, is seen as providing notable support to private consumption in the 2Q and 3Q of 2014, which could however, also have an impact on inflation, which would, in turn, affect consumption negatively. The base effect is supportive of a better GDP outlook as 2013’s figure updated to 2.5% y-o-y, up from 2.3%. The forecast for 2014’s GDP growth remains intact this month at 2.0% due to the relatively balanced upwards/downwards drivers. Russia The country’s GDP deteriorated by approximately 18% q-o-q in the 1Q14, the steepest decline since 1Q09. On a yearly comparison, the growth is 0.9%, the slowest since the 4Q09. Despite the weather-related seasonality of Russia’s GDP growth which usually causes the GDP to moderate, the figure this time suggests that there is another trigger behind the slide. Yet detailed data about the GDP components has not been published. Nevertheless, capital outflow from the private sector – which was announced at $50.6 billion in the 1Q14, up from $27.5 billion a year earlier – is an obvious candidate. Graph 3.10: Russian GDP growth, NSA Graph 3.11: Russian ruble exchange rate
At the end of May, the Russian ruble depreciated 5.9% against the US dollar as compared to the beginning of the year. As a result, the Russian central bank already increased the interest rate twice this year to 7.5%, aiming to curb inflationary pressures from the weakening currency. The unemployment rate dropped for the second consecutive month to 5.3% in April of 2014 from 5.4% in the previous month. A year earlier, unemployment was recorded at 5.6%. The services sector in Russia remained in contraction during May with the services PMI falling to 46.1 in May from 46.8 in April. On the manufacturing side, the PMI indicates a continued downturn in Russia’s manufacturing sector in May. Production showed a further slide, as did employment and new export orders. The manufacturing PMI remained below 50.0 in May, at 48.9 from April’s 48.5. According to the PMI, total new orders increased for the first time since November 2013. While demand in manufacturing showed signs of recovery, the service sector marked a
0.9%
4.2%3.5%
1.3%
0%
1%
2%
3%
4%
5%
6%
1Q 1
12Q
11
3Q 1
14Q
11
1Q 1
22Q
12
3Q 1
24Q
12
1Q 1
32Q
13
3Q 1
34Q
13
1Q 1
4
% change y-o-y
Sources: State Committee of the Russian Federation and Haver Analytics.
Avg. 2011Avg. 2012
Avg. 2013
0.027
0.028
0.029
0.030
0.031
0.032
0.033
0.034
Jan
13
Mar
13
May
13
Jul 1
3
Sep
13
Nov
13
Jan
14
Mar
14
May
14
US$/RUB
Source: Thomson Reuters.

World Economy
26 OPEC Monthly Oil Market Report – June 2014
deterioration of key economic activity indicators. The 12-month outlook for services activity improved further in May but remained weak. Positive sentiment was linked to an expected recovery in demand, while firms expecting lower activity cited political uncertainty, inflation and weaker investment spending as reasons. Graph 3.12: Russian unemployment rate, NSA
Graph 3.13: Russian services and manufacturing PMIs
While the pace of capital outflows is not seen as continuing as sharply as had occurred in the 1Q14 given the un-escalating political circumstances, both the services and manufacturing PMI surveys of May clearly suggest that the downwards movement in the economy of Russia has not yet hit bottom. The forecast for 2014 GDP growth is at 0.9% y-o-y, unchanged from last month. The risk continues to be skewed to the downside with a possible further downwards revision next month, if the downturns continue. India The National Democratic Alliance (NDA), led by the Bharatiya Janata Party (BJP), won a sweeping victory, taking 336 seats. The results were declared on 16 May. Although the "golden age" of India's economic might – with growth rates exceeding 8% – began before the NDA's 1998-2004 reign and lasted mainly throughout the first United Progressive Alliance (UPA-I) government in 2005-2009, it was largely a result of higher global growth, with emerging markets easily attracting foreign capital and boosting investment rates. Meanwhile, during the UPA-II government of 2010-2014, the sharp deterioration of macroeconomic fundamentals was the result of the 2007-2008 world economic crises. In contrast, the previous NDA regime was characterised by an overall improvement in India's macroeconomic fundamentals. Although it did not succeed in shrinking India's fiscal deficit, lower subsidies and minimum support prices helped keep inflation of the consumer price index (CPI) at an average of 4.1% during 1999-2004. The BJP's policies are more likely to favour the industrial sector and business community, whereas some of the agricultural polices previously pursued by the UPA, such as price-distorting agricultural subsidies and minimum support prices for agricultural goods, are more likely to be abandoned. In order to prove to the markets that the BJP is serious about reforms, Prime Minister Narendra Damodardas Modi will
5.6
5.3
4.5
5.0
5.5
6.0
6.5
May
12
Jul 1
2S
ep 1
2N
ov 1
2Ja
n 13
Mar
13
May
13
Jul 1
3S
ep 1
3N
ov 1
3Ja
n 14
Mar
14
May
14
Sources: Central Bank od the Russian Federation and Haver Analytics.
% change y-o-y
Apr 13
Apr 14
48.548.9
46.846.1
44
46
48
50
52
54
56
May
13
Jun
13Ju
l 13
Aug
13
Sep
13
Oct
13
Nov
13
Dec
13
Jan
14Fe
b 14
Mar
14
Apr
14
May
14
Index
Sources: HSBC, Markit and Haver Analytics.
Servicescomposite
Manufaturing PMI

World Economy
OPEC Monthly Oil Market Report – June 2014 27
have to phase out diesel subsidies and introduce a clear plan to shrink the remaining subsidy bill, bringing the fiscal deficit to under 3% by 2016-2017 and freeing up resources for urgently needed infrastructure investment and bank recapitalization. For the second year running, the Indian economy showed real growth below 5% during the fiscal year 2013/14 (ended 31 March 2014), a weakness not seen in the past 26 years. The real GDP ‒ on a factor cost basis ‒ expanded 4.7%, according to fresh data released by the Central Statistical Office (CSO). The manufacturing and mining sectors were the main drags on India's growth during the year and, in particular, in the fourth fiscal quarter. Graph 3.14: Indian GDP growth (SAAR) Graph 3.15: Indian merchandise trade
balance
For some time India has been in urgent need of drastic structural reforms to boost the supply-side of the economy, reducing bottlenecks by making improvements to weak infrastructure in the power and transport sectors, and improving the functioning of the labour market. The new government will need to address these issues if the economy’s performance is to improve significantly. But on a surprising note, the demand side of the economy showed a slightly better-than-anticipated performance despite abysmal investment trends. In terms of energy price regulation, until 2004 India met its own natural gas needs. But now the country is the world’s fifth largest liquefied natural gas (LNG) consumer. The long-term distortion of India’s gas pricing regime has precipitated a major gas supply shortfall, which has acted as a brake on economic activity. The government has begun to deregulate gas prices but also needs to stimulate domestic production to limit reliance on expensive LNG imports. Wholesale price (WPI) inflation remains above the 5% comfort zone of the Reserve Bank of India (RBI) and data shows it is currently about 5.3%. Furthermore, the all-India combined rural and urban measure of CPI inflation rose to 8.5% in April from 8.05% in February. This is far above the recommended target of 4% (±2% band). The rise in inflation in 2H13 forced the RBI to halt its loosening cycle and, instead, tighten monetary policy. The repo rate has been raised by 75 bp since August 2013 and now stands at 8%. It seems the repo rate will remain at this level until the end of 2014. But the latest uptick in inflation raises the risk of further rate hikes in the near future. Export growth has cooled this year, following a solid expansion during 2H13. In addition to subdued global demand, exports are probably also being held back by supply-side
4.9
3.42.9
3.9
4.84.4
4.7 4.7 4.6
2
3
4
5
6
1Q 2Q 3Q 4Q 1Q 2Q 3Q 4Q 1Q
2012 2013 2014
Sources: National Informatics Centre (NIC) and Haver Analytics.
% change y-o-y
-20,000
-18,000
-16,000
-14,000
-12,000
-10,000
-8,000
-6,000
Apr
12
Jun
12A
ug 1
2O
ct 1
2D
ec 1
2Fe
b 13
Apr
13
Jun
13A
ug 1
3O
ct 1
3D
ec 1
3Fe
b 14
Apr
14US$
mn
Sources: Ministry of Commerce and Industry and Haver Analytics.

World Economy
28 OPEC Monthly Oil Market Report – June 2014
constraints, including weak infrastructure in the power and transport sectors. Net trade will continue to contribute to growth, but this will largely reflect sluggish imports rather than strong exports. Graph 3.16: Indian inflation vs. repo rate
The economic situation is on a more stable footing than last year following a considerable narrowing in the current account deficit and, to a lesser extent, the budget deficit. According to RBI data, the country's current account deficit narrowed to just $1.4 billion, or 0.3% of GDP, during the 4Q13 but increased to $5.6 billion, or 1.2% of GDP, in the 2Q14. This marks a great improvement from the $20.7 billion (4.5% of GDP) shortfalls of the 2Q13. The narrowing of the current account deficit was disproportionately linked to the decline in gold imports, which was engineered through administrative means rather than driven by market forces. Therefore, as soon as import restrictions are lifted, gold imports are likely to increase again, eroding some of the recent improvements in the trade balance as happened in March. Graph 3.17: Indian current account balance Graph 3.18: Indian gold imports
May data indicated that production volumes at Indian manufacturers continued to rise. The growth of both total new orders and new export business accelerated over the month, leading to further job creation across the sector. The PMI increased marginally from 51.3 in April to 51.4 in May. Output also rose for the seventh consecutive month in
2
4
6
8
10
12
Jan13
Feb13
Mar13
Apr13
May13
Jun13
Jul13
Aug13
Sep13
Oct13
Nov13
Dec13
Jan14
Feb14
Mar14
Apr14
May14
%
Repo rate Consumer price index (CPI)CPI higher target bond CPI lower target bondWholesale price index (WPI) WPI confort zone
Sources: Ministry of Commerce and Industry, Reserve Bank of India and Haver Analytics.
-7.0
-6.0
-5.0
-4.0
-3.0
-2.0
-1.0
0.0
-35,000
-30,000
-25,000
-20,000
-15,000
-10,000
-5,000
0
1Q12
2Q12
3Q12
4Q12
1Q13
2Q13
3Q13
4Q13
1Q14 %US$
mn
Current account balance (LHS)As a percent of GDP (RHS)
Sources: Reserve Bank of India and Haver Analytics.
-100%
-60%
-20%
20%
60%
100%
Jan
12M
ar 1
2M
ay 1
2Ju
l 12
Sep
12
Nov
12
Jan
13M
ar 1
3M
ay 1
3Ju
l 13
Sep
13
Nov
13
Jan
14M
ar 1
4% change y-o-y
Sources: Ministry of Commerce and Industry and Haver Analytics.

World Economy
OPEC Monthly Oil Market Report – June 2014 29
May. That said, the rate of expansion was unchanged from the modest pace registered in April. It seems that the momentum in the manufacturing sector improved marginally, due to higher domestic and export order flows. However, output growth held steady as frequent power cuts forced firms to accumulate backlogs at a faster pace. Encouragingly, input price pressures eased further; but with output prices still rising the RBI cannot lower its inflation guards. Graph 3.19: Indian PMIs
In conclusion, India’s economy has fallen short of expectations over the past couple of years. But it is likely to pick up from its current lows in the medium-term due to greater financial stability and easing inflation. But despite making progress in cutting the twin deficits, the Indian economy remains vulnerable to capital outflows stemming from domestic or external shocks (such as an increase in commodity prices). Such developments could pose a significant downside risk to the baseline forecast, as heightened uncertainty would discourage investment while capital outflows would push the exchange rate down and inflation and interest rates up. GDP growth is expected to remain unchanged at 5.6% for 2014. China Growth in China continued to slow in April, with most major indicators showing continued weakness. Fixed asset investment (FAI) and industrial output – two proxies for China's industrial sector and investment growth – both saw growth at weaker rates, further deepening a medium-term deceleration. April trade figures provided some hope for an export recovery after a dismal start to the year. This year China's Ministry of Finance (MOF) plans to accelerate spending of already budgeted expenditures to support weaker economic conditions. It seems accelerated spending of budgets may help smooth growth from the 2Q to the 3Q, although it may result in softening growth in the final quarter of this year. Investment flows in China typically grow in the final months of the year when governments distribute payments and disburse excess budgets. For example, in 2013 average investment was about CN¥ 4.2 trillion per month in the second half, compared to CN¥ 3 trillion per month in the first half.
51.4050.6750.22
44
46
48
50
52
54
56
58
May
12
Jun
12
Jul 1
2
Aug
12
Sep
12
Oct
12
Nov
12
Dec
12
Jan
13
Feb
13
Mar
13
Apr 1
3
May
13
Jun
13
Jul 1
3
Aug
13
Sep
13
Oct
13
Nov
13
Dec
13
Jan
14
Feb
14
Mar
14
Apr 1
4
May
14
Index
Manufacturing PMI Composite PMI PMI services and activity
Sources: HSBC, Markit and Haver Analytics.

World Economy
30 OPEC Monthly Oil Market Report – June 2014
The shift in the Chinese yuan dynamics in the past three months appears to have started to have had some impact on capital flows. It seems that “hot money” flows after the recent peak of $35.4 billion inflow in February shifted to an outflow of $8.2 billion in April. A slowdown in investment and output continues, while growth remains positive and is consistent with a medium-term shift that is widely referred to as ‘industrial restructuring’ by government policymakers. Air pollution is one of the main issues that will impose huge costs to the Chinese economy. For this reason China will evaluate local governments' annual performance based on their implementation of air quality improvement policies, according to a State Council notice on 27 May. The policy also articulates China's goal of shifting away from the GDP-obsessed evaluation standards for local officials, and is consistent with the current rhetoric of pursuing more sustainable development with less dependence on energy-intensive and polluting sectors. Graph 3.20: Chinese yuan exchange rate Graph 3.21: Chinese GDP growth (SAAR)
The final Chinese PMI rebounded to 49.4 in May, up from 48.1 in April, and was revised down slightly from the earlier flash reading of 49.7. New orders stabilized, while new export orders recorded an impressive expansion of 53.2. But the growth momentum looked weaker than suggested in the flash reading as the index of stocks of finished goods was revised up to 49.8 from 48.8. Along with the more positive trade figures in April, this confirms that q-o-q growth will pick up in 2Q14. GDP is expected to grow by 7.5% in 2014 as a whole, with consumption outpacing investment as some of the rebalancing policies bear fruit.
6.05
6.10
6.15
6.20
6.25
6.30
6.35
Nov
12
Jan
13
Mar
13
May
13
Jul 1
3
Sep
13
Nov
13
Jan
14
Mar
14
May
14
CN¥/US$
Sources: State Administration of Foreign Exchange and Haver Analytics.
8.1
7.6
7.4
7.9
7.7
7.5 7.
8
7.7
7.4
5
6
7
8
9
1Q 2Q 3Q 4Q 1Q 2Q 3Q 4Q 1Q
2012 2013 2014
Sources: China's National Bureau of Statistics and Haver Analytics.
% change y-o-y

World Economy
OPEC Monthly Oil Market Report – June 2014 31
Graph 3.22: Chinese PMI Graph 3.23: Chinese industrial production
Overcapacity in China’s manufacturing will be addressed through the forced closure of some cement, steel and plate glass producers while encouraging technological sectors such as mobile communications, green energy and big data. But what emerges is a China that is still very state-driven and state-directed. It may be that a comprehensive urban development plan is the best way forward; but there is a clear risk that a banking crisis may materialise in the interim or that China could miss the opportunity to build a more liberal, open and efficient society.
OPEC Member Countries The Saudi Arabia SABB HSBC PMI of May highlighted a strengthened production growth rate in the country’s non-oil producing private sector companies, which reported its highest reading in three months. May’s survey indicated the continued expansion with the headline PMI recorded 57.0, down from 58.5 in April. The survey showed that the total new business growth remained strong and overall demand firm. Graph 3.24: Saudi Arabia and UAE: manufacturing PMIs
In Iran, the Customs Administration announced that the country exported 18.2 million tons of non-oil products, valued at $8.2 billion, during the two months in the period 21 March 2014 to 20 May 2014. This marks a 27.2% increase in weight when
49.5
48.1
51.4
46
48
50
52
54M
ay 1
3Ju
n 13
Jul 1
3A
ug 1
3S
ep 1
3O
ct 1
3N
ov 1
3D
ec 1
3Ja
n 14
Feb
14M
ar 1
4A
pr 1
4
Index
Composite PMIManufacturing PMIServices business activity
Sources: HSBC, Markit and Haver Analytics.
Mar 148.68%
Apr 148.90%
7%
8%
9%
10%
11%
May
12
Jul 1
2S
ep 1
2N
ov 1
2Ja
n 13
Mar
13
May
13
Jul 1
3S
ep 1
3N
ov 1
3Ja
n 14
Mar
14
May
14
% change y-o-y
Sources: China National Bureau of Statistics and Haver Analytics.
57.057.3
50
55
60
65
May
12
Jun
12
Jul 1
2
Aug
12
Sep
12
Oct
12
Nov
12
Dec
12
Jan
13
Feb
13
Mar
13
Apr 1
3
May
13
Jun
13
Jul 1
3
Aug
13
Sep
13
Oct
13
Nov
13
Dec
13
Jan
14
Feb
14
Mar
14
Apr 1
4
May
14
Index
Saudi Arabia UAE
Sources: SAAB, HSBC, Markit and Haver Analytics.
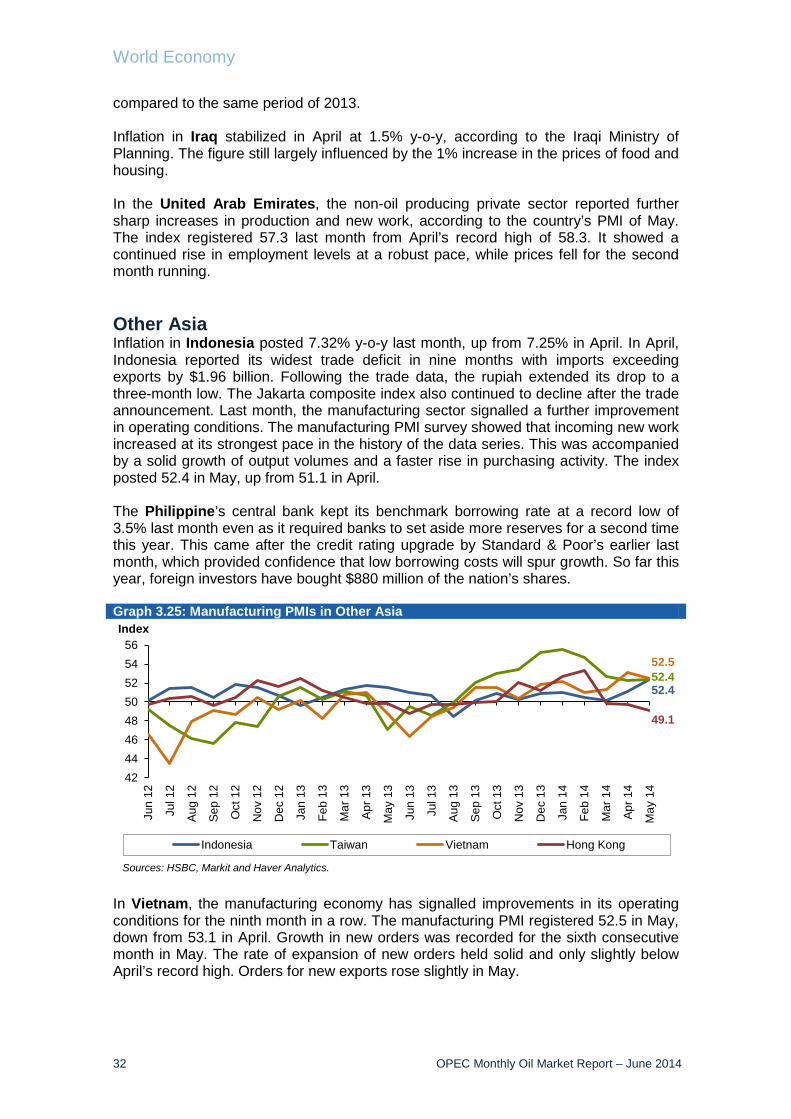
World Economy
32 OPEC Monthly Oil Market Report – June 2014
compared to the same period of 2013. Inflation in Iraq stabilized in April at 1.5% y-o-y, according to the Iraqi Ministry of Planning. The figure still largely influenced by the 1% increase in the prices of food and housing. In the United Arab Emirates, the non-oil producing private sector reported further sharp increases in production and new work, according to the country’s PMI of May. The index registered 57.3 last month from April’s record high of 58.3. It showed a continued rise in employment levels at a robust pace, while prices fell for the second month running. Other Asia Inflation in Indonesia posted 7.32% y-o-y last month, up from 7.25% in April. In April, Indonesia reported its widest trade deficit in nine months with imports exceeding exports by $1.96 billion. Following the trade data, the rupiah extended its drop to a three-month low. The Jakarta composite index also continued to decline after the trade announcement. Last month, the manufacturing sector signalled a further improvement in operating conditions. The manufacturing PMI survey showed that incoming new work increased at its strongest pace in the history of the data series. This was accompanied by a solid growth of output volumes and a faster rise in purchasing activity. The index posted 52.4 in May, up from 51.1 in April. The Philippine’s central bank kept its benchmark borrowing rate at a record low of 3.5% last month even as it required banks to set aside more reserves for a second time this year. This came after the credit rating upgrade by Standard & Poor’s earlier last month, which provided confidence that low borrowing costs will spur growth. So far this year, foreign investors have bought $880 million of the nation’s shares. Graph 3.25: Manufacturing PMIs in Other Asia
In Vietnam, the manufacturing economy has signalled improvements in its operating conditions for the ninth month in a row. The manufacturing PMI registered 52.5 in May, down from 53.1 in April. Growth in new orders was recorded for the sixth consecutive month in May. The rate of expansion of new orders held solid and only slightly below April’s record high. Orders for new exports rose slightly in May.
52.452.452.5
49.1
4244464850525456
Jun
12
Jul 1
2
Aug
12
Sep
12
Oct
12
Nov
12
Dec
12
Jan
13
Feb
13
Mar
13
Apr 1
3
May
13
Jun
13
Jul 1
3
Aug
13
Sep
13
Oct
13
Nov
13
Dec
13
Jan
14
Feb
14
Mar
14
Apr 1
4
May
14
Index
Indonesia Taiwan Vietnam Hong Kong
Sources: HSBC, Markit and Haver Analytics.

World Economy
OPEC Monthly Oil Market Report – June 2014 33
The political turmoil in Thailand has badly hit the economy with GDP growth at -0.6% y-o-y in the 1Q14. In terms of q-o-q, the economy shrank by 1.5%. Months of unrest have hurt Thai production and tourism. Private consumption and investment contracted by 1.5% and 2.1%, respectively, from the last quarter of 2013. The manufacturing sector in Taiwan continued showing expansionary signals last month with the manufacturing PMI at 52.4 in May, up fractionally from 52.3 in April. Output levels among manufacturers expanded at a solid rate, while new order growth eased to an eight-month low in May. Africa In South Africa, inflation quickened by 6.1% y-o-y in April, breaching the central bank’s upper limit of 6.0%. The central bank is now supposed to increase the interest rate to curb inflation, but sluggish economic growth requires moving the interest rate in the opposite direction. With more than 70,000 miners on strike since late January 2014, platinum companies have lost revenues estimated at more than $1.6 billion. Labour disputes are a major drag on South Africa’s economic growth as mining accounts for about two-thirds of exports. The sector’s growth rate decelerated in the 1Q14 to an annualized rate of 0.6% compared with the 4Q13 when it grew 3.8%. This marks the first contraction since the 2009 recession. Mining fell by an annualized 24.7%, the sharpest quarterly drop since the 2Q67. Manufacturing also dropped 4.4% over the same period. It seems that growth worries are superseding inflation concerns with South Africa’s Reserve Bank leaving the interest rate unchanged at 5.5%. The bank’s expectation of GDP growth stands at 2.1% for 2014, up from 1.9% in 2013. Manufacturing PMI in South Africa decreased to 44.30 in May 2014 from 47.40 in the previous month. The five-month strike at the country's platinum mines impacted output and new orders. Whole economy PMI also stood below 50.0 at 49.7 in May. Graph 3.26: Manufacturing PMIs in South Africa and Egypt
While the government in Egypt plans to reduce energy subsidies, a deficit in the fiscal balance remains a source of fragility and is expected to increase to 12% of GDP in 2014, up from 11.5% in the previous year. The government has reduced fuel subsidies by more than 30% in the fiscal year 2014/2015. In addition to supporting the credit rating of the country and encouraging more FDI inflows, an ensuing lower fiscal deficit could leave more room for banks to lend to the private sector’s projects. The
44.3
48.7
35
40
45
50
55
60
Jun
12
Jul 1
2
Aug
12
Sep
12
Oct
12
Nov
12
Dec
12
Jan
13
Feb
13
Mar
13
Apr
13
May
13
Jun
13
Jul 1
3
Aug
13
Sep
13
Oct
13
Nov
13
Dec
13
Jan
14
Feb
14
Mar
14
Apr
14
May
14
Index
South Africa Egypt
Sources: Investec, IPSA, Markit, Reuters Telerate and Haver Analytics.

World Economy
34 OPEC Monthly Oil Market Report – June 2014
government is also aiming at reviving the domestic manufacturing sector and supporting the current account by putting restrictions on import goods which have substitutes in the local domestic market. The performance of the non-oil producing private sector deteriorated again last month with the PMI falling to a four-month low of 48.7, from 49.5 in April, as both output and new orders showed further declines. Political stability is seen as bringing a better economic environment despite the downward risks to the economy that are expected to remain during the transition period after the presidential elections. However, a successful economic policy and implementation in the coming 12 months will bring the economy closer to achieving its huge potential. Latin America In Argentina, economic growth, hurt by a sharp fall in exports, decelerated for the second consecutive quarter to 1.4% y-o-y in the 4Q13. It is the slowest expansion in more than two years. Considering the entire 2013, the economy advanced 3.0%, up from a 0.9% expansion in 2012. The national statistics agency changed the base year for GDP calculations to 2004 from 1993. In Chile, the central bank kept the interest rate unchanged at 4.0% last month for the second straight month. This came on the back of higher inflation and lower economic growth. In April, inflation accelerated by 4.3% y-o-y, which is higher than the maximum level set by the bank at 4.0% y-o-y. This rise in inflation is mainly associated with the peso depreciation. In the past six months, the peso weakened by about 5.9% against the dollar, resulting in inflating the cost of imports. Chile’s unemployment rate jumped to 6.5% in the 1Q14, from 5.7% in the 4Q13 and up from 6.2% in the 1Q13. Graph 3.27: Mexico’s manufacturing PMI
As manufacturing exports surged and imports increased to a lesser extent, Mexico reported its third trade surplus in a row in April, the longest streak in almost two years. Mexican trade surplus narrowed to $510 million in April of 2014, from $1.026 billion in the previous month. A year earlier, the country posted a $1.227 billion deficit. Exports grew 3.7% y-o-y to $34.07 billion in April of 2014, following a 4.5% increase in the previous month. Non-oil exports increased 6.7 %. Sales of manufactured goods, which accounted for 83% of exports, increased 7.1% y-o-y, the most since September. The GDP grew 1.8% y-o-y in the 1Q14, accelerating form a 0.7% expansion in the previous quarter. Although it is the highest growth rate in five quarters, it is much below the 2011 levels. The Bank of Mexico recently cut its 2014 GDP estimates to 2.3% to 3.3% from
51.851.9
46
48
50
52
54
56
58
Jun
12
Jul 1
2
Aug
12
Sep
12
Oct
12
Nov
12
Dec
12
Jan
13
Feb
13
Mar
13
Apr 1
3
May
13
Jun
13
Jul 1
3
Aug
13
Sep
13
Oct
13
Nov
13
Dec
13
Jan
14
Feb
14
Mar
14
Apr 1
4
May
14
Index
Sources: Markit and Haver Analytics.

World Economy
OPEC Monthly Oil Market Report – June 2014 35
an earlier 3% to 4%. The manufacturing economy continued to expand in May with the manufacturing PMI at 51.9, from 51.8 in April. This marks the eighth consecutive month of growth as the expansion in production and new work have been maintained. Transition region In Poland, the manufacturing PMI survey continued to show improving business conditions in May but at a slowing pace for the third month in a row. The headline HSBC manufacturing PMI stood at 50.8 last month, the lowest in the latest 11-month series of positive readings. Companies' stock of inputs as well as purchases of inputs declined in May reflecting expectations of lower production in the future. In the Czech Republic, the manufacturing PMI jumped last month rising to 57.3 from 56.5. This marks the highest level since April 2011. The survey highlighted that the acceleration in export growth aids overall expansion in new orders received by manufacturers. The stronger increase in new work led to a further significant increase in production. The positive sentiment of rising production and new business led manufacturers to increase job creation in May. Input prices increased for the ninth month running in May, though at the slowest pace since October 2013. Graph 3.28: Manufacturing PMIs in transition region
57.3
53.9
50.8
444648505254565860
Jun
12
Jul 1
2
Aug
12
Sep
12
Oct
12
Nov
12
Dec
12
Jan
13
Feb
13
Mar
13
Apr 1
3
May
13
Jun
13
Jul 1
3
Aug
13
Sep
13
Oct
13
Nov
13
Dec
13
Jan
14
Feb
14
Mar
14
Apr 1
4
May
14
Index
Czech Republic Hungary Poland
Sources: HALPIM, HSBC, Markit and Haver Analytics.

World Economy
36 OPEC Monthly Oil Market Report – June 2014
Oil prices, US dollar and inflation As in the previous month, the US dollar in May was relatively resilient compared to its major currency counterparts on average. Interesting developments were once again observed in emerging market currencies. While the slight decline of the Chinese yuan continued, the Indian rupee slid below the important INR60/$ level for the first time in many months. Compared to the major currencies, the US dollar changed only slightly on a monthly average. Compared to the euro, the US dollar rose by 0.6% in May. It stood at a monthly average of $1.3736/€. Versus the Japanese yen, the dollar fell by 0.8% to reach ¥101.782/$. Compared to the pound sterling, the dollar fell again for the sixth consecutive month by 0.6%, while compared to the Swiss franc, it increased by 0.6%. With the ongoing recovery in the US, the tapering of the US Fed’s quantitative easing, the continued monetary stimulus from the ECB and ongoing efforts to stimulate the economy by the BOJ, and given the current slow-down in emerging markets, the US dollar should be expected to appreciate in the coming months. However, given the capital inflows into the peripheral economies of the Euro-zone and given the aim of China to diversify its currency reserves, the euro has remained unexpectedly strong so far. In nominal terms, the price of the OPEC Reference Basket (ORB) increased by a monthly average of $1.17/b, or 1.1%, from $104.27/b in April to $105.44/b in May. In real terms, after accounting for inflation and currency fluctuations, the ORB rose by 1.6%, or $0.98/b, to $62.91/b from $61.93/b (base June 2001=100). Over the same period, the US dollar rose by 0.1% against the import-weighted modified Geneva I + US dollar basket* while inflation fell by 0.4%.
* The ‘modified Geneva I+US$ basket’ includes the euro, the Japanese yen, the US dollar, the pound sterling and the Swiss franc, weighted according to the merchandise imports of OPEC Member Countries from the countries in the basket.

World Oil Demand
OPEC Monthly Oil Market Report – June 2014 37
World Oil Demand World oil demand is forecast to grow by 1.14 mb/d in 2014 — largely unchanged from the previous month’s report — to average 91.14 mb/d, despite minor adjustments in data mainly for 1Q14 and 2Q14, accounting for the most recent information. In 2013, world oil demand grew by 1.05 mb/d to average 90.01 mb/d, also in line with prior monthly data. The bulk of growth came from non-OECD regions, as most OECD regions continued to contract, though at a much lower rate than in 2012.
Table 4.1: World oil demand in 2013, mb/d
Table 4.2: World oil demand in 2014, mb/d
2012 1Q13 2Q13 3Q13 4Q13 2013 Growth %Americas 23.62 23.73 23.79 24.18 24.13 23.96 0.34 1.43 of which US 18.84 18.98 18.96 19.43 19.44 19.20 0.36 1.92Europe 13.77 13.21 13.80 13.86 13.47 13.59 -0.18 -1.33Asia Pacific 8.58 8.93 7.80 8.05 8.65 8.36 -0.23 -2.65Total OECD 45.97 45.87 45.39 46.09 46.25 45.90 -0.07 -0.16Other Asia 10.86 10.91 11.08 11.11 11.13 11.06 0.20 1.84 of which India 3.65 3.82 3.69 3.55 3.74 3.70 0.05 1.34Latin America 6.27 6.21 6.47 6.75 6.55 6.50 0.23 3.60Middle East 7.59 7.74 7.70 8.14 7.66 7.81 0.22 2.96Africa 3.47 3.58 3.58 3.43 3.62 3.55 0.08 2.41Total DCs 28.19 28.45 28.83 29.43 28.97 28.92 0.73 2.60FSU 4.41 4.34 4.18 4.57 4.81 4.48 0.06 1.42Other Europe 0.64 0.63 0.59 0.63 0.71 0.64 -0.01 -0.80China 9.74 9.79 10.19 9.91 10.38 10.07 0.33 3.38Total "Other regions" 14.80 14.75 14.95 15.11 15.90 15.18 0.39 2.61
Total world 88.96 89.08 89.17 90.63 91.12 90.01 1.05 1.18Previous estimate 88.96 89.09 89.17 90.64 91.10 90.01 1.05 1.18Revision 0.00 -0.01 -0.01 -0.01 0.03 0.00 0.00 0.00
Change 2013/12
Totals may not add up due to independent rounding.
2013 1Q14 2Q14 3Q14 4Q14 2014 Growth %Americas 23.96 23.90 23.95 24.38 24.34 24.15 0.19 0.78 of which US 19.20 19.23 19.09 19.56 19.57 19.36 0.16 0.84Europe 13.59 13.03 13.54 13.74 13.36 13.42 -0.17 -1.22Asia Pacific 8.36 8.88 7.72 7.91 8.47 8.24 -0.12 -1.39Total OECD 45.90 45.81 45.21 46.03 46.17 45.81 -0.10 -0.21Other Asia 11.06 11.10 11.28 11.37 11.39 11.29 0.23 2.05 of which India 3.70 3.85 3.76 3.68 3.86 3.79 0.09 2.37Latin America 6.50 6.42 6.71 6.99 6.79 6.73 0.23 3.57Middle East 7.81 8.06 7.98 8.48 7.95 8.12 0.31 3.92Africa 3.55 3.68 3.68 3.53 3.68 3.64 0.09 2.51Total DCs 28.92 29.27 29.65 30.37 29.81 29.77 0.85 2.95FSU 4.48 4.39 4.23 4.63 4.87 4.53 0.06 1.25Other Europe 0.64 0.63 0.57 0.62 0.72 0.63 0.00 -0.66China 10.07 10.06 10.54 10.27 10.70 10.39 0.33 3.25Total "Other regions" 15.18 15.08 15.34 15.52 16.29 15.56 0.38 2.49
Total world 90.01 90.15 90.20 91.92 92.27 91.14 1.14 1.26Previous estimate 90.01 90.19 90.21 91.92 92.25 91.15 1.14 1.27Revision 0.00 -0.04 -0.01 0.00 0.02 -0.01 -0.01 -0.01
Change 2014/13
Totals may not add up due to independent rounding.
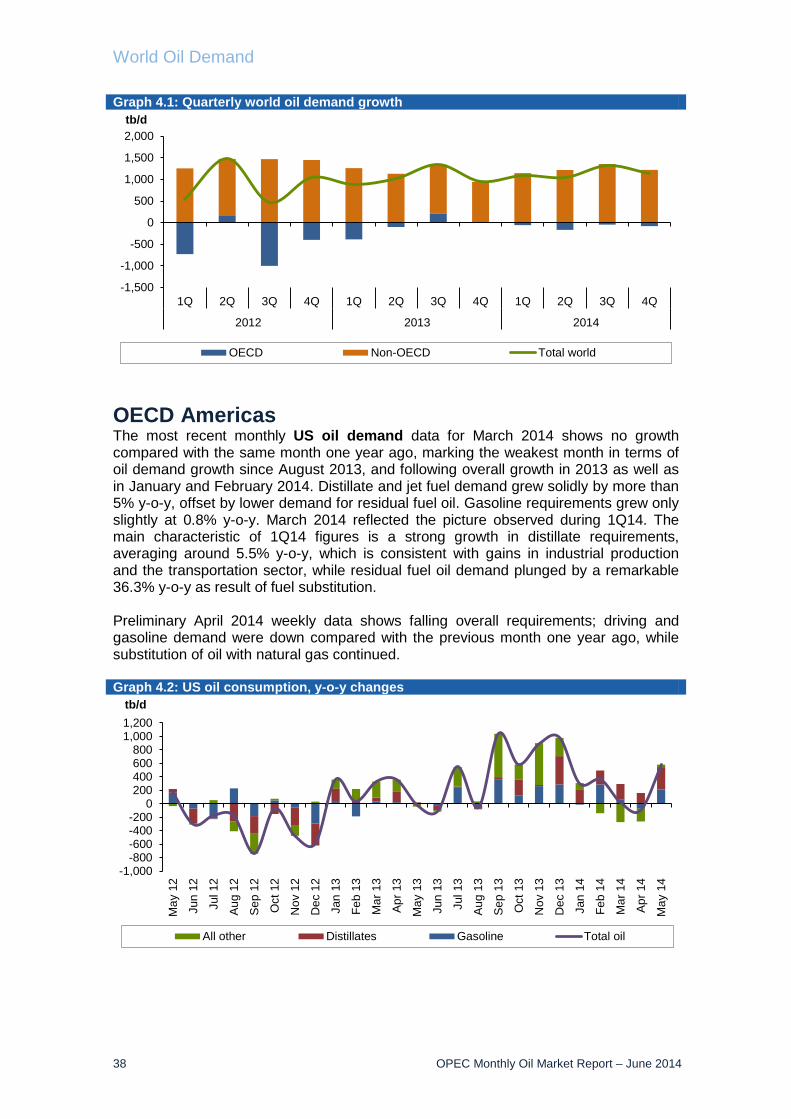
World Oil Demand
38 OPEC Monthly Oil Market Report – June 2014
Graph 4.1: Quarterly world oil demand growth
OECD Americas The most recent monthly US oil demand data for March 2014 shows no growth compared with the same month one year ago, marking the weakest month in terms of oil demand growth since August 2013, and following overall growth in 2013 as well as in January and February 2014. Distillate and jet fuel demand grew solidly by more than 5% y-o-y, offset by lower demand for residual fuel oil. Gasoline requirements grew only slightly at 0.8% y-o-y. March 2014 reflected the picture observed during 1Q14. The main characteristic of 1Q14 figures is a strong growth in distillate requirements, averaging around 5.5% y-o-y, which is consistent with gains in industrial production and the transportation sector, while residual fuel oil demand plunged by a remarkable 36.3% y-o-y as result of fuel substitution. Preliminary April 2014 weekly data shows falling overall requirements; driving and gasoline demand were down compared with the previous month one year ago, while substitution of oil with natural gas continued. Graph 4.2: US oil consumption, y-o-y changes
-1,500
-1,000
-500
0
500
1,000
1,500
2,000
1Q 2Q 3Q 4Q 1Q 2Q 3Q 4Q 1Q 2Q 3Q 4Q
2012 2013 2014
tb/d
OECD Non-OECD Total world
-1,000-800-600-400-200
0200400600800
1,0001,200
May
12
Jun
12
Jul 1
2
Aug
12
Sep
12
Oct
12
Nov
12
Dec
12
Jan
13
Feb
13
Mar
13
Apr
13
May
13
Jun
13
Jul 1
3
Aug
13
Sep
13
Oct
13
Nov
13
Dec
13
Jan
14
Feb
14
Mar
14
Apr
14
May
14
tb/d
All other Distillates Gasoline Total oil

World Oil Demand
OPEC Monthly Oil Market Report – June 2014 39
In May 2014, preliminary figures suggested overall growth of around 2.0% y-o-y; gains in gasoline and distillate demand are partly offset by losses in residual fuel requirements. While 2014 US oil demand remains strongly dependent on developments in the US economy, the risks are skewed to the upside compared with last month’s MOMR. In Mexico, April 2014 was another slow month for oil demand, characterized by falling needs for all main product categories with the exception of jet fuel, which remained flat y-o-y. The largest declines were seen in residual fuel oil, which fell a significant 46% y-o-y, in line with the country’s declining manufacturing output. Mexican oil demand is projected to fall slightly in 2014; prospects are even more skewed to the downside compared with last month’s MOMR. The latest Canadian data for March 2014 showed gains in fuel oil, jet fuel, gasoline and distillate requirements, which were more than offset by declining demand for other product categories, notably LPG. Projections for Canadian oil demand in 2014 remain unchanged from those reported one month ago. In 2013, OECD Americas’ oil demand grew by 0.34 mb/d over the previous year. In 2014, OECD Americas’ oil demand is projected to grow once more by 0.19 mb/d over a year earlier. OECD Europe The improvement of European oil demand during the second half of 2013 reversed during the first four months of 2014, despite the extremely low baseline over the last three years. Big Four total oil demand data indicated an increase of just 0.1% y-o-y in April. Gains in jet fuel and gasoline oil requirements have been offset by declining distillate and residual fuel oil requirements, partly due to the mild winter. Declines in oil demand for most countries with debt issues seemed, however, to have stabilized. March 2014 oil demand grew specifically in Spain, while decreasing slightly in Greece and Portugal y-o-y. Table 4.3: Europe Big 4* oil demand, tb/d
Factors which could possibly enhance European oil demand in the short term are improving industrial production and an auto market finally turning positive after a long period, leading to gains in April 2014 for the eighth consecutive month. Moreover, the low baseline implies more weight towards the upside. Downside risks continue to be mainly of a financial nature — unsolved debt issues in a number of countries in the region and rigorous austerity measures. Another cap is heavy taxation of European oil, especially in the transportation sector. These issues encourage a rather conservative approach as far as future projections are concerned. General expectations for the region’s oil demand during 2014 remained unchanged from the previous month’s projections and are largely connected to economic developments.
Apr 14 Apr 13 Change form Apr 13 Change form Apr 13, %LPG 432 440 -8 -1.8Gasoline 1,115 1,111 5 0.4Jet/Kerosene 776 735 41 5.6Gas/Diesel oil 3,389 3,411 -22 -0.6Fuel oil 317 333 -16 -4.9Other products 1,016 1,012 4 0.4Total 7,046 7,042 4 0.1
* Germany, France, Italy and the UK.

World Oil Demand
40 OPEC Monthly Oil Market Report – June 2014
In 2013, European oil demand shrank by 0.18 mb/d as a result of the deep economic crisis in several countries of the region, while oil demand in 2014 is projected to again decrease, but to a marginally lesser extent, by 0.17 mb/d. OECD Asia Pacific April 2014 Japanese oil demand decreased substantially by 5% y-o-y, with falling requirements in all main product categories, the only exception being jet fuel. Oil requirements in crude and fuel oil for electricity generation were also falling as a result of continuing substitution with natural gas and coal. Declining April 2014 oil demand followed increasing requirements in March 2014, mostly as a result of anticipated increases in sales tax during April 2014. Moreover, jet fuel demand was in line with increasing domestic flights compared with one year ago. The outlook risks for 2014 are skewed to the downside as a result of less optimistic economic forecasts and the potential of some of the country’s nuclear plants coming back into operation during the second half of 2014. Table 4.4: Japanese domestic sales, tb/d
In South Korea, March 2014 came up strongly y-o-y. Flourishing petrochemical activities, which called for increasing naphtha requirements, have been partly offset by declining or neutral demand for all other product categories — the largest decline was seen in fuel oil. The outlook for South Korean oil consumption during 2014 remains unchanged compared with projections from one month earlier. OECD Asia Pacific’s oil consumption in 2013 shrank by 0.23 mb/d. The downward trend will also continue in 2014, but to a smaller degree, by 0.12 mb/d. Other Asia Indian oil consumption increased in April 2014 compared with a year earlier, with oil consumption recording 89 tb/d of growth y-o-y after modest growth in March 2014 compared with the same period one year earlier. In absolute terms, total oil consumption in India stands at 3.82 mb/d, roughly the average total consumption of 1Q14. Looking at individual products, gasoil/diesel oil — which accounts for the largest portion of Indian oil demand — has been on a declining trend since mid-2013. Other products showed mixed performance, with LPG, gasoline and jet/kerosene improving, while fuel oil and other products declined, compared with the levels of one year ago.
Apr 14 Change from Apr 13 Change from Apr 13, %LPG 455 -9 -1.9Gasoline 846 -82 -8.8Naphtha 752 -13 -1.7Jet fuel 99 32 46.9Kerosene 177 -70 -28.4Gas oil 549 -11 -1.9Fuel oil 540 0 0.0Other products 59 3 5.1Direct crude burning 186 -46 -20.0Total 3,661 -196 -5.1

World Oil Demand
OPEC Monthly Oil Market Report – June 2014 41
As stated in the previous month’s MOMR, India has faced many challenges: significantly lower gas oil/diesel oil consumption was caused by the rainy season across the country; lower-than-expected sales statistics for diesel vehicles; a shift away from gas oil/diesel oil to other fuel types due to economic viability, especially by construction companies; a slowdown in economic activity accompanied by an improved power situation in the country, which, in turn, reduced the gas oil/diesel oil demand for power generation; and a higher base line for 2012. Furthermore, the country’s composite PMI index showed a slight improvement in April 2014, though remaining in contraction. The April index reading registered 49.5 compared with 48.9 a month before. Nevertheless, industrial activities in the country continued their upward momentum, pushing manufacturing output slightly higher than in previous months. This has led to a May level of 50.7 Graph 4.3: Changes in Indian oil demand, y-o-y
Taiwan’s oil consumption was flat in March 2014 according to the latest available data; product demand registered a slight increase of 3 tb/d, or nearly 0.3%, over March 2013. Total oil demand for the country stood at 0.96 mb/d for the month of March 2014. Overall, for 1Q14, the picture is more positive — growth for the period is about 40 tb/d above 1Q13, or around 4% higher. The bulk of the increase stems from diesel oil and other products, while remaining products declined at a different magnitude. Table 4.5: Indian oil demand by main products, tb/d
In Indonesia, despite improvements in 1Q14 by 73 tb/d or around 5% y-o-y, March 2014 oil demand declined marginally by around 3 tb/d. Fuel oil consumption in the country saw strong growth, both during the month of March and 1Q14, increasing by 46 tb/d and 39 tb/d, respectively. LPG, diesel oil and other products all increased m-o-m and q-o-q, while gasoline and jet/kerosene dipped marginally.
-300-200-100
0100200300400500
Apr
12
May
12
Jun
12
Jul 1
2
Aug
12
Sep
12
Oct
12
Nov
12
Dec
12
Jan
13
Feb
13
Mar
13
Apr
13
May
13
Jun
13
Jul 1
3
Aug
13
Sep
13
Oct
13
Nov
13
Dec
13
Jan
14
Feb
14
Mar
14
Apr
14
tb/d
LPG Gasoline Kerosene Diesel oil Fuel oil Other products
Apr 14 Apr 13 Change Change, %LPG 542 495 46 9.4Gasoline 428 362 66 18.2Kerosene 304 303 1 0.2Diesel oil 1,478 1,531 -54 -3.5Fuel oil 192 210 -18 -8.7Other products 878 830 48 5.8Total oil demand 3,821 3,732 89 2.4

World Oil Demand
42 OPEC Monthly Oil Market Report – June 2014
Other Asia’s oil demand is expected to grow at a rate of 0.23 mb/d in 2014, unchanged from the previous month’s projections. Latin America Total oil consumption in Latin America is estimated to reach 6.73 mb/d in 2014, growing by around 0.23 mb/d from year-ago levels. These estimations remain unchanged from the previous month’s MOMR, supported by growth in the largest consuming nation of the region, Brazil. In 1Q14, Brazil’s oil demand grew by 0.14 tb/d, or more than 6%, compared with the same quarter a year earlier. All product categories registered average-to-strong gains, with the exception of fuel oil. Transportation fuels, namely gasoline and ethanol are increasing the most, accelerating by more than 9% and 18%, respectively, hinting at improvement in the transportation sector ahead of the summer World Cup event. Consumption of diesel — which gained nearly 40 tb/d, or more than 4% — is seeing support for the same reason. Projections for gasoil demand should remain relatively healthy throughout 2Q14. Overall oil demand in Brazil is expected to remain on track with initial projections, mainly because of the World Cup event in June, which is expected to provide support to overall oil consumption in the country. Demand is anticipated to moderate thereafter, as the Brazilian economy is generally expected to grow by around 2%, hence oil demand growth is expected to reach 0.14 mb/d, relatively unchanged from the previous month’s MOMR. Table 4.6: Brazilian inland deliveries, tb/d
Gasoline consumption in Argentina, the third-largest oil consumer in the region with expected total consumption of 0.62 mb/d in February 2014, registered a rise over figures from the same period one year ago. Fuel oil, other products, jet/kerosene and gasoline have been the product categories most in demand, while LPG and diesel oil fell. Growth was 15 tb/d, or more than 2%, higher than over the same period in 2013. Latin American oil demand growth in 2013 is estimated at 0.23 mb/d. During 2014, Latin American oil demand is forecast to increase at the same level of about 0.23 mb/d.
Mar 14 Mar 13 Change Change, %LPG 218 211 8 3.6Gasoline 726 682 44 6.4Jet/Kerosene 124 123 1 0.4Diesel 972 951 21 2.2Fuel oil 101 93 9 9.4Alcohol 186 166 19 11.6Total 2,327 2,226 101 4.5

World Oil Demand
OPEC Monthly Oil Market Report – June 2014 43
Middle East In the Middle East, oil consumption is expected to grow steadily, rising by 0.31 mb/d y-o-y in 2014. In Saudi Arabia, the largest consumer and contributor to oil demand growth in the region, April 2014 showed substantially higher growth than the same period of 2013. Fuel oil and direct crude burning increased, possibly as a result of fuel burning for newly commissioned desalination projects requiring additional power. Demand for the two products increased by 181 tb/d and 105 tb/d, respectively. Additionally, jet/kerosene increased y-o-y by more than 25%, possibly due to inventory builds ahead of the holy month of Ramadan. LPG and gasoline growth, on the other hand, declined compared with the same period one year earlier. Total oil consumption in the Kingdom reached 2.35 mb/d in April 2014, compared with 2.06 mb/d in April 2013. Graph 4.4: Oil demand growth in the Middle East, y-o-y
In 2013, Middle East oil demand grew by 0.23 mb/d; while oil demand during 2014 is expected to rise by around 0.30 mb/d. China According to preliminary calculations, China’s oil demand growth improved in April 2014 from a month earlier to stand at 10.46 mb/d. Product performance has also been on the rise on a y-o-y basis, with all products recording positive growth with the exception of fuel oil. Gasoline and LPG grew the most — 16% y-o-y. In April 2014, private vehicle sales improved by around 12% y-o-y, with a total of 1.6 million vehicles being sold, supporting gasoline demand in the country. Gasoline demand, in absolute terms, grew steadily from 1.96 mb/d in January 2012 to 2.40 mb/d in April 2014, with an average monthly growth of 10%. On the other hand, gasoil — which is the most consumed product in China, accounting for around 30% of total product consumption — lacked direction. In fact, the product fell from January 2012 levels of 3.54 mb/d to around 3.39 mb/d in April 2014, despite periods of higher total consumption towards the end of 2013. Gasoil growth in China is reliant on the country’s industrial output and export levels. In percentage terms, and on a monthly average basis, the product averaged a slight 1% in monthly growth compared with the previous year. Gasoil/diesel-fueled vehicles are rather uncommon in China, as the government discourages gasoil/diesel use for private vehicles.
-50
0
50
100
150
200
250
300
350
-50
0
50
100
150
200
250
300
350
1Q12 2Q12 3Q12 4Q12 1Q13 2Q13 3Q13 4Q13 1Q14
tb/dtb/d
Saudi Arabia Iran, I.R. Kuwait UAE Others

World Oil Demand
44 OPEC Monthly Oil Market Report – June 2014
Graph 4.5: Chinese gasoil and gasoline demand growth, y-o-y
Decelerating industrial activity has also added to slower gasoil/diesel growth in the country in recent months, with China’s PMI index remaining under the 50-point threshold which separates expansion from contraction for the third consecutive month. LPG, on the other hand, continued to grow at a fast pace despite the economic slowdown. This is due to developments in the LPG processing industry, as more LPG products are used as feedstock by the petrochemical sector. The share of LPG in the petrochemical industry is expected to grow further. Graph 4.6: Changes in Chinese apparent oil demand, y-o-y changes
In 2013, China’s oil demand grew by 0.33 mb/d, while the country’s oil consumption estimates for 2014 remained unchanged from the previous month at 0.33 mb/d.
-15-10
-505
10152025
Apr
12
May
12
Jun
12
Jul 1
2
Aug
12
Sep
12
Oct
12
Nov
12
Dec
12
Jan
13
Feb
13
Mar
13
Apr
13
May
13
Jun
13
Jul 1
3
Aug
13
Sep
13
Oct
13
Nov
13
Dec
13
Jan
14
Feb
14
Mar
14
Apr
14
%
Gasoline Gasoil
-600
-400
-200
0
200
400
600
800
1,000
-600
-400
-200
0
200
400
600
800
1,000
Jan Feb Mar Apr May Jun Jul Aug Sep Oct Nov Dec
tb/dtb/d
Historical range 2011 2012 2013 2014

World Oil Supply
OPEC Monthly Oil Market Report – June 2014 45
World Oil Supply Non-OPEC oil supply is estimated to have averaged 54.20 mb/d in 2013, an increase of 1.35 mb/d over a year earlier and unchanged from the previous Monthly Oil Market Report (MOMR). OECD Americas was the main driver for growth in 2013. Non-OPEC oil supply is projected to grow by 1.44 mb/d in 2014 ‒ up by 60 tb/d from the previous assessment ‒ to average 55.64 mb/d. OPEC NGLs and non-conventional liquids grew by 90 tb/d to average 5.66 mb/d in 2013 and are forecast to grow by 0.15 mb/d to average 5.81 mb/d in 2014. In May 2014, OPEC crude oil production increased by 142 tb/d to average 29.76 mb/d, according to secondary sources. As a result, preliminary data indicates that global oil supply increased by 0.45 mb/d in May to average 91.25 mb/d. Non-OPEC supply Non-OPEC oil production in 2013 is estimated to have averaged 54.20 mb/d, which includes 2.15 mb/d in processing gains, indicating an increase of 1.35 mb/d over the previous year, unchanged from the previous MOMR. Among non-OPEC countries, OECD supply grew by 1.06 mb/d in 2013 over the previous year. This was supported by an increase in US oil supply ‒ estimated at 1.14 mb/d ‒ the highest among all non-OPEC countries. Canada’s oil supply experienced healthy growth of 0.23 mb/d in 2013, while supply from other OECD countries declined. On a quarterly basis, non-OPEC supply in 2013 is estimated to have averaged 53.74 mb/d, 52.66 mb/d, 54.14 mb/d and 55.27 mb/d, respectively. Graph 5.1: Regional non-OPEC supply growth, y-o-y
Non-OPEC supply growth in 2013 of 1.35 mb/d was much higher than the average experienced during the last five and ten years of approximately half a million barrels per day. The main driver of output growth was OECD Americas, which increased by 1.35 mb/d in 2013 compared with the previous year. Estimated growth achieved in OECD Americas’ 2013 supply is the highest on record; the second-highest growth was recorded in 2012. The US increase of 1.14 mb/d in 2013 drove non-OPEC supply growth as did the strongest growth from Canada seen since 1979. Tight oil and oil sand developments drove growth in 2013 as they did a year ago in OECD Americas. Outside OECD Americas, growth in 2013 came from the former Soviet Union (FSU), Latin America, Africa and China, but this was relatively low compared with the output
-0.5
0.0
0.5
1.0
1.5
-0.5
0.0
0.5
1.0
1.5
OECDAmerica
OECDEurope
OECD AsiaPacific
OtherAsia
LatinAmerica
Middle East Africa FSU
mb/dmb/d
12/11 13/12 14/13

World Oil Supply
46 OPEC Monthly Oil Market Report – June 2014
increase realized from OECD Americas. Other regions ‒ including OECD Europe, OECD Asia Pacific, Other Asia and the Middle East ‒ experienced supply declines in 2013, while Other Europe’s production remained steady. OECD Europe’s production decreased by 0.20 mb/d in 2013 from the previous year as output declined from all major producers in the region on unplanned shutdowns, maintenance and decline from mature areas. OECD Asia Pacific’s oil production dropped 90 tb/d in 2013 as Australia’s oil supply suffered from limited new additions and severe weather conditions. The oil output in Other Asia dropped by 80 tb/d ‒ mainly in Indonesia ‒ to average 3.57 mb/d in 2013. Middle East production decreased by 0.11 mb/d in 2013, on the back of political issues in Syria and Yemen. On a country basis, the US, Canada, Russia, the Sudans, China and Colombia experienced healthy supply growth in 2013, while the UK, Syria, Norway and Australia encountered significant declines. Tight oil and oil sand developments were the main factors supporting growth in 2013, while political, technical and weather factors had a strong impact on non-OPEC output. Table 5.1: Non-OPEC oil supply in 2013, mb/d
Forecast for 2014 Non-OPEC supply is forecast to average 55.64 mb/d in 2014, representing growth of 1.44 mb/d over the previous year and indicating an upward revision by 60 tb/d from the previous MOMR. Updates on actual production data in the first and early part of the second quarter. An upward revision was seen for supply estimates on a quarterly basis, averaging 55.56 mb/d, 55.14 mb/d, 55.46 mb/d and 56.41 mb/d, respectively. OECD’s oil supply forecast for all quarters of 2014 and developing countries’ supply projections ‒ except for the first quarter ‒ have been revised up. The first quarter’s supply forecast has been revised up by 30 tb/d, mainly due to developments in the OECD. It is worth highlighting that associated risks and uncertainties in the forecast are
Change2012 1Q13 2Q13 3Q13 4Q13 2013 13/12
Americas 16.74 17.63 17.60 18.29 18.81 18.08 1.35 of which US 10.03 10.61 10.93 11.38 11.76 11.18 1.14Europe 3.77 3.63 3.58 3.46 3.62 3.57 -0.20Asia Pacific 0.56 0.45 0.50 0.51 0.45 0.48 -0.09Total OECD 21.07 21.71 21.67 22.26 22.88 22.14 1.06
Other Asia 3.65 3.68 3.60 3.48 3.52 3.57 -0.08Latin America 4.68 4.73 4.76 4.80 4.84 4.78 0.10Middle East 1.47 1.40 1.32 1.36 1.35 1.36 -0.11Africa 2.31 2.29 2.40 2.44 2.53 2.42 0.11Total DCs 12.11 12.11 12.08 12.09 12.24 12.13 0.02
FSU 13.26 13.40 13.34 13.34 13.55 13.41 0.15 of which Russia 10.37 10.45 10.47 10.49 10.61 10.51 0.13Other Europe 0.14 0.14 0.14 0.14 0.14 0.14 0.00China 4.15 4.23 4.27 4.15 4.30 4.24 0.08Total "Other regions" 17.55 17.77 17.75 17.63 17.99 17.78 0.23Total Non-OPEC production 50.74 51.58 51.50 51.98 53.11 52.05 1.31Processing gains 2.12 2.15 2.15 2.15 2.15 2.15 0.04
Total Non-OPEC supply 52.86 53.74 53.66 54.14 55.27 54.20 1.35Previous estimate 52.86 53.74 53.66 54.14 55.27 54.20 1.35Revision 0.00 0.00 0.00 0.00 0.00 0.00 0.00

World Oil Supply
OPEC Monthly Oil Market Report – June 2014 47
on the high side given the current global market situation, as well as other factors influencing supply. Political, technical, environmental and weather issues are expected to be the main risk factors for non-OPEC supply in 2014. According to preliminary data, non-OPEC supply increased by 1.82 mb/d in 1Q13 compared with the same period a year earlier. Table 5.2: Non-OPEC oil supply in 2014, mb/d
OECD Total OECD supply is expected to average 23.18 mb/d in 2014, representing an increase of 1.04 mb/d from a year earlier and an upward revision of 60 tb/d from the previous month. Anticipated OECD average supply for 2014 is at its highest since 2003. The upward revision came on the back of a re-evaluation of individual countries’ supply profiles, as well as updated production figures in 1Q14 and the early part of the second quarter, which is partly carried over to the next quarters. Upward revisions in OECD Americas are concentrated mainly in the US, while OECD Europe and OECD Asia Pacific’s supply projection remains unchanged from the previous MOMR. The OECD forecast remains the main driver of growth in 2014, as an anticipated increase in OECD Americas is projected to more than offset the supply decline forecast in OECD Europe and OECD Asia Pacific. Yet risks and uncertainties remain high ‒ especially in OECD Americas ‒ and tight oil production challenges over the coming period require careful monitoring. On a quarterly basis, OECD liquids production is forecast to average 23.26 mb/d, 22.80 mb/d, 23.00 mb/d and 23.64 mb/d, respectively. According to preliminary data, OECD oil production increased by 1.55 mb/d in 1Q14 compared with the same period a year earlier.
Change2013 1Q14 2Q14 3Q14 4Q14 2014 14/13
Americas 18.08 19.06 18.81 19.20 19.66 19.18 1.10 of which US 11.18 11.98 11.86 12.16 12.51 12.13 0.95Europe 3.57 3.71 3.46 3.30 3.50 3.49 -0.08Asia Pacific 0.48 0.50 0.53 0.51 0.49 0.50 0.03Total OECD 22.14 23.26 22.80 23.00 23.64 23.18 1.04
Other Asia 3.57 3.56 3.55 3.56 3.54 3.55 -0.02Latin America 4.78 4.85 4.90 4.96 5.09 4.95 0.17Middle East 1.36 1.32 1.36 1.37 1.37 1.35 0.00Africa 2.42 2.52 2.51 2.51 2.51 2.51 0.09Total DCs 12.13 12.24 12.32 12.39 12.51 12.37 0.24
FSU 13.41 13.50 13.45 13.47 13.61 13.51 0.10 of which Russia 10.51 10.59 10.54 10.56 10.69 10.60 0.09Other Europe 0.14 0.14 0.14 0.14 0.14 0.14 0.00China 4.24 4.24 4.25 4.27 4.32 4.27 0.03Total "Other regions" 17.78 17.88 17.85 17.88 18.08 17.92 0.14Total Non-OPEC production 52.05 53.38 52.96 53.28 54.23 53.47 1.42Processing gains 2.15 2.18 2.18 2.18 2.18 2.18 0.02
Total Non-OPEC supply 54.20 55.56 55.14 55.46 56.41 55.64 1.44Previous estimate 54.20 55.54 55.07 55.39 56.34 55.58 1.38Revision 0.00 0.03 0.07 0.07 0.07 0.06 0.06

World Oil Supply
48 OPEC Monthly Oil Market Report – June 2014
Graph 5.2: OECD’s quarterly production Graph 5.3: OECD’s quarterly production, annual comparison
OECD Americas Oil supply from OECD Americas is projected to increase by 1.10 mb/d to average 19.18 mb/d in 2014, indicating an upward revision of 60 tb/d from the previous month. The current forecast for average supply for 2014 is the highest on record. Anticipated growth in OECD Americas is seen to be supported by the US and Canada, while Mexico is likely to experience a decline. On a quarterly basis, OECD Americas’ oil supply in 2014 is forecast to stand at 19.06 mb/d, 18.81 mb/d, 19.20 mb/d and 19.66 mb/d, respectively. During 1Q14, OECD Americas’ supply increased by 1.43 mb/d compared with the same period a year earlier, as per preliminary data. US US oil production is expected to average 12.13 mb/d in 2014, representing growth of 0.95 mb/d over a year ago and following an upward revision of 60 tb/d from the previous report. The current forecast for US supply is the highest since 1973. An upward revision impacted all quarters’ outputs due to adjustments to actual March production figures. US supply growth in 2014 is the highest among all non-OPEC countries and is expected to be a strong contributor to total non-OPEC supply growth. The forecast is supported by strong growth from tight oil developments, mainly in Texas and North Dakota. Texas oil output averaged 2.92 mb/d in 1Q14, an increase of 0.58 mb/d compared with the same period a year ago, according to preliminary data. This growth is supported by an increase in tight oil output, mainly from Eagle Ford, but at a lower growth rate, where production reached 1.33 mb/d in March 2014, 2.36% higher than the previous month. Moreover, North Dakota oil production averaged 0.95 mb/d, an increase of 0.19 mb/d in 1Q14, compared with the same quarter a year earlier. This increase is supported by developments in the Bakken area, where production passed 1 mb/d in March 2014, more than 23% up from the same month a year earlier. Both Bakken and Eagle Ford saw slowing production growth, with Eagle Ford slowing faster. These trends strongly emphasize that despite the continued yearly US increase in tight oil production, the supply risk for the coming years remains high.
19
20
21
22
23
241Q
112Q
113Q
114Q
111Q
122Q
123Q
124Q
121Q
132Q
133Q
134Q
131Q
142Q
143Q
144Q
14
mb/d
19
20
21
22
23
24
1Q 2Q 3Q 4Q
mb/d
2011 20122013 2014

World Oil Supply
OPEC Monthly Oil Market Report – June 2014 49
On a quarterly basis, US oil production is seen to average 11.98 mb/d, 11.86 mb/d, 12.16 mb/d, and 12.51 mb/d, respectively. Graph 5.4: US quarterly production Graph 5.5: US quarterly production,
annual comparison
Canada and Mexico Canada’s oil supply is forecast to increase by 0.20 mb/d to average 4.21 mb/d in 2014, showing no change from the previous MOMR. Expected production in 2014 is the highest on record. Canada’s oil supply continued to achieve the second-highest growth in 2014 among all non-OPEC countries, as it has in recent years. This is supported by a projected increase from the oil sands as well as tight oil production. On a quarterly basis, Canada’s production is seen to average 4.20 mb/d, 4.12 mb/d, 4.20 mb/d and 4.31 mb/d, respectively. Mexico’s oil supply is projected to decline by 50 tb/d in 2014 to average 2.84 mb/d, unchanged from the previous assessment. Under an energy overhaul passed one year ago by Congress, the Pemex company will face competition from private and foreign companies which will be allowed back into the oil and gas sector for the first time in 76 years. Despite greatly increased annual investment budgets, including $27.7 billion planned for this year, Pemex has been unable to raise its crude oil output from around 2.5 mb/d in recent years as its easily extracted oil is running out and it is tackling more complex and expensive-to-produce reserves. Oil output is expected to rise to 3 mb/d by 2018 due to the rule allowing foreign companies to join in Mexico’s energy industry and invest. Crude oil production fell to 2.47 mb/d through to 30 March as output at the company’s largest Ku-Maloob-Zapp and Cantarell fields dropped from the previous month. Oil production in April and most probably in May is expected to have dropped by 10 tb/d to 20 tb/d to average 2.86 mb/d and 2.85 mb/d, respectively. This decline came about as Marin’s production showed low performance. Supply is expected to remain relatively declining in 2014, though production stabilization efforts seem to be having positive results. However, risks and uncertainties remain high, especially related to natural declines. During the first five months of 2014, Mexico’s oil supply fell by around 40 tb/d from the same period a year ago.
8
9
10
11
12
13
1Q11
2Q11
3Q11
4Q11
1Q12
2Q12
3Q12
4Q12
1Q13
2Q13
3Q13
4Q13
1Q14
2Q14
3Q14
4Q14
mb/d
8
9
10
11
12
13
1Q 2Q 3Q 4Q
mb/d
2011 20122013 2014

World Oil Supply
50 OPEC Monthly Oil Market Report – June 2014
On a quarterly basis, it is expected to average 2.87 mb/d, 2.82 mb/d, 2.84 mb/d and 2.83 mb/d, respectively. OECD Europe OECD Europe’s total oil supply is seen to average 3.49 mb/d in 2014, representing a decline of 80 tb/d from 2013, unchanged from last month. It is expected that Norway, the UK, Denmark and other OECD Europe countries will show a decline in production in 2014. The region’s oil supply is expected to experience the largest decline among all non-OPEC regions. On a quarterly basis, OECD Europe’s supply in 2014 is seen to average 3.71 mb/d, 3.46 mb/d, 3.30 mb/d and 3.50 mb/d, respectively. Norway’s oil production is expected to drop by 10 tb/d to average 1.83 mb/d in 2014, indicating an upward revision of 10 tb/d from the previous month’s assessment. It seems that higher investment in 2013 in the Norwegian oil and gas industries could improve production levels and reduce the increasing decline rate. According to Norwegian investment plans, the country invested approximately $35 billion in 2013 and is planning to continue with the same amount of investment annually into 2018. Across 1Q14, liquids production was up y-o-y by 100 tb/d, the highest in 13 years. Several large discoveries made in recent years are also expected to come on stream in upcoming years. Preliminary production figures for April 2014 indicate an average daily production of about 1.92 mb/d of oil, NGL and condensate. This is 30 tb/d (1.5%) less than in March 2014. Average daily liquid production in April was recorded to be 1.53 mb/d of oil, 0.32 mb/d of NGL, and 77 tb/d of condensate. Oil production is 4% above the Norwegian Petroleum Directorate’s (NPD) prognosis for April and 2% above oil production for April a year ago. The Skuld field saw reduced production in April due to technical problems. On a quarterly basis, supply is anticipated to average 1.95 mb/d, 1.79 mb/d, 1.71 mb/d and 1.86 mb/d, respectively. During the first five months of 2014, Norway’s oil production averaged 1.92 mb/d, an increase of 40 tb/d ,or 2.1%, compared with the same period a year earlier, according to preliminary data. The UK’s oil supply is anticipated to average 0.84 mb/d in 2014, representing a drop of 30 tb/d from 2013, unchanged from the previous month. In 1Q13 and 2Q13, production at five new offshore oil fields ‒ Cormorant, Huntington, Tonto, Balloch and Fionn ‒ came on stream, and two new offshore condensate fields ‒ Rochelle and Jasmine ‒, started production in 4Q13. However, no new oil or condensate startups are expected in 2014, thus output may be more affected by declines from brown fields, though increasing oil production in 1Q14 by 20 tb/d compared with 1Q13 may lead to a lower decline in total production for 2014. On a quarterly basis, supply is expected to stand at 0.95 mb/d, 0.87 mb/d, 0.75 mb/d, and 0.81 mb/d, respectively. According to preliminary data, UK oil production averaged 0.93 mb/d during the first five months of 2014, an increase of 10 tb/d, or 1.1%, compared with the same period a year earlier.

World Oil Supply
OPEC Monthly Oil Market Report – June 2014 51
OECD Asia Pacific OECD Asia Pacific’s oil production is forecast to average 0.50 mb/d in 2014, an increase of 30 tb/d over 2013, unchanged from a month ago. Oil production in Australia and New Zealand is expected to rise in 2014. On a quarterly basis, OECD Pacific’s oil supply is seen to average 0.41 mb/d, 0.46 mb/d, 0.44 mb/d and 0.42 mb/d, respectively. Australia’s oil supply is expected to average 0.43 mb/d in 2014, an increase of 30 tb/d from a year ago, unchanged from the previous MOMR. However, some minor revisions occurred for 1Q14 on the back of updated actual production data, which were partly carried over to the rest of the year. Compared with 1Q13, oil output increased mainly from Vincent, Montara, the Pyrenees, Fletcher Finucane and the Cooper Basin. Condensate production decreased by 6% in 1Q14 compared with 1Q13. According to preliminary data, Australian oil production averaged 0.41 mb/d during 1Q14, an increase of 40 tb/d compared with the same period a year ago. Severe weather conditions impacted production in 2013. However, output is expected to gradually increase for the rest of 2014, supported by new volume, with incremental production mainly coming from Vincent, Montara, the Pyrenees, North West Shelf (NWS), Fletcher and the Cooper Basin. On the other hand, output from Van Gogh and Laminaria is expected to drop. On a quarterly basis, Australian supply is seen to average 0.41 mb/d, 0.46 mb/d, 0.44 mb/d and 0.42 mb/d, respectively in 2014. Developing countries Developing countries’ (DC) total oil supply is projected to increase by 0.24 mb/d over 2013 to average 12.37 mb/d in 2014, showing an upward revision of 10 tb/d from the previous month. Upward revisions have affected all quarters of 2014. Anticipated growth is driven mainly by supplies from Latin America and Africa, while Middle East supply is seen to be steady and Other Asia’s is expected to decline. On a quarterly basis, DCs’ total oil production is seen to stand at 12.24 mb/d, 12.32 mb/d, 12.39 mb/d and 12.51 mb/d, respectively. During the last five months, preliminary data indicated DC’s oil supply increased by 0.14 mb/d compared with the same period in 2013. Graph 5.6: Developing Countries’ quarterly production
Graph 5.7: Developing Countries’ quarterly production, annual comparison
11.8
12.0
12.2
12.4
12.6
12.8
13.0
1Q11
2Q11
3Q11
4Q11
1Q12
2Q12
3Q12
4Q12
1Q13
2Q13
3Q13
4Q13
1Q14
2Q14
3Q14
4Q14
mb/d
11.8
12.0
12.2
12.4
12.6
12.8
13.0
1Q 2Q 3Q 4Q
mb/d
2011 20122013 2014

World Oil Supply
52 OPEC Monthly Oil Market Report – June 2014
Other Asia Other Asia’s oil supply is expected to decrease by 20 tb/d in 2014 to average 3.55 mb/d, indicating an upward revision by 10 tb/d from the previous assessment. This revision came on the back of growth in Brunei in 1Q14 that could offset Malaysia’S 1Q downward revision in Malaysia. Meanwhile, Malaysia’s oil supply is expected to increase in 2014, while that of other countries in this region will decline, except Vietnam, where it will remain steady. On a quarterly basis, Other Asia’s supply is expected to stand at 3.56 mb/d, 3.55 mb/d, 3.6 mb/d and 3.54 mb/d, respectively. Preliminary data suggests that Other Asia’s supply decreased by 20 tb/d during 1Q14 compared with the same period a year earlier. An upward revision by 15 tb/d in 1Q14 was made to Brunei’s oil output to average 0.14 mb/d in 1Q14. This revision is in line with a recent government decision to increase investment in the oil and gas industries in Brunei Darussalam, and aims to boost production levels from the current 0.37 tboe/d ‒ roughly 40% oil and 60% gas ‒ to 0.43 tboe/d by 2017. By applying this revision in 1Q14 and carrying it over to other quarters, output is expected to remain steady in all quarters at 0.14 mb/d in 2014. Malaysia’s oil production is expected to average 0.67 mb/d in 2014, indicating an increase of 20 tb/d compared with last year, the largest growth in the region. Vietnam’s oil production is forecast to remain stagnant in 2014, averaging 0.38 mb/d. Steady output is supported by healthy production brought online last year. It is forecast that Indonesia’s oil supply in 2014 could see a lower decline by 10 tb/d compared with declines of 50 tb/d in 2013. This is expected on the back of aging fields and natural declines, coupled with limited new developments. There was no revision to oil output compared with the previous MOMR, and Indonesian liquids production is expected to average 0.93 mb/d in 2014. India’s oil production is expected to experience a decline of 10 tb/d in 2014, as it did the previous year, to average 0.86 mb/d, unchanged from the previous MOMR. Production is also expected to keep steady at 0.86 mb/d on a quarterly basis in 2014. Oil production from Thailand is forecast to decline by 20 tb/d to average 0.35 mb/d in 2014, following an increase of 10 tb/d in 2013. Other Asia others is also expected to decline by 10 tb/d to average 0.21 mb/d in 2014. Latin America Latin America is anticipated to increase by 0.17 mb/d over 2013 to average 4.95 mb/d in 2014, unchanged from the previous MOMR. Latin America’s current expected growth rate is second highest among all non-OPEC regions after OECD Americas. On a quarterly basis, Latin American supply is seen to stand at 4.85 mb/d, 4.90 mb/d, 4.96 mb/d and 5.09 mb/d, respectively. Argentina’s oil supply is expected to average 0.67 mb/d in 2014; no annual growth is expected for this year compared with the previous year, and numbers are unchanged from the last MOMR. However, Argentina's state-controlled energy company YPF said it sees crude oil production increasing by 5% this year after reporting stronger-than-

World Oil Supply
OPEC Monthly Oil Market Report – June 2014 53
expected first-quarter results. Reports this year indicate that ongoing shale developments are seen to support output due to acquisitions and new unconventional production at the country’s vast Patagonian shale oil and gas formation Vaca Muerta. YPF anticipates significant production will come on stream from unconventional shale resources this year; the production of hydrocarbons rose 10.7% in 1Q14 to 0.53 mboe/d. It is forecast that liquids production in 2H14 will grow by 10 tb/d more than in 1H14 to average 0.67 mb/d. Colombia’s production is expected to increase by 20 tb/d in 2014 to average 1.05 mb/d, unchanged from the previous assessment. Colombia’s oil supply in May increased by 70 tb/d to average 1.03 mb/d compared with the previous month. Brazil’s oil supply is projected to increase by 0.15 mb/d over 2013 to average 2.80 mb/d in 2014, unchanged from the previous MOMR. Actual production data in April averaged 2.79 mb/d, an increase of 40 tb/d from the previous month and 240 tb/d compared with the same month a year earlier. New record-high production has been recorded in the pre-salt fields. In March, the monthly oil production from fields located in the Santos and Campos Basin pre-salt area averaged 0.4 mb/d, up 2.4% from the previous record, set in February at 0.38 mb/d. Petrobras announced a new daily record on 18 April of 444 tb/d. An important contribution to this was production coming from the first well connected to a Riser Support Buoy (RSB) in the Sapinhoá field, which went on stream in February. This well has been attaining above-average performance and is the best production well in Brazil, with an output of approximately 36 tb/d. The second RSB well was connected in early April and is producing 31 tb/d. In addition to the Sapinhoá field RSB, two other RSBs have already been deployed and the last RSB is scheduled for deployment before the end of the first half of the year. These deployments will enable continued pre-salt production growth, with the connection of seven new production wells to Floating Production Storage and Offloading (FPSOs) Cidade de São Paulo and Cidade de Paraty. As a result, these units' top production and processing capacity will be reached by the third quarter of 2014. On a quarterly basis, Brazil’s production is expected to stand at 2.70 mb/d, 2.74 mb/d, 2.84 mb/d and 2.90 mb/d, respectively. Middle East Middle East oil production is estimated to average 1.35 mb/d in 2014, unchanged from 2013, and at the same level as in the previous month. On a quarterly basis, Middle East supply is forecast to average 1.32 mb/d, 1.36 mb/d, 1.37 mb/d, and 1.37 mb/d, respectively. Syria’s oil production is expected to decline by 30 tb/d in 2014 to average 30 tb/d on the back of political issues. Oil production in 1Q14 declined by 0.4 mb/d to only 20 tb/d compared with 1Q13 due to Syria’s civil war and the resulting oil disruption. Oil production in Yemen in 1Q14 averaged 0.12 mb/d, down by 0.17 mb/d compared with 1Q11, because of continuous rebel attacks on oil pipelines. However, oil production in Yemen is expected to increase by 40 tb/d to average 0.16 mb/d in 2Q14 and production should be steady up to the end of the year. Oman ‒ the biggest non-OPEC oil producer in the Middle East ‒ is expected to increase production by 30 tb/d in 2014 to average 0.97 mb/d, unchanged from the

World Oil Supply
54 OPEC Monthly Oil Market Report – June 2014
previous assessment. Preliminary data indicates that oil output in the country increased by 50 tb/d to average 0.96 mb/d in May compared with April. On a quarterly basis, its expected oil output stands at 0.95 mb/d, 0.97 mb/d, 0.97 mb/d and 0.98 mb/d, respectively. Africa Africa’s oil supply is forecast to average 2.51 mb/d in 2014, an increase of 90 tb/d from 2013, and flat from the previous MOMR. However, a minor downward revision was made for 1Q14 output on the back of a downward revision by 12 tb/d in Africa Other’s oil production. On a quarterly basis, Africa’s supply is expected to average 2.52 mb/d, 2.51 mb/d, 2.51 mb/d and 2.51 mb/d, respectively. Oil production in Chad and South Africa are expected to remain steady in 2014, averaging 0.13 mb/d and 0.18 mb/d, respectively. Congo’s oil production and Gabon’s output are forecast to decline by 10 tb/d each to average 0.25 mb/d and 0.22 mb/d, respectively. It is expected that oil production in Egypt will decline by 30 tb/d to average 0.69 mb/d in 2014. On the other hand, oil output in Africa Others will increase by 30 tb/d to average 0.37 mb/d. Equatorial Guinea’s oil supply is seen to increase by 10 tb/d to average 0.33 mb/d in 2014. South Sudan and Sudan’s oil production is expected to increase by 0.11 b/d in 2014 and average 0.34 mb/d, steady from the previous assessment. As the conflict between South Sudan’s government and the rebels winds down, healthy production is gradually returning on stream, particularly in South Sudan. Oil output in the Sudans before separation averaged 0.45 mb/d in 1Q11. FSU, other regions Total oil supply for the FSU is projected to average 13.51 mb/d in 2014, representing growth of 0.10 mb/d over 2013, unchanged from the previous month. In terms of growth, FSU will be the region with the third-highest growth after OECD Americas and Latin America. Expected growth in 2014 supply is supported by Russia and other FSU countries with the exception of Kazakhstan, while Azerbaijan is seen to stand steady. On a quarterly basis, total supply from the FSU is expected to stand at 13.50 mb/d, 13.45 mb/d, 13.47 mb/d and 13.61 mb/d, respectively. Other Europe’s supply is seen to remain steady in 2014 and average 0.14 mb/d. China’s oil supply is forecast to increase by 30 tb/d over the previous year to average 4.27 mb/d in 2014. Russia Russia’s oil supply is projected to average 10.60 mb/d in 2014, an increase of around 0.1 mb/d over 2013, unchanged from the previous month’s report and the highest since 1989. Russia’s oil supply in January ‒ May grew by 100 tb/d compared with the same period in 2013. Russia’s oil supply in May, as per preliminary data, reached the lowest level so far in 2014 of 10.54 mb/d, stagnant from the previous month. However, it is higher by 70 tb/d than the same month a year earlier. Russian oil production maintained a healthy level, supported by the ramp-up of the Vankor project and stabilization of mature producing areas. On a quarterly basis, Russia’s supply is estimated at 10.59 mb/d, 10.54 mb/d, 10.56 mb/d and 10.69 mb/d, respectively.

World Oil Supply
OPEC Monthly Oil Market Report – June 2014 55
Graph 5.8: Russia’s quarterly production Graph 5.9: Russia’s quarterly production, annual comparison
Caspian Kazakhstan’s oil supply is expected to decrease by 20 tb/d over 2013 to average 1.62 mb/d in 2014, unchanged from the previous month. Kazakhstan’s expected supply decline in 2014 comes from held back Kashagan oil field production, due to a toxic gas leak. Kashagan preliminary production was shut in while it was expected to start-up officially in 2014, after expenditures of more than $50 billion. It is planned to replace two 55-mile pipelines ‒ one for oil and one for gas, with special pipelines that are made from a costly nickel alloy which can resist the impact of toxic gas. Kashagan ‒ which was contractually required to begin production in 2005 and have it rise to about 1.6 mb/d ‒ began to produce at a rate of 75,000 b/d on 11 September. However, operations were shut down a month later when gas began to leak from a natural gas line leading from the offshore field to an onshore processing plant. On a quarterly basis, Kazakhstan’s supply is seen to stand at 1.64 mb/d, 1.62 mb/d, 1.60 mb/d and 1.61 mb/d, respectively. Moreover, Tangiz oil field, the largest oil producer, planned to reduce oil production and exports by 30% in May compared with a month earlier due to refinery maintenance, which will last 2–3 weeks; production is expected to decline by about 0.37 mb/d. Maintenance will last from 20 May until 16 June. Another maintenance period is planned for August, thus an overall decline in oil production is forecast for 2014. Oil output at Tengizchevroil will remain at current levels ‒ slightly less than 0.59 mb/d ‒ before the start of the second stage of maintenance in August. The huge Tengiz oilfield in western Kazakhstan is one of three main drivers behind Kazakhstan’s plans to raise its oil output by 60% by the end of the decade. Azerbaijan’s oil supply is anticipated to stand steady to average 0.87 mb/d in 2014 compared with a year earlier, unchanged from the previous month. First quarter oil supply data encountered a downward revision to adjust for updated production data, while the rest of the year encountered a minor upward revision. On a quarterly basis, supply is estimated to average 0.85 mb/d, 0.86 mb/d, 0.88 mb/d and 0.89 mb/d, respectively. FSU Others is expected to increase production by 40 tb/d to average 0.42 mb/d in 2014, compared with a year earlier.
10.1
10.2
10.3
10.4
10.5
10.6
10.7
10.81Q
112Q
113Q
114Q
111Q
122Q
123Q
124Q
121Q
132Q
133Q
134Q
131Q
142Q
143Q
144Q
14
mb/d
10.1
10.2
10.3
10.4
10.5
10.6
10.7
10.8
1Q 2Q 3Q 4Q
mb/d
2011 20122013 2014

World Oil Supply
56 OPEC Monthly Oil Market Report – June 2014
China China’s oil production is forecast to average 4.27 mb/d in 2014, a record high and an increase of 30 tb/d over 2013, indicating a downward revision on annual growth of less than 10 tb/d from the previous assessment, but no change in total supply. China’s oil supply averaged 4.22 tb/d in April, a minor decrease over the previous month and a drop of 30 tb/d from the same month a year ago. On a quarterly basis, China’s supply is projected to average 4.24 mb/d, 4.25 mb/d, 4.27 mb/d and 4.32 mb/d, respectively. OPEC NGLs and non-conventional oils OPEC NGLs and non-conventional oils averaged 5.66 mb/d in 2013, an increase of 0.09 mb/d over the previous year. In 2014, OPEC NGLs and non-conventional oils are forecast to grow by 0.15 mb/d over the previous year to average 5.81 mb/d. Table 5.3: OPEC NGLs + non-conventional oils, 2011-2014
OPEC crude oil production According to secondary sources, total OPEC crude oil production averaged 29.76 mb/d in May, an increase of 142 tb/d over the previous month. Crude oil output increased from Angola, Iraq, Saudi Arabia, Iran, UAE, Nigeria and Ecuador, while production decreased in Libya, Kuwait and Algeria. Oil production in Qatar and Venezuela was more or less unchanged. According to secondary sources, OPEC crude oil production - not including Iraq - stood at 26.43 mb/d in May, an increase of 87 tb/d over the previous month. Table 5.4: OPEC crude oil production based on secondary sources, tb/d
Change Change Change2011 2012 12/11 1Q13 2Q13 3Q13 4Q13 2013 13/12 2014 14/13
Total OPEC 5.37 5.57 0.20 5.63 5.56 5.77 5.66 5.66 0.09 5.81 0.15
2012 2013 3Q13 4Q13 1Q14 Mar 14 Apr 14 May 14 May/AprAlgeria 1,210 1,159 1,155 1,144 1,134 1,126 1,156 1,144 -11.9Angola 1,738 1,738 1,720 1,719 1,599 1,535 1,598 1,656 57.4Ecuador 499 516 520 530 535 534 536 539 3.2Iran, I.R. 2,977 2,673 2,658 2,686 2,774 2,785 2,781 2,799 18.5Iraq 2,979 3,037 2,998 3,019 3,217 3,190 3,276 3,331 55.0Kuwait 2,793 2,822 2,842 2,821 2,797 2,780 2,807 2,792 -15.8Libya 1,393 928 653 332 371 230 222 203 -19.7Nigeria 2,073 1,912 1,906 1,870 1,888 1,884 1,871 1,882 11.0Qatar 753 732 731 731 733 728 726 726 0.0Saudi Arabia 9,737 9,584 10,024 9,721 9,702 9,556 9,614 9,646 31.7UAE 2,624 2,741 2,780 2,743 2,745 2,752 2,699 2,712 13.2Venezuela 2,359 2,356 2,361 2,359 2,341 2,339 2,335 2,335 -0.2
Total OPEC 31,135 30,196 30,348 29,675 29,836 29,439 29,622 29,765 142.3OPEC excl. Iraq 28,155 27,159 27,350 26,657 26,619 26,249 26,347 26,434 87.3
Totals may not add up due to independent rounding.

World Oil Supply
OPEC Monthly Oil Market Report – June 2014 57
Table 5.5: OPEC crude oil production based on direct communication, tb/d
World oil supply Preliminary data indicates that global oil supply increased by 0.20 mb/d to average 90.99 mb/d in May 2014 compared with the previous month. The increase in May came from non-OPEC supply and OPEC production. The share of OPEC crude oil in total global production stands at 32.7% in May. Estimates are based on preliminary data for non-OPEC supply and OPEC NGLs, while estimates for OPEC crude production come from secondary sources. Graph 5.10: OPEC and world oil supply
87
88
89
90
91
92
27
28
29
30
31
32
Jun
12
Jul 1
2
Aug
12
Sep
12
Oct
12
Nov
12
Dec
12
Jan
13
Feb
13
Mar
13
Apr 1
3
May
13
Jun
13
Jul 1
3
Aug
13
Sep
13
Oct
13
Nov
13
Dec
13
Jan
14
Feb
14
Mar
14
Apr 1
4
May
14
mb/dmb/d
OPEC crude production (LHS) World supply (RHS)
2012 2013 3Q13 4Q13 1Q14 Mar 14 Apr 14 May 14 May/AprAlgeria 1,203 1,203 1,202 1,208 1,202 1,203 1,190 1,190 0.0Angola 1,704 1,701 1,701 1,625 1,553 1,446 1,599 1,605 6.0Ecuador 504 526 534 544 553 557 560 554 -5.9Iran, I.R. 3,740 3,576 3,653 3,239 3,270 3,300 3,250 3,230 -20.0Iraq 2,944 2,980 3,006 2,915 3,106 3,089 3,064 3,177 113.0Kuwait 2,977 2,922 2,992 2,912 2,898 2,860 2,927 2,822 -105.2Libya 1,450 993 752 332 384 241 222 217 -5.2Nigeria 1,954 1,754 1,824 1,706 1,869 1,825 1,824 1,809 -15.0Qatar 734 724 719 725 725 710 701 701 -0.2Saudi Arabia 9,763 9,637 10,115 9,773 9,723 9,566 9,660 9,705 44.7UAE 2,652 2,797 2,858 2,714 2,733 2,778 2,606 2,847 241.0Venezuela 2,804 2,786 2,781 2,851 2,870 2,856 2,836 2,832 -4.0
Total OPEC 32,429 31,599 32,138 30,543 30,886 30,429 30,440 30,689 249OPEC excl. Iraq 29,485 28,619 29,132 27,628 27,781 27,340 27,376 27,512 136
Totals may not add up due to independent rounding.

Product Markets and Refinery Operations
58 OPEC Monthly Oil Market Report – June 2014
Product Markets and Refinery Operations Product markets in the Atlantic Basin received support from the start of the driving season, with increasing US gasoline demand. However, higher refinery runs in the US, amid increasing gasoline inventories, pressured the margins, though the losses were capped by higher export opportunities. Meanwhile, product markets in Europe lost the ground recovered last month, mainly as middle distillates cracks fell. This occurred on the back of increasing inventories amid higher inflows into the region, which, along with rising Brent crude prices, caused refinery margins to drop in Europe. The Asian market lost ground during May due to a weakening middle distillates and gasoline crack spread, which along with the increase in crude prices more than offset the positive performance seen at the bottom of the barrel and caused refinery margins to fall. Graph 6.1: Refinery margins, 2013-2014
US product markets fell slightly during May on the back of losses throughout the barrel with higher production and rising inventories exerting some pressure on crack spreads. Losses were capped by support coming from strong domestic demand amid export opportunities, mainly to Latin America. The refinery margin for WTI crude on the US Gulf Coast (USGC) showed a slight loss of 52¢ to average $10.2/b in May. Meanwhile, the margin for Light Louisiana Sweet (LLS) crude on the USGC averaged $14.4/b, exhibiting a slight loss of 50¢. European refining margins dropped sharply in May due to weakness at the middle of the barrel with the crack spread being pressured by increasing inflows to the region amid weaker regional demand, while an increasing Brent crude price also played a role in falling refinery margins in the region. The gasoline market, which has been supported by the open arbitrage to the US, started to feel pressure from the build-up of US gasoline inventories. The refinery margin for Brent crude in Northwest Europe showed a sharp drop of more than $2 to average $1.8/b in May. The Asian market witnessed a drop in May, despite some recovery seen at the bottom of the barrel. However, the uptick in fuel oil prices was outweighed by the losses in middle distillates and gasoline due to pressure from the supply side, causing margins to fall. Refinery margins in Singapore lost 85¢ in May to average $1.60/b.
-5
0
5
10
15
20
-5
0
5
10
15
20
May
13
Jun
13
Jul 1
3
Aug
13
Sep
13
Oct
13
Nov
13
Dec
13
Jan
14
Feb
14
Mar
14
Apr 1
4
May
14
US$/bUS$/b
WTI (US Gulf) Arab Heavy (US Gulf) Brent (Rotterdam)Dubai (Singapore) LLS (US Gulf)

Product Markets and Refinery Operations
OPEC Monthly Oil Market Report – June 2014 59
Refinery operations Refinery utilization rates in the US have continued to rise with the start of the driving season and with maintenance coming to the end, to average 88.9% in May, an increase of 0.7 percentage points (pp) versus the previous month, the highest level seen this year. The return of refining capacity has led to higher gasoline production, leading to a recovery in gasoline inventories to reach the typical average level seen at the start of the summer driving season. Graph 6.2: Refinery utilisation rates, 2013-2014
European refinery runs averaged around 77% in April, corresponding to a throughput of 9.8 mb/d of refining capacity, 140 tb/d higher than the previous month, with several refineries back from maintenance. However, the level remained around 400 tb/d lower than levels a year ago, as European refiners continue to feel pressure from increased competition and weak domestic demand. In Asia, heavy maintenance continued to moderate refinery runs in several countries. Chinese refinery levels averaged 9.6 mb/d in April, as product inventories were on the rise. Refinery runs in Singapore for April averaged around 95%, just 2 pp lower than the previous month. Japanese throughputs averaged 75% of capacity in May, 3.3 pp lower than in April, with several refineries in maintenance and concerns about a possible shutdown in Japan’s refinery capacity as part of more stringent regulations in the nation’s refinery sector.
60
70
80
90
100
60
70
80
90
100
May
13
Jun
13
Jul 1
3
Aug
13
Sep
13
Oct
13
Nov
13
Dec
13
Jan
14
Feb
14
Mar
14
Apr
14
May
14
%%
US EU-16 Japan Singapore

Product Markets and Refinery Operations
60 OPEC Monthly Oil Market Report – June 2014
US market US gasoline demand stood at around 9.1 mb/d in May, around 550 tb/d higher than the previous month and up 200 tb/d from the same month a year earlier. Gasoline cracks lost part of the ground gained last month in the USGC on higher production in the US, which continues to be elevated due to the increase in crude runs and high gasoline yields. This comes amid the latest EIA inventory report which showed that nationwide stocks increased to reach the typical average level of around 213 mb. On the other hand, the US EPA relaxed gasoline specifications in certain regions of North Carolina and Florida. Typically, there would be a shift to 7.8 RVP gasoline from June to mid-September; but the exempted regions will now be allowed to stay with a 9.0 RVP blend this summer, which is normally traded at a discount to lower RVP material. Meanwhile, the RBOB prices have corrected downwards over the last weeks in reaction to weakening fundamentals, after reaching a nine-month high in late April. Additionally, after long positions passed the 100,000 lots threshold in the last week of April ‒ for only the third time since 2006, according to the CFTC ‒ money managers have begun to cut back their positions on Nymex RBOB contracts. The gasoline crack spread saw a slight drop of around $1 to average $29/b in May. Graph 6.3: US Gulf crack spread vs. WTI, 2013-2014
Middle distillate demand stood at around 4.1 mb/d in May, about 70 tb/d higher than the previous month and close to 300 tb/d above the same month a year earlier. US diesel demand has improved in recent months with its Truck Tonnage Index, according to the ATA, increasing 0.6% m-o-m in March after jumping 1.9% the previous month. On a y-o-y basis, the index was up 3.1%. However, despite robust demand from the trucking sector and the ongoing spring planting season, higher refinery production is keeping pressure on the market. Gasoil crack spreads came under pressure this month, following a build in distillate inventories in PADD-3, as the arbitrage to ship diesel from the USGC to New York Harbour remained closed and with the East Coast hub’s premium seen below the Colonial Pipeline’s shipping tariff. However, losses were capped by support from continuing exports with several diesel cargoes being booked from the USGC mostly to destinations in Latin America ‒ Argentina, Brazil, Chile, Colombia and Mexico. The USGC gasoil crack lost 70¢ versus the previous month’s level to average around $18.4/b in May.
-10
0
10
20
30
40
50
-10
0
10
20
30
40
50
May
13
Jun
13
Jul 1
3
Aug
13
Sep
13
Oct
13
Nov
13
Dec
13
Jan
14
Feb
14
Mar
14
Apr
14
May
14
US$/bUS$/b
Prem.Gasoline Unl.93 Jet/Kero Gasoil/Diesel (0.05%S) Fuel oil (1.0%S)

Product Markets and Refinery Operations
OPEC Monthly Oil Market Report – June 2014 61
Looking ahead to the coming weeks, with USGC stocks climbing and the recent weakness in the European market, increasing pressure on USGC prices could help to re-open the arbitrage to the USEC. At the bottom of the barrel, the fuel oil crack continued weakening as increasing inventories exerted pressure amid reduced demand from power generation. Utilities have continued to switch back to natural gas, following severe weather earlier this year. Additionally, relatively subdued Latin American demand has also helped to keep the pressure on the crack spreads. The crude intake at Argentinean refineries has been on the rise, in order to reduce the level of product imports to the country, while Mexican imports have been declining, due to increasing fuel substitution in the power generation sector. The fuel oil crack in the USGC exhibited a loss of more than $1 to average minus $3.40/b during May. European market Product markets in Europe lost the ground recovered last month due to crack spreads being pressured by weakness at the top and middle of the barrel, while a strengthening Brent crude price also played a role. Gasoline cracks saw a correction, losing ground in May after peaking in April, but remaining at healthy levels with support coming from some volumes headed to West Africa. Bearish sentiment was prevalent in the US, particularly as the country continues to produce gasoline at very elevated levels. This could limit the expected increase of volumes heading to the US over the start of the summer driving season, which has been supporting the European gasoline market in previous years. The gasoline crack spread against Brent exhibited a drop of more than $2 to average $18/b in May. The light distillate naphtha crack dropped slightly due to some bearish signals emerging from the petrochemicals market. These included naphtha cracker margins in Northwest Europe falling recently to a y-t-d low as lower ethylene prices and weakening demand for co-products all pressured margins. This has caused European petrochemical players to reduce utilization rates to below 80% in recent weeks. Graph 6.4: Rotterdam crack spreads vs. Brent, 2013-2014
-30
-20
-10
0
10
20
30
-30
-20
-10
0
10
20
30
May
13
Jun
13
Jul 1
3
Aug
13
Sep
13
Oct
13
Nov
13
Dec
13
Jan
14
Feb
14
Mar
14
Apr
14
May
14
US$/bUS$/b
Prem.Gasoline Unl.98 ppm Jet/Kero Gasoil 10 ppm Fuel oil (1.0%S)
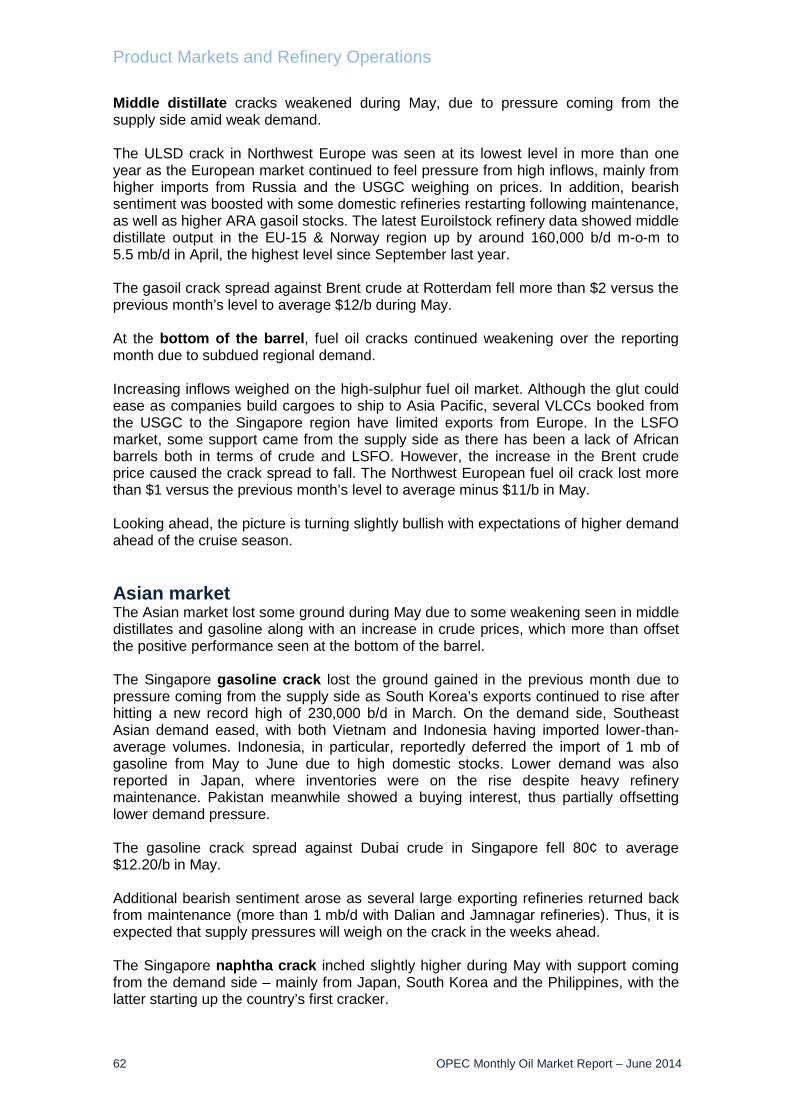
Product Markets and Refinery Operations
62 OPEC Monthly Oil Market Report – June 2014
Middle distillate cracks weakened during May, due to pressure coming from the supply side amid weak demand. The ULSD crack in Northwest Europe was seen at its lowest level in more than one year as the European market continued to feel pressure from high inflows, mainly from higher imports from Russia and the USGC weighing on prices. In addition, bearish sentiment was boosted with some domestic refineries restarting following maintenance, as well as higher ARA gasoil stocks. The latest Euroilstock refinery data showed middle distillate output in the EU-15 & Norway region up by around 160,000 b/d m-o-m to 5.5 mb/d in April, the highest level since September last year. The gasoil crack spread against Brent crude at Rotterdam fell more than $2 versus the previous month’s level to average $12/b during May. At the bottom of the barrel, fuel oil cracks continued weakening over the reporting month due to subdued regional demand. Increasing inflows weighed on the high-sulphur fuel oil market. Although the glut could ease as companies build cargoes to ship to Asia Pacific, several VLCCs booked from the USGC to the Singapore region have limited exports from Europe. In the LSFO market, some support came from the supply side as there has been a lack of African barrels both in terms of crude and LSFO. However, the increase in the Brent crude price caused the crack spread to fall. The Northwest European fuel oil crack lost more than $1 versus the previous month’s level to average minus $11/b in May. Looking ahead, the picture is turning slightly bullish with expectations of higher demand ahead of the cruise season. Asian market The Asian market lost some ground during May due to some weakening seen in middle distillates and gasoline along with an increase in crude prices, which more than offset the positive performance seen at the bottom of the barrel. The Singapore gasoline crack lost the ground gained in the previous month due to pressure coming from the supply side as South Korea’s exports continued to rise after hitting a new record high of 230,000 b/d in March. On the demand side, Southeast Asian demand eased, with both Vietnam and Indonesia having imported lower-than-average volumes. Indonesia, in particular, reportedly deferred the import of 1 mb of gasoline from May to June due to high domestic stocks. Lower demand was also reported in Japan, where inventories were on the rise despite heavy refinery maintenance. Pakistan meanwhile showed a buying interest, thus partially offsetting lower demand pressure. The gasoline crack spread against Dubai crude in Singapore fell 80¢ to average $12.20/b in May. Additional bearish sentiment arose as several large exporting refineries returned back from maintenance (more than 1 mb/d with Dalian and Jamnagar refineries). Thus, it is expected that supply pressures will weigh on the crack in the weeks ahead. The Singapore naphtha crack inched slightly higher during May with support coming from the demand side – mainly from Japan, South Korea and the Philippines, with the latter starting up the country’s first cracker.

Product Markets and Refinery Operations
OPEC Monthly Oil Market Report – June 2014 63
Graph 6.5: Singapore crack spread vs. Dubai, 2013-2014
At the middle of the barrel, despite heavy maintenance in the region, weaker domestic demand amid a lack of export opportunities weighed on the regional market. The Singapore gasoil crack spread fell, losing more than $1 over the reporting month. In addition to the development of rather lacklustre demand in major consuming countries like China and India, the current heavy refinery maintenance season (almost 3 mb/d in May) was unable to lift the crack. While in Japan, lower exports and weaker domestic demand contributed to a stock-build of middle distillates. The losses were partially capped by some demand support from East Africa ‒ mainly Tanzania ‒ and the Middle East. Gasoil demand typically improves in the latter region between April and May, as the power generation season kicks off. The gasoil crack spread in Singapore against Dubai lost more than $1 to average around $18/b in May. Looking ahead over the coming weeks, it is expected that a seasonal improvement in China’s gasoil consumption may be seen ahead of the harvesting season. However, this could be offset by the new capacity coming online in the region. The fuel oil crack recovered some ground in Singapore on the back of a tighter environment as the arbitrage window from the Americas and Europe curtailed inflows. Moreover, demand support stemmed from higher seasonal power requirements. Although the uptick was somehow limited by China’s feedstock demand being reportedly subdued, in South Korea, fuel oil consumption and production hit new all-time lows in April. The fuel oil crack spread in Singapore against Dubai recovered 40¢ to average minus $12.50/b in May. Looking ahead, the fuel oil crack will remain under pressure over the following weeks as arbitrage inflows from the West are expected to be on the rise amid an expected uptick in exports out of the Middle East region.
-20
-10
0
10
20
30
-20
-10
0
10
20
30M
ay 1
3
Jun
13
Jul 1
3
Aug
13
Sep
13
Oct
13
Nov
13
Dec
13
Jan
14
Feb
14
Mar
14
Apr
14
May
14
US$/bUS$/b
Prem.Gasoline Unl.92 Jet/Kero Gasoil 50 ppm Fuel oil 180 CST (2.0%S)

Product Markets and Refinery Operations
64 OPEC Monthly Oil Market Report – June 2014
Table 6.1: Refinery operations in selected OECD countries
Table 6.2: Refined product prices, US$/b
Change ChangeMar 14 Apr 14 May 14 May/Apr Mar 14 Apr 14 May 14 May/Apr
US 15.09 15.72 15.84 0.12 86.33 89.58 89.40 -0.17France 1.02 1.07 - - 67.89 71.00 - -Germany 1.75 1.87 - - 78.05 83.39 - -Italy 1.20 1.19 - - 56.77 56.34 - -UK 1.17 1.19 - - 76.49 78.20 - -Euro-16 9.69 9.83 - - 75.67 76.75 - -Japan 3.72 3.60 2.95 -0.65 82.60 78.00 74.70 -3.30
Sources: OPEC statistics, Argus, Euroilstock inventory report, IEA, EIA/DoE, METI and PAJ.
Refinery throughput, mb/d Refinery utilization, %
ChangeMar 14 Apr 14 May 14 May/Apr
US Gulf (Cargoes FOB):Naphtha 110.60 111.71 112.47 0.76Premium gasoline (unleaded 93) 126.74 132.43 131.25 -1.18Regular gasoline (unleaded 87) 115.71 122.76 120.77 -1.99Jet/Kerosene 121.86 121.83 120.93 -0.90Gasoil (0.2% S) 119.80 121.12 120.09 -1.03Fuel oil (1.0% S) 102.35 101.56 98.40 -3.16Fuel oil (3.0% S) 89.31 90.74 91.77 1.03Rotterdam (Barges FoB):Naphtha 100.82 102.40 103.76 1.36Premium gasoline (unleaded 98) 120.86 128.03 127.36 -0.67Jet/Kerosene 121.71 122.24 123.29 1.05Gasoil/Diesel (10 ppm) 121.01 122.13 121.29 -0.84Fuel oil (1.0% S) 100.10 98.07 98.66 0.59Fuel oil (3.5% S) 91.27 91.32 91.19 -0.13Mediterranean (Cargoes FOB):Naphtha 97.86 100.23 101.83 1.60Premium gasoline* 115.23 122.87 121.92 -0.94Jet/Kerosene 118.48 119.82 120.61 0.79Gasoil/Diesel* 121.46 122.04 122.22 0.18Fuel oil (1.0% S) 100.69 98.72 99.73 1.01Fuel oil (3.5% S) 90.48 90.17 91.55 1.38Singapore (Cargoes FOB):Naphtha 102.08 103.99 105.31 1.32Premium gasoline (unleaded 95) 119.37 121.39 121.43 0.04Regular gasoline (unleaded 92) 116.53 117.64 117.96 0.32Jet/Kerosene 119.99 120.56 119.88 -0.68Gasoil/Diesel (50 ppm) 122.46 123.96 123.01 -0.95Fuel oil (180 cst 2.0% S) 95.00 93.81 95.08 1.27Fuel oil (380 cst 3.5% S) 93.13 91.76 92.86 1.10
Sources: Platts and Argus Media.* Cost, insurance and freight (CIF).

Tanker Market
OPEC Monthly Oil Market Report – June 2014 65
Tanker Market In May, crude oil tanker market sentiment remained weak, while dirty average spot freight rates dropped by 2% compared with the previous month. The drop came mainly because of a 10% decline in VLCC sector average spot freight rates for all reported routes in May compared with the previous month. Suezmax and Aframax freight rates remained stable at the same levels as registered a month earlier. Several factors supported the general weakness in spot freight rates in May, though holidays at the beginning of the month had a strong impact. A low number of tonnage demand fixtures supported tonnage oversupply in both East and West of Suez, as did incomplete refinery maintenance. In general, May was found to be light on deals, despite a return from refinery maintenance. Clean tanker sentiment was mixed in May; while freight rates increased in East of Suez by 5% from a month ago, they dropped by 9% in West of Suez. Low activity, limited tonnage demand and holidays were the main factors driving the drop in the West of Suez clean tanker market. Spot fixtures In May, OPEC spot fixtures declined by 0.95 mb/d or 7.6% compared with the previous month to stand at 11.58 mb/d. The number of fixtures in May were on the low side as tonnage demand was down, partially due to seasonal maintenance. All chartering activities showed a drop from both the previous month and one year earlier. The Middle East-to-East and Middle East-to-West routes experienced a drop of 8% and 7%, respectively, while outside the Middle East fixtures declined by 7%. On the whole, global oil spot fixtures were down in May by 1.29 mb/d to 16.8 mb/d compared with the previous month. Table 7.1: Tanker chartering, sailings and arrivals, mb/d
ChangeMar 14 Apr 14 May 14 May 14/Apr 14
Spot CharteringAll areas 19.49 18.09 16.80 -1.29OPEC 14.14 12.53 11.58 -0.95Middle East/East 7.21 6.11 5.60 -0.51Middle East/West 2.50 2.70 2.52 -0.18Outside Middle East 4.43 3.72 3.45 -0.27
SailingsOPEC 24.16 23.88 23.48 -0.40Middle East 17.72 17.53 17.14 -0.38
ArrivalsNorth America 10.39 9.51 9.38 -0.13Europe 12.04 12.25 12.58 0.32Far East 8.86 8.86 8.64 -0.22West Asia 4.36 4.27 4.35 0.09
Sources: Oil Movements and Lloyd's Marine Intelligence Unit.

Tanker Market
66 OPEC Monthly Oil Market Report – June 2014
Sailings and arrivals OPEC sailings dropped by 0.40 mb/d or 2% in May on a monthly basis and an annual comparison reflected a similar drop, also in terms of percentage. According to preliminary data, arrivals at the main importing regions showed an increase from a month earlier, with the exception of West Asia and Europe, which increased by 2% and 3% from a month ago to average 4.35 mb/d and 12.58 mb/d, respectively, in May. North America and Far East arrivals saw drops in May compared with the previous month. US arrivals indicated a drop of 1.3% to stand at 9.38 mb/d and Far East arrivals lost 2.5% to stand at 8.64 mb/d in May. Spot freight rates VLCC The VLCC segment suffered the most in May as spot freight rates for all routes weakened. Spot freight rates for VLCCs on the Middle East-to-East long-haul route decreased by 11% in May compared with the previous month to average WS36. The decrease came on the back of continued low activity, despite the approaching end of maintenance season. VLCC spot freight rates for the Middle East-to-West long-haul route averaged WS26 in May, compared with a month earlier. Freight rates to the West experienced a similar drop to that of the East, as activity waned, leading to a decline of 11% over the previous month. VLCC spot freight rates in West Africa were no exception to other reported regions; they decreased by 8% to average WS39 in May, exhibiting tonnage oversupply and lower lifting from Asian buyers. On average, VLCC freight rates were down from a month earlier by 10%. The VLCC market suffered from increasing competition among VLCC owners, leading to lower freight rates. In many cases operational costs were barely covered. Graph 7.1: Monthly averages of crude oil spot freight rates
20406080100120140160180
20406080
100120140160180
May
13
Jun
13
Jul 1
3
Aug
13
Sep
13
Oct
13
Nov
13
Dec
13
Jan
14
Feb
14
Mar
14
Apr 1
4
May
14
WorldscaleWorldscale
Mediterranean / Northwest Europe (Aframax) West Africa / USGC (Suezmax)Middle East / Far East (VLCC)

Tanker Market
OPEC Monthly Oil Market Report – June 2014 67
Table 7.2: Spot tanker crude freight rates, Worldscale
Suezmax Suezmax spot freight rates ended the month of May flat from a month earlier. Freight rates reported a slight increase on the Northwest Europe-to-US route to stand at WS51 points, while dropping by a similar level for tankers trading on the West Africa-to-US Gulf Coast (USGC) to average WS55 points. The West African market firmed at the end of the month, leading to Suezmax tankers ballasting there, thus reducing the high availability of Suezmax in the Middle East. The Suezmax market and freight rates in the Mediterranean and the Black Sea were often reported stable during the month before firming, following freight rate movements in West Africa. Meanwhile, higher freight rates in the West were registered on the back of prompt replacements during a time of relatively tighter availability. Aframax Aframax spot freight rates were mixed in May, registering increases on some routes while reflecting losses on others, when compared with last month. These tendencies offset each other, leading to flat changes on average. Gains in Aframax spot freight rates came on both the Indonesia-to-East and the Caribbean-to-US East Coast (USEC) routes, which increased by 2% and 15%, respectively, in May, compared with a month earlier. Tonnage availability appeared to be less in the Caribbean, where there was a healthy amount of activity. Mediterranean spot freight rates were under pressure in May compared with last month. Mediterranean-to-Mediterranean spot freight rates dropped by 12% in May compared with the previous month, while Mediterranean-to-Northwest Europe rates declined by 9%. The decline in Mediterranean-to-Mediterranean rates was supported by a quiet market and lack of activity, while freight rates did firm occasionally as a flow of activity occurred at the end of the month. However, it was not sufficient to reverse the average downward movement of freight rates. This firmer trend did not last long, as freight rates later declined while the tonnage position list lengthened. Even some delays at the port of Trieste were easily accommodated.
Size Change1,000 DWT Mar 14 Apr 14 May 14 May/Apr
CrudeMiddle East/East 230-280 43 41 36 -5Middle East/West 270-285 31 30 26 -3West Africa/East 260 44 42 39 -3West Africa/US Gulf Coast 130-135 60 56 56 0Northwest Europe/US Gulf Coast 130-135 56 51 52 1Indonesia/East 80-85 86 87 89 2Caribbean/US East Coast 80-85 100 101 116 15Mediterranean/Mediterranean 80-85 94 93 82 -11Mediterranean/Northwest Europe 80-85 89 85 77 -8
Sources: Galbraith’s tanker market report and Platts.

Tanker Market
68 OPEC Monthly Oil Market Report – June 2014
Freight rates in Northwest Europe were flat at the beginning of the month before dropping, mainly in the Baltics. The end of the month saw slightly enhanced freight rates in Northwest Europe as activities increased ahead of several holidays in the region. The Aframax freight rate decline was also affected by maintenance at Primorsk. Clean spot freight rates Clean tanker market sentiment was mixed in May compared with the previous month, with East of Suez rates increasing by 5% and those in West of Suez dropping by 9%. In East of Suez, Middle East-to-East spot freight rates gained 15% in May over a month earlier. The clean product tanker market was active across different products in the East of Suez, particularly for Middle East loadings. However, the tonnage list lengthened towards the end of the month as May requirements were covered, hence freight rates started to drop. Singapore-to-East spot freight rates declined 3% on average in May, with freight rates on that route mostly reporting no significant changes. In West of Suez, Northwest Europe-to-USEC/USGC spot freight rates declined by 7% in May compared with a month earlier, while Mediterranean-to-Mediterranean and Mediterranean-to-Northwest Europe spot freight rates reflected the highest drop, declining by 10% each. On average, clean tanker freight rates were down by 4% from the previous month, reflecting a decline of 15% from the same period one year ago. Graph 7.2: Monthly average of clean spot freight rates
Table 7.3: Spot tanker product freight rates, Worldscale
60
80
100
120
140
160
180
200
60
80
100
120
140
160
180
200
May
13
Jun
13
Jul 1
3
Aug
13
Sep
13
Oct
13
Nov
13
Dec
13
Jan
14
Feb
14
Mar
14
Apr 1
4
May
14
WorldscaleWorldscale
Middle East / Far East NW Europe/USEC Mediterranean / Mediterranean
Size Change1,000 DWT Mar 14 Apr 14 May 14 May/Apr
ProductsMiddle East/East 30-35 109 97 111 15Singapore/East 30-35 112 114 111 -4Northwest Europe/US East Coast 33-37 132 112 104 -8Mediterranean/Mediterranean 30-35 171 129 116 -13Mediterranean/Northwest Europe 30-35 181 139 126 -13
Sources: Galbraith’s tanker market report and Platts.

Oil Trade
OPEC Monthly Oil Market Report – June 2014 69
Oil Trade According to preliminary sources, May data shows US crude oil imports declined by 583 tb/d or 8% from the previous month to average 7.1 mb/d. On an annual comparison, this reflects a loss of similar amount, as it dropped by 654 tb/d or 8.5% from one year ago. US product imports increased by 261 tb/d or 14% to average 2.1 mb/d m-o-m, while y-o-y they dropped by 169 tb/d or 7%. Japan crude oil imports saw a decline in April for the third month in a row by 300 tb/d or 8% to average 3.5 mb/d. On a y-o-y basis, crude imports also dropped by 158 tb/d or 4%. Product imports declined by 125 tb/d in April to average 518 tb/d, the lowest level since June 2013. China’s crude oil imports increased in April by a remarkable 1.3 mb/d or 24% from the previous month to reach a new peak average of 6.8 mb/d. China’s crude imports increased as a result of stock building. On an annual comparison, China’s crude imports increased by 1.2 mb/d, 21% more than one year ago. In April, India’s crude imports increased by 549 tb/d or 16% from the previous month to average 4.04 mb/d. Crude imports reflected an annual increase of 37 tb/d or 1%. On the product side, India’s imports saw a monthly increase of 91 tb/d or 25%, to average 454 tb/d. US Preliminary data shows that US crude oil imports for May declined by 583 tb/d or 8% from the previous month to average 7.1 mb/d. On an annual basis, this reflects a loss of a similar amount, decreasing by 654 tb/d or 8.5% from a year before. Graph 8.1: US imports of crude and petroleum products
US product imports increased by 261 tb/d or 14% to average 2.1 mb/d m-o-m, while they dropped by 169 tb/d or 7% y-o-y. On a year-to-date comparison, both crude and product imports were lower by 3% and 10%, respectively. In May, US product exports registered a drop by 384 tb/d or 11% to average 3 mb/d from the previous month. On an annual comparison, the figures show a drop of 319 tb/d or 10%.
6.0
6.5
7.0
7.5
8.0
8.5
0.0
0.5
1.0
1.5
2.0
2.5
May
13
Jun
13
Jul 1
3
Aug
13
Sep
13
Oct
13
Nov
13
Dec
13
Jan
14
Feb
14
Mar
14
Apr
14
May
14
mb/dmb/d
Others* Propane / Propylene GasolineJet Fuel / Kerosene Fuel Oil Crude (RHS)
*Others: Contains natural gas liquids, liquefied refinery gases (LRG's), other liquids and all finished petroleum productsexcept gasoline, jet fuel/kerosene, fuel oil and propane/propylene.

Oil Trade
70 OPEC Monthly Oil Market Report – June 2014
As a result, US total net imports declined in May to average 6 mb/d, down by 48 tb/d from last month and 508 tb/d from the previous year. Graph 8.2: US exports of crude and petroleum products
In March, the top oil suppliers to the US maintained the same order as seen last month. Canada remained the premier crude supplier to the US, accounting for 37% of total US crude imports. However, volume-wise, imports from Canada were up by 191 tb/d or 8% from a month earlier. Saudi Arabia, the second largest US supplier, maintained its position with a rise of 141 tb/d or 11% over the previous month. Mexico also increased its crude exports to the US from a month ago to come in the third supplier position with a share of 11% of total US imports. Table 8.1: US crude and product net imports, tb/d
Crude imports in March from OPEC Member Countries dropped from a month earlier by 403 tb/d, however, OPEC Member Countries still account for 43% of total US crude imports. On the other hand, US product imports in March from OPEC Member Countries increased by 70 tb/d or 48% from last month. Regarding the product supplier share, Canada and Russia maintained their positions as first and second suppliers to the US. Nevertheless, Canada’s share of US product imports increased slightly by 10 tb/d, while Russia’s product exports to the US dropped by a marginal 5 tb/d from levels seen a month before. The UK came in as the third product supplier to the US, holding a share of 6% of total product imports.
050100150200250300
0
1,000
2,000
3,000
4,000
5,000M
ay 1
3
Jun
13
Jul 1
3
Aug
13
Sep
13
Oct
13
Nov
13
Dec
13
Jan
14
Feb
14
Mar
14
Apr 1
4
May
14
tb/dtb/d
Others* Propane / Propylene GasolineJet Fuel / Kerosene Fuel Oil Crude (RHS)
*Others: Contains natural gas liquids, liquefied refinery gases (LRG's), other liquids and all finished petroleum productsexcept gasoline, jet fuel/kerosene, fuel oil and propane/propylene.
ChangeMar 14 Apr 14 May 14 May/Apr
Crude oil 7,018 7,648 7,001 -647Total products -1,636 -1,522 -924 598Total crude and products 5,382 6,125 6,077 -49

Oil Trade
OPEC Monthly Oil Market Report – June 2014 71
Japan Japan’s crude oil imports in April declined for the third month in a row by 300 tb/d or 8% to average 3.5 mb/d. On a y-o-y basis, crude imports also dropped by 158 tb/d or 4%. As for the suppliers’ share, Saudi Arabia, the United Arab Emirates (UAE) and Qatar were the top suppliers to Japan in April. Saudi Arabia, as in the previous month, was the top crude supplier to Japan, representing 33% of total crude imports. The UAE was the second largest supplier to Japan with a share of 25% of total crude imports, while Qatar held the third position in April with a share of 12%. All top three suppliers had lower exports to Japan in April as volumes dropped by 3%, 2% and 15%, respectively. Graph 8.3: Japan’s imports of crude and petroleum products
On the other hand, product imports also decreased in April by 125 tb/d to average 518 tb/d, the lowest level since June 2013, reflecting a drop of 20% m-o-m and 3% y-o-y. As for product exports, Japan’s exports dropped by 13 tb/d or 2% to average 525 tb/d. On a y-o-y comparison, they stayed flat. Graph 8.4: Japan’s exports of petroleum products
Accordingly, Japan’s net imports dropped in April by 410 tb/d to the lowest level seen since October 2013 to average 3.5 mb/d, reflecting monthly and annual declines of 10% and 4%, respectively.
0
1
2
3
4
5
0
200
400
600
800
1,000
1,200
Apr
13
May
13
Jun
13
Jul 1
3
Aug
13
Sep
13
Oct
13
Nov
13
Dec
13
Jan
14
Feb
14
Mar
14
Apr
14
mb/dtb/d
Others* LPG Naphtha Fuel oil Crude (RHS)
*Others: Contains gasoline, jet fuel, kerosene, gasoil, asphalt and paraffin wax.
0
100
200
300
400
500
600
700
0
100
200
300
400
500
600
700
Apr 1
3
May
13
Jun
13
Jul 1
3
Aug
13
Sep
13
Oct
13
Nov
13
Dec
13
Jan
14
Feb
14
Mar
14
Apr 1
4
tb/dtb/d
Fuel oil Gasoil Jet fuel Others*
*Others: Contains LPG, gasoline, naphtha, kerosene, lubricating oil, asphalt and paraffin wax.

Oil Trade
72 OPEC Monthly Oil Market Report – June 2014
Table 8.2: Japan’s crude and product net imports, tb/d
China China’s crude oil imports increased in April by a remarkable 1.3 mb/d or 24% from the previous month to reach a new peak with an average of 6.8 mb/d. The increase came as a result of stock building. On an annual comparison, China’s crude imports increased by 1.2 mb/d, 21% higher than the levels seen last year. On a year-to-date basis, crude imports were up by 625 tb/d from the same period a year earlier. Graph 8.5: China’s imports of crude and petroleum products
Graph 8.6: China’s exports of crude and petroleum products
In terms of supplier share, Angola, Saudi Arabia and Oman were the top suppliers to China in April, accounting for 15%, 14% and 13%, respectively. All three top suppliers increased their exported volumes to China from the previous month by 263 tb/d, 160 tb/d and 499 tb/d, respectively. China’s product imports also showed a significant
01,0002,0003,0004,0005,0006,0007,0008,000
0200400600800
1,0001,2001,4001,600
Apr 1
3
May
13
Jun
13
Jul 1
3
Aug
13
Sep
13
Oct
13
Nov
13
Dec
13
Jan
14
Feb
14
Mar
14
Apr 1
4
tb/dtb/d
Others LPG Naphtha Gasoline Jet Fuel
Diesel Fuel Oil Asphalt Crude (RHS)
-20
0
20
40
60
80
100
0
200
400
600
800
Apr 1
3
May
13
Jun
13
Jul 1
3
Aug
13
Sep
13
Oct
13
Nov
13
Dec
13
Jan
14
Feb
14
Mar
14
Apr 1
4
tb/dtb/d
Others LPG Naphtha Gasoline Jet Fuel
Diesel Fuel Oil Asphalt Crude (RHS)
ChangeFeb 14 Mar 14 Apr 14 Apr/Mar
Crude oil 3,950 3,828 3,530 -298Total products 156 105 -7 -112Total crude and products 4,106 3,933 3,523 -410

Oil Trade
OPEC Monthly Oil Market Report – June 2014 73
increase from last month, rising by 310 tb/d or 40%, mainly as a result of higher import volumes of fuel oil, jet fuel, petroleum coke and LPG. China didn’t export any crude in April for the second month in a row. On the other hand, its product exports saw a drop of 126 tb/d or 17% m-o-m and 146 tb/d or 19% y-o-y. As a result, China net oil imports increased by 1.8 mb/d or 32% from the previous month and by 1.2 mb/d or 19% from a year earlier. Table 8.3: China’s crude and product net imports, tb/d
India In April, India’s crude imports increased by 549 tb/d or 16% from the previous month to average 4.0 mb/d, rebounding after the drop it saw in the previous month. Crude imports reflected an annual increase of 37 tb/d or 1%. On the product side, India’s imports saw an increase m-o-m of 91 tb/d or 25% to average 454 tb/d, while y-o-y, they gained by 106 tb/d or 30%, mainly as a result of increased volumes of LPG, which rose by 23% from the previous month, followed by fuel oil imports, which more than doubled from a month before. Graph 8.7: India’s imports of crude and petroleum products
Product imports increased in line with the increase in product sales in April, which went up by 2.4% y-o-y. India’s product exports declined in April by 290 tb/d or 20% to average 1.1 mb/d, the lowest level seen since April 2012. On a y-o-y basis, product exports declined by 122 tb/d or 10%. This decline was registered in all products, with no exception, due to the refinery maintenance season, however, the maximum drop was seen in diesel oil exports.
0
1,000
2,000
3,000
4,000
5,000
0
100
200
300
400
500
Apr 1
3
May
13
Jun
13
Jul 1
3
Aug
13
Sep
13
Oct
13
Nov
13
Dec
13
Jan
14
Feb
14
Mar
14
Apr 1
4tb/dtb/d
Others LPG Naphtha GasolineKerosene Gasoil Fuel oil Crude (RHS)
ChangeFeb 14 Mar 14 Apr 14 Apr/Mar
Crude oil 5,980 5,468 6,802 1,333Total products 218 23 459 436Total crude and products 6,198 5,491 7,261 1,769

Oil Trade
74 OPEC Monthly Oil Market Report – June 2014
Graph 8.8: India’s exports of petroleum products
Consequentially, India’s net imports increased by 930 tb/d to average 3.3 mb/d, reflecting a gain of 38% m-o-m and 9% from last year. Table 8.4: India’s crude and product net imports, tb/d
FSU In April, total crude oil exports from the Former Soviet Union (FSU) increased by 259 tb/d or 4% to average 6.5 mb/d. This increase came mainly as crude exports through the Russian pipeline increased by 172 tb/d or 4% to average 4.0 mb/d. Shipments from the Baltics and Druzhba increased from a month before by 20% and 12%, respectively. The increase affect was offset by a drop in Black Sea and Kozmino, which dropped from last month by 47 tb/d and 9 tb/d, respectively. Exports by Russian rail stood flat at the same level of last month while Kazakh rail and Russia-to-Far East supplies dropped by 3 tb/d and 15 tb/d, respectively. Loadings from CPC and BTC both increased by 76 tb/d and 37 tb/d from a month ago to average 910 tb/d and 613 tb/d, respectively, while Varandey and Caspian supplies showed no changes from last month. Regarding product exports, FSU total product exports in April increased by 273 tb/d or 8% to average 3.6 mb/d from the previous month. This increase in product exports came on the back of higher exported quantities seen in VGO, fuel oil, gasoil and naphtha, which increased from last month’s level by 99 tb/d, 44 tb/d, 58 tb/d and 52 tb/d, respectively.
0
500
1,000
1,500
2,000
0
500
1,000
1,500
2,000
Apr 1
3
May
13
Jun
13
Jul 1
3
Aug
13
Sep
13
Oct
13
Nov
13
Dec
13
Jan
14
Feb
14
Mar
14
Apr 1
4
tb/dtb/d
Fuel oil Gasoil Jet fuel Gasoline Naphtha Others
ChangeFeb 14 Mar 14 Apr 14 Apr/Mar
Crude oil 4,367 3,491 4,041 549Total products -959 -1,074 -693 381Total crude and products 3,408 2,418 3,348 930
Note: India data tab le does not include information for crude import and product export by Reliance Industries.

Oil Trade
OPEC Monthly Oil Market Report – June 2014 75
Table 8.5: Recent FSU exports of crude and products by sources, tb/d
2013 2Q 13 3Q 13 4Q 13 1Q 14 Mar 14 Apr 14 *Crude
Russian pipelineBlack Sea 740 752 738 699 673 738 691Baltic 1,546 1,647 1,409 1,554 1,314 1,274 1,532Druzhba 1,032 1,020 1,063 1,055 1,010 964 1,076Kozmino 434 433 437 429 487 480 471
Total 4,073 4,152 3,984 4,070 3,949 3,913 4,085
Other routesRussian rail** 10 9 9 9 10 9 9Kazakh rail 190 169 194 212 91 73 41Russian - Far East 259 261 252 282 281 317 302Varandey 111 109 120 113 113 114 117Kaliningrad 19 21 18 18 8 1 16CPC 703 703 707 732 827 834 910BTC 635 714 636 609 580 576 613Kenkiyak-Alashankou 240 236 222 262 241 233 232Caspian 154 182 124 134 154 149 153
6,394 6,555 6,265 6,441 6,255 6,219 6,478
ProductsGasoline 122 123 109 114 143 118 130Naphtha 390 355 433 432 501 446 498Jet 11 16 8 7 5 12 20Gasoil 857 875 822 753 1,018 1,013 1,071Fuel oil 1,415 1,557 1,463 1,302 1,427 1,486 1,530VGO 263 288 311 236 217 203 302Total 3,058 3,214 3,145 2,843 3,310 3,278 3,551
9,451 9,769 9,410 9,284 9,566 9,497 10,029
Total crude exports
Total oil exports
* Preliminary.** Does not include Kazakh rail.Totals may not add due to independent rounding.
Sources: Nefte Transport, Global Markets, Argus Fundamentals, Argus FSU and OPEC Secretariat.

Stock Movements
76 OPEC Monthly Oil Market Report – June 2014
Stock Movements OECD commercial oil stocks surged in April by around 50 mb to stand at 2,621 mb. Despite this seasonal build, inventories were around 80 mb less than the last five-year averages of both crude (16 mb) and products (64 mb). In terms of days of forward cover, OECD commercial stocks rose by 0.7 days in April to stand at 57.5 days. This is around 1.4 days lower than the latest five-year average. Preliminary data for May shows that US total commercial oil stocks rose by 17.5 mb for the third consecutive month to stand at 1,101.6 mb, but are in line with the latest five-year average. Within the components, product stocks rose by 25.6 mb, while crude fell by 8.1 mb. Crude stocks show a surplus of 16 mb, while products show a deficit by almost the same amount. Chinese total oil commercial inventories fell by 4.5 mb in April, but remained nearly 26 mb above a year ago at the same time. Crude commercial stocks rose by 1.3 mb, while products fell by 5.9 mb. OECD Preliminary data for April shows that total OECD commercial oil stocks rose strongly by 50.5 mb to stand at 2,621.0 mb. Despite this seasonal build, inventories were around 80 mb less than the latest five-year average and 56 mb below one year ago at the same time. Within the components, crude commercial and product stocks were up in April by 17.4 mb and 33.1 mb, respectively. Lower refinery runs were behind the build in crude oil stocks. At 1,292 mb, OECD crude commercial stocks were 17 mb below the same time a year earlier and 16 mb less than the latest five-year average. Weaker demand during the period of transition from winter heating to driving season was behind the build in product stocks, which ended April at 1,329 mb. Despite this build, OECD product stocks showed a deficit of 64 mb with the seasonal norm, 39 mb below a year ago at the same time. Middle distillates accounted for the bulk of the deficit with the five-year average, standing nearly 47 mb below the seasonal norm. Gasoline stocks also saw a deficit of around 10 mb. Graph 9.1: OECD’s commercial oil stocks
In terms of days of forward cover, OECD commercial stocks rose by 0.7 days in April from March to stand at 57.5 days. This is around 1.3 days lower than both the latest
2,500
2,550
2,600
2,650
2,700
2,750
2,800
2,850
2,500
2,550
2,600
2,650
2,700
2,750
2,800
2,850
Jan Feb Mar Apr May Jun Jul Aug Sep Oct Nov Dec
mbmb
2013 2014 Average 2009-13
Max/Min2009-2013

Stock Movements
OPEC Monthly Oil Market Report – June 2014 77
five-year average and the same month a year earlier. OECD Americas were 0.1 days above the historical average at 56.2 days in April and OECD Europe stood at 3.4 days below the seasonal average to finish the month at 67.3 days. Meanwhile, OECD Asia Pacific indicated a deficit of 2.0 days, averaging 50.5 days. In April, commercial stocks in OECD Americas indicated a massive build of 46.9 mb to stand at 1,354 mb. At this level, inventories were 17 mb above the seasonal norm, but stood 8.4 mb below one year ago at the same time. Within the components, both crude and product stocks increased, by 13.8 mb and 33.1 mb, respectively. At the end of April, crude commercial oil stocks in OECD Americas stood at 676 mb, representing a surplus of 23 mb above the latest five-year average, and 3.8 mb higher than a year ago at the same time. The build in crude commercial stocks was mainly driven by higher imports in the US, which increased by nearly 340,000 b/d to average 7.5 mb/d in April. US crude oil production was up at 8.3 mb/d, the highest level since 1988, contributing to the build in US commercial crude oil stocks. OECD Americas’ product stocks rose in April, reversing a fall of the last three months to stand at 663 mb. This level represents a deficit of 6.1 mb below the seasonal norm, and 12.3 mb below the same time one year ago. Distillate stocks remained tight, showing a deficit of 29 mb with the five-year average, mainly due to higher US distillate exports, while gasoline stocks remained around 6 mb below the five-year average. In April, OECD Europe’s commercial stocks rose slightly by 0.4 mb, reversing the build from the previous two months to stand at 876 mb. At this level, OECD Europe’s commercial stocks stood at 83 mb below the seasonal norm and 28 mb less than one year ago at the same time. Within the components, crude rose by 3.1 mb, while products fell by 2.7 mb. At 374 mb, OECD Europe’s commercial crude stocks stood at 26 mb below the five-year average and 9 mb less than the same period a year ago. The build in crude oil inventories came mainly from higher North Sea supply. In contrast, OECD Europe’s commercial product stocks fell in April for the third consecutive month to stand at 502 mb. At this level, OECD Europe’s commercial product inventories showed a deficit of 56 mb below the seasonal norm and stood 19 mb lower than a year ago at the same time. The bulk of the decline in product stocks came from gasoline, reflecting higher exports to the US to meet strong demand in the country. OECD Asia Pacific commercial stocks rose by 3.2 mb in April to stand at 876 mb. At this level, they were 19 mb below the same period a year ago and 14 mb lower than the latest five-year average. Within the components, crude stocks rose slightly by 0.5 mb, while products increased by 2.7 mb. Crude inventories ended the month of April at 227 mb and stood 12 mb below a year ago and 13 mb lower than the seasonal norm. OECD Asia Pacific’s total product inventories indicated a deficit of 8 mb compared with a year ago, though they are only 6 mb below the seasonal norm. Table 9.1: OECD’s commercial stocks, mb
ChangeFeb 14 Mar 14 Apr 14 Apr 14/Mar 14 Apr 13
Crude oil 1,253 1,274 1,292 17.4 1,308Products 1,320 1,296 1,329 33.1 1,368Total 2,573 2,570 2,621 50.5 2,677
Days of forward cover 57.0 56.8 57.5 0.7 58.7

Stock Movements
78 OPEC Monthly Oil Market Report – June 2014
EU plus Norway Preliminary data for April shows that European stocks rose slightly by 0.5 mb to stand at 1,070.9 mb. At this level, they were 12.9 mb or 1.2% lower than the same time one year ago, and are 41.5 mb or 3.7% below the latest five-year average. The total stock-build came from crude which rose by 3.1 mb, while products declined by 2.7 mb. European crude inventories rose in April for the third consecutive month to stand at 471.4 mb. With this stock build, crude inventories stood at 6.0 mb or 1.3% above the same period a year earlier, but are in line with the latest five-year average. The build in crude oil inventories came mainly from higher North Sea supply. An increase in refinery throughputs of around 100,000 b/d limited a further build in crude oil stocks. Crude runs averaged 9.83 mb/d in April, around 400 tb/d lower than the same period a year ago. Graph 9.2: EU-15 plus Norway’s total oil stocks
OECD Europe’s product stocks fell by 2.7 mb in April following a drop in the previous two months. At 599.6.0 mb, product stocks were 18.9 mb or 3.1% below the same level one year ago and 41.8 mb or 6.5% below the seasonal norm. Within products the picture was mixed; distillate stocks rose, while gasoline, residual fuel oil and naphtha stocks saw a drop. Distillate stocks rose by 3.0 mb in April — reversing two consecutive months of draw — to stand at 391.5 mb. With this build, distillate stocks indicated a surplus of 10.3 mb or 2.7% below one year ago, but remained 1.4 mb or 0.4% below the five-year average. The build came from higher refinery output. Mild weather resulting in weaker domestic demand for heating oil also supported a distillate stock-build. At the same time, rising imports of diesel from US and the former Soviet Union (FSU) are keeping distillate inventories higher. In contrast, gasoline stocks fell by 3.2 mb, reversing a build of the last three months to end April at 110.3 mb. At this level, gasoline stocks showed a deficit of 6.3 mb or 5.4% below one year ago and 2.6 mb or 2.3% less than the seasonal norm. The drop in gasoline stocks mainly reflects higher exports to the US to meet strong demand in the country. Residual fuel oil stocks also fell by 2.0 mb in April to end the month at 74.0 mb. At this level, they were 17.3 mb or 19.0% below the same time a year ago and 27.3 mb or 27.0% less than the seasonal average. The fall in residual fuel oil could be attributed to an increase in exports, mainly to Singapore. Naphtha stocks fell by 0.4 mb in April to
1,040
1,060
1,080
1,100
1,120
1,140
1,160
1,180
1,040
1,060
1,080
1,100
1,120
1,140
1,160
1,180
Jan Feb Mar Apr May Jun Jul Aug Sep Oct Nov Dec
mbmb
2013 2014 Average 2009-13
Max/Min2009-2013
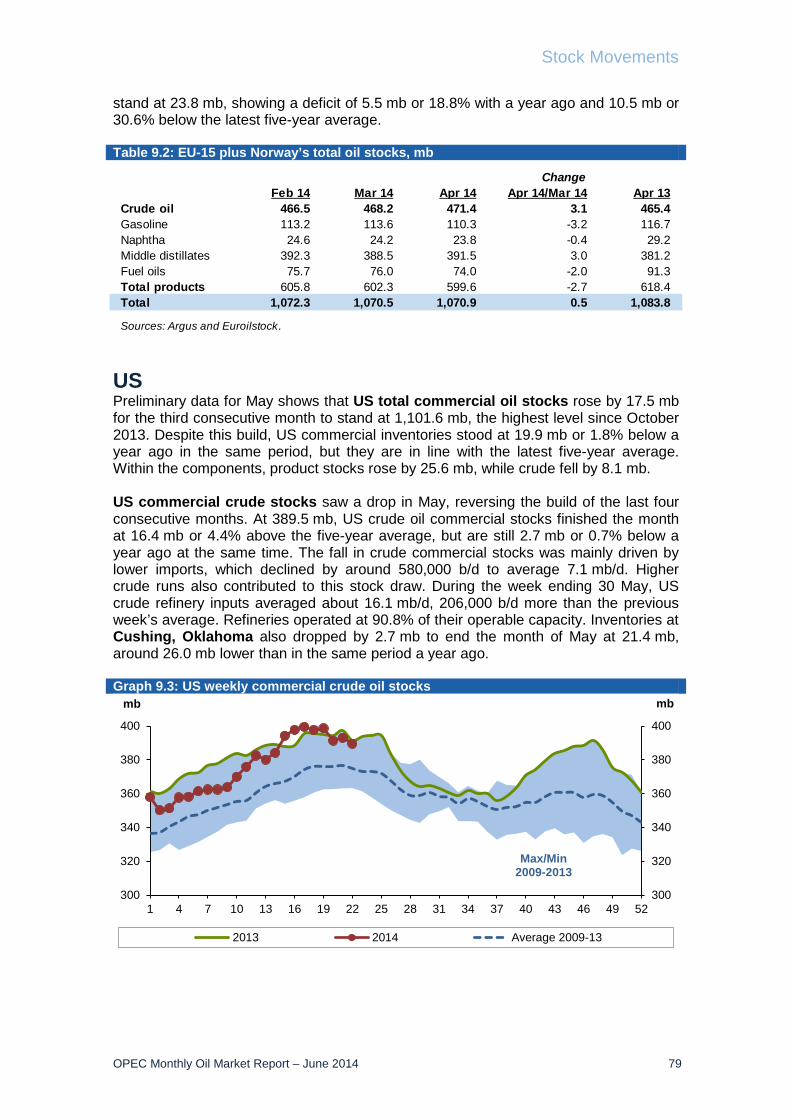
Stock Movements
OPEC Monthly Oil Market Report – June 2014 79
stand at 23.8 mb, showing a deficit of 5.5 mb or 18.8% with a year ago and 10.5 mb or 30.6% below the latest five-year average. Table 9.2: EU-15 plus Norway’s total oil stocks, mb
US Preliminary data for May shows that US total commercial oil stocks rose by 17.5 mb for the third consecutive month to stand at 1,101.6 mb, the highest level since October 2013. Despite this build, US commercial inventories stood at 19.9 mb or 1.8% below a year ago in the same period, but they are in line with the latest five-year average. Within the components, product stocks rose by 25.6 mb, while crude fell by 8.1 mb. US commercial crude stocks saw a drop in May, reversing the build of the last four consecutive months. At 389.5 mb, US crude oil commercial stocks finished the month at 16.4 mb or 4.4% above the five-year average, but are still 2.7 mb or 0.7% below a year ago at the same time. The fall in crude commercial stocks was mainly driven by lower imports, which declined by around 580,000 b/d to average 7.1 mb/d. Higher crude runs also contributed to this stock draw. During the week ending 30 May, US crude refinery inputs averaged about 16.1 mb/d, 206,000 b/d more than the previous week’s average. Refineries operated at 90.8% of their operable capacity. Inventories at Cushing, Oklahoma also dropped by 2.7 mb to end the month of May at 21.4 mb, around 26.0 mb lower than in the same period a year ago. Graph 9.3: US weekly commercial crude oil stocks
300
320
340
360
380
400
300
320
340
360
380
400
1 4 7 10 13 16 19 22 25 28 31 34 37 40 43 46 49 52
mbmb
2013 2014 Average 2009-13
Max/Min2009-2013
ChangeFeb 14 Mar 14 Apr 14 Apr 14/Mar 14 Apr 13
Crude oil 466.5 468.2 471.4 3.1 465.4Gasoline 113.2 113.6 110.3 -3.2 116.7Naphtha 24.6 24.2 23.8 -0.4 29.2Middle distillates 392.3 388.5 391.5 3.0 381.2Fuel oils 75.7 76.0 74.0 -2.0 91.3Total products 605.8 602.3 599.6 -2.7 618.4Total 1,072.3 1,070.5 1,070.9 0.5 1,083.8
Sources: Argus and Euroilstock.

Stock Movements
80 OPEC Monthly Oil Market Report – June 2014
Total product stocks rose by 25.6 mb in May for the second consecutive month to stand at 389.5 mb. At this level, US product stocks still remained at 17.2 mb or 2.4% below a year ago at the same time, showing a deficit of 15.6 mb or 2.1% below the seasonal norm. With the exception of gasoline, all other products experienced builds. Graph 9.4: US weekly gasoline stocks
Gasoline stocks declined by 1.4 mb in May for the fourth consecutive month to stand at 211.8 mb. At this level, gasoline stocks were 10.0 mb or 4.5% lower than in the same period a year ago, but remained in line with the latest five-year average. The total drop in US gasoline came mainly from higher gasoline demand as it increased by 580 tb/d to stand at 9.1 mb/d. Higher gasoline output limited a further drop in gasoline stocks. Distillate stocks rose by 4.1 mb in May, reversing the stock draw in the last month to stand at 118.1 mb. At this level, distillate stocks were 4.1 mb or 3.3% below a year ago and remained 21.0 mb or 15.1% lower than the seasonal average. The build in middle distillate stocks came mainly from higher output, which increased by around 150 tb/d to average 5.0 mb/d. The increase in distillate apparent demand limited a further drop in distillate stocks. Table 9.3: US onland commercial petroleum stocks, mb
Residual fuel oil stocks rose by 2.5 mb to end May at 38.3 mb, which is 0.5 mb or 3.3% lower than a year ago and 0.2 mb or 0.6% below the seasonal norm. Jet fuel stocks remained almost unchanged in May from the last month. At 39.1 mb, jet fuel stocks stood at 1.7 mb or 4.3% compared to the same month a year ago and 3.2 mb or 7.5 % below the latest five-year average.
175
185
195
205
215
225
235
245
175
185
195
205
215
225
235
245
1 4 7 10 13 16 19 22 25 28 31 34 37 40 43 46 49 52
mbmb
2013 2014 Average 2009-13
Max/Min2009-2013
ChangeMar 14 Apr 14 May 14 May 14/Apr 14 May 13
Crude oil 383.7 397.6 389.5 -8.1 392.3Gasoline 220.9 213.2 211.8 -1.4 221.7Distillate fuel 115.3 114.0 118.1 4.1 122.2Residual fuel oil 36.4 35.8 38.3 2.5 38.9Jet fuel 36.0 39.1 39.1 0.0 40.8Total 1,057.1 1,084.1 1,101.6 17.5 1,121.5SPR 695.9 692.9 691.0 -1.9 696.0
Source: US Department of Energy’s Energy Information Administration.

Stock Movements
OPEC Monthly Oil Market Report – June 2014 81
Japan In Japan, total commercial oil stocks rose by 3.2 mb in April, following a drop in the previous two months to stand at 150.7 mb. Despite this build, Japanese oil inventories are 18.6 mb or 11% below what they were a year ago and 22.4 mb or 12.9% lower than the five-year average. Within components, crude and products rose by 0.5 mb and 2.7 mb, respectively. Japanese commercial crude oil stocks rose in April for the second consecutive month to stand at 90.7 mb. At this level, they are still 8.4 mb or 8.5% below a year ago at the same time, remaining 11.5 mb or 11.2% below the five-year average. The stock build in crude oil was driven by lower crude runs, which fell by around 253,000 b/d or 7.0%, to average nearly 3.4 mb/d. This level was 3.7% lower than the previous year at the same time. Lower crude oil imports limited a further build in crude oil stocks. Indeed, crude oil imports fell by 300,000 b/d or 7.8% to average 3.5 mb/d. At this level, they were also 4.3% less than the same period a year ago. Direct crude burning in power plants declined by nearly 3.5% in April compared with the previous month, averaging 183 tb/d, and showing a decline of 10.9% over the same period a year ago. Graph 9.5: Japan’s commercial oil stocks
Japan’s total product inventories rose by 2.7 mb in April, reversing the fall of the previous two months. At 60.0 mb, product stocks showed a deficit of 10.2 mb or 14.6% compared with one year ago at the same time and remained below the five-year average by a deficit of 10.9 mb or 15.4%. A fall in domestic oil sales was behind the build in product inventories. Indeed, Japanese oil product sales fell by almost 660,000 b/d to average 2.96 mb/d in April and stood 4.6% below one year earlier at the same time. All products witnessed a stock build, with the exception of naphtha. Gasoline stocks rose by 1.1 mb in April, reversing the build of the previous month to stand at 12.8 mb, which is 1.4 mb or 9.8% less than the same time a year earlier and 1.9 mb or 12.% below the five-year average. A decline of 18.5% in domestic sales, combined with a strong increase in exports, was behind the stock build. Distillate stocks also rose by 2.8 mb in April, reversing the fall of the previous seven consecutive months. At 24.0 mb, distillate stocks are 5.6 mb or 18.8% below the same period a year ago and 4.0 mb or 14.3% lower than the seasonal average. All distillate components experienced a build in April. Jet fuel inventories rose by 19.6% on the back of weaker domestic sales, which fell by almost 20% in April, when compared with the previous month. Kerosene stocks also rose by 9.6%, driven by lower domestic
140
150
160
170
180
190
140
150
160
170
180
190
Jan Feb Mar Apr May Jun Jul Aug Sep Oct Nov Dec
mbmb
2013 2014 Average 2009-13
Max/Min2009-2013

Stock Movements
82 OPEC Monthly Oil Market Report – June 2014
sales due to mild weather. Gasoil inventories went up by 13.5% on the back of a decline of nearly 20% in inland consumption. Total residual fuel oil stocks rose by 0.5 mb to end the month of April at 15.2 mb, which is 0.9 mb or 5.8% less than a year ago and 1.8 mb or 10.5% lower than the five-year average. Within fuel oil components, fuel oil A stocks rose by 4.0%, and fuel oil B.C stocks increased by 2.8%. This build in residual oil could be attributed to lower domestic sales combined with higher imports. Naphtha stocks fell by 1.7 mb, finishing the month of April at 8.0 mb, indicating a deficit of 2.4 mb or 23.0% compared with a year ago and 3.2 mb or 29.0% below the seasonal norm. The stock draw came from higher domestic sales, which rose by 1.0% combined with lower output, which declined by nearly 13% in April from the previous month. Table 9.4: Japan’s commercial oil stocks*, mb
China The latest information for April showed Chinese total oil commercial inventories fell by 4.5 mb for the second consecutive month to stand at 406.1 mb. At this level, inventories were nearly 26 mb above one year ago at the same time. Within the components, commercial crude rose by 1.3 mb, while product stocks fell by 5.9 mb. The build in crude commercial stocks to a level of 242.1 mb came mainly from higher crude imports in April, which rose by 1.3 mb/d from March to average 6.8 mb/d. Lower refinery runs also contributed to the build in crude stocks. In contrast, total product stocks in China went down in April to stand at 163.9 mb, but still represented a surplus of 4.2 mb from a year ago at the same time. Higher apparent demand was behind the drop in product stocks. Within the products, the picture was mixed; diesel indicated a strong drop of 5.2 mb to end April at 81.2 mb, kerosene stocks also fell by 0.6 mb to stand at 15.3 mb, while gasoline inventories rose by 0.5 mb, ending April at 67.5 mb.
ChangeFeb 14 Mar 14 Apr 14 Apr 14/Mar 14 Apr 13
Crude oil 88.8 90.2 90.7 0.5 98.9Gasoline 13.0 11.7 12.8 1.1 14.2Naphtha 8.0 9.7 8.0 -1.7 10.4Middle distillates 25.6 21.2 24.0 2.8 29.6Residual fuel oil 12.8 14.7 15.2 0.5 16.1Total products 59.3 57.3 60.0 2.7 70.3Total** 148.1 147.5 150.7 3.2 169.1
* At end of month.** Includes crude oil and main products only.Source: Ministry of Economy, Trade and Industry, Japan.

Stock Movements
OPEC Monthly Oil Market Report – June 2014 83
Table 9.5: China’s commercial oil stocks, mb
Singapore and Amsterdam-Rotterdam-Antwerp (ARA) At the end of April, product stocks in Singapore rose by 3.6 mb, reversing the drop of the previous month to stand at 45.8 mb. Within this build, product stocks in Singapore represented a surplus of 6.5 mb or 16.5% over the same period the previous year. All products experienced a build. Light distillate stocks rose by 1.1 mb in April, reversing the drop of the previous month to stand at 12.3 mb. At this level, stocks stood 2.0 mb or 19.5% higher than one year ago during the same period. Middle distillates stocks also rose by 1.0 mb, ending April at 11.1 mb, remaining 0.9 mb or 8.9% above one year ago in the same period. Residual fuel oil stocks rose by 1.5 mb in April following two months of builds. At 22.4 mb, residual fuel oil stocks remained 3.6 mb or 18.9% above the same period one year ago. Product stocks in Amsterdam-Rotterdam-Antwerp (ARA) fell by 0.9 mb in April for the third consecutive month to stand at 29.0 mb. At this level, product stocks in ARA were 4.9 mb or 14.6% below one year ago at the same time. Within products, the picture was mixed, as naphtha, gasoil and residual fuel oil experienced builds, while gasoline and jet fuel oil both saw a drop. Gasoline stocks fell by 2.3 mb in April to stand at 6.9 mb, which is 1.6 mb or 18.7% lower than the same period a year earlier. This stock draw was driven by lower arrivals in the storage hub. Jet fuel stocks also fell by 0.2 mb to stand at 2.9 mb, 0.1 mb or 2.4% lower than a year ago at the same time. In contrast, gasoil inventories rose by 0.1 mb in April reversing the build of last month to stand at 12.2 mb. At this level, they were 4.3 mb or 26.3% below last year at the same time. The build came mainly from higher imports combined with lower inland consumption. Naphtha stocks rose by 0.7 mb in April, following a build of 0.8 mb in March. At 2.3 mb, naphtha stocks are 1.4 mb higher than a year ago at the same time. Fuel oil stocks rose by 0.8 mb, reversing the drop of the last two months to end April at 4.8 mb, still indicating a deficit of 0.4 mb or almost 6.8%.
ChangeFeb 14 Mar 14 Apr 14 Apr 14/Mar 14 Apr 13
Crude oil 247.7 240.8 242.1 1.3 220.9Gasoline 65.8 67.0 67.5 0.5 63.1Diesel 92.1 86.9 81.2 -5.7 83.0Jet kerosene 15.2 15.9 15.3 -0.6 13.6Total products 173.1 169.8 163.9 -5.9 159.7Total 420.8 410.6 406.1 -4.5 380.6
Source: OPEC Secretariat analysis.

Balance of Supply and Demand
84 OPEC Monthly Oil Market Report – June 2014
Balance of Supply and Demand Demand for OPEC crude in 2013 remained unchanged from the previous report to stand at 30.1 mb/d, which is 0.4 mb/d lower than the 2012 level. Demand for OPEC crude in 2014 also experienced a downward revision of 0.1 mb/d to average 29.4 mb/d, some 0.4 mb/d below the previous year. Estimate for 2013 Demand for OPEC crude for 2013 was unchanged from the previous month with all the quarters remaining unchanged. The demand for OPEC crude stood at 30.1 mb/d in 2013, representing a decrease of 0.4 mb/d from the previous year. The first quarter was 0.2 mb/d higher than the same period in 2012, while the second was lower by 0.1 mb/d. The third and the fourth quarters saw a contraction of 0.7 mb/d and 0.8 mb/d, respectively. Table 10.1: Summarized supply/demand balance for 2013, mb/d
Forecast for 2014 Demand for OPEC crude for 2014 was revised down by 0.1 mb/d from the previous report, reflecting the upward adjustment of non-OPEC supply as world oil demand and OPEC NGLs remained unchanged. All quarters were revised down by 0.1 mb/d. The demand for OPEC crude is projected at 29.7 mb/d in 2014, representing a decrease of 0.4 mb/d from last year’s level. The first and the second quarters are estimated to show a decline of 0.8 mb/d and 0.6 mb/d respectively versus the same period last year. The third quarter is expected to decline by 0.1 m/d, while the fourth is forecast to drop by 0.3 mb/d versus the same quarter last year. Table 10.2: Summarized supply/demand balance for 2014, mb/d
2012 1Q13 2Q13 3Q13 4Q13 2013(a) World oil demand 88.96 89.08 89.17 90.63 91.12 90.01 Non-OPEC supply 52.86 53.74 53.66 54.14 55.27 54.20 OPEC NGLs and non-conventionals 5.57 5.63 5.56 5.77 5.66 5.66(b) Total supply excluding OPEC crude 58.42 59.37 59.22 59.90 60.92 59.86
Difference (a-b) 30.53 29.71 29.95 30.72 30.20 30.15OPEC crude oil production 31.13 30.20 30.57 30.35 29.68 30.20Balance 0.60 0.49 0.62 -0.38 -0.52 0.05
Totals may not add up due to independent rounding.
2013 1Q14 2Q14 3Q14 4Q14 2014(a) World oil demand 90.01 90.15 90.20 91.92 92.27 91.14 Non-OPEC supply 54.20 55.56 55.14 55.46 56.41 55.64 OPEC NGLs and non-conventionals 5.66 5.71 5.77 5.84 5.91 5.81(b) Total supply excluding OPEC crude 59.86 61.27 60.91 61.29 62.32 61.45
Difference (a-b) 30.15 28.88 29.29 30.63 29.95 29.69
OPEC crude oil production 30.20 29.84Balance 0.05 0.96
Totals may not add up due to independent rounding.

Balance of Supply and Demand
OPEC Monthly Oil Market Report – June 2014 85
Graph 10.1: Balance of supply and demand
26
27
28
29
30
31
32
26
27
28
29
30
31
32
1Q13 2Q13 3Q13 4Q13 1Q14 2Q14 3Q14 4Q14
mb/dmb/d
OPEC crude production Required OPEC crude

86 OPEC Monthly Oil Market Report – June 2014
Table 10.3: World oil demand and supply balance, mb/d2010 2011 2012 1Q13 2Q13 3Q13 4Q13 2013 1Q14 2Q14 3Q14 4Q14 2014
World demand
OECD 47.0 46.5 46.0 45.9 45.4 46.1 46.3 45.9 45.8 45.2 46.0 46.2 45.8
Americas 24.1 24.0 23.6 23.7 23.8 24.2 24.1 24.0 23.9 23.9 24.4 24.3 24.1
Europe 14.7 14.3 13.8 13.2 13.8 13.9 13.5 13.6 13.0 13.5 13.7 13.4 13.4
Asia Pacific 8.2 8.2 8.6 8.9 7.8 8.1 8.6 8.4 8.9 7.7 7.9 8.5 8.2
DCs 26.5 27.3 28.2 28.5 28.8 29.4 29.0 28.9 29.3 29.6 30.4 29.8 29.8
FSU 4.2 4.3 4.4 4.3 4.2 4.6 4.8 4.5 4.4 4.2 4.6 4.9 4.5
Other Europe 0.6 0.6 0.6 0.6 0.6 0.6 0.7 0.6 0.6 0.6 0.6 0.7 0.6
China 9.0 9.4 9.7 9.8 10.2 9.9 10.4 10.1 10.1 10.5 10.3 10.7 10.4
(a) Total world demand 87.3 88.1 89.0 89.1 89.2 90.6 91.1 90.0 90.2 90.2 91.9 92.3 91.1
Non-OPEC supply
OECD 20.0 20.2 21.1 21.7 21.7 22.3 22.9 22.1 23.3 22.8 23.0 23.6 23.2
Americas 15.0 15.5 16.7 17.6 17.6 18.3 18.8 18.1 19.1 18.8 19.2 19.7 19.2
Europe 4.4 4.1 3.8 3.6 3.6 3.5 3.6 3.6 3.7 3.5 3.3 3.5 3.5
Asia Pacific 0.7 0.6 0.6 0.4 0.5 0.5 0.5 0.5 0.5 0.5 0.5 0.5 0.5
DCs 12.7 12.6 12.1 12.1 12.1 12.1 12.2 12.1 12.2 12.3 12.4 12.5 12.4
FSU 13.2 13.2 13.3 13.4 13.3 13.3 13.5 13.4 13.5 13.5 13.5 13.6 13.5
Other Europe 0.1 0.1 0.1 0.1 0.1 0.1 0.1 0.1 0.1 0.1 0.1 0.1 0.1
China 4.1 4.1 4.2 4.2 4.3 4.1 4.3 4.2 4.2 4.3 4.3 4.3 4.3
Processing gains 2.1 2.1 2.1 2.2 2.2 2.2 2.2 2.2 2.2 2.2 2.2 2.2 2.2
Total non-OPEC supply 52.4 52.4 52.9 53.7 53.7 54.1 55.3 54.2 55.6 55.1 55.5 56.4 55.6
OPEC NGLs + non-conventional oils 5.0 5.4 5.6 5.6 5.6 5.8 5.7 5.7 5.7 5.8 5.8 5.9 5.8
(b) Total non-OPEC supply and OPEC NGLs 57.3 57.8 58.4 59.4 59.2 59.9 60.9 59.9 61.3 60.9 61.3 62.3 61.5
OPEC crude oil production (secondary sources) 29.2 29.8 31.1 30.2 30.6 30.3 29.7 30.2 29.8
Total supply 86.6 87.6 89.6 89.6 89.8 90.3 90.6 90.1 91.1
Balance (stock change and miscellaneous) -0.7 -0.5 0.6 0.5 0.6 -0.4 -0.5 0.0 1.0
OECD closing stock levels (mb)
Commercial 2,679 2,606 2,664 2,665 2,660 2,700 2,565 2,565 2,570
SPR 1,565 1,536 1,547 1,582 1,578 1,583 1,584 1,584 1,586
Total 4,244 4,142 4,212 4,247 4,238 4,282 4,149 4,149 4,156
Oil-on-water 871 825 879 942 871 878 909 909 954
Days of forward consumption in OECD
Commercial onland stocks 58 57 58 59 58 58 56 56 57
SPR 34 33 34 35 34 34 35 35 35
Total 91 90 92 94 92 93 90 91 92
Memo items
FSU net exports 9.1 8.9 8.8 9.1 9.2 8.8 8.7 8.9 9.1 9.2 8.8 8.7 9.0
(a) - (b) 29.9 30.3 30.5 29.7 29.9 30.7 30.2 30.1 28.9 29.3 30.6 29.9 29.7
Note: Totals may not add up due to independent rounding.

OPEC Monthly Oil Market Report – June 2014 87
Table 10.4: World oil demand/supply balance: changes from last month's table* , mb/d2010 2011 2012 1Q13 2Q13 3Q13 4Q13 2013 1Q14 2Q14 3Q14 4Q14 2014
World demand
OECD - - - - - - - - - - - - -
Americas - - - - - - - - - - - - -
Europe - - - - - - - - -0.1 - - - -
Asia Pacific - - - - - - - - - - - - -
DCs - - - - - - - - - - - - -
FSU - - - - - - - - - - - - -
Other Europe - - - - - - - - - - - - -
China - - - - - - - - - - - - -
(a) Total world demand - - - - - - - - - - - - -
World demand growth - - - - - - - - - - - - -
Non-OPEC supply
OECD - - - - - - - - 0.1 0.1 0.1 0.1 0.1
Americas - - - - - - - - 0.1 0.1 0.1 0.1 0.1
Europe - - - - - - - - - - - - -
Asia Pacific - - - - - - - - - - - - -
DCs - - - - - - - - - - - - -
FSU - - - - - - - - - - - - -
Other Europe - - - - - - - - - - - - -
China - - - - - - - - - - - - -
Processing gains - - - - - - - - - - - - -
Total non-OPEC supply - - - - - - - - - 0.1 0.1 0.1 0.1
Total non-OPEC supply growth - - - - - - - - - 0.1 0.1 0.1 0.1
OPEC NGLs + non-conventionals - - - - - - - - - - - - -
(b) Total non-OPEC supply and OPEC NGLs - - - - - - - - - 0.1 0.1 0.1 0.1
OPEC crude oil production (secondary sources) - - - - - - - - -
Total supply - - - - - - - - -
Balance (stock change and miscellaneous) - - - - - - - - 0.1
OECD closing stock levels (mb)
Commercial - - - -20 -20 -19 -25 -25 -
SPR - - - 20 20 19 20 20 19
Total - - - - - - -6 -6 19
Oil-on-water - - - - - - - - -
Days of forward consumption in OECD
Commercial onland stocks - - - - - - -1 -1 -
SPR - - - - - - - - -
Total - - - - - - - - -
Memo items
FSU net exports - - - - - - - - - - - - -
(a) - (b) - - - - - - - - -0.1 -0.1 -0.1 -0.1 -0.1
* This compares Table 10.3 in this issue of the MOMR with Table 10.3 in the May 2014 issue. This table shows only where changes have occurred.

88 OPEC Monthly Oil Market Report – June 2014
Table 10.5: OECD oil stocks and oil on water at the end of period
2011 2012 2013 1Q12 2Q12 3Q12 4Q12 1Q13 2Q13 3Q13 4Q13 1Q14
Closing stock levels, mb
OECD onland commercial 2,606 2,664 2,565 2,657 2,688 2,730 2,664 2,665 2,660 2,700 2,565 2,570
Americas 1,308 1,365 1,315 1,335 1,362 1,385 1,365 1,349 1,377 1,402 1,315 1,307
Europe 905 902 868 943 913 917 902 904 873 885 868 875
Asia Pacific 392 397 382 379 413 428 397 413 409 413 382 388
OECD SPR 1,536 1,547 1,584 1,536 1,539 1,542 1,547 1,582 1,578 1,583 1,584 1,586
Americas 697 696 697 697 697 696 696 697 697 697 697 697
Europe 426 436 470 426 429 433 436 472 471 472 470 471
Asia Pacific 414 415 417 414 413 414 415 413 409 413 417 418
OECD total 4,142 4,212 4,149 4,194 4,227 4,272 4,212 4,247 4,238 4,282 4,149 4,156
Oil-on-water 825 879 909 787 812 844 879 942 871 878 909 954
Days of forward consumption in OECD
OECD onland commercial 57 58 56 58 59 59 58 59 58 58 56 57
Americas 55 57 55 57 57 58 58 57 57 58 55 55
Europe 66 66 65 68 66 67 68 65 63 66 66 65
Asia Pacific 46 47 46 47 50 49 44 53 51 48 43 50
OECD SPR 33 34 35 34 34 33 34 35 34 34 35 35
Americas 29 29 29 30 29 29 29 29 29 29 29 29
Europe 31 32 35 31 31 32 33 34 34 35 36 35
Asia Pacific 48 50 51 51 50 47 46 53 51 48 47 54
OECD total 90 92 91 92 92 92 92 94 92 93 91 92

OPEC Monthly Oil Market Report – June 2014 89
Table 10.6: Non-OPEC supply and OPEC natural gas liquids, mb/dChange Change
2010 2011 2012 3Q13 4Q13 2013 13/12 1Q14 2Q14 3Q14 4Q14 2014 14/13US 8.6 9.0 10.0 11.4 11.8 11.2 1.1 12.0 11.9 12.2 12.5 12.1 1.0Canada 3.4 3.5 3.8 4.0 4.1 4.0 0.2 4.2 4.1 4.2 4.3 4.2 0.2Mexico 3.0 2.9 2.9 2.9 2.9 2.9 0.0 2.9 2.8 2.8 2.8 2.8 -0.1OECD Americas* 15.0 15.5 16.7 18.3 18.8 18.1 1.3 19.1 18.8 19.2 19.7 19.2 1.1Norway 2.1 2.0 1.9 1.8 1.9 1.8 -0.1 2.0 1.8 1.7 1.9 1.8 0.0UK 1.4 1.1 1.0 0.8 0.9 0.9 -0.1 0.9 0.9 0.8 0.8 0.8 0.0Denmark 0.2 0.2 0.2 0.2 0.2 0.2 0.0 0.2 0.2 0.2 0.1 0.2 0.0Other OECD Europe 0.6 0.7 0.7 0.7 0.7 0.7 0.0 0.6 0.7 0.7 0.7 0.7 0.0OECD Europe 4.4 4.1 3.8 3.5 3.6 3.6 -0.2 3.7 3.5 3.3 3.5 3.5 -0.1Australia 0.6 0.5 0.5 0.4 0.4 0.4 -0.1 0.4 0.5 0.4 0.4 0.4 0.0Other Asia Pacific 0.1 0.1 0.1 0.1 0.1 0.1 0.0 0.1 0.1 0.1 0.1 0.1 0.0OECD Asia Pacific 0.7 0.6 0.6 0.5 0.5 0.5 -0.1 0.5 0.5 0.5 0.5 0.5 0.0Total OECD 20.0 20.2 21.1 22.3 22.9 22.1 1.1 23.3 22.8 23.0 23.6 23.2 1.0Brunei 0.2 0.2 0.2 0.1 0.1 0.1 0.0 0.1 0.1 0.1 0.1 0.1 0.0India 0.9 0.9 0.9 0.9 0.9 0.9 0.0 0.9 0.9 0.9 0.9 0.9 0.0Indonesia 1.0 1.0 1.0 0.9 0.9 0.9 0.0 0.9 0.9 0.9 0.9 0.9 0.0Malaysia 0.7 0.7 0.7 0.6 0.7 0.7 0.0 0.7 0.7 0.7 0.7 0.7 0.0Thailand 0.3 0.3 0.4 0.4 0.4 0.4 0.0 0.3 0.3 0.3 0.3 0.3 0.0Vietnam 0.4 0.4 0.4 0.4 0.4 0.4 0.0 0.4 0.4 0.4 0.4 0.4 0.0Asia others 0.2 0.2 0.2 0.2 0.2 0.2 0.0 0.2 0.2 0.2 0.2 0.2 0.0Other Asia 3.7 3.6 3.7 3.5 3.5 3.6 -0.1 3.6 3.5 3.6 3.5 3.6 0.0Argentina 0.7 0.7 0.7 0.7 0.7 0.7 0.0 0.7 0.7 0.7 0.7 0.7 0.0Brazil 2.7 2.6 2.6 2.6 2.7 2.6 0.0 2.7 2.7 2.8 2.9 2.8 0.2Colombia 0.8 0.9 1.0 1.0 1.0 1.0 0.1 1.0 1.1 1.0 1.1 1.0 0.0Trinidad & Tobago 0.1 0.1 0.1 0.1 0.1 0.1 0.0 0.1 0.1 0.1 0.1 0.1 0.0L. America others 0.3 0.3 0.3 0.3 0.3 0.3 0.0 0.3 0.3 0.3 0.3 0.3 0.0Latin America 4.6 4.7 4.7 4.8 4.8 4.8 0.1 4.8 4.9 5.0 5.1 5.0 0.2Bahrain 0.2 0.2 0.2 0.2 0.2 0.2 0.0 0.2 0.2 0.2 0.2 0.2 0.0Oman 0.9 0.9 0.9 0.9 0.9 0.9 0.0 0.9 1.0 1.0 1.0 1.0 0.0Syria 0.4 0.4 0.2 0.1 0.0 0.1 -0.1 0.0 0.0 0.0 0.0 0.0 0.0Yemen 0.3 0.2 0.2 0.1 0.1 0.1 0.0 0.1 0.2 0.2 0.2 0.1 0.0Middle East 1.8 1.7 1.5 1.4 1.3 1.4 -0.1 1.3 1.4 1.4 1.4 1.4 0.0Chad 0.1 0.1 0.1 0.1 0.1 0.1 0.0 0.1 0.1 0.1 0.1 0.1 0.0Congo 0.3 0.3 0.3 0.3 0.3 0.3 0.0 0.3 0.3 0.2 0.2 0.3 0.0Egypt 0.7 0.7 0.7 0.7 0.7 0.7 0.0 0.7 0.7 0.7 0.7 0.7 0.0Equatorial Guinea 0.3 0.3 0.3 0.3 0.3 0.3 0.0 0.3 0.3 0.3 0.3 0.3 0.0Gabon 0.3 0.3 0.2 0.2 0.2 0.2 0.0 0.2 0.2 0.2 0.2 0.2 0.0South Africa 0.2 0.2 0.2 0.2 0.2 0.2 0.0 0.2 0.2 0.2 0.2 0.2 0.0Sudans 0.5 0.4 0.1 0.3 0.3 0.2 0.1 0.3 0.3 0.4 0.4 0.3 0.1Africa other 0.2 0.3 0.3 0.3 0.3 0.3 0.0 0.3 0.4 0.4 0.4 0.4 0.0Africa 2.6 2.6 2.3 2.4 2.5 2.4 0.1 2.5 2.5 2.5 2.5 2.5 0.1Total DCs 12.7 12.6 12.1 12.1 12.2 12.1 0.0 12.2 12.3 12.4 12.5 12.4 0.2FSU 13.2 13.2 13.3 13.3 13.5 13.4 0.1 13.5 13.5 13.5 13.6 13.5 0.1 Russia 10.1 10.3 10.4 10.5 10.6 10.5 0.1 10.6 10.5 10.6 10.7 10.6 0.1 Kazakhstan 1.6 1.6 1.6 1.6 1.7 1.6 0.1 1.6 1.6 1.6 1.6 1.6 0.0 Azerbaijan 1.1 1.0 0.9 0.9 0.8 0.9 0.0 0.8 0.9 0.9 0.9 0.9 0.0 FSU others 0.4 0.4 0.4 0.4 0.4 0.4 0.0 0.4 0.4 0.4 0.4 0.4 0.0Other Europe 0.1 0.1 0.1 0.1 0.1 0.1 0.0 0.1 0.1 0.1 0.1 0.1 0.0China 4.1 4.1 4.2 4.1 4.3 4.2 0.1 4.2 4.3 4.3 4.3 4.3 0.0
Non-OPEC production 50.2 50.3 50.7 52.0 53.1 52.0 1.3 53.4 53.0 53.3 54.2 53.5 1.4
Processing gains 2.1 2.1 2.1 2.2 2.2 2.2 0.0 2.2 2.2 2.2 2.2 2.2 0.0Non-OPEC supply 52.4 52.4 52.9 54.1 55.3 54.2 1.3 55.6 55.1 55.5 56.4 55.6 1.4OPEC NGL 4.9 5.2 5.4 5.5 5.4 5.4 0.1 5.5 5.5 5.6 5.6 5.6 0.1OPEC non-conventional 0.1 0.1 0.2 0.2 0.2 0.2 0.0 0.2 0.2 0.3 0.3 0.3 0.0OPEC (NGL+NCF) 5.0 5.4 5.6 5.8 5.7 5.7 0.1 5.7 5.8 5.8 5.9 5.8 0.2Non-OPEC & OPEC (NGL+NCF) 57.3 57.8 58.4 59.9 60.9 59.9 1.4 61.3 60.9 61.3 62.3 61.5 1.6
* Chile has been included in OECD Americas.Notes: Totals may not add up due to independent rounding.

90 OPEC Monthly Oil Market Report – June 2014
Table 10.7: World Rig CountChange Change
2010 2011 2012 2013 13/12 2Q13 3Q13 4Q13 1Q14 Apr 14 May 14 May/AprUS 1,541 1,881 1,919 1,761 -158 1,761 1,769 1,758 1,780 1,835 1,859 24Canada 347 423 366 354 -12 154 348 379 526 203 162 -41Mexico 97 94 106 106 0 107 100 101 93 87 85 -2Americas 1,985 2,398 2,391 2,221 -170 2,023 2,217 2,238 2,400 2,125 2,106 -19Norway 18 17 17 20 2 19 21 18 17 21 18 -3UK 19 16 18 17 -1 17 16 14 15 20 19 -1Europe 94 118 119 135 16 133 140 133 135 151 149 -2Asia Pacific 21 17 24 27 3 28 24 25 28 28 25 -3Total OECD 2,100 2,532 2,534 2,383 -151 2,184 2,382 2,396 2,563 2,304 2,280 -24Other Asia 248 239 217 219 2 224 216 219 230 224 218 -6Latin America 205 195 180 166 -14 170 159 168 164 178 175 -3Middle East 156 104 110 76 -33 78 69 86 84 85 84 -1Africa 19 2 7 16 9 15 15 24 27 30 33 3Total DCs 628 540 513 477 -36 487 459 497 504 517 510 -7Non-OPEC rig count 2,727 3,072 3,047 2,860 -187 2,670 2,841 2,894 3,067 2,821 2,790 -31
Algeria 25 31 36 47 11 48 48 47 49 49 47 -2Angola 9 10 9 11 2 10 12 14 16 16 17 1Ecuador 11 12 20 26 6 26 27 26 25 25 27 2Iran** 52 54 54 54 0 54 54 54 54 54 54 0Iraq** 36 36 58 83 25 80 93 92 89 89 94 5Kuwait** 20 57 57 58 1 58 58 57 60 60 60 0Libya** 16 8 12 15 3 15 14 14 15 8 12 4Nigeria 15 36 36 37 1 40 34 36 35 33 31 -2Qatar 9 8 8 9 1 8 10 8 11 11 10 -1Saudi Arabia 67 100 112 114 3 114 111 115 125 129 132 3UAE 13 21 24 28 4 27 28 30 30 31 32 1Venezuela 70 122 117 121 3 122 121 121 121 113 117 4OPEC rig count 342 494 542 602 60 601 611 614 629 618 633 15
Worldwide rig count* 3,069 3,566 3,589 3,462 -127 3,271 3,452 3,508 3,696 3,439 3,423 -16of which: Oil 1,701 2,257 2,654 2,611 -43 2,490 2,595 2,631 2,819 2,661 2,665 4 Gas 1,325 1,262 886 746 -140 673 747 769 780 681 667 -14 Others 43 49 52 109 57 112 114 110 99 99 93 -6
Note: Totals may not add up due to independent rounding. * Excludes China and FSU.na: Not available. ** Estimated figure when Baker Hughes Incorporated did Sources: Baker Hughes Incorporated & Secretariat's estimates. not reported the data.

OPEC Monthly Oil Market Report – June 2014 91
Contributors to the OPEC Monthly Oil Market Report Editor-in-Chief Omar S. Abdul-Hamid, Director, Research Division email: [email protected] Editor Hojatollah Ghanimi Fard, Head, Petroleum Studies Department email: [email protected] Analysts Crude Oil Price Movements Eissa Alzerma
email: [email protected]
Commodity Markets Hector Hurtado email: [email protected]
World Economy Afshin Javan email: [email protected] Imad Alam Al-Deen email: [email protected] Joerg Spitzy email: [email protected]
World Oil Demand Hassan Balfakeih email: [email protected]
World Oil Supply Mohammad Ali Danesh email: [email protected]
Product Markets and Refinery Operations Elio Rodriguez email: [email protected]
Tanker Market and Oil Trade Anisah Almadhayyan email: [email protected]
Stock Movements Aziz Yahyai email: [email protected]
Technical and editorial team Aziz Yahyai email: [email protected] Douglas Linton email: [email protected]
Data services Adedapo Odulaja, Head, Data Services Department ([email protected]), Pantelis Christodoulides (World Oil Demand and Stock Movements), Klaus Stoeger (World Oil Supply), Harvir Kalirai (World Economy), Mouhamad Moudassir (Product Markets and Refinery Operations), Mohammed Sattar (Crude Oil Price Movements), Anna Gredinger (Tanker Market and Oil Trade) Editing, production, design and circulation Alvino-Mario Fantini, Maureen MacNeill, Scott Laury, Viveca Hameder, Hataichanok Leimlehner, Evelyn Oduro-Kwateng, Andrea Birnbach

92 OPEC Monthly Oil Market Report – June 2014
Disclaimer
The data, analysis and any other information contained in the Monthly Oil Market Report (the “MOMR”) is for informational purposes only and is not intended as a substitute for advice from your business, finance, investment consultant or other professional. The views expressed in the MOMR are those of the OPEC Secretariat and do not necessarily reflect the views of its Governing Bodies and/or individual OPEC Member Countries.
Whilst reasonable efforts have been made to ensure the accuracy of the MOMR’s content, the OPEC Secretariat makes no warranties or representations as to its accuracy, currency reference or comprehensiveness, and assumes no liability or responsibility for any inaccuracy, error or omission, or for any loss or damage arising in connection with or attributable to any action or decision taken as a result of using or relying on the information in the MOMR.
The MOMR may contain references to material(s) from third parties whose copyright must be acknowledged by obtaining necessary authorization from the copyright owner(s). The OPEC Secretariat shall not be liable or responsible for any unauthorized use of third party material(s). All rights of the Publication shall be reserved to the OPEC Secretariat, including every exclusive economic right, in full or per excerpts, with special reference but without limitation, to the right to publish it by press and/or by any communications medium whatsoever, including Internet; translate, include in a data base, make changes, transform and process for any kind of use, including radio, television or cinema adaptations, as well as sound-video recording, audio-visual screenplays and electronic processing of any kind and nature whatsoever.
Full reproduction, copying or transmission of the MOMR is not permitted in any form or by any means by third parties without the OPEC Secretariat’s written permission, however the information contained therein may be used and/or reproduced for educational and other non-commercial purposes without the OPEC Secretariat’s prior written permission, provided that OPEC is fully acknowledged as the copyright holder.

Next report to be issued on 10 July 2014.
OPEC Basket average price US$/b
May OPEC crude production mb/d, according to secondary sources
Economic growth rate per cent
up 1.17 in May
up 0.14 in May
May 2014 105.44
April 2014 104.27
Year to date 104.79
May 2014 29.76
April 2014 29.62
World OECD US Japan Euro-zone China India
2013 2.9 1.3 1.9 1.5 - 0.4 7.7 4.7
2014 3.4 2.0 2.4 1.3 1.0 7.5 5.6
Supply and demand mb/d
OECD commercial stocks mb
2013 12/13 2014 13/14
World demand 90.0 1.0 World demand 91.1 1.1
Non-OPEC supply 54.2 1.3 Non-OPEC supply 55.6 1.4
OPEC NGLs 5.7 0.1 OPEC NGLs 5.8 0.2
Difference 30.1 - 0.4 Difference 29.7 - 0.5
Feb 14 Mar 14 Apr 14 Apr 14/Mar 14 Apr 13Crude oil 1,253 1,274 1,292 17.4 1,308
Products 1,320 1,296 1,329 33.1 1,368
Total 2,573 2,570 2,621 50.5 2,677
Days of forward cover 57.0 56.8 57.5 0.7 58.7