Embed Size (px)
Citation preview
22
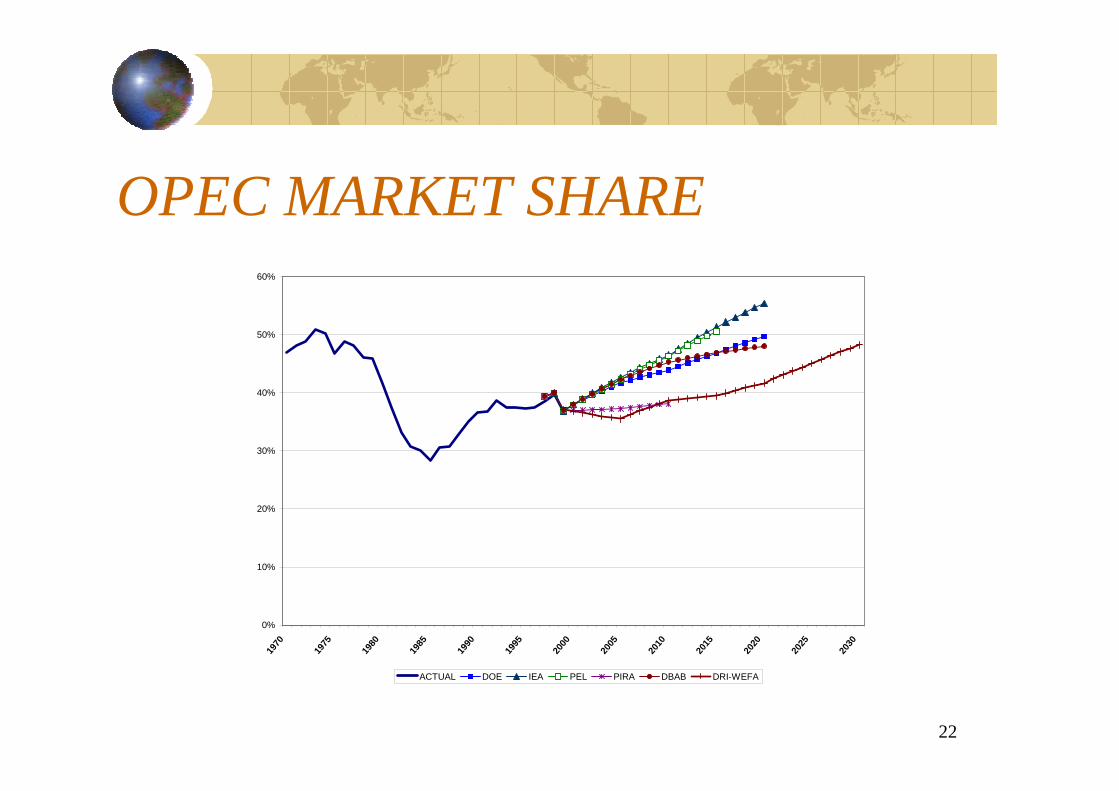
OPEC MARKET SHARE
0%
10%
20%
30%
40%
50%
60%19
70
1975
1980
1985
1990
1995
2000
2005
2010
2015
2020
2025
2030
ACTUAL DOE IEA PEL PIRA DBAB DRI-WEFA
23
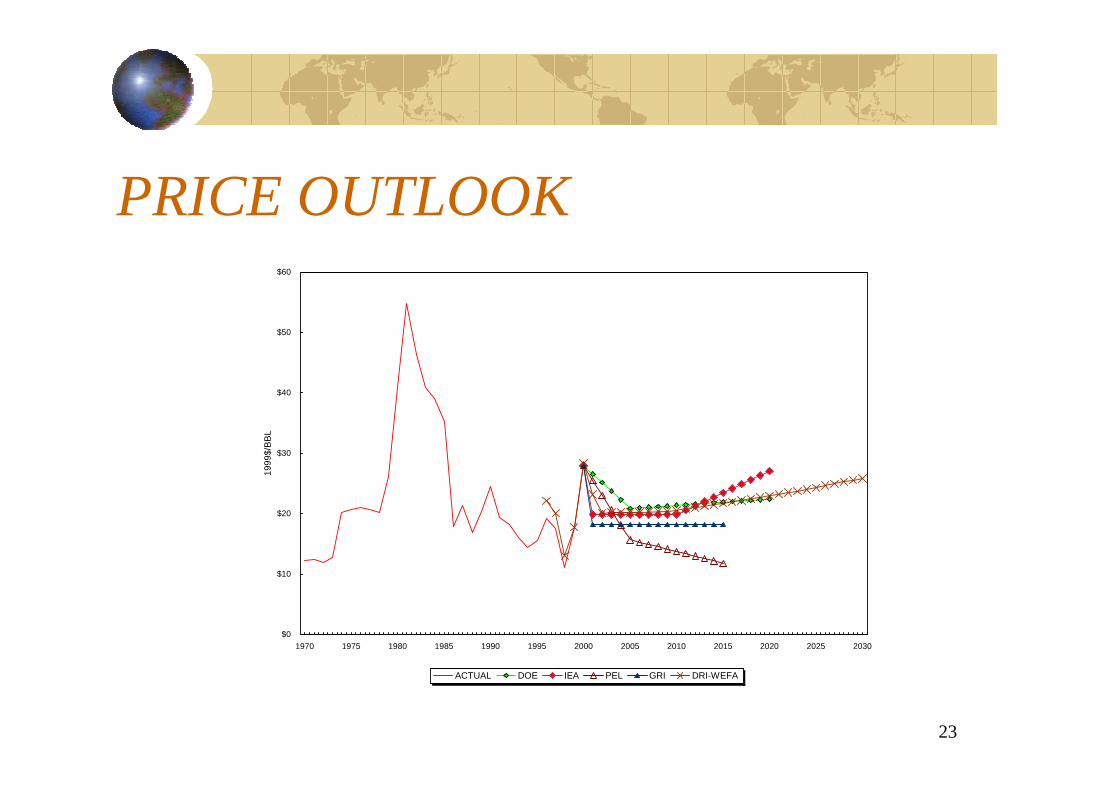
PRICE OUTLOOK
$0
$10
$20
$30
$40
$50
$60
1970 1975 1980 1985 1990 1995 2000 2005 2010 2015 2020 2025 2030
1999
$/BB
L
ACTUAL DOE IEA PEL GRI DRI-WEFA
24
OPEC MARKET SHAREDEMAND LEVEL
MACROECONOMY• LEVEL OF GROWTH• POTENTIAL FOR NEW SHOCKS
NON-OPEC SUPPLY• PRICE/MNOC INVESTMENT• DEEPWATER, FSU• GTL, TAR SANDS
OPEC INVESTMENTPOLITICAL REGIME (VENEZUELA OR ALGERIA?)
• APPLIES TO NON-OPEC TOO
25
IMPORTANCE OF POLITICS“…there is no guarantee that the current free-market orientation of economic ideology will not swing back towards the left and greater governmental interference in markets or ownership of industry….Also, though, continuing economic problems due to international debt, the recession, bank failures, etc., may cause...policymakers in many developing countries to abandon efforts at market reform.” Lynch 1991
26
SHORT-TERM MARKET OUTLOOK
FEARS OF TIGHTENING LATE IN 2002GOOD OPEC DISCIPLINEECONOMIC RECOVERY (?)
POSSIBLE NEW COLLAPSE?VENEZUELA, ALGERIA, NIGERIA CHEATINGRUSSIA, OTHER NON-OPEC SOARINGPRICE IMPACT ON DEMAND

27
USABLE COMMERCIAL INVENTORIES
6
8
10
12
14
16
18Ja
n-85
Jan-
86
Jan-
87
Jan-
88
Jan-
89
Jan-
90
Jan-
91
Jan-
92
Jan-
93
Jan-
94
Jan-
95
Jan-
96
Jan-
97
Jan-
98
Jan-
99
Jan-
00
Jan-
01
Jan-
02
DA
YS S
UPP
LY
Monthly 12-Mo. Avg.
28
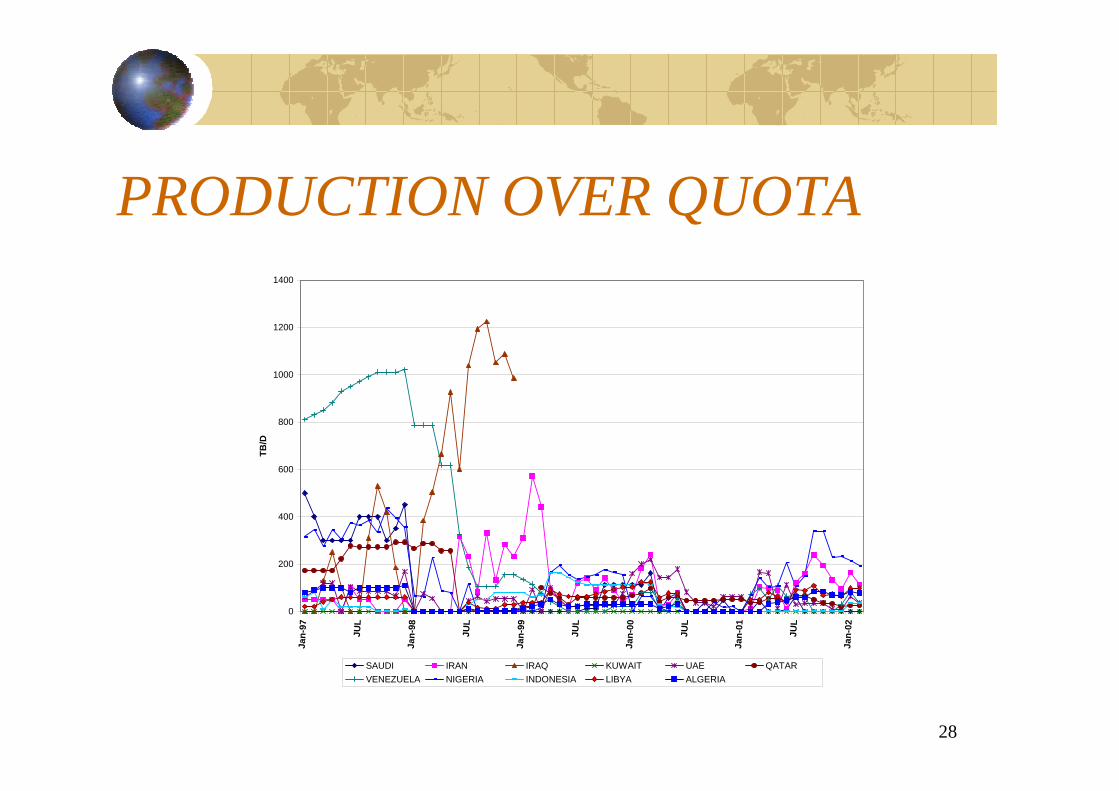
PRODUCTION OVER QUOTA
0
200
400
600
800
1000
1200
1400
Jan-
97
JUL
Jan-
98
JUL
Jan-
99
JUL
Jan-
00
JUL
Jan-
01
JUL
Jan-
02
TB/D
SAUDI IRAN IRAQ KUWAIT UAE QATARVENEZUELA NIGERIA INDONESIA LIBYA ALGERIA
29
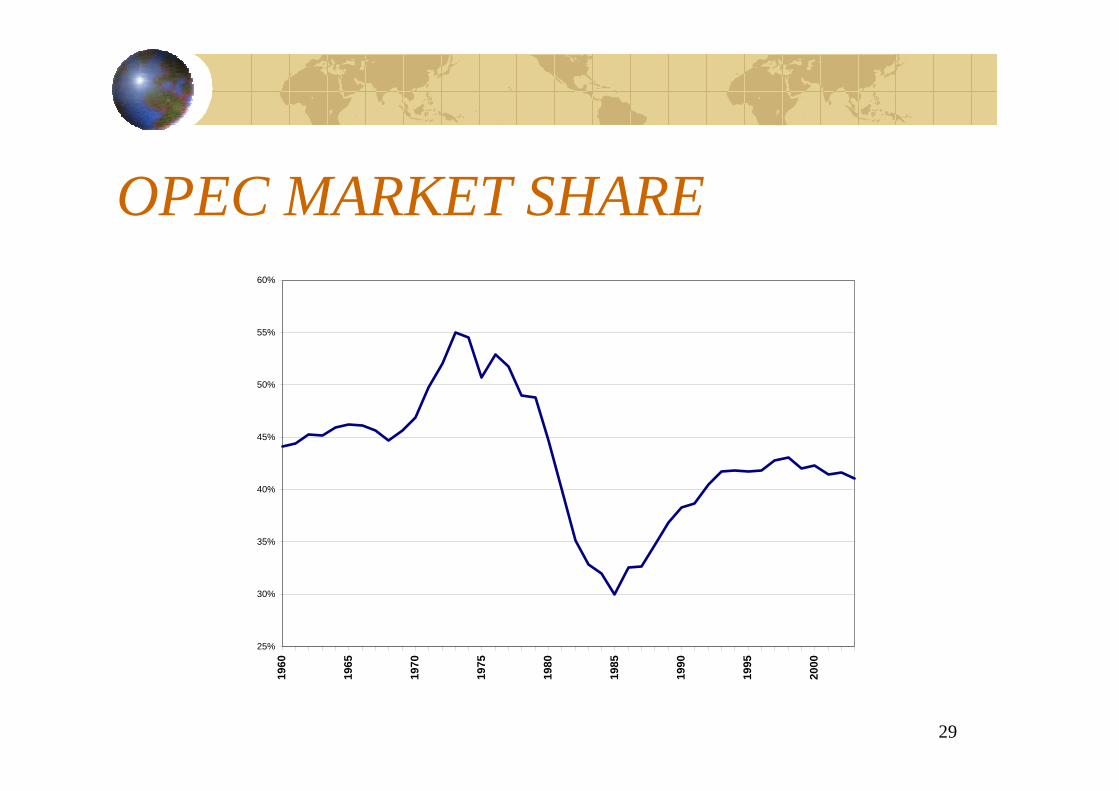
OPEC MARKET SHARE
25%
30%
35%
40%
45%
50%
55%
60%19
60
1965
1970
1975
1980
1985
1990
1995
2000

30
PAST AS PROLOGUE?VENEZUELAN BEHAVIOR UNDER GIUSTI
2000
2200
2400
2600
2800
3000
3200
3400
3600
Jan-
92
Jan-
93
Jan-
94
Jan-
95
Jan-
96
Jan-
97
Jan-
98
Jan-
99
TB/D
PRODUCTION QUOTA
31
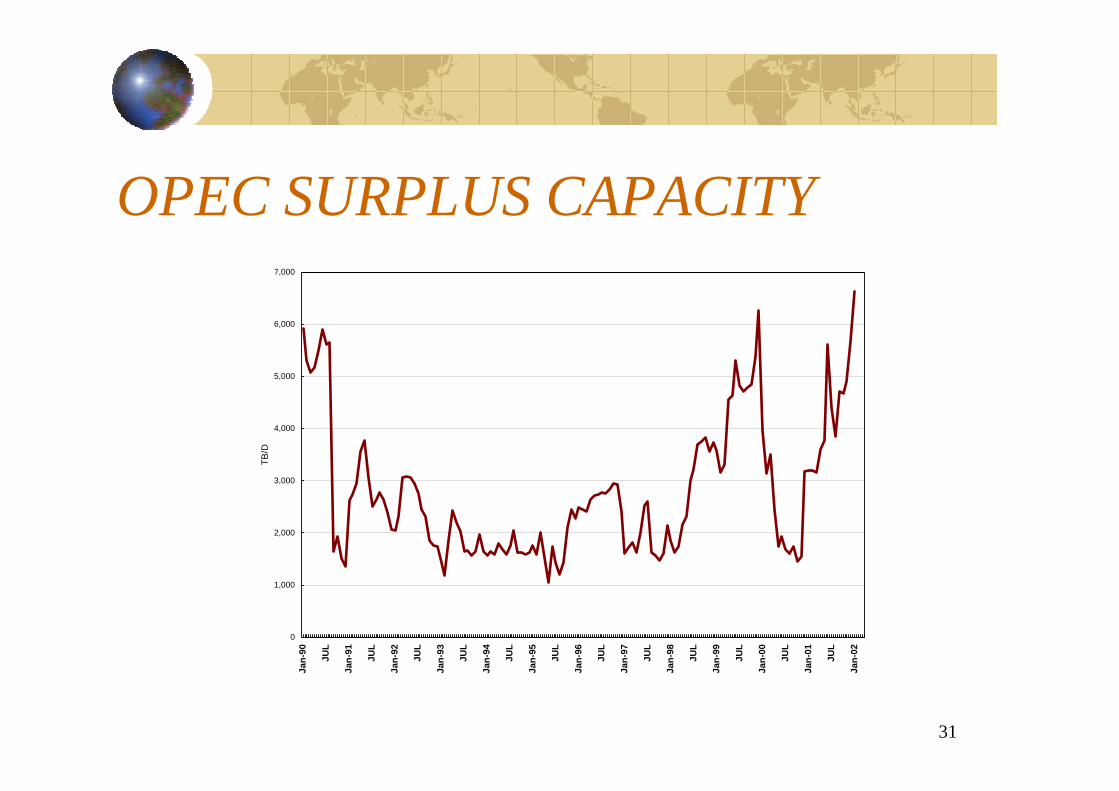
OPEC SURPLUS CAPACITY
0
1,000
2,000
3,000
4,000
5,000
6,000
7,000
Jan-
90
JUL
Jan-
91
JUL
Jan-
92
JUL
Jan-
93
JUL
Jan-
94
JUL
Jan-
95
JUL
Jan-
96
JUL
Jan-
97
JUL
Jan-
98
JUL
Jan-
99
JUL
Jan-
00
JUL
Jan-
01
JUL
Jan-
02
TB/D
32
17
19
21
23
25
27
29
31
33
Jan01
Mar01
May01
Jul01
Sep01
Nov01
Jan02
Mar02
May02
Jul02
Sep02
Nov02
Jan03
Mar03
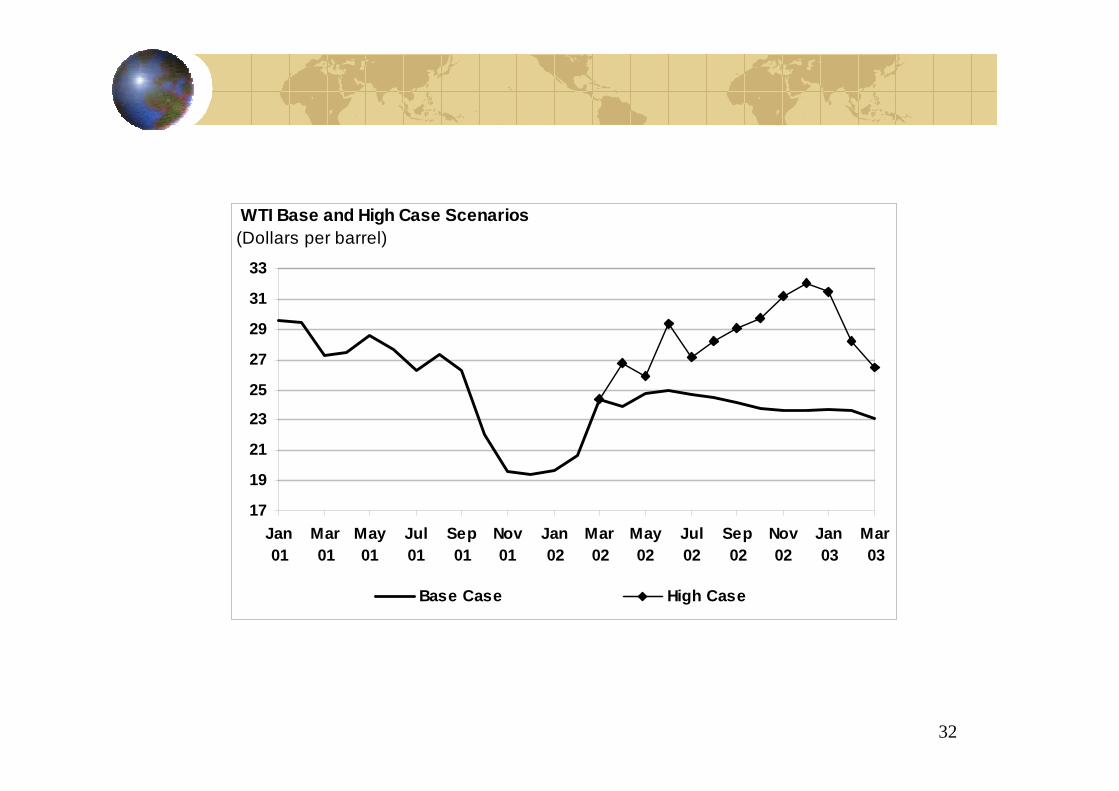
Base Case High Case
WTI Base and High Case Scenarios(Dollars per barrel)
33
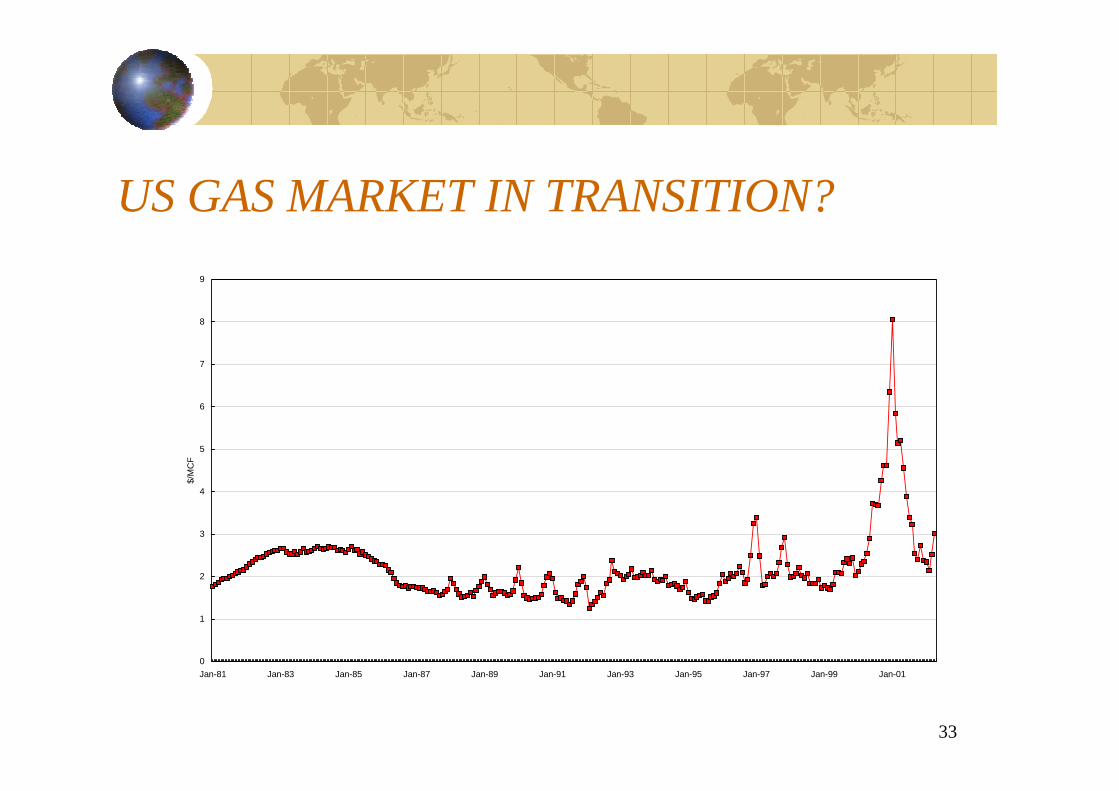
US GAS MARKET IN TRANSITION?
0
1
2
3
4
5
6
7
8
9
Jan-81 Jan-83 Jan-85 Jan-87 Jan-89 Jan-91 Jan-93 Jan-95 Jan-97 Jan-99 Jan-01
$/M
CF

34
US Decline Rates Have Increased
The evidence of serious supply constraints have been strong since 1996.
0%
5%
10%
15%
20%
25%
30%
14% 15% 17% 17% 18% 20% 23% 23% 26% 27% 28%
90 91 92 93 94 95 97 98 99 00 01
US Deliverability and Utilization
40
4244
4648
50
5254
5658
60
1987
1988
1989
1990
1991
1992
1993
1994
1995
1996
1997
1998
1999
Bcfd
70%
75%
80%
85%
90%
95%
100%
Deliverability
Deliverability Utilization
35
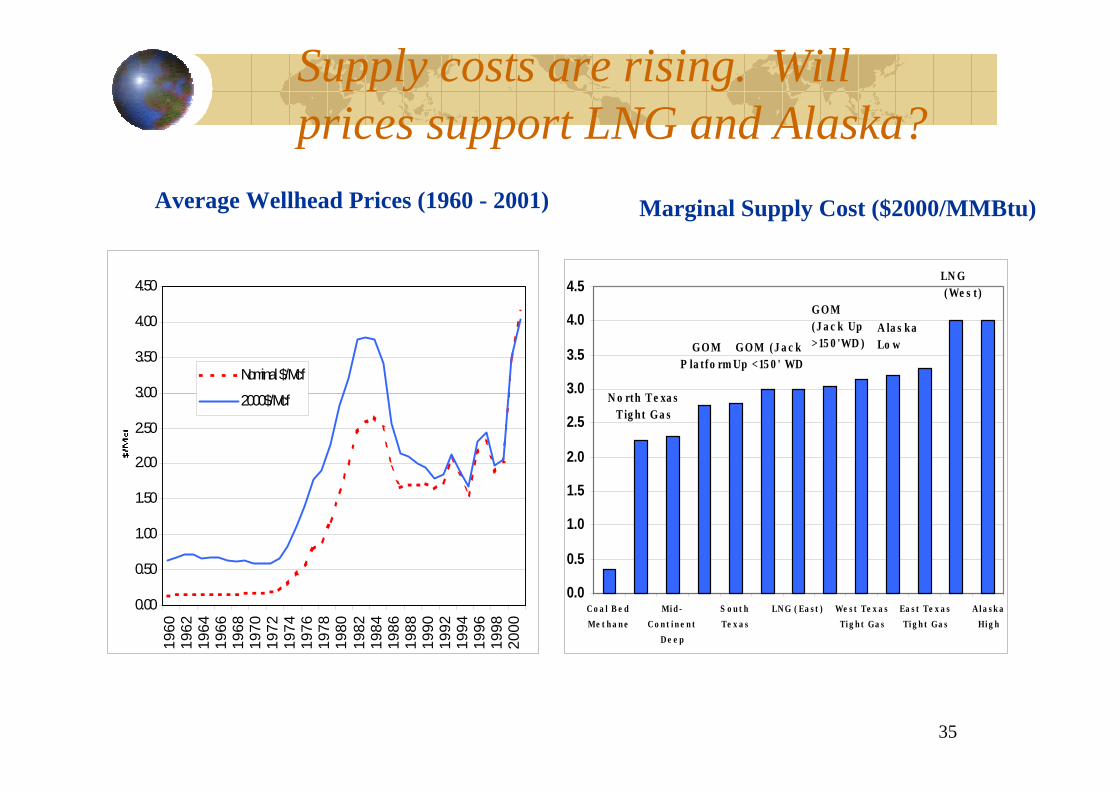
Supply costs are rising. Will prices support LNG and Alaska?
Average Wellhead Prices (1960 - 2001) Marginal Supply Cost ($2000/MMBtu)
0.00
0.50
1.00
1.50
2.00
2.50
3.00
3.50
4.00
4.50
1960
1962
1964
1966
1968
1970
1972
1974
1976
1978
1980
1982
1984
1986
1988
1990
1992
1994
1996
1998
2000
Nominal $/Mcf
2000$/Mcf
0.0
0.5
1.0
1.5
2.0
2.5
3.0
3.5
4.0
4.5
C o a l B e dMe t h a n e
Mi d -C o n t i n e n t
D e e p
S o u t hTe x a s
LN G ( Ea s t ) We s t Te x a sTi g h t Ga s
Ea s t Te x a sTi g h t Ga s
A l a s k aHi g h
N o rth Te xa s Tig ht Ga s
GOM P la t fo rm
GOM (J a c kUp <15 0 ' WD
GOM (J a c k Up >15 0 'WD )
A la s ka Lo w
LN G (We s t )
36
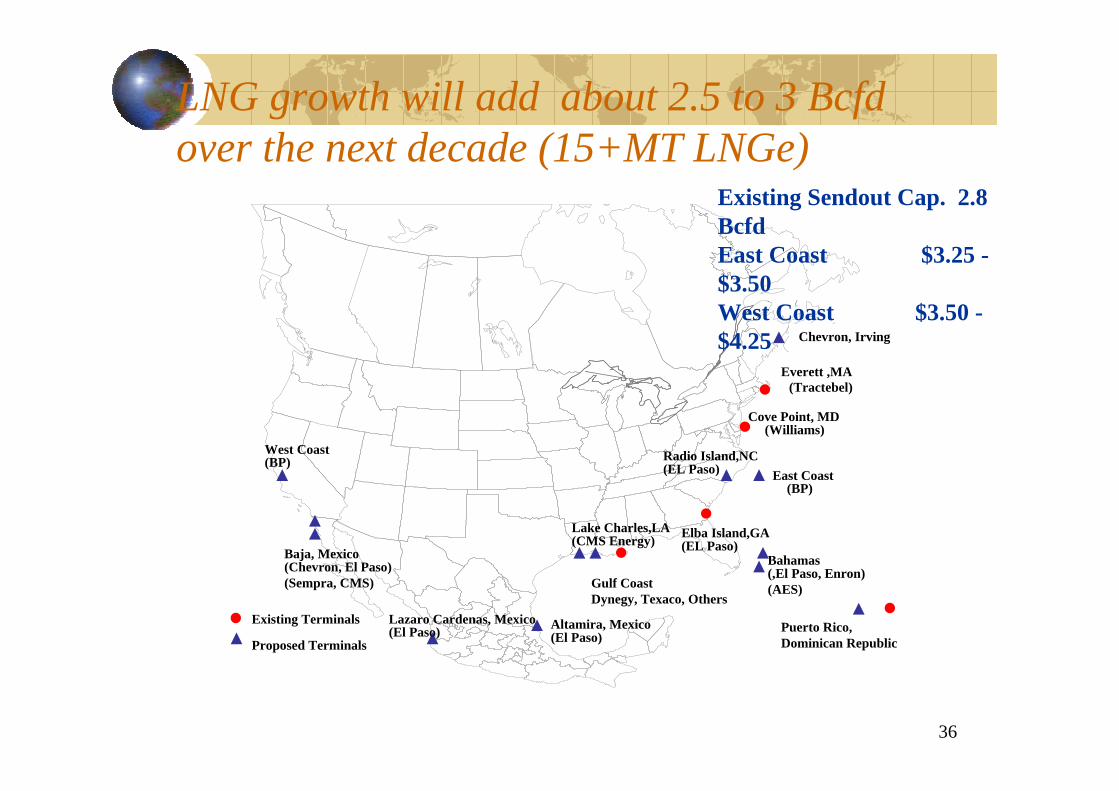
LNG growth will add about 2.5 to 3 Bcfdover the next decade (15+MT LNGe)
Chevron, Irving
Everett ,MA(Tractebel)
Cove Point, MD(Williams)
East Coast(BP)
Radio Island,NC(EL Paso)
Elba Island,GA(EL Paso)
Bahamas(,El Paso, Enron)(AES)
Lake Charles,LA(CMS Energy)
Altamira, Mexico(El Paso)
Lazaro Cardenas, Mexico(El Paso)
West Coast(BP)
Baja, Mexico(Chevron, El Paso)(Sempra, CMS)
Existing Terminals
Proposed TerminalsPuerto Rico, Dominican Republic
Gulf CoastDynegy, Texaco, Others
Existing Sendout Cap. 2.8BcfdEast Coast $3.25 -$3.50West Coast $3.50 -$4.25

37
Demand side response will limit gas price increases
Delivered Gas Prices that Make Coal Competitive
Conventional Coal $3.80 delivered.
New Source Review
Refurbished coal capacity is competitive at $2.70 per MMBtudelivered (10% capacity increase).
Transport reactor is being tested using oil cracking technology to gasify coal.
3.80
3.20
2.70
2.00
2.20
2.40
2.60
2.80
3.00
3.20
3.40
3.60
3.80
4.00
ConventionalCoal
TransportReactor
RefurbishedCoal
$/M
MBt
u

38
US Natural Gas Use in Ammonia Production Decreases With High Gas Prices in 2000 and 2001 (Bcf/day)
0
0.5
1
1.5
2
1994 1995 1996 1997 1998 1999 2000 2001

39
Gas consumption for power generationis a major source of growth and uncertainty
Gas consumption for power generation is the major source of growth (60% of total).Since gas is the marginal fuel, slight changes in generation from other fuels or changes in the electric power growth rate has a major impact.Projected growth rates for power generation range from 1.8% to 2.8% per year.Scenarios range from optimism to pessimism about coal, nuclear, and power growth rates.
Annual Growth 2000-10
0
500
1000
1500
2000
Shakeout Reference Crunch
MMcf
d
Power Total
2010 Gas Consumpton
24
25
26
27
28
29
30
Shakeout Reference Crunch
Trill
ion
Btu

40
Both supply and demand side uncertainties create a great deal of uncertainty
Prices in 2010 ($1.90 to $3.65 per MMBtu)Need to develop deep wells offshore and onshore, LNG terminals will have to be builtGrowth in supply depends on new discoveriesDemand response
Coal fired plants are likely to play a larger role than many projectIncreased efficiency in industrial sector
Environmental Regulations
$2000/MMBtu2000
(Actual) 2005 2010 2015 2020
AEO 3.69 2.48 2.67 2.81 3.11AGA 3.69 2.39 2.46 2.55DRI*WEFA 3.69 2.91 2.95 3.07 3.16GRI 3.69 2.12 2.09 2.00NPC (Ref) 3.69 2.64 3.13 3.67NPC (High) 3.69 2.90 3.65 4.37NPC (Low) 3.69 2.26 2.28 3.07NRCan* 3.69 2.12 2.12
Average 2.53 2.94 3.08 2.80Deflator 1.00 1.14 1.26 1.41 1.57* Forecast were developed in 1999.
Average Wellhead Prices

41
CONCLUSION (1):THINGS HAVE CHANGED
MARKETS TIGHTER THAN BEFORECAPACITY UTILIZATION VERY HIGH COMPARED TO 1980S, EARLY 1990S
OPEC MORE COHESIVEPOLITICAL TREND REVERBERATING TOWARDS INTERVENTION IN MARKETS
42
CONCLUSION (2):THE MORE THEY ARE THE SAME
PRICE EFFECTS STILL POWERFULAND UNDERESTIMATED
GOVERNMENTS NOT AS BAD AS BEFOREUNCERTAINTIES ENORMOUS
POLICY, PRICE, TECHNOLOGY, EVEN GDP GROWTH
ANALYSIS IS THE ANSWER (RELATIVELY)