Embed Size (px)
Citation preview

Publisher:European Policy Institute (EPI) - SkopjeDebarca, 61000 SkopjeRepublic of [email protected]
Authors:Simonida Kacarska, PhDRiste Jurukovski, MBA
For the Publisher:Malinka Ristevska Jordanova, PhD
Translation:Julijana Ilievska, MA
Design and print:Gaia Design - Skopje
Skopje, December 2013
Content
Intro
General analysis on the IPA funds in the Republic of Macedonia Absorption of IPA funds The national contribution in relation to IPA funds Funds according to the type of contract Managed funds per contracting authority Use of funds by the type of bene�ciary
IPA funds in relation to the basic macroeconomic indicators IPA 2007–2009 in relation to GDP and per capita absorption Regional distribution of IPA projects
Analysis of the absorption of IPA funds vis-à-vis the accession process and the priorities of the Republic of Macedonia
Conclusions
Annex: Financial data on implementation of the assistance on 31 December 2013 from the European Commission’s Report 2012
Bibliography
IPA program of the European Policy Institute
3
56
10111213
161717
19
20
23
24
25

By the end of 2013 the �rst cycle of the Instrument for Pre-Accession Assistance (IPA), introduced six years ago, will be closed, concluding the �rst �nancial framework 2007-2013. The Proposal for the IPA II Regulation (covering the period 2014-2020) is in the pipe-line. According to the Proposal, the changes are aimed at simpli�cation, �exibility, coherence and e�ciency in the use of EU funds. In addition, the Proposal introduces an enhanced link between the �nancial aid and the accession agenda. Therefore, the end of 2013 is the right time to summarise the results and lessons learned and to provide recommendations for further activities towards a more comprehensive and e�cient use of the EU assistance, as well as the assistance from other donors.
Having this in mind, the European Policy Institute, in the past year, implemented the IPADATA project which established a database of IPA projects in the country. This analysis using the information from the IPADATA database is an initial attempt to systematically study the available data on the use of IPA funds, including the contribu-tion of IPA towards several key macroeconomic parameters and its relationship with them. The objective of the analysis is to explore into detail the absorption of IPA funds in the country and to determine whether and how IPA has a�ected the economy of the Republic of Macedonia in its broadest sense. For the purposes of this analysis the data on the implementation and structure of IPA assistance will be presented and analysed in terms of the basic macroeconomic indicators, the regional distribution of IPA funds and the assessments of the Progress Report on Macedonia published by the European Commission.
Although the focus of the public is on the e�cient use of the funds i.e. the percentage of spent from available funds, this research will go a little deeper in order to pay more attention to other aspects of the implementation of IPA, such as the type of end-users, type of contracts and implemented projects and their linkage with the EU agenda of the Republic of Macedonia in general.
Given the focus and the goal of this research, the analysis consists of three sections. The �rst section covers the analysis on the absorption of the assistance, the ratio of avail-able, contracted and paid funds. Furthermore, the distribution of funds by components and the structure of the national contribution are presented. Finally, the distribution of the funds by type of bene�ciary is elaborated.
The second section studies the impact and compares the absorbed IPA funds with the basic macroeconomic indicators for the Republic of Macedonia. In that regard, the gross domestic product, used IPA funds per capita and other indicators are presented for comparison. In addition, the geographic distribution by regions according to the NUTS 3 classi�cation is presented.
1 The funds will be used for several more years, as the year of the Programme denotes the year when the funds are allocated to a speci�c programme, whereas the allocated funds are spent in the following years, after the completion of all the necessary procedures 2 www.ipadata.mk
2
1
3

The third section examines the relation between the EU funds and the accession reform process. Since structurally the EU accession process is divided into 35 acquis chapters, the analysis links the absorbed funds in the Republic of Macedonia with the assess-ment of alignment and priorities structured by chapters of the acquis in the EU reports. Although the impact of a certain project is not always con�ned to the area covered by chapters, the classi�cation is done, taking into account the area where the project has the highest impact.
The methodology of estimation of projects costs is adjusted to the nature of program-ming the funds in the operational programs.
The data is extracted from public sources. The analysis has been prepared based on available information at the end of November 2013 on the web site of the EU Delega-tion in Skopje, the Secretariat for European A�airs, the Central Financing and Contract-ing Department of the Ministry of Finance, the Agency for Financial Support of Agricul-ture and Rural Development, as well as the web sites of the cross-border cooperation programs. In the course of the second half of 2013 the responsible institutions in the Republic of Macedonia have published various relevant documents: the Central Financing and Contracting Department published lists of the concluded contracts for all three components (I, III and IV); the Agency for Financial Support of Agriculture and Rural Development continuously publishes overviews of selected projects for Compo-nent V. Furthermore, the shift towards transparency is also illustrated by the publica-tion of lists of funded projects by the Secretariat for European A�airs and the Ministry of Local Self-Government. The European Commission publishes lists of contracts it signed on the website of the EU Delegation in Macedonia. However, the existing data are not clearly comparable, consistent and the format depends on the source. For certain components/programs information on the annual allocation of the particular funds for the concluded contracts is missing. In the cross-border cooperation programs the exact data for the co-�nancing amount is not given. A particular challenge is the cross-border cooperation program with Bulgaria, which is managed by the Ministry of Regional Development and Public Works of the Republic of Bulgaria. The identi�cation of the co-�nancing costs of projects under this program is at times impossible, since this data is not presented.
Although this analysis has the objective to show the trends and state of play of the use of IPA funds, in the long run we expect it to encourage research by using the IPADATA. This analysis only points out to the opportunities o�ered by the data-base, which can always be combined with many other sources to reach a wider scope in policy making.At the end we expect the analysis to encourage dialogue between the respective state institutions and the civil society which has been largely missing so far.
3
3 The methodology of the database is available on: http://ipadata.epi.org.mk/?page_id=1260
4

I. General analysis on the IPA funds in the Republic of Macedonia
The use of IPA funds by the Republic of Macedonia commenced with the IPA I �nancial framework for 2007-2013. The absorption of IPA funds is inseparably and most signi�-cantly linked with the programming i.e. the plan for their use. Having in mind that usually at least two years pass from the programming year until launch of implementa-tion, it was necessary for a certain period of time to pass before conducting an analysis of the structure and the trend of utilisation of funds. Therefore, at the end of 2013 a preliminary analysis on the absorption of funds and their structure may be compiled in order to see what exactly the data indicates.
This �rst section covers an analysis of the absorption of the assistance, type of project, as well as the ratio of available, contracted and paid funds. Furthermore, the distribu-tion of funds by components, the structure and the amount of the national co-�nancing is presented. At the end, the distribution of funds by the type of bene�-ciary in question is given. Even though the funding in general is designed for certain type of bene�ciaries in line with the priorities, especially between components, it is important to determine which organisations were mostly involved and used IPA funds.
а) Absorption of IPA funds
The absorption of IPA funds can be analysed having in mind the share of contracted projects from overall programmed funds and the percentage of the completed vis-à-vis programmed projects. This analysis classi�es the funds according to the �ve IPA compo-nents, which are directed towards di�erent objectives and activities.• IPA Component I: Transition Assistance and Institution Building assists in meet-ing the political, socio-economic criteria and the European standards. This component consists of 40% of the total IPA funds for Republic of Macedonia (see the table below).• IPA Component II: Cross-border Cooperation is related to the border regions between bene�ciaries of the Member States, candidates and accession countries. The funds are aimed at encouraging the cross-border cooperation, sustainable develop-ment of the environment, development of the market and the economy, promotion of cooperation at the external borders of the EU, improving the living standard in the border regions, capacity building of the local/regional/ national institutions for imple-mentation of the EU programs, etc.• IPA Component III: Regional Development supports infrastructural projects in the environment and transport sector, as well as programs promoting regional com-petitiveness and development. This component is foreseen as a predecessor of the European Fund for Regional Development (EFRD) and the Cohesion Fund, i.e. serves to prepare the candidate countries for implementation of these funds upon membership in the EU.• IPA Component IV: Human Resources supports projects aimed at promotion of employment, education/training and social inclusion. Its objective is to prepare the candidate countries for using the European Social Fund upon membership in the EU.though smaller in scale.
5

• IPA Component V: Rural development simulates the programs for rural devel-opment upon accession by �nancing rural development measures, similar by nature,
Table 1: Available and absorbed funds from components I, II, III, IV and V
Животна средина
Absorption of funds: completed and ongoing projects
* EUR Programmed (total approved funds)
Contracted (Ongoing projects
+ completed projects)
Share of contracted projects in programmed projects
Paid funds (Completed projects)
Share of the paid funds (completed projects
Component 1
Component 2
Component 3
Component 4
Component 5
Component 6
244.112.110
30.276.703
200.426.454
54.424.000
85.649.341
614.888.608
91.878.188
17.191.151
55.846.836
12.874.132
5.687.182
186.965.954
38%
57%
28%
24%
7%
30%
26%
25%
1%
19%
7%
15%
63.390.658
7.528.647
2.769.394
10.504.484
5.618.101
89.811.284
4
4 Values are taken from the European Commission, Communication from the Commission to the European Parliament and the Council Instrument for pre-accession assistance (IPA), Revised multi-annual indicative �nancial framework for 2012-2013, COM (2011) 641 �nal, Brussels, 12.10.2011; http://ec.europa.eu/enlargement/pdf/how_does_it_work/mi�_12_10_2011.pdf. The calculation does not include the values of the Program for Information and Communication.
value of completed projects and ongoing projects,
183.477.489 EUR
30%
remaining funds, , 431.411.119 EUR
70%
Chart 1: Absorption of IPA funds: completed and ongoing projects
6

From the table above it can be noticed that the level of absorption of IPA funds is low. Regarding the ongoing and completed projects the range is between 7% in the Com-ponent V to 57% in the Component II. The low level of absorption of IPA funds in the Component V for rural development and the possibility of losing the funds is the reason why the European Commission, upon the request of the Government of the Republic of Macedonia, reallocated 18 million Euros from this component to Component I. The proposal envisages joint management of the funds by the European Commission and the World Bank. The Government should participate with a contribution of 5 million Euros, thus the overall amount of this projects is around 23 million Euros. This means that instead of the National Agency for Financial Support of Agriculture and Rural Devel-opment to award these funds to the farmers and the enterprises in this sector, the funds will be managed by the World Bank - for projects in the same sector, but in the component for transition assistance and institution building. This is a clear illustration for setback - rather than national
Because of the low absorption of funds, the World Bank will manage 23 million euros for agriculture and rural development, instead of the Agency for Financial Support of Agriculture and Rural Development.
The reasons underpinning this situation are multiple. First of all, the programming and implementation of projects in each of the components is undermined by weak admin-istrative capacity. The European Commission underlines this aspect in the latest Progress Report for 2013, stating that “there is urgent need for further enhancing of the project management capacity of relevant institutions to ensure e�ective and e�cient management of EU funds“. The �ndings of EPI's study on the absorption of EU funds in the Republic of Macedonia are similar as they identify the delay in programming of funds, complexity of procedures, as well as the weak capacity of various bodies involved in the implementation of IPA as reasons for the low absorption. This refers to bodies responsible for concluding the IPA contracts, as well as the potential bene�ciar-ies (state institutions, municipalities, social partners, civil sector, private enterprises, the farmers and the food-processing companies in Component V). In this regard, in the Report on Financial Assistance for Enlargement 2012 the European Commission states that at the beginning and at the end of 2012, the Commission temporary interrupted the payments due to understa�ng and insu�cient managerial capacities in key institu-tions, especially in those exercising control functions, such as the Audit Authority and the National Authorising O�cer's (NAO) o�ce.
5
6
7
5 Commission implementing decision adopting a National programme - Part II on the former Yugoslav Republic of Macedonia under the IPA Transition Assistance and Institution Building Component for the year 2013 (draft), D030863/01, http://ec.europa.eu/transparency/regcomitology/index.cfm?do=Search.getPDF&hXRKYVoVsFEDuZvGzPDBWVqBB7fI4EnisQ1BdEUO8vC5SVAw47eF02NzJJLXFBE77kGvLzo2Pu5uyjPyPE0HGhn1Yyu8a5hceFqN5ixnqYI= 6 European Commission, Progress Report for the Republic of Macedonia for 2013, http://www.sep.gov.mk/data/�le/Progres%20report%202013/2013-mk/mk_rapport_2013_MK4_21_10_2013.doc7 See: The use of EU funds in the Republic of Macedonia, collection of studies, November 2013, European Policy Institute, available on: http://epi.org.mk/docs/use_of_eu_funds_in_rm_en.pdf
8
8 European Commission, Report from the Commission to the European Parliament, the Council, and the European economic and Social Committee, 2012 annual report on �nancial assistance for enlargement, http://ec.europa.eu/enlargement/pdf/ key_documents/2013/2012_ipa_annual_report_with_annex_new_en.pdf
7
institutions, the funds will again be managed by the European Commission i.e. international organisations.

ТFurthermore, this state of a�airs can certainly be linked to insu�cient political com-mitment for more e�cient implementation of IPA funds. In addition, the low absorp-tion is a result of the allocation of budgetary resources for similar purposes and in the same sectors, which are subject to less strict requirements. This is especially relevant for the funds for agriculture and rural development, having in mind that the national subsidies have been increasing. Finally, the low absorption rate points to the poor assessments in IPA programming. As already highlighted by previous research, the low level of partnership is an additional reason behind the ine�cient use of the funds.
Reasons for low absorption:1. Insu�cient political commitment 2. Low administrative capacities 3. Easier access to budget funds and other sources4. Inappropriate programming5. Lack of partnership
If we include in the analysis the funds with prede�ned amounts, which at the moment are subject to public calls, the absorption rate would rise by 6% i.e. to 36%. The biggest increase is registered in Component II with ongoing open calls for cross-border coop-eration with Kosovo and with Greece. Of course, this �gure is not de�nite having in mind that the amounts of the contracted projects in future can di�er from the envis-aged amounts in the calls.
Table 2: Absorption of funds: completed, ongoing projects, open calls with prede�ned amounts
* EUR Programmed (total approved funds)
Open calls, ongoing projects+ completed projects
Share of funds in open calls, ongoingprojects and completed projects
Component 1
Total
244.112.110
30.276.703
200.426.454
54.424.000
85.649.341
614.888.608
104.620.281
21.798.236
71.397.836
15.194.132
5.687.182
218.697.667
43%
72%
36%
28%
7%
36%
Component 2
Component 3
Component 4
Component 5
8
The absorption of funds for Component III – Regional development, which is focused on investments in infrastructure and environment has sharply increased last year, when contracts were signed for the section of the highway Demir Kapija – Smokvica. The other project from this component – water-treatment plant Prilep is yet to be com-pleted. According to the pace of utilisation of funds so far, the risk of loss of funds is evident. The European Commission on an annual basis prepares a report on the implementation of pre-accession assistance in the bene�ciary countries in the previous year. Data from these reports for the components I and II is available in the annex of this review.
9
8 European Commission, Report from the Commission to the European Parliament, the Council, and the European Economic and Social Committee, 2012 Annual Report on Financial Assistance for Enlargement, http://ec.europa.eu/enlargement/pdf/key_documents/2013/2012_ipa_annual_report_with_annex_new_en.pdf
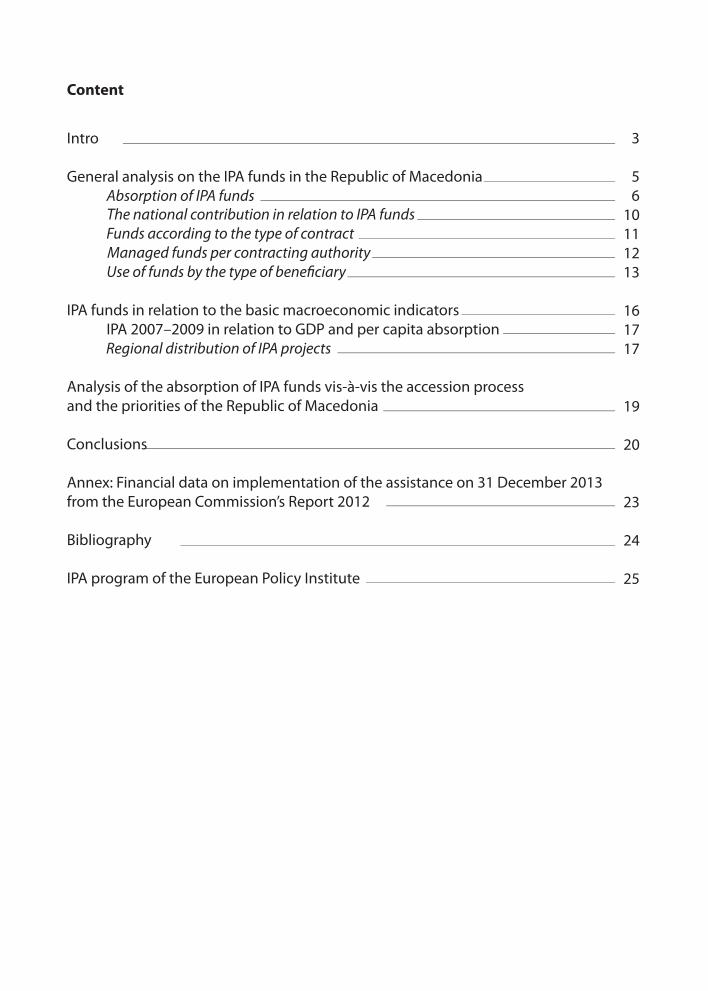
According to the last report which re�ects on the absorption of funds by the end of 2012, 38.92% of the funds allocated in Component I were used.
Table 3: Use of funds in Component I according to the European Commission’s Report on Financial Assistance for enlargement for 2012
Животна средина
Republic of Macedonia
IPA 2007
IPA 2008
IPA 2009
IPA 2010
IPA 2011
IPA 2012
Total
34,02
37,12
37,06
36,92
28,90
28,16
202,18
31,80
34,00
35,32
30,13
0,00
0,00
131,25
93,48%
91,58%
95,30%
81,63%
0,00%
0,00%
64,92%
31,09
26,86
17,73
3,01
0,00
0,00
78,69
91,39%
72,35%
47,84%
8,16%
0,00%
0,00%
38,92%
Allocated Contracted % Contracted Paid Paid
The di�erence in the results obtained in EPI’s study can be linked to two factors:
1. The European Commission uses lower referent values for every year for Compo-nent I. In its Pre-accession assistance report, the European Commission operates with an allocation of 202 million Euros for Component I. At the same time, the allocation for the same component in the revised Multi-annual indicative planning document for the period 2007-2013 is 244 million Euros, which is taken as a referent value in this analysis. 2. The European Commission calculates the absorption of IPA funds as a share of the allocations in the period 2007-2012 whereas this review also includes the alloca-tions for 2013, having in mind it includes data as of November 2013.
10
10 See tables in annex. 11 European Commission, Report from the Commission to the European Parliament, the Council, and the European economic and Social Committee, 2012 Annual Report on Financial Assistance for Enlargement, http://ec.europa.eu/enlargement/pdf/key_documents/2013/2012_ipa_annual_ report_with_annex_new_en.pdf 12 European Commission, Communication from the Commission to the European Parliament and the Council instrument for pre-accession assistance
(IPA), Revised multi-annual indicative �nancial framework for 2012-2013, COM(2011) 641 �nal, Brussels, 12.10.2011; http://ec.europa.eu/enlargement/pdf/how_does_it_work/mi�_12_10_2011.pdf.
Table 4: Planned funds in the Multiannual �nancial framework 2012-2013 included in the analysis
41.641.613
4.158.387
7.400.000
3.200.000
2.100.000
58.500.000
41.122.001
4.077.999
12.300.000
6.000.000
6.700.000
70.200.000
39.310.500
4.371.501
20.800.000
7.100.000
10.200.000
81.782.001
36.917.068
4.467.526
29.400.000
8.400.000
12.500.000
91.684.594
29.403.410
4.524.876
39.300.000
8.800.000
16.000.000
98.028.286
28.659.161
3.583.373
40.949.983
10.288.000
17.991.604
101.472.121
27.058.357
5.093.041
50.276.471
10.636.000
20.157.737
113.221.606
244.112.110
30.276.703
200.426.454
54.424.000
85.649.341
614.888.608
Component 1 Component 2
Component 3 Component 4
Component 5
Total
2007 2008 2009 2010 2011 2012 2013
Planned IPA funds according to the Multiannual �nancial framework 2012-2013
11
12
9

ВКУПНО
b) The national contribution in relation to IPA funds A certain amount of the total IPA project funds must be provided through a national contribution. The national contribution can come from the budget, from the bene�-ciary or both. The amount of the national contribution is prescribed in the criteria and depends on the component and the type of contract.
* EUR
Budget IPA Contribution МК
Component 1
Total
106.442.781
21.798.236
71.397.836
15.194.132
5.687.182
3.627.803
224.147.970
Component 2
Component 3
Component 4
Component 5
Total budget % Budget EU % Contribution MК
5.392.965
3.865.394
11.173.276
2.271.849
2.128.980
147.494
31.928.093
112.085.746
25.663.630
82.571.112
17.465.981
14.889.342
3.775.297
256.076.063
95%
85%
86%
87%
38%
96%
88%
95%
85%
86%
87%
38%
96%
88%
5%
15%
14%
13%
62%
4%
12%
Program for information and communication
IPA Component
Table 5: Structure of �nancing by components 13
Chart 2: Co- �nancing of all projects in all components
88% 12%
EU Budget MK Contribution
13 The values re�er to the completed, ongoing projects as well as open calls (where the amount of the open call is determined). In the contribution of the Republic of Macedonia the loan from the European investment bank for �nancing the construction of the section Demir Kapija - Smokvica in the amount of approximately 160 million euros has not been included.
10
The contribution of the Republic Macedonia has gradually been increasing since 2007 until today. In the contribution of the Republic of Macedonia regarding the Component II all funds have been included in the analysis. Regarding the Component V - Rural development, the participation of the national budget of the Republic of Macedonia, as well as contributions of the bene�ciaries (farmers and the private enterprises) have been calculated. As can be seen from Table 5, the participation of the Republic of Mac-edonia is highest in the Component V due to the budgetary support, as well as �nancial share of the direct IPA bene�ciaries. It is also obvious that the high level of requested contribution from the bene�ciary additionally complicates the utilisation of the funds from this component.

c) Funds according to the type of contract
According to the classi�cation of the type of assistance and the type of contract under the European Commission (Europeaid), the assistance is divided into grants and contracts. Furthermore, contracts are divided into supply contracts, service contracts and works contracts. Using this classi�cation, we can analyse the structure of IPA projects according to the type of contract.
Table 6: Structure of IPA components I-V according to the type of contract
35.340.867
21.798.236
10.290.038
5.687.182
665.404
73.781.727
9.552.527
262.892
9.815.419
5.458.479
46.241.007
51.699.486
51.001.142
28.526.829
4.904.094
2.747.017
87.179.082
101.353.015
21.798.236
74.767.836
15.194.132
5.687.182
3.675.313
222.475.714
35%
100%
0%
68%
100%
18%
33%
5%
0%
62%
0%
0%
0%
23%
Component 1 Component 2
Component 3 Component 4
Component 5
Total
Планирани средства на ИПА според повеќегодишната финансиска рамка 2012-2013
Program for communication
information and
Component/ type of contract
Grant Supply contract
Works contract
Service contract
Total Grant
9%
0%
0%
0%
0%
7%
4%
Supply contract
Works contract
Service contract
50%
0%
38%
32%
0%
75%
39%
* EUR Share
14
14 http://ec.europa.eu/europeaid/work/funding/
Chart 3: Structure of IPA components I-V by the type of contract
Service Contract Works Contract Grant Supply Contract
11
According to the data, the contracts have the highest share, out of which the service contracts are dominant. Per separate components, grants are dominant in Component V, as well as in Component II. Having in mind the objectives of the components, the targeted bene�ciaries and the type of supported activities, it can be concluded that these results coincide to a great extent with the priorities as foreseen for the IPA compo-nents. From this point of view, there is a match between the type of assistance and the needs. Nonetheless, from the standpoint of the direct bene�t of the economy and social factors, while considering that until now signi�cant amounts have been invested in capacity building, in future the structure needs to be shifted towards increasing the share of grants, works and supply contracts, i.e. to decrease the share of services.
39% 23% 33% 4%

d) Managed funds per contracting authority
Depending on the component and the time of contracting, IPA funds have been man-aged by di�erent bodies. With the accreditation of the decentralised implementation system, the responsibility for contracting and managing projects has been gradually transferred from the Delegation of the European Union to the national contracting authorities – the Central Financing and Contracting Department in the Ministry of Finance and the Agency for Financial Support of Agriculture and Rural Development. However, the EU Delegation acts as a contracting authority for certain projects.
Currently the state of play regarding the responsibility for managing the funds is as follows:
Component I: The Central Financing and Contracting Department in the Minis-try of Finance, except for civil society grants and the program for information and com-munication managed by the Delegation of the EU.
Component II: Delegation of the EU in the Republic of Macedonia concludes contracts for Macedonian bene�ciaries for all programs except the one with Bulgaria, where the contracting authority is the Ministry of Regional Development and Public Works of the Republic of Bulgaria. The contracting has recently been transferred from the EU Delegation to the Managing body of the Trans-national program.
Components III and IV: The Central Financing and Contracting Department in the Ministry of Finance.
Component V: The Agency for Financial Support of Agriculture and Rural Development.
Components III, IV and V could have only been managed in a decentralised manner, thus the use of these funds commenced in 2010.
The retained competences of the European Commission for awarding grants for cross-border cooperation for most of the programs cannot be explained solely by the insu�-cient administrative capacity. It is evident that political considerations are at stake.Moreover, it is indicative that EC retains the authority to award civil society grants from the Component I. It illustrates the existing distrust that these grants would be awarded in transparent and objective manner by the Government. However, the national insti-tutions do award grants to the civil societies as part of the Component IV for human resources development.
15
15 This includes EC grants for contribution to the entry tickets of the Republic of Macedonia for participation in Community Programmes.
12

Table 7: Structure of contracted funds for IPA components I-V according to the type of contracting authority
Contracting authority
* ЕУР Agency for Financial Support of Agriculture and Rural Development
EU Delegation Central Financing and Contracting Department
Component 1
Total
5.687.182
5.687.182
67.284.119
15.256.722
3.627.803
86.168.644
Component 2
Component 3
Component4
Component 5 Program for
communicationinformation and
Managing body
39.158.662
71.397.836
15.194.132
125.750.630
6.541.514
6.541.514
16
16 The Managing body is a contracting authority for projects from the Program for cross-border cooperation with Bulgaria and the
Chart 4: Structure of contracted funds for IPA components I-V according to the type of contracting authority
56% 38% 3% 3%
Central Financing and Contracting Department
EU Delegation Managing Body Agency for Financial Support of Agriculture
Of the IPA funds absorbed so far, 59% are managed by a contracting authority from the Republic of Macedonia (the Central Financing and Contracting Department in the Min-istry of Finance and the Agency for Financial Support of Agriculture and Rural Develop-ment). Having in mind the signi�cance of this share, the capacity building of these institutions for managing EU funds is of key importance for advancing the use of IPA funds.
e) Use of funds by the type of bene�ciary
In general, IPA funds by components are predominantly aimed at a certain type of ben-e�ciaries. However in certain components, as in components II and III, di�erent types of organisations are eligible as bene�ciaries. In this analysis 6 types of bene�ciaries are classi�ed, but the IPADATA base allows for sub-classi�cation of multiple types.
13Trans-national program.
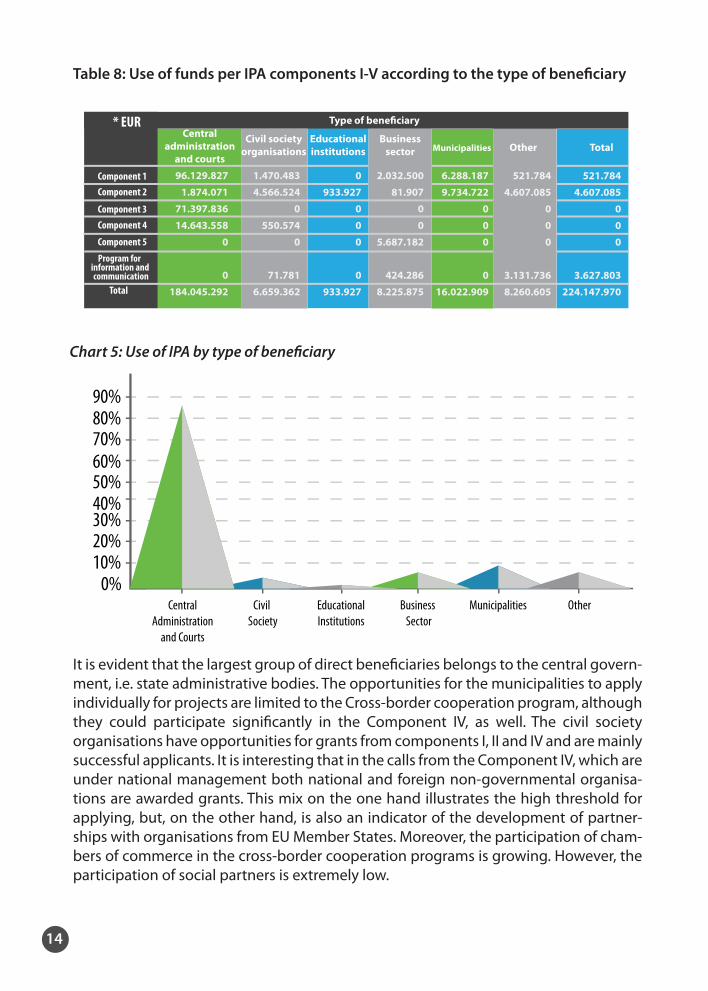
Table 8: Use of funds per IPA components I-V according to the type of bene�ciary
96.129.827
1.874.071
71.397.836
14.643.558
0
0
184.045.292
Component 1 Component 2
Component 3 Component 4
Component 5
Total
Central administration
and courts
Civil society organisations
Educational institutions
Businesssector
Municipalities Other Total
Type of bene�ciary
Program for communication
information and
1.470.483
4.566.524
0
550.574
0
71.781
6.659.362
0
933.927
0
0
0
0
933.927
2.032.500
81.907
0
0
5.687.182
424.286
8.225.875
6.288.187
9.734.722
0
0
0
0
16.022.909
521.784
4.607.085
0
0
0
3.131.736
8.260.605
521.784
4.607.085
0
0
0
3.627.803
224.147.970
* EUR
Chart 5: Use of IPA by type of bene�ciary
CentralAdministration
and Courts
Civil Society
EducationalInstitutions
Business Sector
Municipalities Other0%
10%20%30%40%50%60%70%80%90%
It is evident that the largest group of direct bene�ciaries belongs to the central govern-ment, i.e. state administrative bodies. The opportunities for the municipalities to apply individually for projects are limited to the Cross-border cooperation program, although they could participate signi�cantly in the Component IV, as well. The civil society organisations have opportunities for grants from components I, II and IV and are mainly successful applicants. It is interesting that in the calls from the Component IV, which are under national management both national and foreign non-governmental organisa-tions are awarded grants. This mix on the one hand illustrates the high threshold for applying, but, on the other hand, is also an indicator of the development of partner-ships with organisations from EU Member States. Moreover, the participation of cham-bers of commerce in the cross-border cooperation programs is growing. However, the participation of social partners is extremely low.
14

The low participation of the private sector in the �rst four components is of particular concern. The possibilities for the business sector were so far limited to technical assis-tance under the TAB/BAAS program in Component I.
In the Component III for human resources development the high participation of the state institutions on central level is yet again evident, illustrating the use of this compo-nent in a similar manner as the �rst one.
Component V
The division within the business sector group illustrates the internal distribution in terms of the use of funds from Component V. Given the structure of the bene�ciaries of this component, it is interesting to see how many direct bene�ciaries are individual farmers, and how many are enterprises.
Table 9: Use of IPA funds from Component V by the type of bene�ciary in the busi-ness sector
Component V
Private enterprises Farmer
Вид на корисник
5.407.033
Private enterprises Farmer
Amount EUR No. of projects
280.149 95 80
Chart 6: Use of IPA funds from Component V by the type of bene�ciary in the business sector
private enterprises, 5.407.033 EUR farmer, 280.149 EUR
Used funds from Component V by bene�ciary
Chart 7: Number of projects in IPA Component V by the type of bene�ciary in the busi-ness sector
Number of projects in IPA Component V by bene�ciaries
private enterprises 95farmer 80
15

This analysis shows that private enterprises absorb much more funds, which is under-standable considering their �nancial power and capacity to develop projects when compared to individual farmers. The share of funds absorbed by private enterprises is approximately 95% compared to approximately 5% by individual farmers, although this disparity is not re�ected in the absolute numbers of projects implemented by the private enterprises on the one hand and farmers, on the other. The signi�cant di�erence in the resources indicates a serious problem with the preparedness of farmers to more actively and e�ectively use available IPA funds.
II. IPA funds in relation to the basic macroeconomic indicators
The analysis by macroeconomic indicators should �rstly serve for comparison of the foreign assistance vis-à-vis the economic trends and capacity of the economy. In this section, we speci�cally establish the relationship between the absorbed IPA funds allocated for the period 2007-2009 on the one side and the gross domestic product and the total number of inhabitants in the Republic of Macedonia on the other.
The indicators calculated here should be taken into consideration as provisional having in mind that they are not designed on the principle of in�ow, but are approximately distributed in the year when the implementation of the projects should have started according to the rule N+2. According to these approximations the share of IPA in the gross domestic product has been calculated, as well as the amount of EU assistance per capita. The calculation of these indicators should serve as a basis for comparison of the absorption of IPA with the other countries.
In addition, this section of the analysis will illustrate the distribution of funds across the statistical regions (NUTS 3).
Having in mind the delay of the implementation of projects the analysis refers to the period 2007 to 2009. а) IPA 2007–2009 in relation to GDP and per capita absorption
17
17 Според податоците од датабазата, досега завршените проекти (со исклучок на програмата за информирање и комуникации) се од програмата ИПА 2007-2009, поради што и се земени споредбено со БДП од тој период.
Table 9a: IPA 2007-2009 regarding GDP and population
Average overall absorbed IPA funds 2007, 2008, 2009
Average GDP in Euros (by current rate)
for 2007, 2008, 2009
Average share of absorbed IPA funds in GDP
for 2007, 2008, 2009Average population in 2007, 2008, 2009
Absorbed funds for all 5 components in average 2007, 2008, 2009
Average absorption per capita in Euros
for 2007, 2008, 2009
30.302.219 6.462.666.667 0,46 2.048.283 14.8 Euros
16

There is no relevant data for the time period when IPA 2007-2009 funds were actually spent; i.e. when exactly the funds were transferred to the Republic of Macedonia in order to calculate their share in the gross domestic product of that year. Thus, we assume that the funds are used according to the rule N+2. Furthermore, the applied methodology is based on the calculated average of the total amount of the used IPA assistance 2007–2009 according to the information from the IPADATA. In order to make a proper comparison the average value of GDP has been used as well as the popula-tion for the same time period.
According to the comparison, for the years 2007, 2008 and 2009 the average used IPA funds annually amount to 0.46% of the average GDP for the same period and the absorption is approximately 14.8 Euros per capita for the given period.
b) In the period 2007-2009 besides IPA funds in the Republic of Macedonia projects from the CARDS program (2005 and 2006) were also implemented. When those funds are included in the estimations, the absorption of EU assistance increases to 25,4 EUR per capita.
18
19
20
Table 9b: CARDS and IPA 2007-2009 vis-à-vis GDP and population
Average overall absorbed IPA and CARDS funds
2007, 2008, 2009 (EUR)
Average GDP current rate, for2007, 2008, 2009 (EUR),
Average share of absorbed IPA and CARDS funds
in GDP for 2007, 2008, 2009 (%)
Average population in 2007, 2008, 2009
Absorbed funds from CARDS and IPA in average 2007, 2008, 2009
Average EU assistance per capita for
2007, 2008, 2009
51.717.388 6.462.666.667 0,8 2.048.283 25,4 EUR
18 GDP values for the years 2007, 2008 and 2009 have been taken from the State Statistical O�ce http://www.stat.gov.mk/xls/2013/3.1.13.08.xls 19 The values for the number of population for the years 2008 and 2009 are taken from the State Statistical O�ce http://www.stat.gov.mk/IndikatoriTS.aspx?id=2, while for 2007 are obtained from the values of GDP and GDP per capita for 2007 from http://www.stat.gov.mk/xls/2013/3.1.13.08.xls 20 The value of the implemented CARDS projects has been calculated according to the data available on the web site of the Delegation of the European Union in Skopje, http://eeas.europa.eu/delegations/the_former_yugoslav_republic_of_macedonia/documents/projects/01-contractlist-web-2013-dec.pdf
b) Regional distribution of IPA projectsTable 10: Regional distribution of IPA funds
Funds per regionEUR
Vardar region
587.259
479.595
850.000
778.821
Eastern region
324.947
2.699.196
969.000
189.610
1.340.494
South-western region
911.673
2.241.216
6.800.000
315.496
South-eastern region
482.875
4.371.389
45.646.000
1.139.492
Pelagonija region
1.603.122
3.317.095
6.629.365
844.336
Polog region
574.640
610.644
139.988
134.103
North-eastern region
488.910
1.806.594
Skopje region
24.587.750
2.044.532
434.438
1.698.485
1.134.440
All regions
76.881.605
1.240.890
10.069.033
13.166.049
Component1
Component2
Component3
Component4
Component5
17
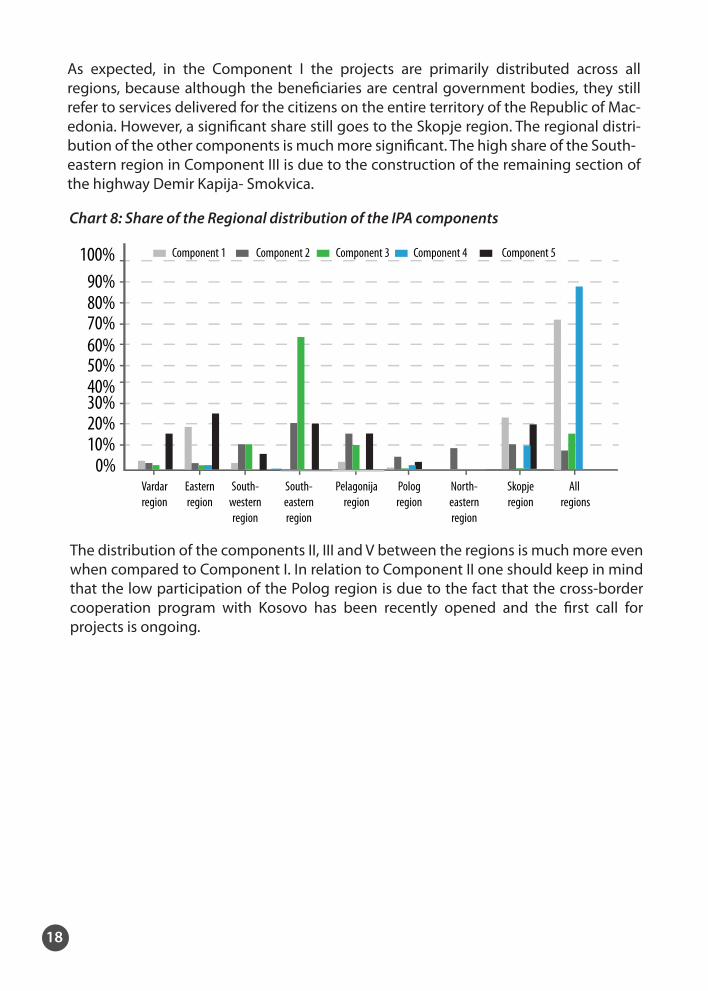
As expected, in the Component I the projects are primarily distributed across all regions, because although the bene�ciaries are central government bodies, they still refer to services delivered for the citizens on the entire territory of the Republic of Mac-edonia. However, a signi�cant share still goes to the Skopje region. The regional distri-bution of the other components is much more signi�cant. The high share of the South-eastern region in Component III is due to the construction of the remaining section of the highway Demir Kapija- Smokvica.
Chart 8: Share of the Regional distribution of the IPA components
Vardarregion
Easternregion
South-easternregion
Pelagonijaregion
North-easternregion
Skopjeregion
0%10%20%30%40%50%60%70%80%90%
100%
South-westernregion
Pologregion
All regions
Component 1 Component 2 Component 3 Component 4 Component 5
The distribution of the components II, III and V between the regions is much more even when compared to Component I. In relation to Component II one should keep in mind that the low participation of the Polog region is due to the fact that the cross-border cooperation program with Kosovo has been recently opened and the �rst call for projects is ongoing.
18

III. Analysis of the absorption of IPA funds vis-à-vis the accession process and the priorities of the Republic of Macedonia The �nal part of this analysis explores the link with level of alignment in the chapters of the аcquis communautaire, as assessed in the progress reports of the European Com-mission. The level of alignment has been taken from EPI’s analysis of the Progress report of the Republic of Macedonia for 2013 in which the methodology for the assess-ment is presented. By allocating the amount of IPA funds per chapter, the objective of this section is to �nd out which chapters had the greatest activity and to establish the overall relation between the levels of alignment and the absorbed IPA funds per chap-ter. This correlation is even more signi�cant having in mind that the �ndings from the Progress report of the European Commission should be the starting point when programming IPA funds.
Table 11: Distribution of IPA funds per chapters of the аcquis communautaire
5. Public procurement
7. Intellectual property law
8. Competition policy
9. Financial services
10. Information society and media
11. Agriculture and rural development
12.
14. Transport policy
15. Energy
16. Taxation
17. Economic and monetary policy
18. Statistics
19. Social policy and employment
20. Enterprise and industrial policy
21. Trans-European networks
22.
23. Judiciary and fundamental rights
24. Justice, freedom and security
25. Science and research
26. Education and culture
27. Environment
28. Consumer and health protection
29. Customs union
36. Political criteria
37. Economic criteria
Undistributed
Number of projects
7
2
1
1
4
10
191
7
5
14
9
3
4
46
30
10
36
26
17
4
47
61
4
12
23
16
29
Level of alignment
4
4
3
4
3
2
3
3
3
3
3
4
4
1
3
4
2
2
4
2
3
3
3
4
3
4
Amount of IPA (EUR)
1.870.156
1.137.305
81.421
950.000
1.273.225
1.345.347
12.008.157
5.752.118
5.750.782
4.185.711
3.554.928
1.416.480
1.409.100
12.538.656
5.710.103
54.803.932
7.823.302
11.194.666
17.304.551
2.024.444
12.196.972
27.651.828
960.346
8.411.441
11.131.210
3.486.069
8.175.720
Chapter
21 IPA database enables the linkage of the projects with the classi�cations of the EU law on EURlex as a useful tool regarding the analysis of EU assistance upon accession. 22 The assessments on the level of alignment have been taken from the Initial analysis of the Progress Report of the European Commission for the Republic of Macedonia 2013 by the European Policy Institute – Skopje, available on http://epi.org.mk/docs/prvicna_analiza_na_izvestajot_na _ek_za_napredokot_na_rm_za_2013(1).pdf 23 The classi�cation has been made by EPI. Of course, there is a chance a project to be classi�ed in more than one chapter, but in this particular case the primary chapter where the project had the greatest impact has been taken into consideration.
23
21
22
19
Food safety, veterinary and phytosanitary policy
Regional policy and coordination of structural instruments

The data presented by chapters illustrates the directing of the funds in relation to the EU accession priorities. The Chapter 23 Judiciary and fundamental rights and the Chapter 24 Justice, Freedom and Security have continuously been a priority of the Republic of Macedonia, as well as for the region. Those chapters are the �rst to be opened in the accession negotiations and are signi�cantly targeted with EU assistance mainly in the Component I on institutional support. Moreover, in the classi�cation of the database a high number of the projects from the political criteria are closely related to the Chapter 23.
IPA funds from the cross-border cooperation component are mostly associated with the chapter 26: Education and culture, as well as the chapters 19: Social policy and employ-ment, 20: Enterprises and industrial policy and 27: Environment, because the priority axes of these programs are directed towards activities in these areas. The experience from the previous enlargements shows that from all of these chapters, approximation in the area of environment carries the highest �nancial implications and is expected to be achieved as a long-term goal.
IPA Component III for regional development is mostly represented in the chapters 14: Transport policy, 21: Trans-European networks and 22: Regional policy and coordina-tion of structural instruments. These projects are multiannual and that is the reason why the use of this component regarding the completed projects is low.
The Component IV for human resources development is re�ected mostly in the Chapter 19: Social policy and employment, whereas the Component V for agriculture and rural development in the Chapter 11: Agriculture and rural development.
However, it is highly signi�cant when analysing to take into consideration that some of the chapters need much more resources for approximation.
Although initially a strong correlation between the funds spent and the level of approxi-mation cannot be established one must keep in mind that in the chapters 11, 26 and 27, the projects are mainly not aimed at approximation of the legislation. These projects entail physical capital investments which contribute to the general approximation in the chapters, though, not with the same intensity as the projects for enhancing the capacities and harmonisation of the legislation.
24
24 Two big projects are related to this chapter - for construction and supervision over the section Demir Kapija-Smokvica, in which EU contributes with 45 million euros. For additional information check the projects in the IPA database.
20

ConclusionsThe aim of this review on the absorption of IPA funds in the Republic of Macedonia was to present an initial overview of the information available via the IPADATA base and to give a preliminary analysis of the use of IPA in the country. Having in mind the focus and the purpose of this research, the analysis consisted of 3 sections. The �rst section analysed the use of the IPA assistance as well as the available, contracted and used funds. The presented data illustrated that the use of assistance is low and if we take into consideration the used funds (value of completed and ongoing projects) it stands at 30%. The total use ranges from 15% of paid funds to 36%, consisting of completed projects, ongoing projects and open calls. The low absorption of funds in the Compo-nent V for rural development is visible and has been followed up in the recent redistri-bution of funds from this component to Component I which will be managed by the World Bank. Although these projects, as stated in the Commission's decision will be used for similar purposes as the Component V, the reallocation is an indicator of the lack of capacity for using the funds directly by the farmers and private enterprises through the National Agency. Next, the relation of the funds by components, structure and national contribution was presented. The average national contribution of the Republic of Macedonia (budgetary resources, as well as funds from the bene�ciaries of the Component V) is 12%, although, there are signi�cant variations between the components. Finally, the distribution of funds by type of bene�ciary was given, as a re�ection of the dominance of the central administration and the courts as bene�ciaries of the biggest amounts of IPA funds. This should not be surprising having in mind that the Component I, to which nearly 40% of IPA funds is allocated, is fully aimed to support the state institutions.
The second section studied the in�uence and links of IPA funds to the basic macroeco-nomic indicators. Here, the gross domestic product and absorption of IPA funds per capita were presented. Also, this section tackled the geographic distribution by regions according to the NUTS 3 classi�cation. Thus, the analysis illustrated that the signi�cant part of the funds are directed towards the Skopje region (where the state institutions are situated), as well as towards all other regions having in mind that these projects are signi�cant for the overall capacity building of the institutions. The signi�cant participa-tion of the South-eastern region in Component III is a result of the ongoing implemen-tation of infrastructural projects.
21
25
25 Here it should be taken into consideration the delivery of national assistance for agriculture is subject to more simpli�ed procedures.
The third section presented the relationship between EU funds and the reform acces-sion process. Because the process of acceding to the EU is divided in 35 legislative chap-ters, the analysis establishes a link between the used funds and the assessments of alignment and priorities for speci�c chapters. In this section of the analysis it is evident that signi�cant funds are focused towards chapters 23: Judiciary and fundamental rights and 24: Justice, freedom and security. This allocation is in conformity with the Commission’s new approach, according to which these two chapters are opened �rst and closed last in the accession negotiations. The funds for infrastructural projects in the Chapter Trans-European networks, as well as in the Chapter Environment are also highly visible.
In the process of designing the IPADATA database, as well as this analysis, progress was noted regarding the availability of information on IPA. First, the initial lack of informa-tion on the use of IPA was partially overcome by publishing lists of �nanced projects on the web sites of the responsible institutions. In this regard the data published in the annual reports of the Agency for Financial Support of Agriculture and Rural Develop-ment for 2010 and 2011 is especially useful. Our recommendation, as well as an expec-tation is that this trend of publishing data for projects �nanced by IPA will continue in the forthcoming period. Still, the existing data is not clearly comparable and the format depends of their source. Hence, there is a need for coordination regarding the presenta-tion of data on IPA by the di�erent responsible bodies. The enhancing of transparency is of particular signi�cance in the context of programming (as well as the use) of funds in the new �nancial framework and according to the IPA II regulation.
Having in mind the above presented information, the IPADATA database is a signi�cant step forward in the promotion of availability of information, both in terms of compiling the data into a single source, and organising them in a same or comparable format. While the �ndings of this review provide an initial insight in the use of IPA funds in the Republic of Macedonia, as well as their link with the EU accession process, we expect that the database will also be of bene�t for other actors and stakeholders involved in the implementation of IPA in the country.
22
26
26 On the web site of the Agency for Financial Support of Agriculture and Rural Development the Annual reports 2012 and 2013 are not published.

IPA – Component I National Program of the Republic of Macedonia
Republic of Macedonia
IPA 2007
IPA 2008
IPA 2009
IPA 2010
IPA 2011
IPA 2012
Total
Allocated
34,02
37,12
37,06
36,92
28,90
28,16
202,18
Contracted
31,80
34,00
35,32
30,13
0,00
0,00
131,25
% Contracted
93,48%
91,58%
95,30%
81,63%
0,00%
0,00%
64,92%
Paid out
31,09
26,86
17,73
3,01
0,00
0,00
78,69
% Paid out
91,39%
72,35%
47,84%
8,16%
0,00%
0,00%
38,92%
IPA – Component II (Cross-border cooperation) Program of the Republic of Macedonia
Republic of Macedonia
IPA 2007
IPA 2008
IPA 2009
IPA 2010
IPA 2011
IPA 2012
Total
Allocated
2,65
3,63
1,56
3,10
3,13
2,16
16,22
Contracted
1,03
3,06
0,00
0,05
0,00
0,00
4,13
% Contracted
38,65%
84,20%
0,00%
1,65%
0,00%
0,00%
25,49%
Paid out
0,90
2,15
0,00
0,04
0,00
0,00
3,10
% Paid out
34,03%
59,30%
0,00%
1,32%
0,00%
0,00%
19,09%
23
Annex: Financial data on implementation of the assistance on 31 December 2013 from the European Commission’s Report 2012. 27
IPA Republic of Macedonia Component I and 2.
Republic of Macedonia
IPA 2007
IPA 2008
IPA 2009
IPA 2010
IPA 2011
IPA 2012
Total
Allocated
36,67
40,75
40,09
40,01
32,03
30,31
219,87
Contracted
33,30
37,06
36,06
30,19
0,00
0,00
136,59
% Contracted
90,79%
90,92%
89,95%
75,44%
0,00%
0,00%
62,12%
Paid out
29,34
29,01
17,73
3,05
0,00
0,00
79,13
% Paid out
71,19%
44,23%
7,63%
0,00%
0,00%
35,99%
27 European Commission, Communication from the Commission to the European Parliament and the Council instrument for pre-accession assistance (IPA), Revised multi-annual indicative �nancial framework for 2012-2013, COM(2011) 641 �nal, Brussels, 12.10.2011;http://ec.europa.eu/enlargement/pdf/how_does_it_work/mi�_12_10_2011.pdf.

Bibliography
European Commission, Communication from the Commission to the European Parliament and the Council instrument for pre-accession assistance (IPA), Revised multi-annual indicative �nancial framework for 2012-2013, COM(2011) 641 �nal, Brussels,,12.10.2011;
European Commission, Report from the Commission to the European Parliament, the Council, and the European economic and Social Committee, 2012 annual report on http://ec.europa.eu/enlargement/pdf/key_documents/2013/2012_ipa_annual_report_with_annex_new_en.pdf
�nancial assistance for enlargement,
http://ec.europa.eu/enlargement/pdf/how_does_it_work/mi�_12_10_2011.pdf.
European Commission, Commission implementing decision adopting a National programme -Part II on the former Yugoslav Republic of Macedonia under the IPA Transi-tion Assistance and Institution Building Component for the year 2013 (draft), D030863/01,http://ec.europa.eu/transparency/regcomitology/index.cfm?do=Search.getPDF&hXRKYVoVsFEDuZvGzPDBWVqBB7fI4EnisQ1BdEUO8vC5SVAw47eF02NzJJLXFBE77kGvLzo2Pu5uyjPyPE0HGhn1Yyu8a5hceFqN5ixnqYI=
European Commission, Progress Report on the Republic of Macedonia for 2013, ,http://www.sep.gov.mk/data/�le/Progres%20report%202013/2013mk/mk_rapport_2013_MK4_21_10_2013.doc
24
European Policy Institute, The use of EU funds in Macedonia, collection of studies, November 2013,http://epi.org.mk/docs/koristenjeto_na_fondovite_na_eu_vo_rm.pdfEuropean Policy Institute, Initial analysis of the progress report of the European Com-mission on the Republic of Macedonia, October 2013, http://epi.org.mk/docs/prvicna_analiza_na_izvestajot_na_ek_za_napredokot_na_rm_za_2013(1).pdf

IPA program of the European Policy Institute
With the establishment of the European Policy Institute (EPI)-Skopje the implementa-tion of the multiannual program "IPA monitoring" commenced in which several and studies have been completed. This program was initiated primarily as a way of strengthening the cooperation with all stakeholders in the process, including the Parlia-ment, the media, academia, etc.
The Fridrich Ebert Foundation supported the preparation of case studies for all �ve components of IPA and an additional analysis for the absorption capacity of the Repub-lic of Macedonia in the use of EU funds. The original version of the collection of studies entitled "The use of EU funds in the Republic of Macedonia" is available on:
http://www.epi.org.mk/docs/use_of_eu_funds_in_rm_en.pdf
Besides this study, the Fridrich Ebert Foundation has also supported the publication of the public policy document “The use of IPA funds in the Republic of Macedonia– how to increase e�ciency?”
http://www.epi.org.mk/docs/koristenje_na_ipa_fondovite_vo_republika_makedonija(1).pdf
EPI in cooperation with the European Fund for the Balkans in 2013 published a study “Enhancing parliamentary scrutiny over the use of EU funds in the Republic of Mac-edonia.” http://www.epi.org.mk/docs/executive_summary_enhancing_parliamentary_scrutiny_over_the_use_of_eu_funds_in_rm%281%29.pdf
In August 2013 EPI published a public policy document “Partnership in the use of EU funds” supported by USAID.
25


![1 arXiv:2008.03087v1 [cs.CV] 7 Aug 2020 · driven methods that use deep networks [88,43,75,57,80,69,68,85,23,10,38] have been improved signi cantly, compared to traditional methods](https://img.pdfslide.us/doc/110x75/5fcba612b949fa72013e5ce6/1-arxiv200803087v1-cscv-7-aug-2020-driven-methods-that-use-deep-networks-8843755780696885231038.jpg)