Embed Size (px)
Citation preview
Final report Small research and development activity
project A traffic light soil water sensor for resource poor farmers: proof of concept
project number FSC/2013/002
date published September 2014
prepared by Richard Stirzaker, CSIRO Land and Water
co-authors/ contributors/ collaborators
Nick Car, CSIRO Land and Water Mario Chilundo, University of Eduardo Mondlane
approved by Dr Evan Christen ACIAR Land and Water Research Program Manager
final report number FR2014-18
ISBN 978 1 925133 37 0
published by ACIAR GPO Box 1571 Canberra ACT 2601 Australia
This publication is published by ACIAR ABN 34 864 955 427. Care is taken to ensure the accuracy of the information contained in this publication. However ACIAR cannot accept responsibility for the accuracy or completeness of the information or opinions contained in the publication. You should make your own enquiries before making decisions concerning your interests.
© Australian Centre for International Agricultural Research (ACIAR) 2014 - This work is copyright. Apart from any use as permitted under the Copyright Act 1968, no part may be reproduced by any process without prior written permission from ACIAR, GPO Box 1571, Canberra ACT 2601, Australia, [email protected].

Final report: A traffic light soil water sensor for resource poor farmers: proof of concept
Page ii
Contents
1 Acknowledgments .................................................................................... 3
2 Executive summary .................................................................................. 4
3 Introduction ............................................................................................... 6
4 The Problem Space .................................................................................. 8
5 The Solution Space ................................................................................ 12
6 Design of the sensor .............................................................................. 18
7 Sensor Calibration .................................................................................. 25
8 Field trials ................................................................................................ 29
9 Mozambique trials .................................................................................. 35
10 The Reader and App ............................................................................... 41
11 Conclusions and recommendations ..................................................... 44
11.1 Conclusions ........................................................................................................................44
11.2 Recommendations .............................................................................................................44
12 References .............................................................................................. 46
12.1 References cited in report ..................................................................................................46
12.2 List of publications produced by project .............................................................................47
Final report: A traffic light soil water sensor for resource poor farmers: proof of concept
Page 3
1 Acknowledgments
Those in the private sector who live and die by the products they sell, provide a sober
reality check to hopeful scientists. A good idea is not good enough. I learned, through
hard-won experience during a previous commercialisation attempt, to involve the private
sector from day 1.
I started talking to Andrew Skinner from Measurement Engineering Australia about this
project several years ago. I tried to persuade Andrew of a novel sensor design and
measurement system and he tried to persuade me how to use electronic engineering to
turn an idea into a product. We had less than a year to come up with a proof of concept
design prototype. We ended with a near commercial product.
Nick Car from CSIRO Land and Water did a spectacular job in building the phone app in a
very short space of time. Mario Chilundo from the University of Eduardo Mondlane in
Maputo supervised the field trials in Mozambique which were expertly run by Joaquim
(Jojo) Gracio. Gordon McLachlan from CSIRO Land and Water and Jack De Puit, a work
experience student, helped build the sensors.
Together we built and tested a sensor, reader and data delivery package ready for pre-
commercial release that works about as well as we could have hoped.

Final report: A traffic light soil water sensor for resource poor farmers: proof of concept
Page 4
2 Executive summary
The purpose of this project is to build literacy around soil water among researchers,
extension workers and farmers, through a simple sensor coupled with visual colour
display. Knowing how much water is in the soil is vital for irrigation management, so
farmers avoid plant stress on the one hand and over-irrigation, loss of nutrients and
waterlogging on the other. Knowing how much water is in the soil is also important for
dryland agriculture. Monitoring the filling and emptying of the root zone can help farmers
understand the consequences of changed soil and residue management, sowing times,
fertiliser use and other agronomic practices.
Currently there is no instrument for Developing Countries that can simplify water
measurement to the point that it can be widely used. The mission of this Small Research
Activity was to take a novel sensor idea, couple it to a visual colour display and pioneer a
data delivery and display system using phone apps. This was a one year proof of concept
study, which if successful, would position the package for further development and
commercialisation.
The objectives as set out in the SRA were:
1) Accuracy of sensor: select the combination of electrode arrangement and porous
media that gives step changes in resistance when moving from Green to Orange
(20-30 kPa) and Orange to Red (50-60 kPa).
2) Interface: Develop robust inexpensive interface that records the step change in
resistance and displays as three lights (diodes)
3) Acceptability: Road test the concept with partners in a developing country context
4) Develop phone apps to make data collection and display as simple and
meaningful as possible
We have developed a low cost soil water monitoring package for use in agriculture that
consists of a resistivity sensor that is buried in the soil, a reader which is connected to the
buried sensors and gives an output via colour diode as blue (wet), green (intermediate)
and red (dry) and a phone app where the visual output from the reader is entered and
subsequently time-stamped, geo-referenced and displayed for the user.
At each monitoring site, the sensors are buried in the ground at four different depths. The
reader is connected to each set of four sensors, with the blue/green/red light showing at
each of four depths, in response to the soil moisture status. The reader is portable and so
can be used to monitor any number of sensor installations.
Final report: A traffic light soil water sensor for resource poor farmers: proof of concept
Page 5
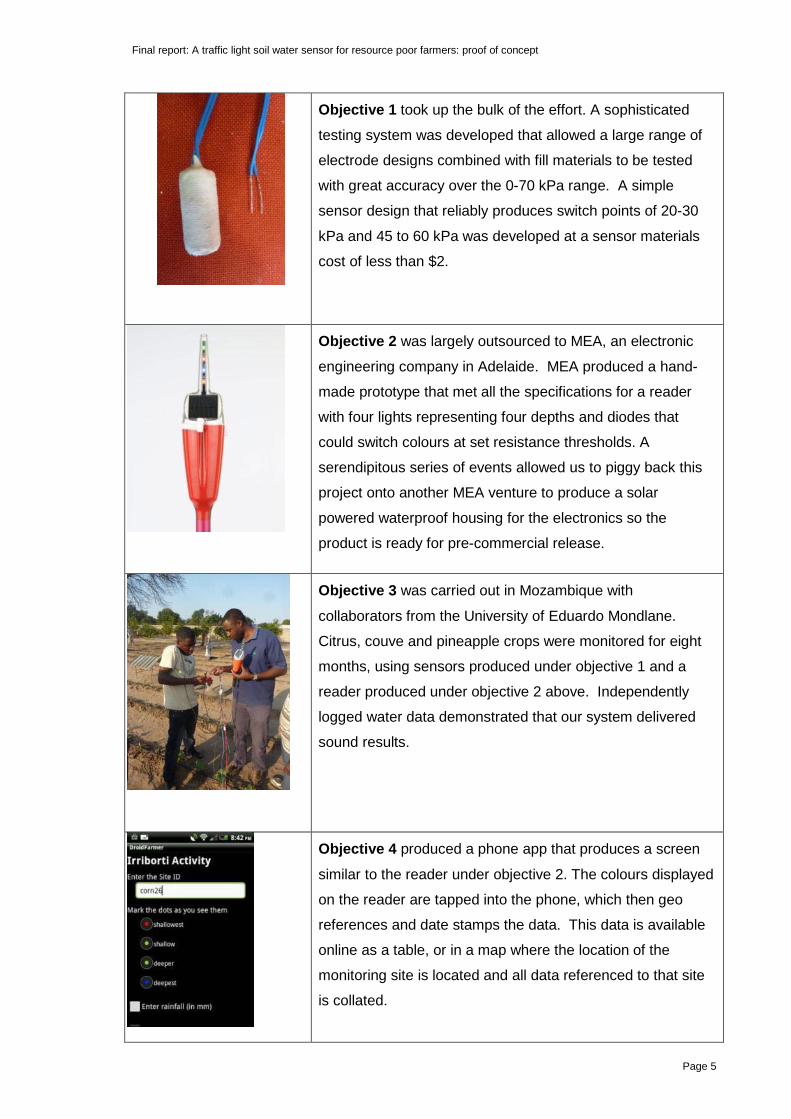
Objective 1 took up the bulk of the effort. A sophisticated
testing system was developed that allowed a large range of
electrode designs combined with fill materials to be tested
with great accuracy over the 0-70 kPa range. A simple
sensor design that reliably produces switch points of 20-30
kPa and 45 to 60 kPa was developed at a sensor materials
cost of less than $2.
Objective 2 was largely outsourced to MEA, an electronic
engineering company in Adelaide. MEA produced a hand-
made prototype that met all the specifications for a reader
with four lights representing four depths and diodes that
could switch colours at set resistance thresholds. A
serendipitous series of events allowed us to piggy back this
project onto another MEA venture to produce a solar
powered waterproof housing for the electronics so the
product is ready for pre-commercial release.
Objective 3 was carried out in Mozambique with
collaborators from the University of Eduardo Mondlane.
Citrus, couve and pineapple crops were monitored for eight
months, using sensors produced under objective 1 and a
reader produced under objective 2 above. Independently
logged water data demonstrated that our system delivered
sound results.
Objective 4 produced a phone app that produces a screen
similar to the reader under objective 2. The colours displayed
on the reader are tapped into the phone, which then geo
references and date stamps the data. This data is available
online as a table, or in a map where the location of the
monitoring site is located and all data referenced to that site
is collated.

Final report: A traffic light soil water sensor for resource poor farmers: proof of concept
Page 6
3 Introduction
The fundamental process in food production is the capture of carbon via photosynthesis,
producing biomass and then grain. In the process of capturing CO2 from the air, the plant
loses water through transpiration, so for each crop there is a tight relationship between
yield and water transpired. A well managed soil will allow more water to infiltrate by
minimising run-off and less to be leached by permitting a deep rooting zone. Regardless
of the farming system, from agroforestry to conservation agriculture to irrigation, the ability
to understand and optimise the trade between water and carbon is the key diagnostic for
improving yield.
At the field scale, only water that is transpired by the crop contributes to food production.
Losses of water through runoff, direct evaporation from the soil surface, leaching below
the root zone, and water left in the profile after harvest all reduce yield below its potential
(Passioura and Angus 2010, Fig 1). Rainfall and yield are easy to measure, but run-off,
soil evaporation and leaching can only be reliably quantified using specialised research
equipment, if at all. In the broadest sense, this project gives the farmer an indication of
which processes in Fig 1 may be dominating at any one time and thus a framework to
learn how to manage the soil, crop and other inputs in a way that maximises transpiration
and hence yield.
.
Figure 1. Turning water into grain (from Passioura and Angas 2010)
Final report: A traffic light soil water sensor for resource poor farmers: proof of concept
Page 7
This proof of concept stage has designed and developed a simple soil water sensor and
an accompanying reader that measures the soil water status at four depths in the soil
profile. The reader displays the water status via coloured diode lights, which display blue
in wet soil, red in dry soil and green as the ‘intermediate’ soil water level. The switch
points between blue, green and red lights are based on the extensive literature for
avoiding crop water stress for most irrigated crops.
For this study we have focused on a soil water sensor for irrigated agriculture, as this is
the domain where the fastest gains in water productivity can be realised. However we
were approached by other researchers who were interested in using this sensor and
reader display for different purposes. One group working on wet/dry rice wanted the lights
to change colour at much wetter set points than is normally the case for most irrigated
crops. The other wanted to use the sensor to study deep water extraction by non-irrigated
crops. Thus the sensor and reader have been developed with a flexible design that would
allow for a variety of irrigation and dryland applications.
Final report: A traffic light soil water sensor for resource poor farmers: proof of concept
Page 8
4 The Problem Space
There is a long history of measuring soil water, most of which comes from the irrigation
industry for the obvious reason that water inputs can be controlled. Below I briefly review
the Australian experience, as a country with scarce water resources and with a record of
technology adoption. Prior to 1990, irrigators had three options for measuring soil water,
namely the gypsum block, tensiometer and neutron probe. The gypsum block fell out of
favour because it is insensitive in the ‘wet’ range which is of most interest to irrigators. The
tensiometer is still favoured by some because of its simplicity and accuracy, but requires
regular maintenance in the field. The neutron probe is also accurate, but is very time
consuming to read, and requires stringent safety requirements because of the radiation
source.
The tensiometer and neutron probe started to be replaced during the 1990s by a range of
new tools based largely on the capacitance method. These new tools are not as accurate
as the ones they replaced (Evett et al. 2006), but they are far more time efficient, as they
can be logged and telemetry can deliver the information to the office computer. By 2000,
so many new tools had come on the market that the choice was bewildering for scientists
as well as farmers. This period coincided with a period of water reform in Australia, with
State governments promoting and subsiding soil water measurement tools. Charlesworth
(2005) gives a comprehensive review of all commercially available tools and includes
testimonials from farmers, who expressed their amazement at being able to cut water
application by up to two thirds whilst increasing crop yield and quality. Such stories do not
appear to be isolated victories. A review of one major State Government initiative showed
a 12-32% increase in water use efficiency across entire irrigated industries, through a
combination of demonstration, education and training of which soil water monitoring
played a central role (Okello-Okanya 2005).
At approximately five year intervals, all Australian irrigation farmers are asked the
following question in a census “What tools did you use to decide when to irrigate and/or
how much water to apply” and the choices include the following:
• Evaporation figures or graphs • Tensiometers • Soil probes, e.g. neutron probes, capacitance probes • Government or commercial scheduling service • Calendar/rotational scheduling • Your knowledge/observation • Other (please specify)

Final report: A traffic light soil water sensor for resource poor farmers: proof of concept
Page 9
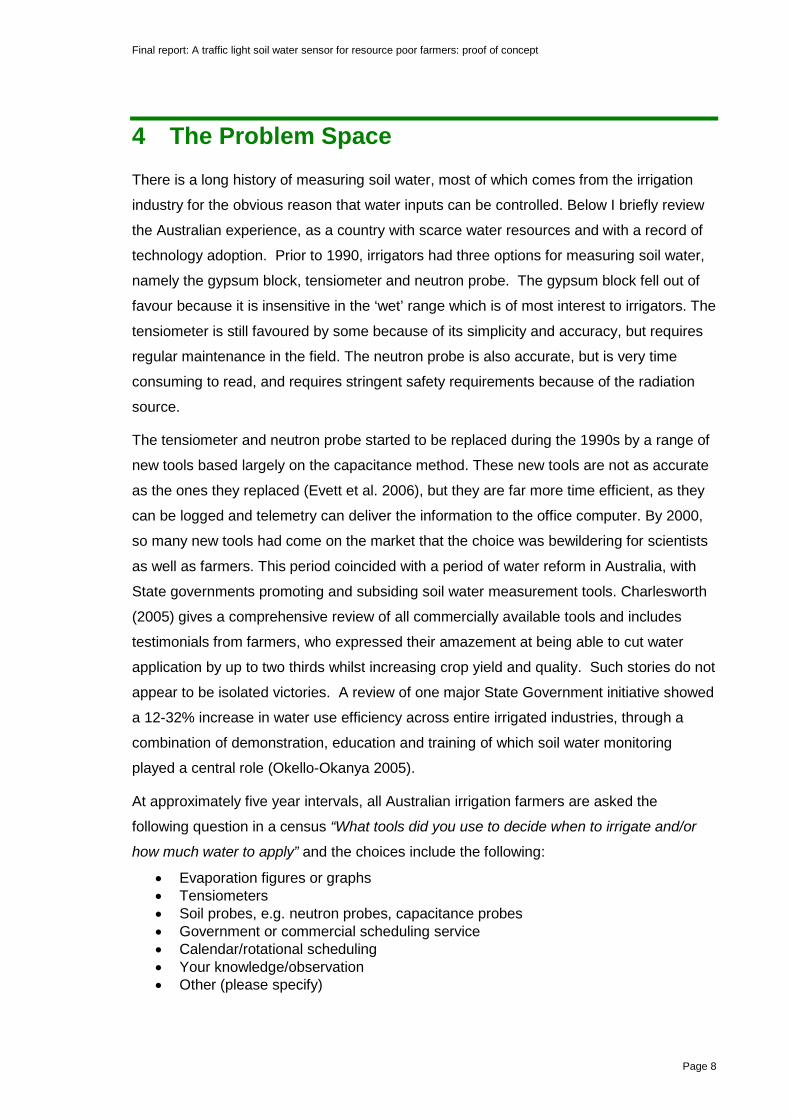
In 1996, 11% of irrigators reported that they measured soil water using a tensiometer or
probe. This increased to 16% by 2001 and 23% by 2003 (Fig 2). This steady increase
coincided with a period when a greater range of soil water monitoring tools were coming
onto the market and State governments were rolling out training and subsidy programs
totalling tens of millions of dollars. Yet the 2008 data tells a very different story.
Percentage adoption crept up just 2% in the intervening 5 years. The absolute number of
irrigators using the tools stayed almost exactly the same, as the total number of irrigators
declined over the period due to the drought and other reforms.
Figure 2. The percentage of irrigation farmers in Australia (left axis) and the absolute number (right axis) using tools to measuring soil water status
Curiously, 3881 irrigators reported in the 2003 census that they intended to install soil
moisture monitoring equipment, but this does not materialise. All that the census data
shows is that some tensiometer users became probe users, although it is probable that
irrigators already in the monitoring camp expanded their activities (Fig 3). Commercial or
government sponsored scheduling services played a minor role, only reaching 2-3% of
irrigators.
Back in 2003 it would have been reasonable to view the 11% in 1996 as early adopters
and the rise to 25% as the early majority according to Rogers (2003). Further
improvement in the tools and better promotion and training would usher in the late
majority, with perhaps only the laggards refusing to adopt. Yet the data from 2009
suggests that 25% may be a ceiling, and that the majority of irrigators are actively
choosing not to adopt (Pannel et al 2006). This has opened the way for social scientists
to explore how irrigators really make decisions about water use in much greater depth.
0
3000
6000
9000
12000
15000
18000
0%
5%
10%
15%
20%
25%
30%
1995 2000 2005 2010Ab
solu
te n
umbe
r of f
arm
ers
mea
surin
g
Farm
ers m
easu
ring (
% o
f irr
igat
ors) Percentage
Absolute
Final report: A traffic light soil water sensor for resource poor farmers: proof of concept
Page 10
Figure 3. The number of irrigation farmers in Australia using tensiometers, probes or a government / commercial scheduling service
Whittenbury and Davidson (2010) interviewed irrigators in Australia to find out how they
made their day to day decisions and found that:
I) soil water measurement is just one of several objective measures a farmer
may use, combined with factors such as impending weather, crop growth
stage, availability of water and electricity tariffs
II) the objective measures above are then filtered through a suite of more
subjective influences such as prior knowledge, rules of thumb that have
worked in the past and the farmers’ ability to detect stress through their
experience or ‘affinity’ with their crop.
III) the objective and subjective factors sit within a wider set of socio-cultural
influences, including family and rural values, local industry norms and
expectations and the behaviour of neighbours.
Almost all growers admitted that despite paying large sums of money for sophisticated
equipment, they still used a shovel so they could see the soil ‘wetness’ for themselves.
Others expressed the view that the equipment is just a ‘guide’, is not always reliable and
that ‘probes sometimes lie’. Irrigators gave their prior experiential knowledge priority over
the numbers coming from the tool and were reluctant to cede control to technical device
(Whittenbury and Davidson 2010). These findings resonate with other studies that have
tried to deliver Decision Support Systems or other solutions to farmers. They found that
the business of farm decision making was much more than manipulating some biophysical
data (McCown, 2002, Matthews et al. 2008) and farmers often preferred simpler forms of
information as an input into their own decision making framework rather than believing the
output of some tool or DSS. This seems to be true for irrigation decisions. The vast
0
1000
2000
3000
4000
5000
6000
7000
1995 2000 2005 2010
Num
ber o
f far
mer
s usi
ngTensiometers
Probes
Service
Final report: A traffic light soil water sensor for resource poor farmers: proof of concept
Page 11
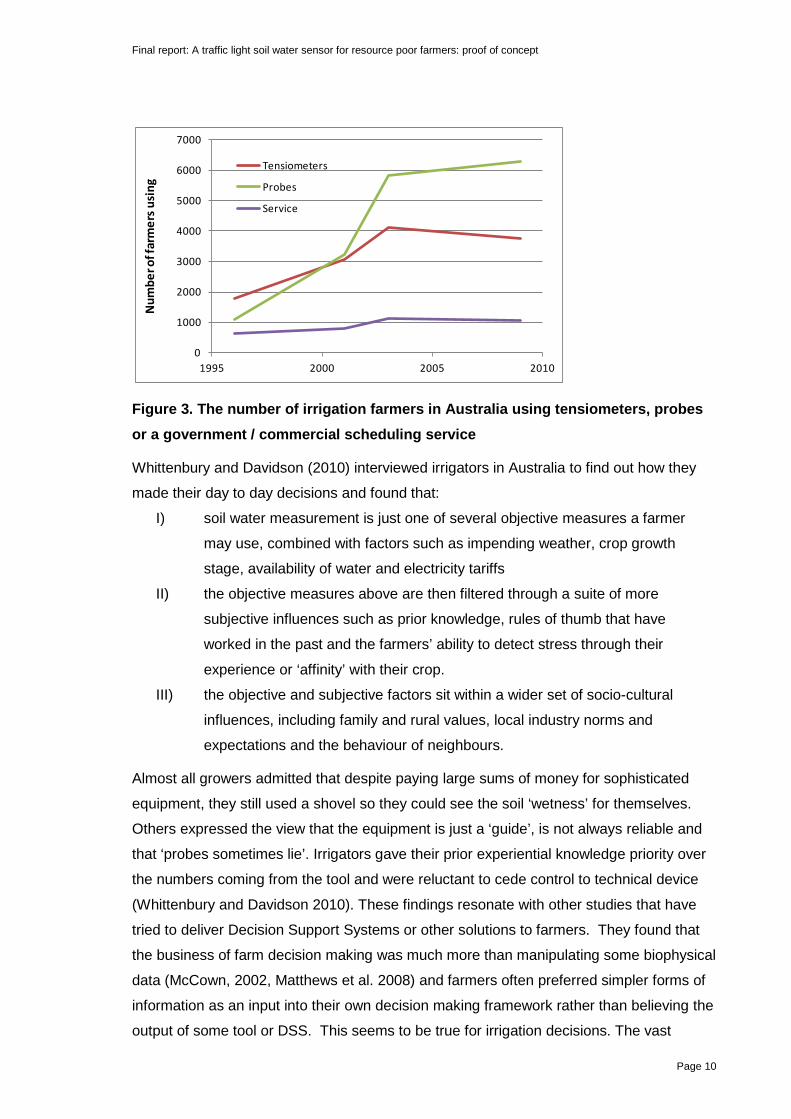
majority of irrigators responded to the census question “What tools did you use to decide
when to irrigate and/or how much water to apply” selected the option “Your Knowledge /
Experience” (Fig 4).
Figure 4. Percentage of Australian irrigators citing they use their own experience to guide how much water to apply compared to those who use an objective tool (multiple responses allowed, numbers can sum to > 100%)
A similar experience has been observed among advanced large scale commercial farmers
in South Africa (Stevens et al 2005). Only 18% claimed to use an objective measure, with
the majority citing the central role of their intuition in making irrigation decisions. Although
‘intuition’ sounds like an overly subjective and unprofessional form of decision making,
Whittenbury and Davidson (2010) discuss how intuition can be a non-conscious process
of recognising patterns that allows for speedy and sound decisions. It makes sense then
that objective of ‘scientific’ approaches should not try to displace subjective experience,
but be simplified to feed into the pattern recognising intuitive approach.
The South African experience is also instructive in that a number of determined attempts
have been made to transfer soil water monitoring of some sort to small scale farmers
(Singles et al , Stirzaker et al 2004, Annandale et al 2011). Success has been modest at
best, confirming that the scientific community is yet to find sufficiently simple but useful
approaches.
0%
10%
20%
30%
40%
50%
60%
70%
80%
90%
100%
1995 2000 2005 2010
Farm
ers c
hoic
e (%
of i
rrig
ator
s)
Objective tool
Experience
Final report: A traffic light soil water sensor for resource poor farmers: proof of concept
Page 12
5 The Solution Space
The foregoing discussion makes three propositions:
1. Giving farmers the ability to “see” what the crop is experiencing provides a
framework for learning how to improve water use and yield
2. Adoption of objective tools for measuring soil water has reached a ceiling during a
period when the technology has been advancing
3. Social science studies point to the need for simpler tools that build on farmers’
existing knowledge and help with pattern recognition and intuitive decision making
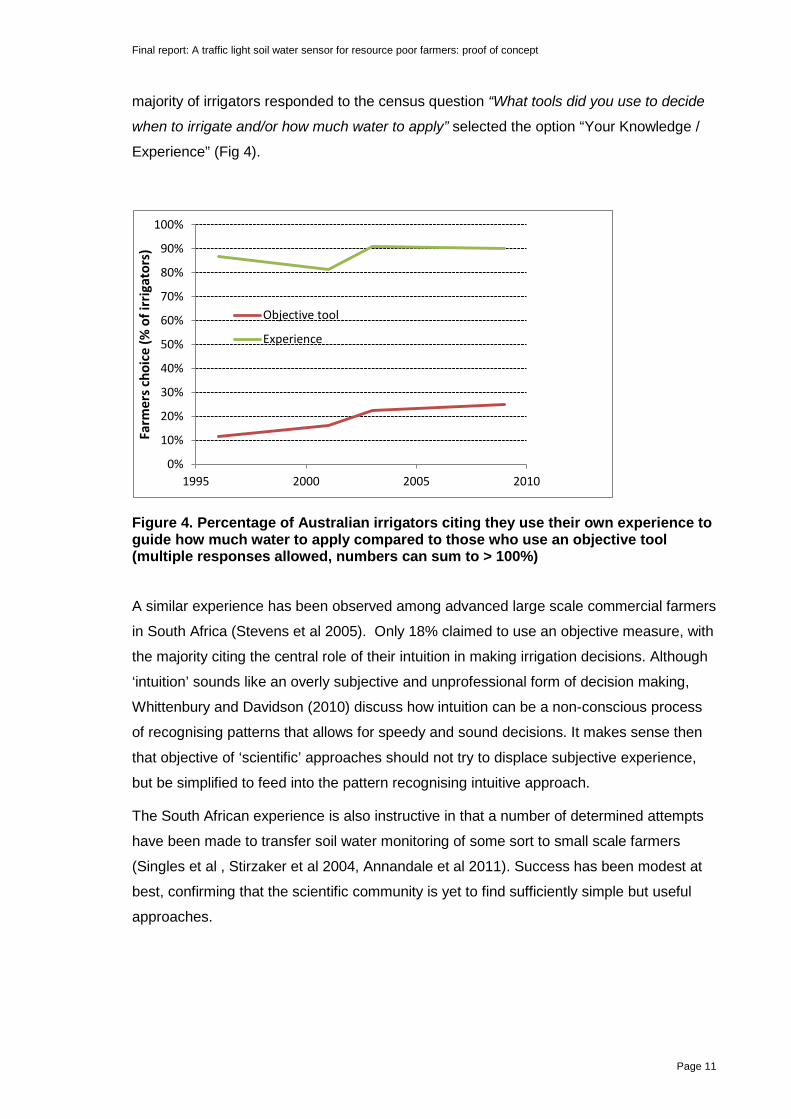
The last point is expanded in Fig 5, which provides a framework that relates the
development of technology (detail) with the benefit to the users (Stirzaker et al. 2010).
The framework asserts that for an irrigator benefit (increase water productivity), they must
engage with some of the ‘detail’ or knowledge that underpins this subject. For example an
irrigator may choose to auger holes to observe and feel the soil in the root zone, then
make a decision about soil wetness, and so move to position 1 in Fig 5. They have
expended some effort, engaged some of the detail, and derived some benefit. Next they
install several tensiometers at different depths, engage more detail and derive more
benefit as they move towards position 2.
Figure 5. The relationship between detail and utility
1
2
3
Water measurement too expensive or complicated for the majority
Simplified approach gives greater benefit
New detail improve utility again
Some measurement improves performance
Benefit to irrigator
Det
ail
4
5
Final report: A traffic light soil water sensor for resource poor farmers: proof of concept
Page 13
Up to position 2, there is a positive correlation between expending more effort or expense
(i.e. engaging more detail) and deriving more benefit. It thus seems reasonable that
continuing along this trajectory will bring even more benefit. The irrigator may abandon the
tensiometers and move to a system of capacitance probes read hourly at 10 depths. This
of course may be useful to irrigators in certain circumstances, but if we were considering
the X axis in Fig 5 as adoption, the positive correlation between improvement of
technology and adoption is no longer evident, as shown in Fig 2.
The trajectory off to position 3 represents the situation where the technology has become
over-complicated. From an engineering perspective, more data from more places more
often should improve decision making. This might be true if the irrigator could respond
immediately to all the new information. In reality, fields and farms are highly variable,
water may not be available on demand, and it could take many days to irrigate the whole
farm. Moreover irrigation deemed necessary by the technology may not be desirable
because of the priority of other cultural practice, variations in electricity tariffs, or lifestyle
choices.
If we recognise that we may be on the trajectory towards position 3, it is important to
return to position 2 and reframe the question: i.e. what exactly do the beneficiaries need to
know? In this case we are assuming that current technology meets the requirements of
the top quartile of irrigators of a developed country, and the beneficiaries we are aiming
for are small scale farmers in developing countries. Re-framing involves identifying the
minimum amount of information that is useful for addressing the problem at hand and to
which the irrigator can make a reasonable response. Re-framing often involves
simplification, or stripping away the detail that is not required.
In developing a new soil water monitoring system for developing countries, the following
points were seen as prerequisites for simplicity:
1. Avoid the problem of interpretation: the output from the sensor must be
meaningful without recourse to additional soil specific information such as ‘full’ and
‘refill’ points.
2. Avoid the problem of installation: Soil disturbance introduces error to water content
measuring devices
3. Avoid complicated units: units such as negative pressures and percentage of pore
filled space are difficult for non-specialists
4. Avoid loggers and graphical representation of data: most farmers find graphs hard
to follow, especially when multiple depths are shown together
Final report: A traffic light soil water sensor for resource poor farmers: proof of concept
Page 14
5. Avoid spurious claims of accuracy: since it is impossible for farmers to verify
accuracy, it is better that the irrigators know the benefits and limitations of the
instrument, than believe the numbers are correct.
Problems of interpretation and installation (points 1 & 2 above) are largely addressed by
developing a sensor that measures soil water tension, not water content. Soil water
tension is the measure of stress that the plant actually experiences, and is independent of
the soil type (sand, loam, clay). Tension measurements also overcome many of the
problems experienced during installation. A tension sensor only needs to be in contact
with the soil so the water potentials can equilibrate. A water content sensor measures the
soil surrounding itself, so gaps between sensor and soil or changes to soil density are
reflected by incorrect readings.
The problem of complicated units (point 3) is dealt with by dividing the tension scale into
wet, intermediate and dry and representing these by colour. Logging and telemetry (point
4) are necessary labour saving aids for the top end of the market, but not necessary for
our target audience. The expense of logging sensors means that there are often few sites
with good temporal resolution (say hourly). A learning framework requires better spatial
information (more fields, top and bottom of row etc) but the information is required much
less often (daily or twice per week). We are therefore replacing loggers with phone apps
for manual collection of data which is then subsequently collated, stored, and displayed on
the web.
The original analogy of a traffic light (green, orange and red), reflected in the title of the
SRA was soon found to be deficient, and the sensor received the name of “The
Chameleon” by African co-workers, because it ‘changes colour to reflect its surroundings.’
For technical reasons (orange is too close to red in sunlight) as well as sociological
reasons (orange means warning), the colours adopted were BLUE (wet), GREEN (moist)
and RED (dry).
Accuracy (point 5) remains a key sticking point for any new sensor. The question of
accuracy needs to be evaluated from three perspectives namely:
1. The target tension range being managed for
2. The accuracy of the device under controlled conditions
3. The site to site variability within a managed unit (irrigated field)
From the perspective of the plant, there are generally agreed ranges of soil tensions
during which irrigation should take place. Vegetable crops are the most sensitive to water
stress and thus have the most stringent requirements for sensor accuracy. Most
vegetable crops need to be irrigated in the 30-45 kPa range, with the most sensitive
needing to be irrigated before 30 kPa and the least sensitive after 50 kPa (Table 1).

Final report: A traffic light soil water sensor for resource poor farmers: proof of concept
Page 15
Table 1. The colour used to denote wet, moist and dry soil, the typical ranges suggested for irrigation and associated vegetable crops (drawn from Christen et al 2006)
Colour Water level
(Meaning)
Irrigate in
this range
(or before)
VEGETABLE CROP
Blue Wet soil 20-30 kPa Broccoli, Celery, Lettuce, Onion
Green Moist soil 30-45 kPa Beans, Cabbage, Carrot, Capsicum, Corn,
Cucumber, Eggplant, Melons, Potato, Tomato,
Red Dry soil >60 kPa Beet, Peas, Sweet potato, Pumpkin
The accuracy of new gauge type tensiometers ($150-300) is ± 2 kPa at best. At this level
of accuracy the tensiometer could adequately indicate which tension range the soil was in
(Table 1). The popularity of the tensiometer appears to have peaked in Australia (Fig 3),
and is being replaced by electronic devices such as the Watermark ($50-80) and Decagon
MPS1 ($200-300), both which can be logged. The accuracy of the Watermark and MPS1
devices was evaluated on a tension table over the 5-80 kPa range monitored by five
electronic tensiometers. In each case 7 sensors were evaluated, with the worst one being
discarded. The lowest, average and highest readings are shown on the graph, with the
dotted line representing the 1:1 line. In Fig 6 we see that the temperature corrected
Watermark sensor is accurate in the 10-25 kPa range, but reads increasingly too low as
the tension increases from 30 to 80 kPa. For example, when the watermark reading is 37
kPa, this indicates “moist soil” or the green range in Table 1, and irrigation may not be
activated. Yet the real tension is 60 kPa, so the crop would be in the red zone and under
stress.
0
10
20
30
40
50
60
70
80
90
100
0 20 40 60 80 100
Wat
erm
ark r
eadi
ng (k
Pa)
Tensiometer (kPa)
WatermarkLowest
Average
Highest

Final report: A traffic light soil water sensor for resource poor farmers: proof of concept
Page 16
Figure 6. The lowest, highest and average tension readings of six Watermark sensors over a drying cycle. The dotted line indicates the correct response
The more expensive MPS1, which consists of a capacitance sensor inserted into a
ceramic, also tends to read too low. In this case if the average reading is 37 kPa the real
reading is 50 kPa. More problematic is the variability among sensors, which rises to 43
kPa at a tension of 80 kPa (Figure 7).
Figure 7. The lowest, highest and average tension readings of six MPS1 sensors over a drying cycle. The dotted line indicates the correct response
The final consideration is the site to site variability within an irrigated field. The example in
Fig 8 comes from a commercial drip irrigated peach orchard where tensiometers at three
depths (30, 60 and 90 cm) were logged at 15 minute intervals in six different locations.
The data shows a wet period centred around 17 Oct, followed by a drying trend and a
second wet period around 7 Nov, followed by a second drying event. Two features stand
out: there is more variability in dry periods than wet and there is less variability with depth.
Uniformity during the wet period occurs because the profile is over-watered, as evidenced
by declining tensions at 90 cm. Increasing variability during the drying phase is expected
due to variability in irrigation, soil and tree uniformity. Assuming the crop needed to be
irrigated in the ‘green range’ in Table 1, then at the 30 cm depth three sites show the
orchard does not need irrigation, one site shows that it does (green line) and one site
shows irrigation should have occurred several days before (purple line). Given this
variability, an instrument accuracy of 2 kPa is not warranted. However the uncertainty in
the Watermark is also not acceptable, because it effectively reads one ‘level’ too low.
0
10
20
30
40
50
60
70
80
90
100
0 20 40 60 80 100
Wat
erm
ark r
eadi
ng (k
Pa)
Tensiometer (kPa)
MPS1Lowest
Averae
Highest

Final report: A traffic light soil water sensor for resource poor farmers: proof of concept
Page 17
Figure 8. Soil tension at depths of 30, 60 and 90 cm logged by tensiometers at 15 minute intervals
Over the past few years a number of cheap sensors have come on the market, but almost
all of these are water content measuring devices based on the dielectric method and do
not satisfy our requirements for simplicity. An inexpensive tensiometer (the PAU
tensiometer), has been produced by the Punjab Agricultural University, but I was unable
to find any published material demonstrating its accuracy, nor positive endorsements from
those who had tried using it.
Methods based on measuring the moisture content of a ceramic, such as those shown in
Fig 7 are still far too expensive and still not very accurate. Thus the decision was taken to
re-design the resistivity approach as used by the gypsum block and Watermark sensors,
as there is already considerable prior art and market acceptance of this method.
0
20
40
60
80
100
Soi
l ten
sion
(K
pa) 30 cm
0
20
40
60
80
100
Soi
l ten
sion
(kP
a) 60 cm
0
20
40
60
80
100
10-Oct 17-Oct 24-Oct 31-Oct 07-Nov 14-Nov 21-Nov
Soi
l ten
sion
(kP
a)
90 cm
Final report: A traffic light soil water sensor for resource poor farmers: proof of concept
Page 18
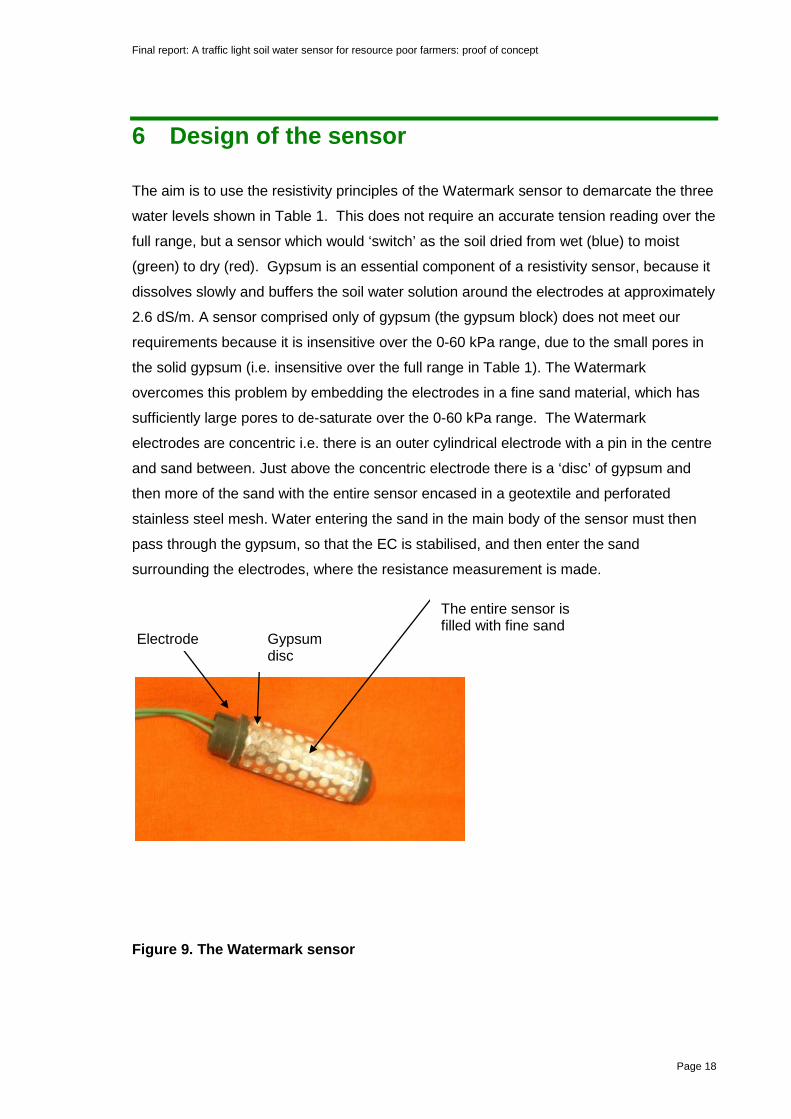
6 Design of the sensor
The aim is to use the resistivity principles of the Watermark sensor to demarcate the three
water levels shown in Table 1. This does not require an accurate tension reading over the
full range, but a sensor which would ‘switch’ as the soil dried from wet (blue) to moist
(green) to dry (red). Gypsum is an essential component of a resistivity sensor, because it
dissolves slowly and buffers the soil water solution around the electrodes at approximately
2.6 dS/m. A sensor comprised only of gypsum (the gypsum block) does not meet our
requirements because it is insensitive over the 0-60 kPa range, due to the small pores in
the solid gypsum (i.e. insensitive over the full range in Table 1). The Watermark
overcomes this problem by embedding the electrodes in a fine sand material, which has
sufficiently large pores to de-saturate over the 0-60 kPa range. The Watermark
electrodes are concentric i.e. there is an outer cylindrical electrode with a pin in the centre
and sand between. Just above the concentric electrode there is a ‘disc’ of gypsum and
then more of the sand with the entire sensor encased in a geotextile and perforated
stainless steel mesh. Water entering the sand in the main body of the sensor must then
pass through the gypsum, so that the EC is stabilised, and then enter the sand
surrounding the electrodes, where the resistance measurement is made.
Figure 9. The Watermark sensor
Electrode
The entire sensor is filled with fine sand
Gypsum disc
Final report: A traffic light soil water sensor for resource poor farmers: proof of concept
Page 19
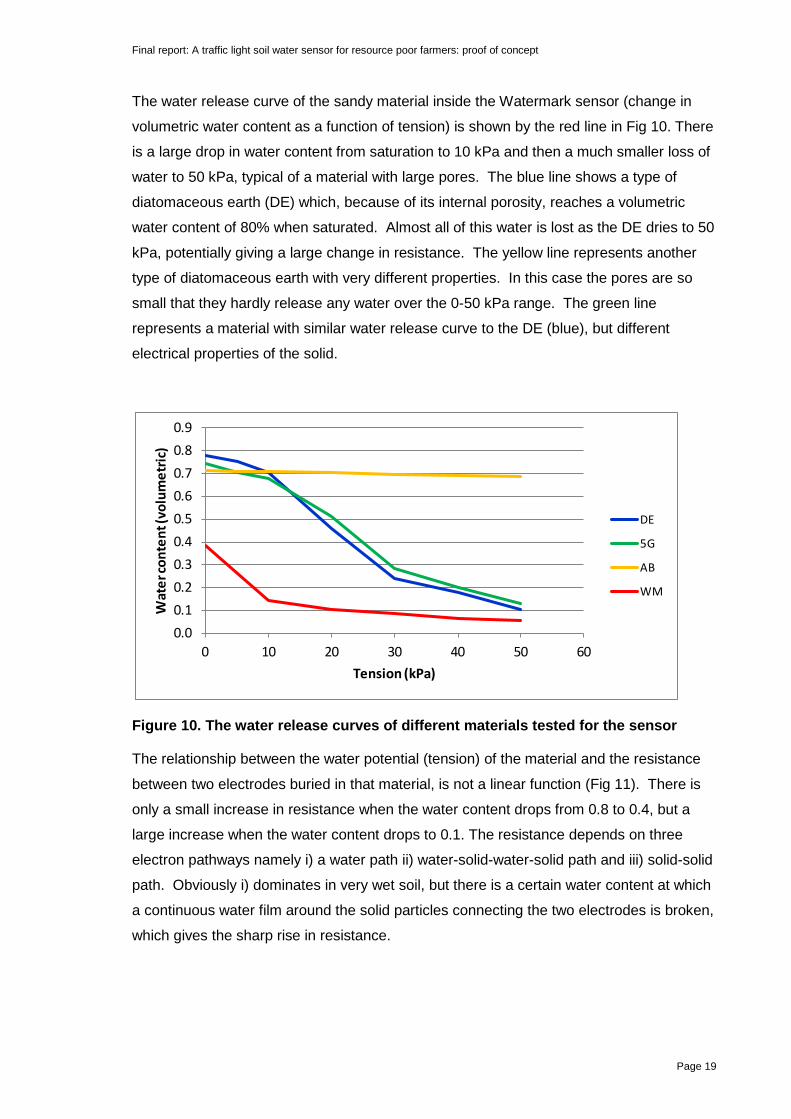
The water release curve of the sandy material inside the Watermark sensor (change in
volumetric water content as a function of tension) is shown by the red line in Fig 10. There
is a large drop in water content from saturation to 10 kPa and then a much smaller loss of
water to 50 kPa, typical of a material with large pores. The blue line shows a type of
diatomaceous earth (DE) which, because of its internal porosity, reaches a volumetric
water content of 80% when saturated. Almost all of this water is lost as the DE dries to 50
kPa, potentially giving a large change in resistance. The yellow line represents another
type of diatomaceous earth with very different properties. In this case the pores are so
small that they hardly release any water over the 0-50 kPa range. The green line
represents a material with similar water release curve to the DE (blue), but different
electrical properties of the solid.
Figure 10. The water release curves of different materials tested for the sensor
The relationship between the water potential (tension) of the material and the resistance
between two electrodes buried in that material, is not a linear function (Fig 11). There is
only a small increase in resistance when the water content drops from 0.8 to 0.4, but a
large increase when the water content drops to 0.1. The resistance depends on three
electron pathways namely i) a water path ii) water-solid-water-solid path and iii) solid-solid
path. Obviously i) dominates in very wet soil, but there is a certain water content at which
a continuous water film around the solid particles connecting the two electrodes is broken,
which gives the sharp rise in resistance.
0.00.10.20.30.40.50.60.70.80.9
0 10 20 30 40 50 60
Wat
er co
nten
t (vo
lum
etric
)
Tension (kPa)
DE
5G
AB
WM
Final report: A traffic light soil water sensor for resource poor farmers: proof of concept
Page 20
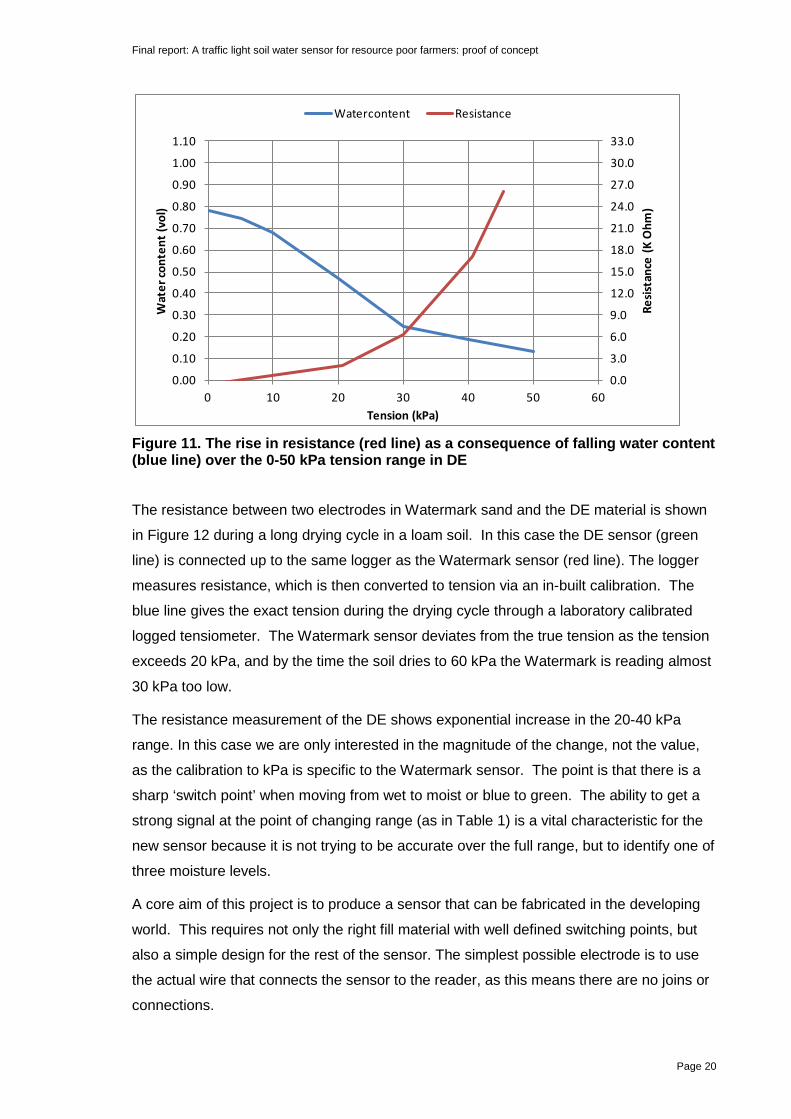
Figure 11. The rise in resistance (red line) as a consequence of falling water content (blue line) over the 0-50 kPa tension range in DE
The resistance between two electrodes in Watermark sand and the DE material is shown
in Figure 12 during a long drying cycle in a loam soil. In this case the DE sensor (green
line) is connected up to the same logger as the Watermark sensor (red line). The logger
measures resistance, which is then converted to tension via an in-built calibration. The
blue line gives the exact tension during the drying cycle through a laboratory calibrated
logged tensiometer. The Watermark sensor deviates from the true tension as the tension
exceeds 20 kPa, and by the time the soil dries to 60 kPa the Watermark is reading almost
30 kPa too low.
The resistance measurement of the DE shows exponential increase in the 20-40 kPa
range. In this case we are only interested in the magnitude of the change, not the value,
as the calibration to kPa is specific to the Watermark sensor. The point is that there is a
sharp ‘switch point’ when moving from wet to moist or blue to green. The ability to get a
strong signal at the point of changing range (as in Table 1) is a vital characteristic for the
new sensor because it is not trying to be accurate over the full range, but to identify one of
three moisture levels.
A core aim of this project is to produce a sensor that can be fabricated in the developing
world. This requires not only the right fill material with well defined switching points, but
also a simple design for the rest of the sensor. The simplest possible electrode is to use
the actual wire that connects the sensor to the reader, as this means there are no joins or
connections.
0.0
3.0
6.0
9.0
12.0
15.0
18.0
21.0
24.0
27.0
30.0
33.0
0.00
0.10
0.20
0.30
0.40
0.50
0.60
0.70
0.80
0.90
1.00
1.10
0 10 20 30 40 50 60
Resis
tanc
e (K
Ohm
)
Wat
er co
nten
t (vo
l)
Tension (kPa)
Watercontent Resistance
Final report: A traffic light soil water sensor for resource poor farmers: proof of concept
Page 21
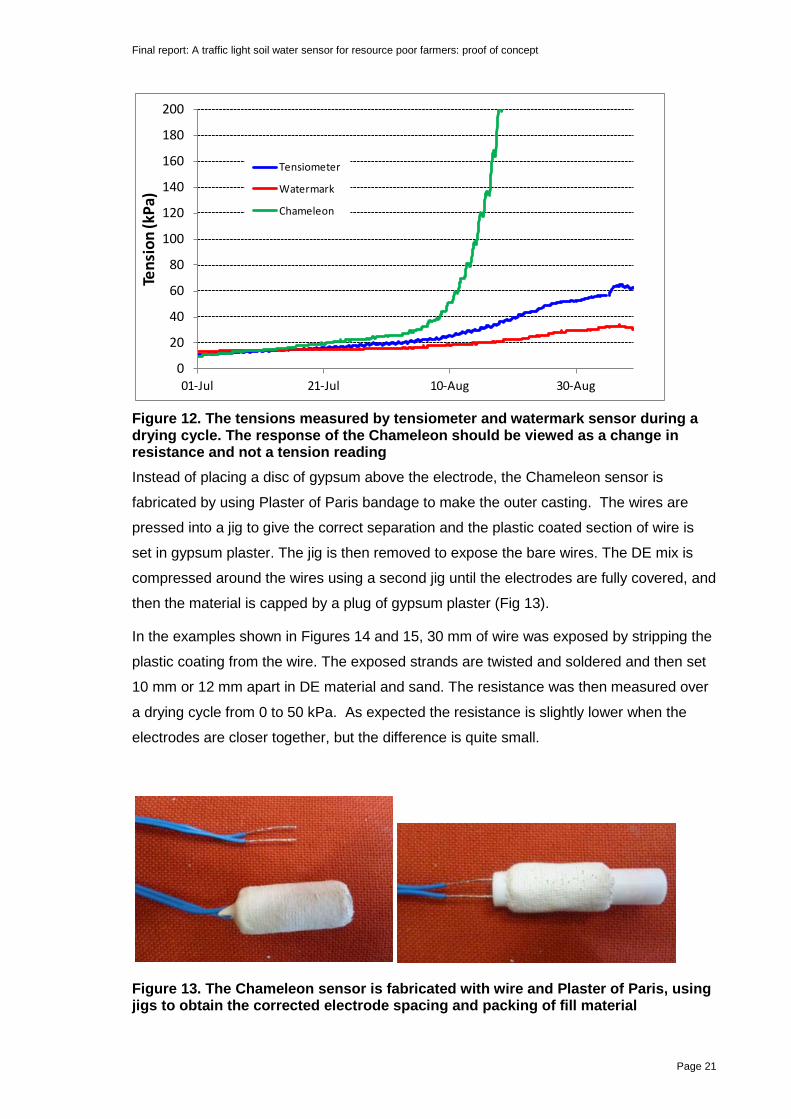
Figure 12. The tensions measured by tensiometer and watermark sensor during a drying cycle. The response of the Chameleon should be viewed as a change in resistance and not a tension reading Instead of placing a disc of gypsum above the electrode, the Chameleon sensor is
fabricated by using Plaster of Paris bandage to make the outer casting. The wires are
pressed into a jig to give the correct separation and the plastic coated section of wire is
set in gypsum plaster. The jig is then removed to expose the bare wires. The DE mix is
compressed around the wires using a second jig until the electrodes are fully covered, and
then the material is capped by a plug of gypsum plaster (Fig 13).
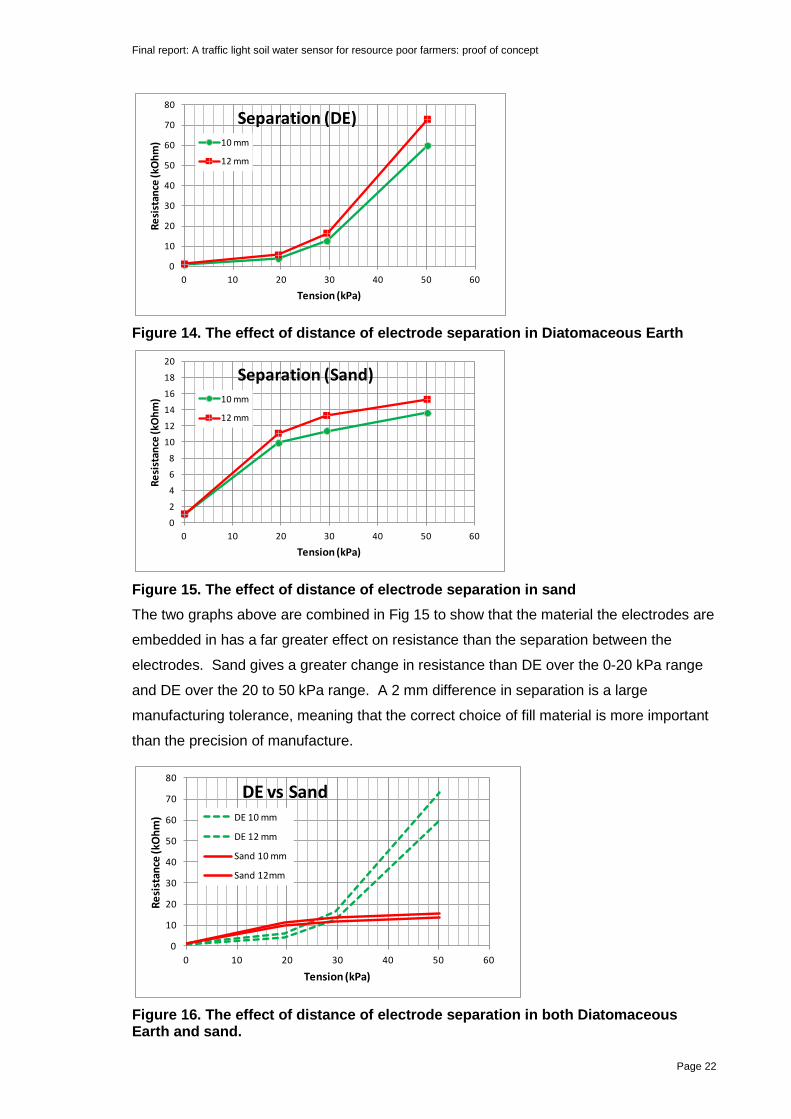
In the examples shown in Figures 14 and 15, 30 mm of wire was exposed by stripping the
plastic coating from the wire. The exposed strands are twisted and soldered and then set
10 mm or 12 mm apart in DE material and sand. The resistance was then measured over
a drying cycle from 0 to 50 kPa. As expected the resistance is slightly lower when the
electrodes are closer together, but the difference is quite small.
Figure 13. The Chameleon sensor is fabricated with wire and Plaster of Paris, using jigs to obtain the corrected electrode spacing and packing of fill material
0
20
40
60
80
100
120
140
160
180
200
01-Jul 21-Jul 10-Aug 30-Aug
Tens
ion
(kPa
)Tensiometer
Watermark
Chameleon
Final report: A traffic light soil water sensor for resource poor farmers: proof of concept
Page 22
Figure 14. The effect of distance of electrode separation in Diatomaceous Earth
Figure 15. The effect of distance of electrode separation in sand The two graphs above are combined in Fig 15 to show that the material the electrodes are
embedded in has a far greater effect on resistance than the separation between the
electrodes. Sand gives a greater change in resistance than DE over the 0-20 kPa range
and DE over the 20 to 50 kPa range. A 2 mm difference in separation is a large
manufacturing tolerance, meaning that the correct choice of fill material is more important
than the precision of manufacture.
Figure 16. The effect of distance of electrode separation in both Diatomaceous Earth and sand.
0
10
20
30
40
50
60
70
80
0 10 20 30 40 50 60
Resi
stan
ce (k
Ohm
)
Tension (kPa)
Separation (DE)10 mm
12 mm
0
2
4
6
8
10
12
14
16
18
20
0 10 20 30 40 50 60
Resi
stan
ce (k
Ohm
)
Tension (kPa)
Separation (Sand)10 mm
12 mm
0
10
20
30
40
50
60
70
80
0 10 20 30 40 50 60
Resi
stan
ce (k
Ohm
)
Tension (kPa)
DE vs SandDE 10 mm
DE 12 mm
Sand 10 mm
Sand 12mm

Final report: A traffic light soil water sensor for resource poor farmers: proof of concept
Page 23
Having a material with a strong signal that does not rely on precision electrodes is not
sufficient in itself. The crucial aspect is the variability among different sensors. Fig 17
shows the range of resistances of six sensors, in DE subjected to four ‘treatments’. DE
‘treatments’ involved different levels of compaction and different levels of an additive
which changes the resistance-tension relationship. Six sensors were put through a drying
cycle for each DE treatment (represented by the different colours). The sensor with the
lowest resistance at each tension is shown by a solid line and the highest resistance by a
dotted line. There are two obvious effects. First, treatments to the DE have a major
impact on the tension-resistance relationship. Second, good uniformity is much easier to
attain at lower resistances than higher resistances.
Figure 17. Range of resistance of six sensors in DE subjected to six different treatments
Fig 18 shows how the above has implications for selection of the optimum fill treatment.
Consider two different fill materials represented by the green and blue lines. The green fill
has less variability among sensors (highest and lowest readings are closer together), but
the blue lines have a steeper gradient. Selecting switching resistances of 2 K ohms for
the green fill and 4 K ohms for the blue fill would result in the first sensor in each set
switching at 23 kPa in both cases. However when we look at the sensor with the lowest
resistances with each fill, the switch points are 25 and 29 kPa for the blue and green fills
respectively. Given that there are two switch points, many combinations of packing and
additives were tested to come up with a formula that gave best results over both switch
points.
0
20
40
60
80
100
120
0 10 20 30 40 50 60 70
Resis
tanc
e by
Tain
(Koh
m)
Tension (kPa)
DE0G-3
DE0G-5
DE2G-5
DE5G-5
Final report: A traffic light soil water sensor for resource poor farmers: proof of concept
Page 24
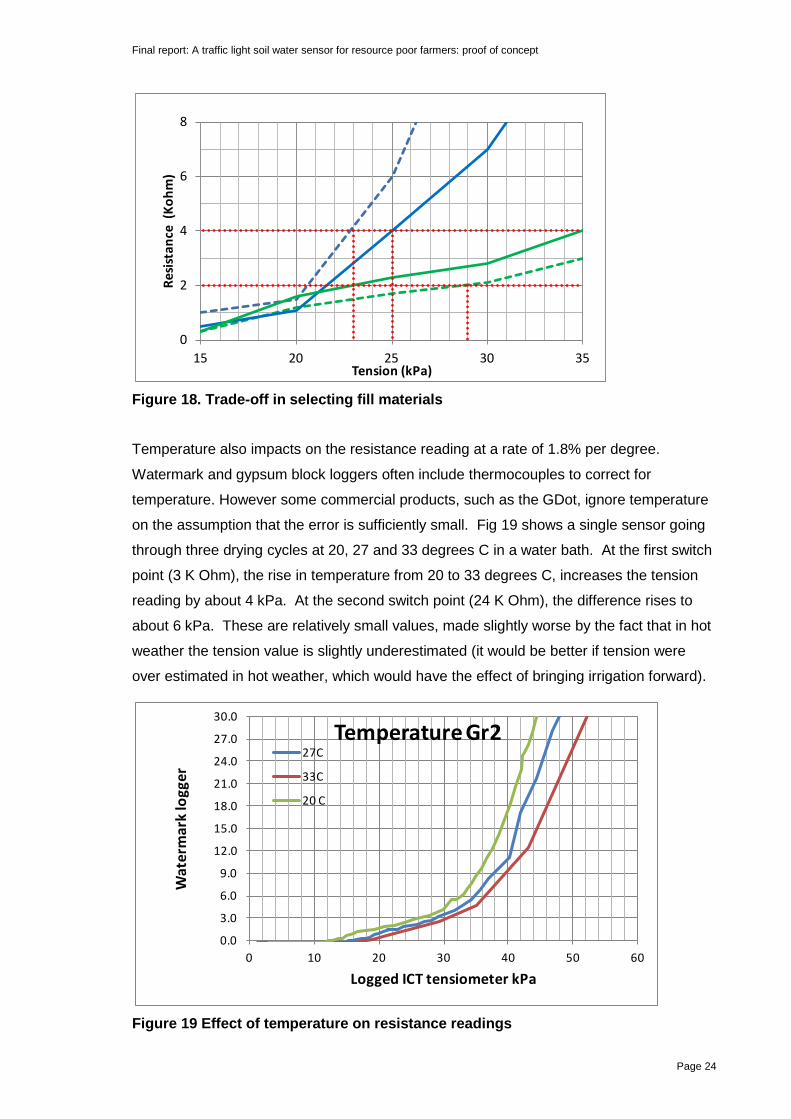
Figure 18. Trade-off in selecting fill materials Temperature also impacts on the resistance reading at a rate of 1.8% per degree.
Watermark and gypsum block loggers often include thermocouples to correct for
temperature. However some commercial products, such as the GDot, ignore temperature
on the assumption that the error is sufficiently small. Fig 19 shows a single sensor going
through three drying cycles at 20, 27 and 33 degrees C in a water bath. At the first switch
point (3 K Ohm), the rise in temperature from 20 to 33 degrees C, increases the tension
reading by about 4 kPa. At the second switch point (24 K Ohm), the difference rises to
about 6 kPa. These are relatively small values, made slightly worse by the fact that in hot
weather the tension value is slightly underestimated (it would be better if tension were
over estimated in hot weather, which would have the effect of bringing irrigation forward).
Figure 19 Effect of temperature on resistance readings
0
2
4
6
8
15 20 25 30 35
Resis
tanc
e (K
ohm
)
Tension (kPa)
0.0
3.0
6.0
9.0
12.0
15.0
18.0
21.0
24.0
27.0
30.0
0 10 20 30 40 50 60
Wat
erm
ark
logg
er
Logged ICT tensiometer kPa
Temperature Gr227C
33C
20 C
Final report: A traffic light soil water sensor for resource poor farmers: proof of concept
Page 25
7 Sensor Calibration
Currently the practice is to make sensors quickly and cheaply, and then to test each one
individually. A special material has been sourced which has a water release characteristic
that allows it to go from 0 – 60 kPa in four days by air drying in the laboratory. The
unsaturated hydraulic conductivity of this material is so high over this range that the drying
is completely uniform with depth. Sensor performance can then be evaluated against a
tensiometer placed in the same material using the set up shown in Fig 22. The
performance criteria we are aiming at are shown in Table 2.
Table 2: Each sensor must pass all five criteria
1 Less than 20 kPa BLUE
2 20 – 30 kPa BLUE or GREEN
3 30-45 kPa GREEN
4 45 – 60 kPa GREEN or RED
5 Greater than 60 kPa RED
Testing has been carried out by connecting the sensors to a Watermark logger, logging a
tensiometer separately and then plotting the Watermark reading against the tension as the
material dries. The Watermark logger gives a reading in kPa, which we can transform
back to resistance using a calibration equation. Unfortunately the Watermark logger does
not cover the full resistance range needed for our sensor, so we must extrapolate to get
the second switch point.
Fig 20 shows 48 sensors being tested, which were built by a work experience student
after brief training. The red lines represent the switch points from blue to green (lower
switch) and green to red (upper switch). All but two sensors cross the lower switch point
within the 20-30 kPa range, and assuming the extrapolation is valid, the same 46 sensors
all pass the second switch point. It remains to be seen how further practice by a sensor
builder could reduce the observed variability.
Final report: A traffic light soil water sensor for resource poor farmers: proof of concept
Page 26
Figure 20. Evaluation of 48 Chameleon sensors using a Watermark logger. The red lines demarcate the upper and lower switching points. Ignore watermark readings above 240.
Until we get more experience, testing of individual sensors will be required before release
to other parties. The simplest way to test is to use the Chameleon reader itself, and read
all sensors at 20, 30, 45 and 60 kPa, as this would allow the five criteria in Table 2 to be
evaluated. In Fig 21, 24 additional sensors were evaluated and readings were taken at the
following values 16,17,18,19,20,21,22,24,25,26,27,28,30,33,38,47,52,60,62 kPa.
All but one of these sensors changed from blue to green between 26 and 30 kPa, with the
last changing between 30 and 32 kPa. Three sensors turned from green to red between
48 and 52 kPa, 18 sensors between 53 and 60 kPa and 2 between 61 and 62 kPa. In this
case two sensors would be failed as follows
#16 would be failed on criterion 3 (blue when in the 30-45 kPa range and criterion 4
(green when > 60 kPa). Sensor #11 would also fail by criterion 4. In both cases the
sensors are only 1 or 2 kPa out of range, which is within the accuracy of the tensiometer
itself.
020406080
100120140160180200220240260280300320340360380400
0 10 20 30 40 50 60 70 80
Wat
erm
ark
read
ing
Tension (kPa)
Final report: A traffic light soil water sensor for resource poor farmers: proof of concept
Page 27
Figure 21. Evaluation of 24 Chameleon sensors using the Chameleon reader.
Ultimately, the accuracy we can accept for the Chameleon is a judgement call, especially
as other commercially available equipment has fairly low accuracy, yet is widely accepted
by farmers. There are three features that distinguish this sensor package from all others.
First we do not claim to give an exact soil water value, which as we can see in Fig 6 and 7
is likely to be incorrect anyway, but simply indicate the soil as wet, moist or dry. Second,
by making sensors inexpensive, many more can be deployed to cover the kind of
variability due to irrigation, layout, soil and plant factors that farmers need to know about.
Third, the four depth lights are ‘read’ as one number (or pattern), i.e. we want to see a
snapshot of the entire root zone as a single picture. With three colours at four depths this
gives 3x3x3x3=84 colour combinations, which is enough for any farmer.
TENSION kPa
16 17 18 19 20 21 22 23 24 25 26 27 28 29 30 31 32 33 34 35 36 37 38 39 40 41 42 43 44 45 46 47 48 49 49 50 51 52 53 54 55 56 57 58 59 60 61 62 63 64 65
1 B B B B B B B B B B B B B G G G G G G G G G G G G G G G G G G G G G G G G R R R R R R
2 B B B B B B B B B B B B G G G G G G G G G G G G G G G G G G G G G G G G G G R R R R R R
3 B B B B B B B B B B B G G G G G G G G G G G G G G G G G G G G G R R R R R R R R R R R R R R
4 B B B B B B B B B B B B B G G G G G G G G G G G G G G G G G G G G G G G G R R R R R R
5 B B B B B B B B B B B G G G G G G G G G G G G G G G G G G G G G R R R R R R R R R R R R R R
6 B B B B B B B B B B B G G G G G G G G G G G G G G G G G G G G G G G G G G G R R R R R R
7 B B B B B B B B B B B B B G G G G G G G G G G G G G G G G G G G G G G G G R R R R R R
8 B B B B B B B B B B B B B G G G G G G G G G G G G G G G G G G G G G G G G R R R R R R
9 B B B B B B B B B B B G G G G G G G G G G G G G G G G G G G G G G G G G G G R R R R R R
10 B B B B B B B B B B B B G G G G G G G G G G G G G G G G G G G G G G G G G G R R R R R R
11 B B B B B B B B B B B B B G G G G G G G G G G G G G G G G G G G G G G G G G G G G G G G G R R R R
12 B B B B B B B B B B B B B G G G G G G G G G G G G G G G G G G G G G G G G R R R R R R
13 B B B B B B B B B B B B G G G G G G G G G G G G G G G G G G G G G G G G G G R R R R R R
14 B B B B B B B B B B B B B G G G G G G G G G G G G G G G G G G R R R R R R R R R R R R R R
15 B B B B B B B B B B B B B G G G G G G G G G G G G G G G G G G G G G G G G R R R R R R
16 B B B B B B B B B B B B B B G G G G G G G G G G G G G G G G G G G G G G G G G G G G G R R R R
17 B B B B B B B B B B B B B G G G G G G G G G G G G G G G G G G G G G G G G R R R R R R
18 B B B B B B B B B B B G G G G G G G G G G G G G G G G G G G G G G G G G G G R R R R R R
19 B B B B B B B B B B G G G G G G G G G G G G G G G G G G G G G G G G G G G G R R R R R R
20 B B B B B B B B B B B B B G G G G G G G G G G G G G G G G G G G G G G G G R R R R R R
21 B B B B B B B B B B B B G G G G G G G G G G G G G G G G G G G G G G G G G G R R R R R R
22 B B B B B B B B B B B B G G G G G G G G G G G G G G G G G G G G G G G G G G R R R R R R
23 B B B B B B B B B B B B B G G G G G G G G G G G G G G G G G G G G G G G G R R R R R R
24 B B B B B B B B B B B B G G G G G G G G G G G G G G G G G G G G G G G G G G R R R R R R
16 17 18 19 20 21 22 23 24 25 26 27 28 29 30 31 32 33 34 35 36 37 38 39 40 41 42 43 44 45 46 47 48 49 49 50 51 52 53 54 55 56 57 58 59 60 61 62 63 64 65
SEN
SOR
Final report: A traffic light soil water sensor for resource poor farmers: proof of concept
Page 28
Figure 22. This is the custom build set up for precision testing of sensors and readers
Sensors buried in high conductivity bedding material on top of porous plate
Bubble tower for setting exact suction levels over 0-60 kPa range
Watermark loggers for logging resistance / tension
Chameleon readers for cross checking colours switch at correct resistances and tensions
Mercury manometer and pressure gauge for checking tensions
Accurate mini-tensiometers to independently log tension at multiple locations in sensor bedding material

Final report: A traffic light soil water sensor for resource poor farmers: proof of concept
Page 29
8 Field trials
Sensors that passed the laboratory calibration were then evaluated under field conditions.
Four sensors were placed in a tomato crop at 15, 30, 45 and 60 cm. A tensiometer was
positioned at the same depth next to each sensor. Each day, for 98 consecutive days, the
chameleon colour was recorded, and the tensiometer readings were made on most days.
The data for the Chameleon sensor is shown with time on the x-axis, the four depths on
the y-axis with the soil water condition shown by colour (Fig 23). The tensiometer data is
viewed in the normal way with the y- axis giving the exact tension and the four depths
overlaid on the same graph with time (Fig 24). For those used to looking at tensiometer
graphs, the data is straightforward to interpret. Lines trending upwards illustrate drying
and lines trending downwards denote wetting at each particular depth in the soil.
It can be argued that it is easier to derive meaning from the Chameleon pattern. The soil
profile starts wet, followed by a pattern of increasing water extraction with depth, a wet
period mid-season, subsoil drying and a wet end to the season.
Figure 23. Chameleon pattern at four depths over 98 days of a tomato crop
Fig 24. Daily tensiometer readings at four depths over 98 days of a tomato crop
TOMATO## ## ## ## ## ## ## ## ## ## ## ## ## ## ## ## ## ## ## ## ## ## ## ## ## ## ## ## ## ## ## ## ## ## ## ## ## ## ## ## ## ## ## ## ## ## ## ## ## ## ## ## ## ## ## ## ## ## ## ## ## ## ## ## ## ## ## ## ## ## ## ## ## ## ## ## ## ## ## ## ## ## ## ## ## ## ## ## ## ## ## ## ## ## ## ## ## ##
1 2 3 4 5 6 7 8 9 10 11 12 13 14 15 16 17 18 19 20 21 22 23 24 25 26 27 28 29 30 31 32 33 34 35 36 37 38 39 40 41 42 43 44 45 46 47 48 49 50 51 52 53 54 55 56 57 58 59 60 61 62 63 64 65 66 67 68 69 70 71 72 73 74 75 76 77 78 79 80 81 82 83 84 85 86 87 88 89 90 91 92 93 94 95 96 97 98
15 B B B G G B B B B G G R R R R R R R R R B G G G G B B G B B B B B B G B B B G B B B B B B B B B B B B B B B B B B B B G G G B B B B B B B B B B B B B B B B B B B B B B B B B B B B B B B B B B B G
30 B B B B B B B B B B B B B B B B B G G G G G G G G R R R R R R B B B G B G G G G G G G R G G R B B B B B B B B B B B B G G G B B B B B B B B B B B B B B B B B B B B B B B B B B B B B B B B B G B G
45 B B B B B B B B B B B B B B B B B B B B B B B G G G G R R R R G G G G G G R R R R R R R R R R G G B G G G B B B B G G G G G G G G G G G G G G G G G G G G G G B B B B B B B B B B B B B B B B B B B
60 B B B B B B B B B B B B B B B B B B B B B B B B B B B B B B B B B B B B B B G R R R R R R R R G R R R R R B B B B B G G G R R R R R R R R R R R R R R R R R R B B B B B B B B B B B B B B B B B B B
DE
PT
H
01020304050607080
27 Nov 17 Dec 6 Jan 26 Jan 15 Feb 7 Mar
Tens
ion (
kPa)
Tomato15 cm 30 cm 45 cm 60 cm
Final report: A traffic light soil water sensor for resource poor farmers: proof of concept
Page 30
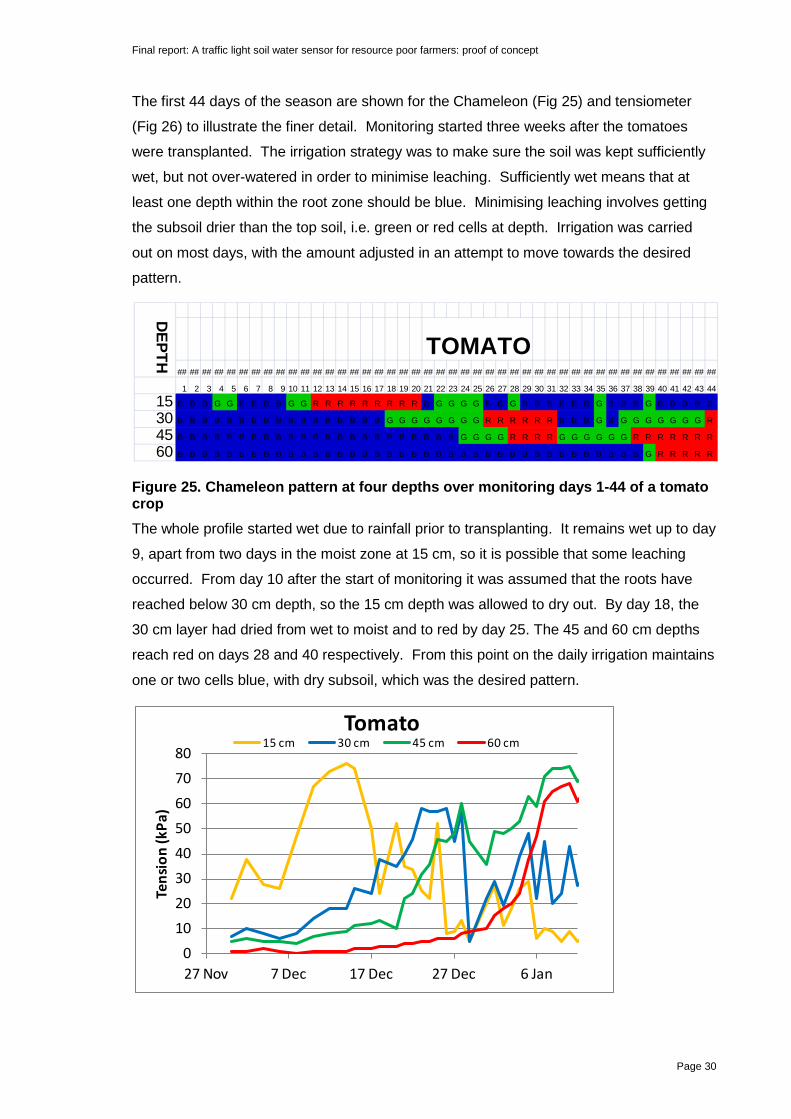
The first 44 days of the season are shown for the Chameleon (Fig 25) and tensiometer
(Fig 26) to illustrate the finer detail. Monitoring started three weeks after the tomatoes
were transplanted. The irrigation strategy was to make sure the soil was kept sufficiently
wet, but not over-watered in order to minimise leaching. Sufficiently wet means that at
least one depth within the root zone should be blue. Minimising leaching involves getting
the subsoil drier than the top soil, i.e. green or red cells at depth. Irrigation was carried
out on most days, with the amount adjusted in an attempt to move towards the desired
pattern.
Figure 25. Chameleon pattern at four depths over monitoring days 1-44 of a tomato crop The whole profile started wet due to rainfall prior to transplanting. It remains wet up to day
9, apart from two days in the moist zone at 15 cm, so it is possible that some leaching
occurred. From day 10 after the start of monitoring it was assumed that the roots have
reached below 30 cm depth, so the 15 cm depth was allowed to dry out. By day 18, the
30 cm layer had dried from wet to moist and to red by day 25. The 45 and 60 cm depths
reach red on days 28 and 40 respectively. From this point on the daily irrigation maintains
one or two cells blue, with dry subsoil, which was the desired pattern.
TOMATO## ## ## ## ## ## ## ## ## ## ## ## ## ## ## ## ## ## ## ## ## ## ## ## ## ## ## ## ## ## ## ## ## ## ## ## ## ## ## ## ## ## ## ##
1 2 3 4 5 6 7 8 9 10 11 12 13 14 15 16 17 18 19 20 21 22 23 24 25 26 27 28 29 30 31 32 33 34 35 36 37 38 39 40 41 42 43 44
15 B B B G G B B B B G G R R R R R R R R R B G G G G B B G B B B B B B G B B B G B B B B B
30 B B B B B B B B B B B B B B B B B G G G G G G G G R R R R R R B B B G B G G G G G G G R
45 B B B B B B B B B B B B B B B B B B B B B B B G G G G R R R R G G G G G G R R R R R R R
60 B B B B B B B B B B B B B B B B B B B B B B B B B B B B B B B B B B B B B B G R R R R R
DEPTH
01020304050607080
27 Nov 7 Dec 17 Dec 27 Dec 6 Jan
Tens
ion
(kPa
)
Tomato15 cm 30 cm 45 cm 60 cm
Final report: A traffic light soil water sensor for resource poor farmers: proof of concept
Page 31
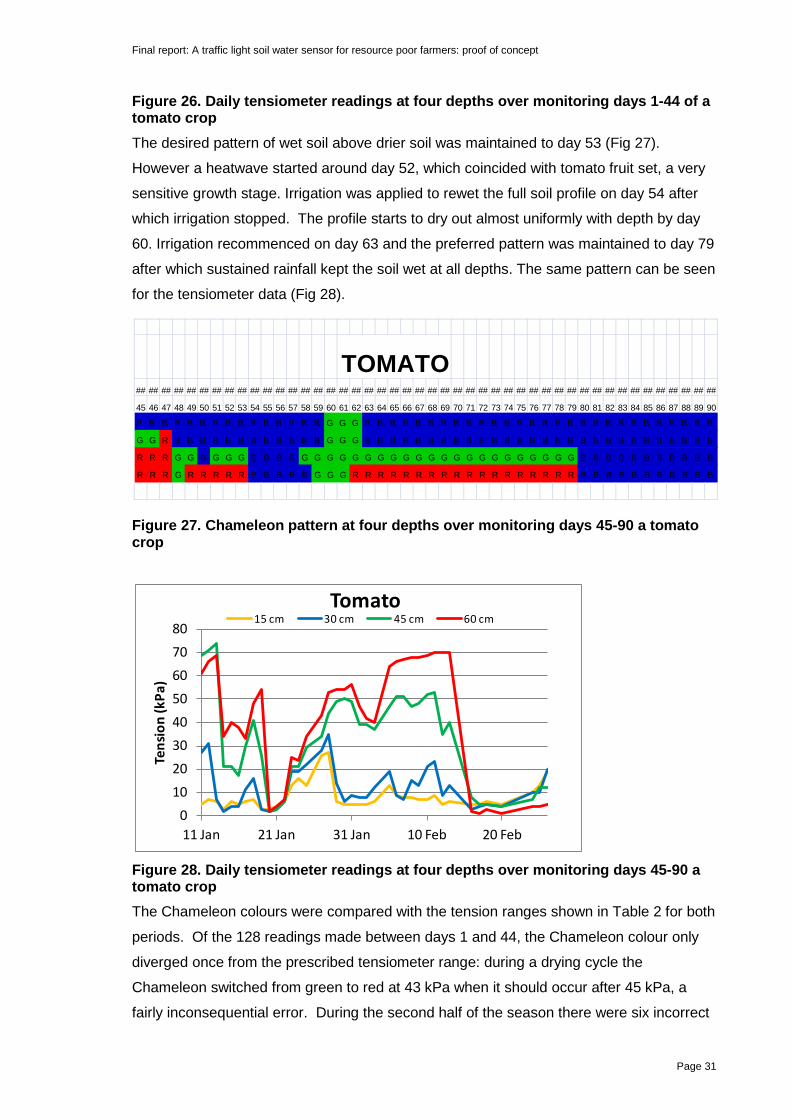
Figure 26. Daily tensiometer readings at four depths over monitoring days 1-44 of a tomato crop The desired pattern of wet soil above drier soil was maintained to day 53 (Fig 27).
However a heatwave started around day 52, which coincided with tomato fruit set, a very
sensitive growth stage. Irrigation was applied to rewet the full soil profile on day 54 after
which irrigation stopped. The profile starts to dry out almost uniformly with depth by day
60. Irrigation recommenced on day 63 and the preferred pattern was maintained to day 79
after which sustained rainfall kept the soil wet at all depths. The same pattern can be seen
for the tensiometer data (Fig 28).
Figure 27. Chameleon pattern at four depths over monitoring days 45-90 a tomato crop
Figure 28. Daily tensiometer readings at four depths over monitoring days 45-90 a tomato crop The Chameleon colours were compared with the tension ranges shown in Table 2 for both
periods. Of the 128 readings made between days 1 and 44, the Chameleon colour only
diverged once from the prescribed tensiometer range: during a drying cycle the
Chameleon switched from green to red at 43 kPa when it should occur after 45 kPa, a
fairly inconsequential error. During the second half of the season there were six incorrect
TOMATO## ## ## ## ## ## ## ## ## ## ## ## ## ## ## ## ## ## ## ## ## ## ## ## ## ## ## ## ## ## ## ## ## ## ## ## ## ## ## ## ## ## ## ## ## ##
45 46 47 48 49 50 51 52 53 54 55 56 57 58 59 60 61 62 63 64 65 66 67 68 69 70 71 72 73 74 75 76 77 78 79 80 81 82 83 84 85 86 87 88 89 90
B B B B B B B B B B B B B B B G G G B B B B B B B B B B B B B B B B B B B B B B B B B B B B
G G R B B B B B B B B B B B B G G G B B B B B B B B B B B B B B B B B B B B B B B B B B B B
R R R G G B G G G B B B B G G G G G G G G G G G G G G G G G G G G G G B B B B B B B B B B B
R R R G R R R R R B B B B B G G G R R R R R R R R R R R R R R R R R R B B B B B B B B B B B
01020304050607080
11 Jan 21 Jan 31 Jan 10 Feb 20 Feb
Tens
ion
(kPa
)
Tomato15 cm 30 cm 45 cm 60 cm

Final report: A traffic light soil water sensor for resource poor farmers: proof of concept
Page 32
readings out of 124. These occurred during wetting events and typically at 45 or 60 cm
depth, when the tensiometer was falling from >60 kPa to less than 45 kPa. In most cases
the Chameleon did not switch from red to green. Subsequent laboratory testing has
confirmed this phenomenon. Due to hysteresis in the DE material, the water content
during a drying event is higher than the water content during a wetting event, at the same
tension. The consequence of this is that if there is slow wetting at depth, the Chameleon
will tend to read one colour too dry. This is generally not observed in the top soil, because
wetting fronts generally move at tensions much lower than 10 kPa, so the Chameleon
reverts quickly from red to blue.
Table 3 Comparison of tension range and Chameleon colour
Tension Range Days 1 to 44 Days 45 to 90
Correct Incorrect Correct Incorrect
0-20 kPa 59 0 78 0
20-30 kPa 22 0 17 0
30-45 kPa 12 1 12 5
45-60 kPa 22 0 15 0
>60 kPa 12 0 13 1
The same setup was used for a pumpkin crop and the data is shown in Figs 29 and 30.
The same strategy was followed of trying to dry the profile early in the season and then
keep the subsoil wet. A comparison between tensiometer ranges and Chameleon colours
showed a similar pattern to the tomato crop, although there were a few more incorrect
readings. Again the errors tended to occur during wetting events with the Chameleon
sometimes showing the soil one colour too dry at the depth that the wetting front
dissipates at. Given that the decision to irrigate is not based on one depth measure, the
fact that one of the four sensors may temporarily read one colour too dry is considered to
be a relatively minor problem.
.
Final report: A traffic light soil water sensor for resource poor farmers: proof of concept
Page 33
Figure 29. Chameleon pattern at four depths over 98 days of a pumpkin crop
Figure 30. Daily tensiometer readings at four depths over 98 days of a pumpkin crop
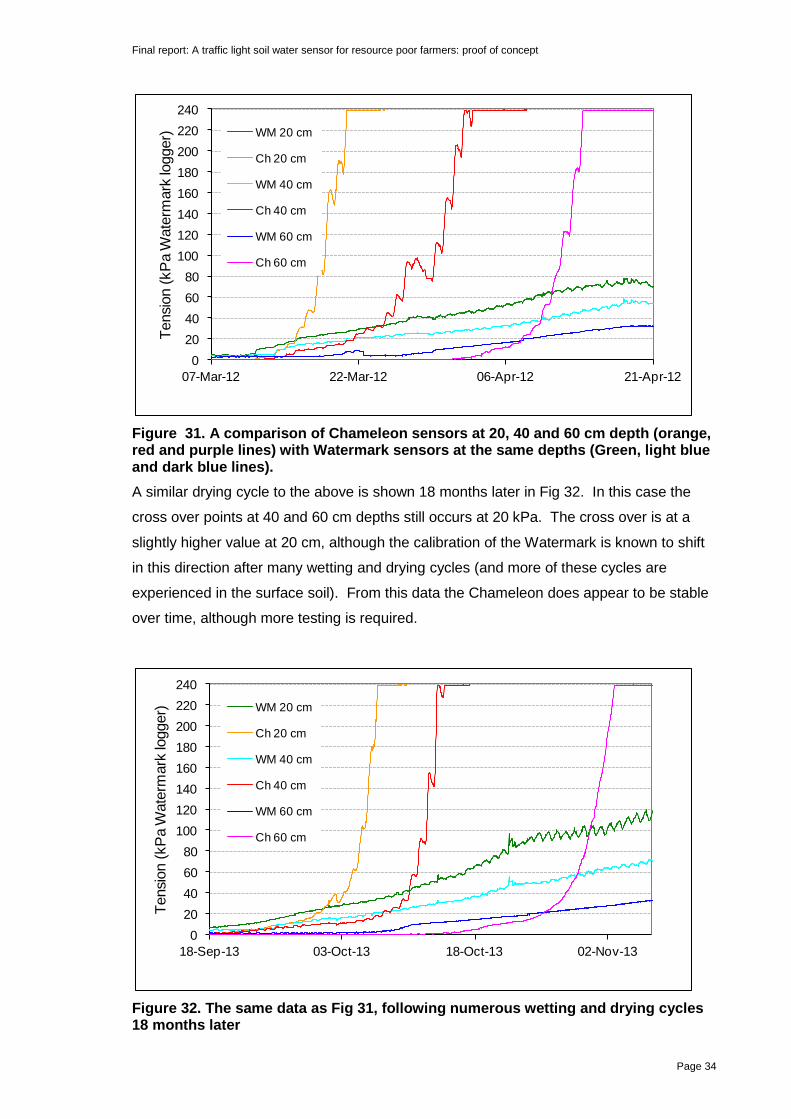
Longevity of gypsum based sensors can be an issue and this was evaluated in a second
field experiment. Figures 31 and 32 show Watermark sensors and Chameleon sensors
both connected to a Watermark logger over an 18 month period at depths of 20, 40 and
60 cm. The Watermark reading is converted to tension (kPa) by the logger. At each
depth, the Chameleon sensor crosses over the Watermark sensor at 20 kPa and rises
steeply, illustrating the sharp increase in resistance. This represents the switching point
from wet to moist or blue to green.
PUMPKIN1 2 3 4 5 6 7 8 9 10 11 12 13 14 15 16 17 18 19 20 21 22 23 24 25 26 27 28 29 30 31 32 33 34 35 36 37 38 39 40 41 42 43 44 45 46 47 48 49 50 51 52 53 54 55 56 57 58 59 60 61 62 63 64 65 66 67 68 69 70 71 72 73 74 75 76 77 78 79 80 81 82 83 84 85 86 87 88 89 90 91 92 93 94 95 96 97 98
15 R R R B B B B B B G G R R R R G G R G G G R R G B R B G B B B B R R B B B B B B B B B G B B B B B G B B B B B B B B B R R G B B B G B B B B B B B B B B B B B B B B B B B B B B B G G R R R R G R R
30 B B B B B B B B B B B G G R R B B R R R R R R R B R R R R R R R R R B B B B G B B B B G G R R R G G B B B B B B B B G G G G B B B G B B B B B B B B B B B B B B B B B B B B B B B B G G G G G G R R
45 B B B B B B B B B B B B B B B B B B B B B G G G G G G G G G G G R R R R R R R B B G G R R R R G B G G G B B B B B B G G G R R B B G R G G G B B B B B B B B B B B B B B B B B B B G G G G G G R R R
60 B B B B B B B B B B B B B B B B B B B B B B B B G G G G G G G G R R R R R R R R R R R R R R R R R B R R G G G G G G G R R R G B R R R R R R R R G G G G B G G G G G R B B B G G G G G G R R R R R R
DE
PT
H0
1020304050607080
27 Nov 17 Dec 6 Jan 26 Jan 15 Feb 7 Mar
Tens
ion
(kPa
)
Pumpkin15 cm 30 cm 45 cm 60 cm
Final report: A traffic light soil water sensor for resource poor farmers: proof of concept
Page 34
Figure 31. A comparison of Chameleon sensors at 20, 40 and 60 cm depth (orange, red and purple lines) with Watermark sensors at the same depths (Green, light blue and dark blue lines). A similar drying cycle to the above is shown 18 months later in Fig 32. In this case the
cross over points at 40 and 60 cm depths still occurs at 20 kPa. The cross over is at a
slightly higher value at 20 cm, although the calibration of the Watermark is known to shift
in this direction after many wetting and drying cycles (and more of these cycles are
experienced in the surface soil). From this data the Chameleon does appear to be stable
over time, although more testing is required.
Figure 32. The same data as Fig 31, following numerous wetting and drying cycles 18 months later
020406080
100120140160180200220240
07-Mar-12 22-Mar-12 06-Apr-12 21-Apr-12
Tens
ion
(kP
a W
ater
mar
k lo
gger
) WM 20 cm
Ch 20 cm
WM 40 cm
Ch 40 cm
WM 60 cm
Ch 60 cm
020406080
100120140160180200220240
18-Sep-13 03-Oct-13 18-Oct-13 02-Nov-13
Tens
ion
(kP
a W
ater
mar
k lo
gger
) WM 20 cm
Ch 20 cm
WM 40 cm
Ch 40 cm
WM 60 cm
Ch 60 cm
Final report: A traffic light soil water sensor for resource poor farmers: proof of concept
Page 35
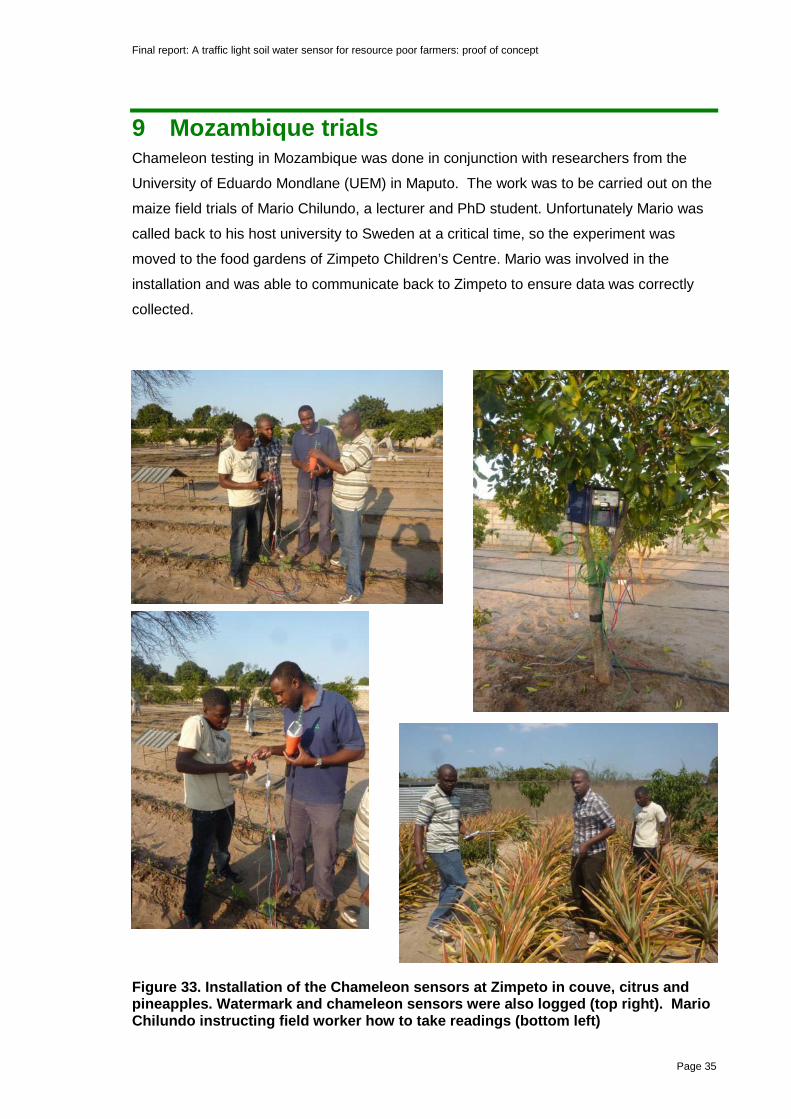
9 Mozambique trials Chameleon testing in Mozambique was done in conjunction with researchers from the
University of Eduardo Mondlane (UEM) in Maputo. The work was to be carried out on the
maize field trials of Mario Chilundo, a lecturer and PhD student. Unfortunately Mario was
called back to his host university to Sweden at a critical time, so the experiment was
moved to the food gardens of Zimpeto Children’s Centre. Mario was involved in the
installation and was able to communicate back to Zimpeto to ensure data was correctly
collected.
Figure 33. Installation of the Chameleon sensors at Zimpeto in couve, citrus and pineapples. Watermark and chameleon sensors were also logged (top right). Mario Chilundo instructing field worker how to take readings (bottom left)

Final report: A traffic light soil water sensor for resource poor farmers: proof of concept
Page 36
The switch to Zimpeto allowed several different crops to be evaluated under irrigated and
non-irrigated conditions. Four Chameleon sensors were installed at depths of 15, 30, 45
and 60 cm in drip-irrigated couve plot (a type of kale) and in a small citrus orchard. A non-
irrigated pineapple field was also instrumented. In addition to the 12 Chameleon sensors
that were read manually by the field worker, four Watermark and four Chameleon probes
were logged at two-hourly intervals in the citrus and pineapple plots.
The field worker was equipped with a mobile phone so he could use the phone app, but
he also texted the data each day. He was using a Chameleon reader Mark 1 which had
green as the ‘wet’ setting and ‘blue’ as moist. At first he sent in data twice a week, but this
increased to daily later in the season. The couve recorded ‘wet’ every day at each depth,
and so did the pineapples apart from a few brief drying events at 15 cm depth. Only the
citrus showed some evidence of drying (Fig 34).
The texted data did leave us with several questions. Although the citrus did show some
drying events, the couve was constantly wet at all depths. We tried unsuccessfully to get
the irrigation manager to skip certain irrigation events, but current practice was too deeply
entrenched. The pineapple data were a mystery, as these were not irrigated, but almost
always showed the soil to be wet. Although pineapple is a CAM plant, we did not expect
such low water use, especially as the nearby irrigated citrus did display some drying.
Fig 34. Chameleon data from 15, 30, 45 and 60 cm depths for Citrus, couve and Pineapple crops at Zimpeto between August 2013 and March 2014.
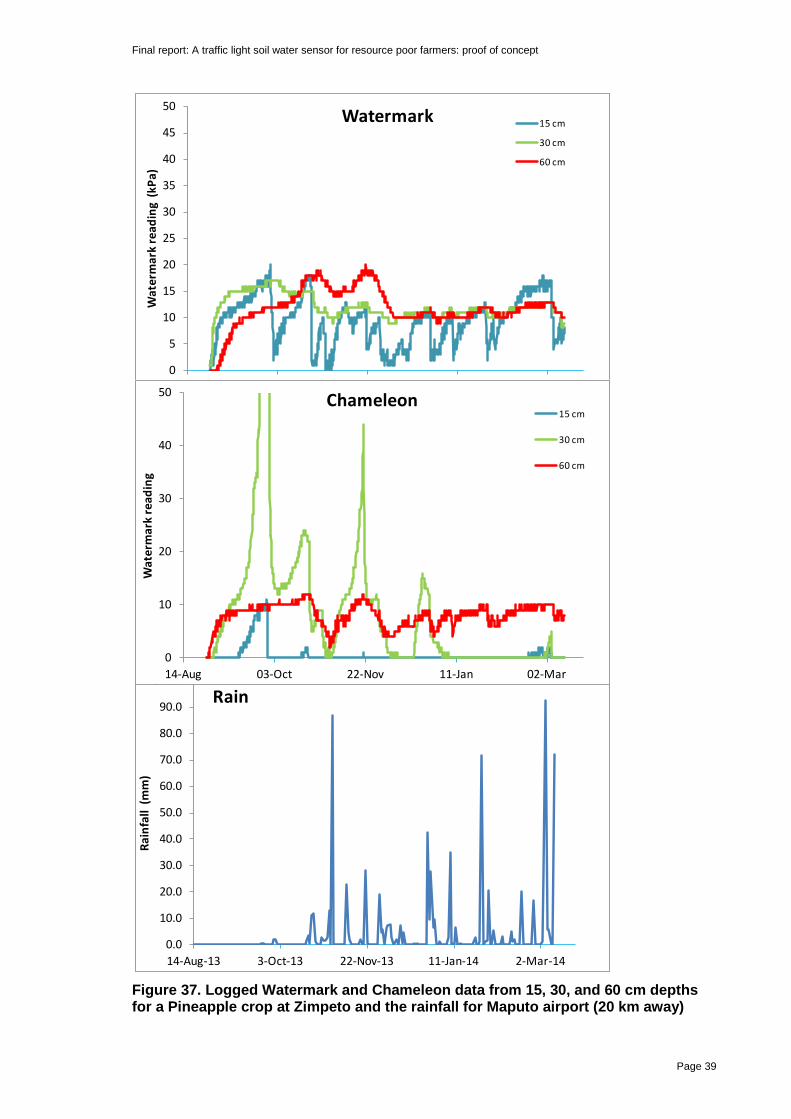
The logged data resolved most of these mysteries. Fig 35 shows the Watermark trace (in
kPa) and the Chameleon trace in the citrus (as measured by Watermark logger). For most
of the season the soil is wet (Watermark below 20 kPa), but there is a drying event at the
Citrus15 cm G G B R R G G G G G G G G G G G G R R R R R R R G G R G G R R R R R R R R R R G R G G G G G G G G G G G G G G G G G G G G G G G R B G G
30 cm G G G G G G G G R G R G G G G R R R G G R G R G G G G G G G G G G G G G B B B G G G G G G G G G G G G G G G G G G G G G R G G G B G G G
45 cm B R R R R R B B B B B B B B B B G G G G G B B G G G G B B G G G B B B B B B B B R B G R B R R B B B B B B B B B B B B B B B B B B B B B
60 cm G G G G G G G G G G G G G G G G G G G G G G G G G G G G G G G G G G G G G G G G G G G G G G G G G G G G G G G G G G G G G G G G G G G G
Couve15 cm G G G G G G G G G G G G G G G G G G G G G G G G G G G G G G G G G G G G G G G G G G G G G G G G G G G G G G G G G G G G G G G G G G G G
30 cm G G G G G G G G G G G G G G G G G G G G G G G G G G G G G G G G G G G G G G G G G G G G G G G G G G G G G G G G G G G G G G G G G G G G
45 cm G G G G G G G G G G G G G G G G G G G G G G G G G G G G G G G G G G G G G G G G G G G G G G G G G G G G G G G G G G G G G G G G G G G G
60 cm G G G G G G G G G G G G G G G G G G G G G G G G G G G G G G G G G G G G G G G G G G G G G G G G G G G G G G G G G G G G G G G G G G G G
Pineapple15 cm G G G G G B G G G G G G G G R G G G G G B G G G G G G G G G G G G G G G G G G G G G G G G G G G G G G G G G G G G G G G G G G G G G G G
30 cm G G G G G G G G G G G G G G G G G G G G G G G G G G G G G G G G G G G G G G G G G G G G G G G G G G G G G G G G G G G G G G G G G G G G
45 cm G G G G G G G G G G G G G G G G G G G G G G G G G G G G G G G G G G G G G G G G G G G G G G G G G G G G G G G G G G G G G G G G G G G G
60 cm G G G G G G G G G G G G G G G G G G G G G G G G G G G G G G G G G G G G G G G G G G G G G G G G G G G G G G G G G G G G G G G G G G G G
13-Nov-13
28-Aug-13
30-Aug-13
04-Sep-13
09-Sep-13
11-Sep-13
20-Sep-13
01-Oct-13
04-Oct-13
10-Oct-13
12-Oct-13
14-Oct-13
05-Nov-13
06-Nov-13
08-Nov-13
13-Jan-14
19-Nov-13
26-Nov-13
02-Dec-13
17-Dec-13
28-Dec-13
01-Jan-1403-Jan-1404-Jan-1405-Jan-1410-Jan-1412-Jan-14
26-Jan-14
14-Jan-1415-Jan-1416-Jan-1418-Jan-1419-Jan-1420-Jan-1421-Jan-1422-Jan-1423-Jan-1424-Jan-1425-Jan-14
09-Feb-14
28-Jan-1429-Jan-1430-Jan-1431-Jan-1401-Feb-1402-Feb-1403-Feb-1404-Feb-1406-Feb-1407-Feb-1408-Feb-14
25-Feb-14
11-Feb-1412-Feb-1413-Feb-1415-Feb-1416-Feb-1417-Feb-1418-Feb-1420-Feb-1421-Feb-1423-Feb-1424-Feb-14
27-Feb-1428-Feb-1403-M
ar-1407-M
ar-1408-M
ar-14

Final report: A traffic light soil water sensor for resource poor farmers: proof of concept
Page 37
Fig 35. A comparison of logged Watermark and Chameleon sensor output from 15, 30, 45 and 60 cm depths for Citrus at Zimpeto, with the Chameleon giving ‘exaggerated output’ when moving through the 20-30 kPa range of the Watermark.
0
10
20
30
40
50
60
70
80
90
100
14-Aug 03-Oct 22-Nov 11-Jan 02-Mar 21-Apr
Tens
ion
(kPa
)
Citrus 15cm
Chameleon
Watermark
0
10
20
30
40
50
60
70
80
90
100
14-Aug 03-Oct 22-Nov 11-Jan 02-Mar 21-Apr
Tens
ion
(kPa
)
Citrus 30 cm
Chameleon
Watermark
0
10
20
30
40
50
60
70
80
90
100
14-Aug 03-Oct 22-Nov 11-Jan 02-Mar 21-Apr
Tens
ion
(kPa
)
Citrus 45 cm
Chameleon
Watermark
0
10
20
30
40
50
60
70
80
90
100
14-Aug 03-Oct 22-Nov 11-Jan 02-Mar 21-Apr
Tens
ion
(kPa
)
Citrus 60 cm
Chameleon
Watermark

Final report: A traffic light soil water sensor for resource poor farmers: proof of concept
Page 38
start of monitoring and again in late January. The logged Chameleon responds to these in
a more exaggerated way than the Watermark, illustrating the soil had dried past a switch
point. The blue colour at 45 cm in the citrus (in this case the middle or ‘moist’ level) was
probably a result of a sensor that was reading a few kPa too dry (blue when it should be
green), as the Logged Watermark and Chameleon showed this to be in the ‘green’ zone
(Fig 35). These were among the first sensors built, and the fabrication and testing
procedure has improved since then.
Fig 36 shows the Watermark trace before and after the drying event in late January
compared to the manual recorded texted in by the field worker. The Watermark trace
shows the 15 cm depth rapidly drying, a smaller drying event at 30 cm and no drying at 60
cm. This corresponds well with the manual record.
Figure 36. A comparison of logged watermark data (above) and the manual output sent in from the Chameleon reader (below).
0
10
20
30
40
50
60
70
80
11-Jan 16-Jan 21-Jan 26-Jan 31-Jan 05-Feb
Tens
ion
(kPa
)
Citrus15 cm
30 cm
60 cm
0
10
20
30
40
50
60
70
80
11-Jan 16-Jan 21-Jan 26-Jan 31-Jan 05-Feb
Soil
dept
h (c
m)
Final report: A traffic light soil water sensor for resource poor farmers: proof of concept
Page 39
Figure 37. Logged Watermark and Chameleon data from 15, 30, and 60 cm depths for a Pineapple crop at Zimpeto and the rainfall for Maputo airport (20 km away)
0
5
10
15
20
25
30
35
40
45
50
14-Aug 03-Oct 22-Nov 11-Jan 02-Mar
Wat
erm
ark
read
ing
(kPa
)
Watermark 15 cm
30 cm
60 cm
0.0
10.0
20.0
30.0
40.0
50.0
60.0
70.0
80.0
90.0
100.0
14-Aug-13 3-Oct-13 22-Nov-13 11-Jan-14 2-Mar-14
Rain
fall
(mm
)
Rain
0
10
20
30
40
50
14-Aug 03-Oct 22-Nov 11-Jan 02-Mar
Wat
erm
ark
read
ing
Chameleon15 cm
30 cm
60 cm
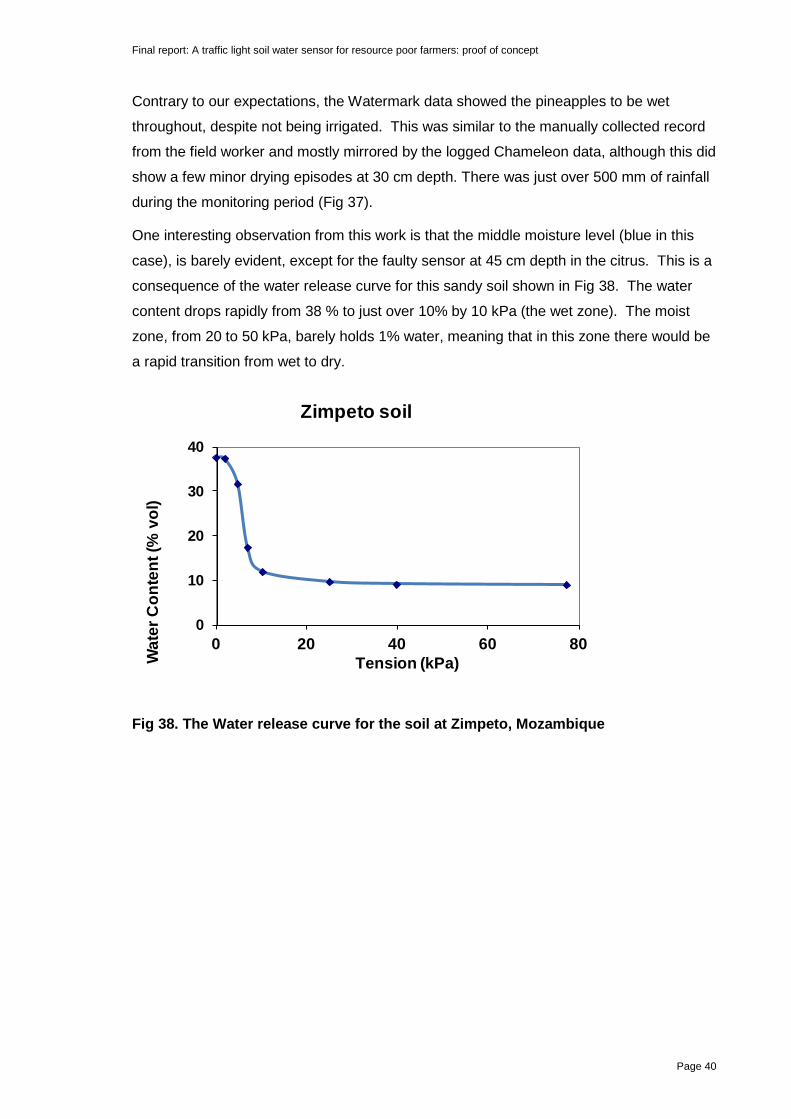
Final report: A traffic light soil water sensor for resource poor farmers: proof of concept
Page 40
Contrary to our expectations, the Watermark data showed the pineapples to be wet
throughout, despite not being irrigated. This was similar to the manually collected record
from the field worker and mostly mirrored by the logged Chameleon data, although this did
show a few minor drying episodes at 30 cm depth. There was just over 500 mm of rainfall
during the monitoring period (Fig 37).
One interesting observation from this work is that the middle moisture level (blue in this
case), is barely evident, except for the faulty sensor at 45 cm depth in the citrus. This is a
consequence of the water release curve for this sandy soil shown in Fig 38. The water
content drops rapidly from 38 % to just over 10% by 10 kPa (the wet zone). The moist
zone, from 20 to 50 kPa, barely holds 1% water, meaning that in this zone there would be
a rapid transition from wet to dry.
Fig 38. The Water release curve for the soil at Zimpeto, Mozambique
0
10
20
30
40
0 20 40 60 80
Wat
er C
onte
nt (%
vol
)
Tension (kPa)
Zimpeto soil
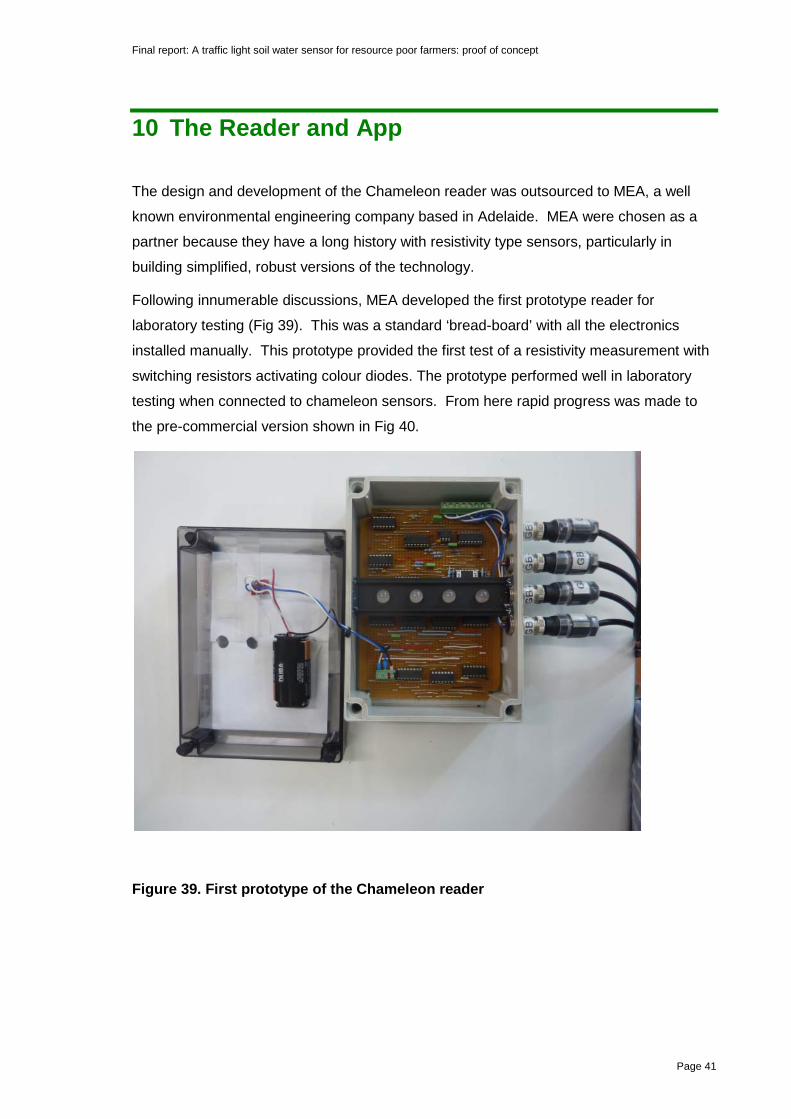
Final report: A traffic light soil water sensor for resource poor farmers: proof of concept
Page 41
10 The Reader and App
The design and development of the Chameleon reader was outsourced to MEA, a well
known environmental engineering company based in Adelaide. MEA were chosen as a
partner because they have a long history with resistivity type sensors, particularly in
building simplified, robust versions of the technology.
Following innumerable discussions, MEA developed the first prototype reader for
laboratory testing (Fig 39). This was a standard ‘bread-board’ with all the electronics
installed manually. This prototype provided the first test of a resistivity measurement with
switching resistors activating colour diodes. The prototype performed well in laboratory
testing when connected to chameleon sensors. From here rapid progress was made to
the pre-commercial version shown in Fig 40.
Figure 39. First prototype of the Chameleon reader
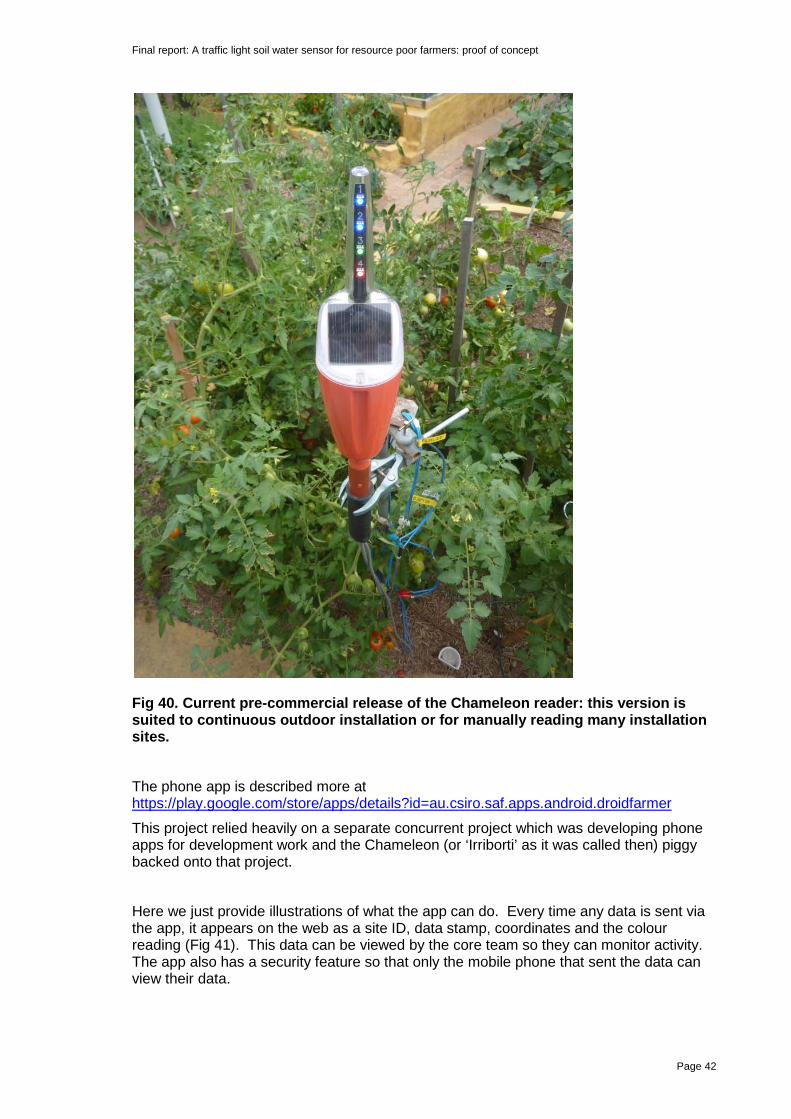
Final report: A traffic light soil water sensor for resource poor farmers: proof of concept
Page 42
Fig 40. Current pre-commercial release of the Chameleon reader: this version is suited to continuous outdoor installation or for manually reading many installation sites.
The phone app is described more at https://play.google.com/store/apps/details?id=au.csiro.saf.apps.android.droidfarmer
This project relied heavily on a separate concurrent project which was developing phone apps for development work and the Chameleon (or ‘Irriborti’ as it was called then) piggy backed onto that project.
Here we just provide illustrations of what the app can do. Every time any data is sent via the app, it appears on the web as a site ID, data stamp, coordinates and the colour reading (Fig 41). This data can be viewed by the core team so they can monitor activity. The app also has a security feature so that only the mobile phone that sent the data can view their data.
Final report: A traffic light soil water sensor for resource poor farmers: proof of concept
Page 43
Fig 41. All Chameleon data sent in via the app can be viewed and sorted by date or site name
The data also appears on a map so all sites sending data can be viewed geographically Fig 42 shows locations in Africa from which Chameleon data has been sent. By zooming in on each site, the daily data can be seen in detail. Fig 43 shows a zoomed in version to Maputo and then Zimpeto to where the citrus measurement were sent
Fig 42. Locations from within Africa from where Chameleon data has been sent in via the app
Fig 43. Actual data received for the citrus via the app. Note the field worker has returned home before sending the data!
Final report: A traffic light soil water sensor for resource poor farmers: proof of concept
Page 44
11 Conclusions and recommendations
11.1 Conclusions Over a one year period, this SRA has developed a novel sensor, reader and display
package to underpin learning for water productivity in developing countries. The sensor
and reader have been taken past the proof of concept stage and are ready for widespread
testing prior to commercial release. The African field testing and app development have
both passed the initial proof of concept stage.
There are two aspects of the work that were not fully completed. First, although the work
in Mozambique evaluated the accuracy of the sensors, we were not able to go the next
step and determine how the irrigation manager changed behaviour because of the
sensors. This was partly because Mario Chilundo was called back to Sweden for work on
his PhD part way through. Later in the season, when we were ready to manipulate the
irrigation regimes, heavy rainfall dominated.
The second aspect that was not completed was handing the system over for testing by
existing ACIAR projects in Cambodia. This was largely because we decided to do extra
testing on the sensors we had made, and in particular to calibrate them for wetting and
drying regimes to understand hysteresis.
Both these aspects above will be completed in a follow-up SRA that has just been
contracted.
11.2 Recommendations
Successful commercial ventures are deemed to pass through four stages as follows (USAID) Stage 1: Proof of Concept: nurture new ideas, supporting the experimentation and
prototyping needed to transition innovations from ideas to “proof of concept” validation.
Stage 2: Pilot Roll-Out: innovation introduced into the user environment to determine
their technical and market viability. Pilots are accompanied by testing and market
research to evaluate impact, adoption rates of the innovations, distribution and marketing
plans, benefits for the farmers and households, and how the approach will function at a
larger scale.
Stage 3: Transition to Scale-Up: assuming stage 2 is successful, stage 3 demonstrates
potential for scalability and sustainability either through the private or the public sector.
Final report: A traffic light soil water sensor for resource poor farmers: proof of concept
Page 45
Graduation and Mainstreaming: innovations have proven scalability and can move
forward without further support from the funding body. This is the key metric for success.
Two recommendations flow from the successful completion of Stage 1
1) Develop full proposal to AIFSRC/ACIAR to cover Stages 2 and 3 of the innovation
process as described above including fine tuning of the technology, building the
‘learning package’ and adding value to existing AIFSRC/ACIAR projects where water
productivity is a core aim. It could also explore broadening the use of the technology to
other applications such as dryland agriculture and wet/dry rice. R&D would also be
directed towards turning this into a product for the Australian market, either by
increasing the ‘smarts’ in the current version and/or aiming for other markets such as
home gardens. If successful, such a project could start in 9-12 months time.
2) Secure a “bridging SRA” to ensure continuity and momentum. The core aims would
be to
i) Clarify and develop the business opportunity and commercial directions
ii) Work with MEA to produce simpler / cheaper version given the synergy with the salt
meter contract with ACIAR
iii) Develop protocol and packages for sensor manufacture in Africa
iv) Commence the pilot roll out of current version into selected projects and monitor
feedback
v) Write this report up as a peer reviewed paper as the scientific basis underpinning
the commercial activities
vi) Develop full proposal as above to ACIAR/AIFSRC

Final report: A traffic light soil water sensor for resource poor farmers: proof of concept
Page 46
12 References
12.1 References cited in report
Annandale1 JG, Stirzaker RJ, Singels A, van der Laan M and Laker MC (2011) Irrigation scheduling research: South African experiences and future prospects. Water SA Vol. 37, 751-753
Charlesworth P (2005) Soil water monitoring. An information package. 2nd Edition Irrigation Insights number 1http://citeseerx.ist.psu.edu/viewdoc/download?doi=10.1.1.118.567&rep=rep1&type=pdf
Accessed 13 Feb 2014
Christen E, Ayars J, Hornbuckle J, Hickey M (2006) Technology and practice for irrigation in vegetables Published by NSW Department of Primary Industries
http://www.dpi.nsw.gov.au/__data/assets/pdf_file/0005/201101/Technology-and-practice-for-irrigation-in-vegetables.pdf
Evett SR, Tolk JA, and Howell TA (2006) Soil Profile Water Content Determination: Sensor Accuracy, Axial Response, Calibration,Temperature Dependence, and Precision.Vadose Zone Journal 5:894–907 (2006).doi:10.2136/vzj2005.0149
Matthews, K.B, Schwarz, G. Buchan, K. & Rivington, M. & Miller, D. (2008) Wither
agricultural DSS? Computers and Electronics in Agriculture. 61(2): 149-159.
McCown, R.L. (2002) Changing systems for supporting farmers’ decisions: problems,
paradigms, and prospects. Agricultural Systems 74(1): 179-220.
Okello-Okanya J* (2005) Queensland Rural Water Use Efficiency Initiative (RWUEI) and Its Demonstrated Role In Community Engagement with the Irrigation Industry International Conference on Engaging Communities, 14 - 17 August 2005 Brisbane http://www.engagingcommunities2005.org/abstracts/Okello-Okanya-final.pdf
Pannell DJ, Marshall GR, Barr N, Curtis A, Vanclay F,Wilkinson R. 2006. Understanding and promoting adoption of conservation practices by rural landholders. Australian Journal of Experimental Agriculture 46: 1407–1424.
Final report: A traffic light soil water sensor for resource poor farmers: proof of concept
Page 47
Passioura, J.B., and J.F. Angus. 2010. Improving productivity of crops in water limited environments. Adv. Agron. 106:37–75.
Rogers EM. 2003. Diffusion of Innovations, 5th edn. Free Press: New York, NY.
Stevens JB; Duvel GH; Steyn GJ; Marobane W (2005) The range, distribution and implementation of irrigation scheduling models and methods in SA WRC Report number 1137/1/05 ISBN No 1-77005-305-0
Singles A and Smith MT (2006) Provision of irrigation scheduling advice to small-scale sugarcane farmers using a web-based crop model and cellular technology: a South African case study Irrigation and Drainage 55: 363-372 DOI: 10.1002/ird.231
Stirzaker, R., Stevens, J., Annandale, J.G., Maeko, T., Steyn, M., Mpandeli, S., Maurobane, W., Nkgapele, J. & Jovanovic, N., 2004. Building capacity in irrigation management with wetting front detectors. WRC Report TT 230/04
Stirzaker RJ, Biggs H, Roux D, Cilliers P (2010) Requisite simplicities to help negotiate complex problems. AMBIO 39:600–607. DOI 10.1007/s13280-010-0075-7
Whittenbury K and Davidson P (2010) An Exploratory Study of Irrigators’ Decision-Making: Day-to-Day Scheduling Decisions. CRC for Irrigation Futures Technical Report 02/10
12.2 List of publications produced by project None