Embed Size (px)
DESCRIPTION
: Fall 2010. PitchBook 4Q 2010 Private Equity Reporting Deck. Request a demonstration or training: Email: [email protected] Phone: 877-267-5593. For additional analysis or slides: Email: [email protected] Phone: 206-623-1986. About the PitchBook Platform. - PowerPoint PPT Presentation
Citation preview

: Fall 2010
PitchBook 4Q 2010 Private Equity Reporting Deck
Request a demonstration or training:Email: [email protected] Phone: 877-267-5593
For additional analysis or slides:Email: [email protected]: 206-623-1986

About the PitchBook Platform PitchBook is an independent and impartial research firm dedicated to providing premium data, news and analysis to the private equity industry. As a specialty-focused information resource, PitchBook's core strength is its ability to meticulously collect, organize and analyze hard to find private equity and venture capital deal and fund data.
PitchBook’s mission is to provide its clients with the highest quality private equity information, with an acute focus on deals and companies. PitchBook aims not only to offer market-leading proprietary data, but to also provide the tools that help industry professionals effectively find, share and use information to make better decisions.

ExitsInvestment
Fundraising
Three Aspects of Private EquityFundraising, Investment & Exits Trends

Private Equity Investment

Capital Invested Through 3Q 2010 Surpasses 2009
Number of Deals Closed and Total Capital Invested by Year
Source: PitchBook
2000 2001 2002 2003 2004 2005 2006 2007 2008 2009 2010*$0
$100
$200
$300
$400
$500
$600
$700
0
500
1000
1500
2000
2500
3000
3500
$50 $33 $39$83
$126
$173
$300
$605
$213
$57$76
904
670826
1228
1661
2041
25242987
2170
1300
1027
Capital Invested ($B) Number of Deals* Through 3Q 2010

2010 Capital Invested Continues Upward Trend
Number of Deals Closed and Total Capital Invested by Quarter
1Q 2Q 3Q 4Q 1Q 2Q 3Q 4Q 1Q 2Q 3Q 4Q 1Q 2Q 3Q 4Q 1Q 2Q 3Q 4Q 1Q 2Q 3Q2005 2006 2007 2008 2009 2010
$0
$50
$100
$150
$200
$250
0
100
200
300
400
500
600
700
800
900
$27$42 $41
$63
$42$58
$69
$131$125$127
$145
$208
$68
$39
$85
$21 $16$8 $11
$22 $18$31 $28
546
468
498529
647
607
646624
744785
745713 696
504
583
387
335305 308
352 376
335316
Capital Invested ($B) Number of Deals Source: PitchBook

Middle-Market Deal Activity Increases
Percentage of Deal Volume (count) by Deal Size Range
2003 2004 2005 2006 2007 2008 2009 2010*0%
10%
20%
30%
40%
50%
60%
70%
80%
90%
100%
Under $50M $50M-$250M $250M-$500M $500M-$1B $1B-$2.5B $2.5B+Source: PitchBook* Through 3Q 2010

Middle-Market Grabs Over 50% of Capital
Percentage of Deal Volume (capital) by Deal Size Range
2003 2004 2005 2006 2007 2008 2009 2010*0%
10%
20%
30%
40%
50%
60%
70%
80%
90%
100%
Under $50M $50M-$250M $250M-$500M $500M-$1B $1B-$2.5B $2.5B+Source: PitchBook* Through 3Q 2010

Midwest the Top Region for PE Investment Percentage of Deal Volume (count) by Region
Mid Atlantic9%
Midwest24%
Mountain6%
Northeast12%
South17%
Southeast16%
Southwest1%
West Coast14%
Source: PitchBook* Through 3Q 2010
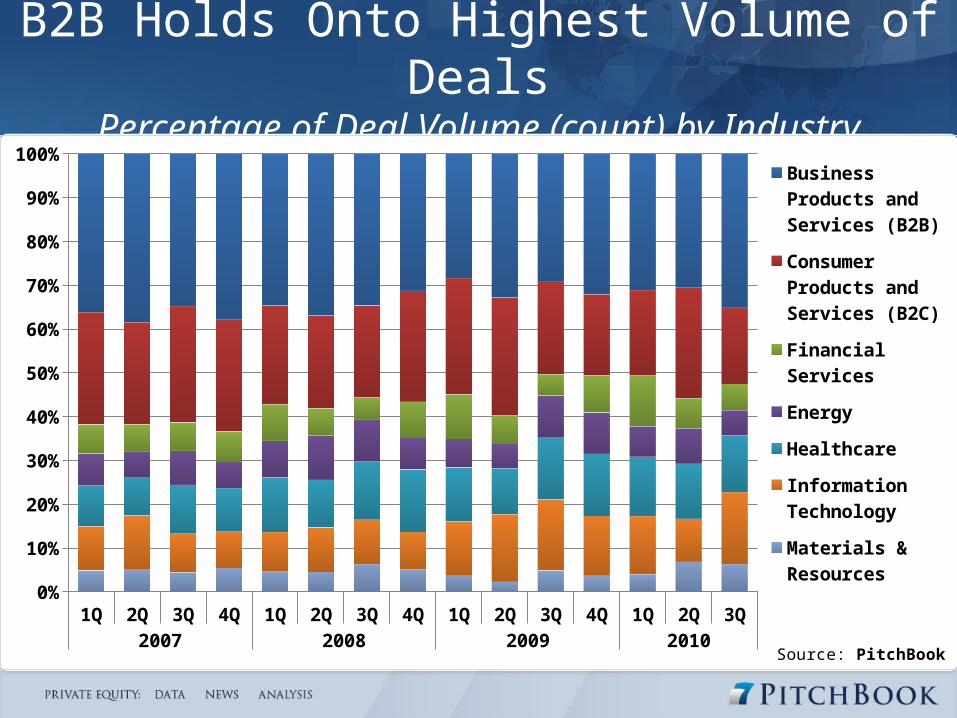
B2B Holds Onto Highest Volume of Deals
Percentage of Deal Volume (count) by Industry
1Q 2Q 3Q 4Q 1Q 2Q 3Q 4Q 1Q 2Q 3Q 4Q 1Q 2Q 3Q2007 2008 2009 2010
0%
10%
20%
30%
40%
50%
60%
70%
80%
90%
100%
Business Products and Services (B2B)
Consumer Products and Services (B2C)
Financial Services
Energy
Healthcare
Information Technology
Materials & Resources
Source: PitchBook

Capital Shifts Away from B2CPercentage of Deal Volume (capital) by Industry
1Q 2Q 3Q 4Q 1Q 2Q 3Q 4Q 1Q 2Q 3Q 4Q 1Q 2Q 3Q2007 2008 2009 2010
0%
10%
20%
30%
40%
50%
60%
70%
80%
90%
100%
Business Products and Services (B2B)
Consumer Products and Services (B2C)
Financial Services
Energy
Healthcare
Information Technology
Materials & Resources
Source: PitchBook

Private Equity Exits

Exits Up 64% from 3Q 2009 Quarterly PE Exits by Corporate Acquisition, IPO and Secondary
Sale
Percentage of capital invested by industry
1Q 2Q 3Q 4Q 1Q 2Q 3Q 4Q 1Q 2Q 3Q 4Q 1Q 2Q 3Q 4Q 1Q 2Q 3Q2006 2007 2008 2009 2010
0
20
40
60
80
100
120
140
160
180
134
158
116
39
59
85
116
97
Corporate Acquisition IPO Secondary Transaction Source: PitchBook

Median Exit Value Climbs in 2010 Median Exit Size ($M)
Percentage of capital invested by industry
2004 2005 2006 2007 2008 2009 2010*$0
$50
$100
$150
$200
$250
$300
$109 $115 $126
$135 $138
$85
$200
$176
$155
$180
$250
$165
$200
$246
Corporate Acquisition Secondary Transaction*As of 9/30/2010Source: PitchBook

PE Firms Holding onto Companies Longer
Average Time from Buyout to Exit
Percentage of capital invested by industry
2004 2005 2006 2007 2008 2009 20103
4
5
3.9 Yrs 3.8 Yrs 3.8 Yrs
4.1 Yrs4.2 Yrs
4.7 Yrs
4.9 Yrs
Average Holding Period of Exits
Year Sold
Ave
rage
Yea
rs H
eld
Source: PitchBook* Through 3Q 2010

Private Equity Fundraising

PE Fund Closings on Pace with 2009Number of Funds Closed and Total Capital Raised by Year
* Through 3Q 2010
2004 2005 2006 2007 2008 2009 2010*$0
$50,000
$100,000
$150,000
$200,000
$250,000
$300,000
$350,000
-
50
100
150
200
250
300
$99,122 $156,297 $211,393 $311,942 $332,563 $146,296 $81,648
129
227 209
251
214
105
73
Capital Raised ($B) # of Funds Raised Source: PitchBook

PE Fundraising Levels Off in 3Q 2010Number of Funds Closed and Total Capital Raised by Quarter
1Q 2Q 3Q 4Q 1Q 2Q 3Q 4Q 1Q 2Q 3Q2008 2009 2010
$0
$20,000
$40,000
$60,000
$80,000
$100,000
$120,000
-
10
20
30
40
50
60
70
80
$113,685$107,132 $75,199 $36,547 $64,189 $40,389 $16,759 $24,959 $22,509 $34,553 $24,587
78
55
47
34
45
28
12
20
28 27
18
Capital Raised ($B) # of Funds Raised Source: PitchBook

Growing Fund Size Trend Continues
Percentage of US PE Funds (Count) by Size
2004 2005 2006 2007 2008 2009 2010*0%
10%
20%
30%
40%
50%
60%
70%
80%
90%
100%
Under $100M $100M-$250M $250M-$500M $500M-$1B $1B-$5B $5B+
Source: PitchBook* Through 3Q 2010

$1B - $5B Funds Dominate Capital Raised
Percentage of Capital Raised by Size – US Funds
2004 2005 2006 2007 2008 2009 2010*0%
10%
20%
30%
40%
50%
60%
70%
80%
90%
100%
Under $100M $100M-$250M $250M-$500M $500M-$1B $1B-$5B $5B+
* Through 3Q 2010
74%
Source: PitchBook

Fund Returns Overview

J-Curve
PE Leads in Average IRR Since 2000Average Fund IRR by Vintage Year
Vintage Year
1998 1999 2000 2001 2002 2003 2004 2005 2006
-20%
-15%
-10%
-5%
0%
5%
10%
15%
20%
25%22%
13%
4%
12%
-11%
-3%
-9%-12%
PE VC FoF Mezz All
Net
IRR
(%) S
ince
Ince
ption
As of 3/31/2010 Source: PitchBook

Private Equity Outperforming in the Long Run
Horizon IRR – Private Equity, Venture Capital and Public Index
1 Yr 3 Yrs 5 Yrs
-10%
0%
10%
20%
30%
40%
50%
12%
2%
14%
-3% 1%
PE VC Russell 3000
Hor
izon
IRR
(%)
As of 3/31/2010 Source: PitchBook

Returns Bounce Back from 2009 LowsMedian 1-Year Rolling Horizon IRR by Fund Type
Source: PitchBookOne Year IRR as of Year Ending March 31st
2001 2002 2003 2004 2005 2006 2007 2008 2009 2010
-40%
-30%
-20%
-10%
0%
10%
20%
30%
17%
21%
-18%
12%
17%
-38%
-14%
-7%
3%6%
-16%
-3%
20%
-1%8%
PE VC FoF Mezz ALL
Rolli
ng 1
Yea
r Hor
izon
IRR
(%)
PE Fund’s had an aver-age 1-year IRR of 12% for 2010

Private Equity Fund Returns

Outsized Returns for Funds Big and Small
Private Equity Horizon IRR by Fund Size
1 Yr 3 Yrs 5 Yrs
-20%
-15%
-10%
-5%
0%
5%
10%
15%
20%
25%20%
-14%
12%
0%
21%
4%
12%
Under $100M $100M-$250M $250M-$500M$500M-$1B $1B-$5B $5B+
Hor
izon
IRR
(%)
Source: PitchBookAs of 3/31/2010

Total Value of PE Funds Rose by 31% Last Year
Weighted 1-Year Change in Total PE Portfolio Value
3/31/2009Under $100M
$100M - $250M
$250M - $500M
$500M - $1B$1B - $5B
$5B+ 3/31/2010
95%
100%
105%
110%
115%
120%
125%
130%
135%
100%
0% 1% 0%1%
7%
21%
131%
Decrease In Remaining Value
Chan
ge (%
) in
Tota
l Por
tfol
io V
alue
Increase in Remaining ValueSource: PitchBook

Mature Private Equity Funds Well into the Positive
Average Private Equity Return Multiples by Vintage Year
1998 1999 2000 2001 2002 2003 2004 2005 2006 2007 2008 2009 2010*0.0x
0.2x
0.4x
0.6x
0.8x
1.0x
1.2x
1.4x
1.6x
1.8x
2.0x
1.38
1.55
1.79 1.81
1.60
1.25 1.28
1.00
0.86 0.82 0.840.78 0.80
Average of DPI Average of RVPI Average of TVPI
J-Curve
Source: PitchBook*Through 1H 2010

50% of All PE Funds Have a 7.6% IRR or HigherIRR Quartiles by Fund Size for Mature Private Equity
Funds
All
Under $100M
$100M-$250M
$250M-$500M
$500M-$1B
$1B-$5B
$5B+
-10% -5% 0% 5% 10% 15% 20% 25%
Internal Rate of Return (IRR)
Fund
Siz
e Ra
nges
As of 3/31/2010
75th Percentile
Median
25th Per-centile
Source: PitchBook

$485B of Private Equity Dry PowderCapital Overhang for Private Equity Funds Raised by US
Investors
2003 2004 2005 2006 2007 2008 2009 2010$0
$20
$40
$60
$80
$100
$120
$140
$160
$0
$50
$100
$150
$200
$250
$300
$350
$400
$450
$500 $485
$2.56 $7.97
$20.33 $29.17
$111.67
$159.12
$114.57
$39.94
Cumulative Overhang Under $100M $100M-$250M $250M-$500M$500M-$1B $1B-$5B $5B+
$ in Billion As of 3/31/2010
Source: PitchBook

Venture Capital Fund Returns

Average Venture Capital Fund 5-year Return Around 1%
Venture Capital Horizon IRR by Fund Size
Source: PitchBookAs of 3/31/2010
1 Yr 3 Yrs 5 Yrs
-20%
-15%
-10%
-5%
0%
5%
10%
-2%
-4%
-18%
1%
6%
-10%
3%
Under $80M $80M-$150M $150M-$250M$250M-$500M $500M-$1B $1B+
Hor
izon
IRR
(%)
As of 3/31/2010

Total Value of VC Funds Rose by 14% Last Year
Weighted 1-Year Change in Total VC Portfolio Value
Source: PitchBook
3/31/2009Under $80M
$80M-$150M$150M-$250M
$250M-$500M
$500M-$1B$1B+ 3/31/2010
95%
97%
99%
101%
103%
105%
107%
109%
111%
113%
115%
100.0%
- 1.3%
0.1%
5.9%
4.3%1.1%
3.8%
113.8%
Decrease in Remaining Value
Chan
ge (%
) in
Tota
l Por
tfol
io V
alue
Increase in Remaining Value

Venture Capital Funds Still Waiting for Liquidity Average Venture Capital Return Multiples by Vintage
Year
Source: PitchBook
1998 1999 2000 2001 2002 2003 2004 2005 2006 2007 2008 2009 2010*0.0x
0.2x
0.4x
0.6x
0.8x
1.0x
1.2x
1.4x
1.18
0.760.86
0.94 0.93
0.790.89
0.94
0.87 0.77 0.82 0.840.92
Average of DPI Average of RVPI Average of TVPI*As of 3/31/2010
J-Curve

Over Half of All Venture Capital Funds have Positive IRR
IRR Quartiles by Fund Size for Mature Venture Capital Funds
Source: PitchBook
All
Under $80M
$80M-$150M
$150M-$250M
$250M-$500M
$500M-$1B
Over $1B
-15% -10% -5% 0% 5% 10% 15% 20% 25%
Internal Rate of Return (IRR)
Fund
Siz
e Ra
nges
As of 3/31/2010
75th Percentile25th Percentile
Median

$82B of Venture Capital Dry PowderCapital Overhang for Venture Capital Funds Raised by
US Investors
Source: PitchBook
2003 2004 2005 2006 2007 2008 2009 2010$0
$5
$10
$15
$20
$25
$0
$10
$20
$30
$40
$50
$60
$70
$80
$90 $81.66
$1.39
$3.39
$10.65 $10.96
$20.30
$14.33
$9.63 $10.99
Cumulative Overhang Under $80M $80M-$150M $150M-$250M$250M-$500M $500M-$1B $1B+

Fund of Funds Returns

Funds from $500M to $1B Lead 5-Year IRRFund of Funds Horizon IRR by Fund Size
Source: PitchBookAs of 3/31/2010
1 Yr 3 Yrs 5 Yrs
-20%
-15%
-10%
-5%
0%
5%
10%
15%
20%18%
-5%
7%
9%
-16%
4%
14%
1%
Under $250M $250M-$500M $500M-$1B$1B-$5B $5B+
Hor
izon
IRR
(%)

Mature Fund of Funds Posting Strong Multiples Average Fund of Funds Return Multiples by Vintage Year
Source: PitchBook
1998 1999 2000 2001 2002 2003 2004 2005 2006 2007 2008 2009 2010*0.0x
0.2x
0.4x
0.6x
0.8x
1.0x
1.2x
1.4x
1.6x
1.32
1.14
1.421.38 1.34
1.26
1.060.93
0.87 0.84
0.92 0.95 1.02
Average of DPI Average of RVPI Average of TVPI*As of 3/31/2010
J-Curve

Global Fund Returns

Mature Global PE Funds Average DPI of 1.2x
Average Global Private Equity Return Multiples by Vintage Year
Source: PitchBook
1998 1999 2000 2001 2002 2003 2004 2005 2006 2007 2008 2009 2010*0.0x
0.5x
1.0x
1.5x
2.0x
2.5x
1.54 1.49
1.78
2.41
1.751.63
1.17 1.14
0.79 0.73 0.72 0.72 0.82
Average of DPI Average of RVPI Average of TVPI*As of 3/31/2010
J-Curve

Mature Global VC Funds Average TVPI of 1.25x
Average Global Venture Capital Return Multiples by Vintage Year
Source: PitchBook
1998 1999 2000 2001 2002 2003 2004 2005 2006 2007 2008 2009 2010*0.0x
0.2x
0.4x
0.6x
0.8x
1.0x
1.2x
1.4x
1.6x
1.8x
1.12
1.63
1.30
0.99
1.63
1.37
1.13
0.83
0.78 0.77 0.77
0.91 0.92
Average of DPI Average of RVPI Average of TVPI*As of 3/31/2010
J-Curve