Embed Size (px)
Citation preview

The Emperor Has New Clothes: Empirical Tests of Mainstream
Theories of Economic Growth
David Greasley
Nick Hanley
Eoin McLaughlin
Les Oxley
Stirling Economics Discussion Paper 2014-08
August 2014
Online at http://www.stir.ac.uk/management/research/economics/working-papers/
1
University of Stirling Discussion Papers in Economics
The Emperor Has New Clothes: Empirical Tests of Mainstream Theories of Economic Growth1.
David Greasley*, Nick Hanley+, Eoin McLaughlin+, and Les Oxley#.
*School of History and Classics, University of Edinburgh, Scotland; + Department of Geography and Sustainable Development, University of St. Andrews,
Scotland; #Department of Economics, University of Waikato, New Zealand and Honorary Professor, University of Stirling.
August 2014
“It is a capital mistake to theorize before one has data. Insensibly one begins to twist facts to suit theories, instead of theories to fit facts.”
Sir Arthur Conan Doyle.
Abstract: Modern macroeconomic theory utilises optimal control techniques to model the
maximisation of individual well-being using a lifetime utility function. Agents face choices
over current and future consumption (with resultant implied savings decisions) seeking to
maximise the present value of current plus future well-being. However, such inter-temporal
welfare-maximising assumptions remain empirically untested. In the work presented here we
test whether welfare was in (historical) fact maximised in the US between 1870-2000 and find
empirical support for the optimising basis of growth theory, but only once a comprehensive
view of what constitutes a country’s wealth or capital is taken into account.
Keywords: inter-temporal utility maximisation; modern growth theory; US; comprehensive wealth JEL classifications: E21, E22, C61.
1 Acknowledgements: We would like to acknowledge the helpful and constructive comments received on
earlier drafts of this paper from Dorian Owen. The authors wish to acknowledge partial financial support for the research was received from the Leverhulme Trust.

2
1. Introduction. The popularity of modern growth theory is likely linked to its rigour associated with the
widespread adoption of optimal control-type techniques, which utilise a traditional micro-
economic theory of inter-temporal welfare maximisation. Armed with this toolkit, modern
macro-theorists are able to consider a range of issues within an optimising framework. This
approach to macroeconomics utilises the technical tools of Ramsey (1928), Weitzman (1976),
Arrow (1968) and Arrow and Kurz (1970) among others, to produce an elegant, mainstream,
model of economic growth that is now the basis of modern macroeconomic teaching and
research as exemplified by the popular works of Acemoglu (2009), Barro and Sala-i-Martin
(2004) and Aghion and Howitt (2008). Therein, one finds that the 'baseline assumption'2 to the
building of modern macroeconomics is that the representative infinitely lived individual
maximises their well-being using a lifetime utility function of the form:
W = ∫ e−ρt∞0 u[c(t)]dt (1)
where c(t) is the time path of consumption (this could be an extended consumption vector) , u(.)
is an instantaneous utility function with positive, yet diminishing marginal utility, and ρ
represents a positive rate of time preference.
Foreshadowing the work of Stiglitz, Sen and Fitoussi (2010), this version of macroeconomic
theory sees consumption rather than production as the focus of attention, where economic
agents face choices over current and future consumption paths (with resultant implied savings
decisions), seeking to maximise the present value of current plus future well-being.
The success and elegance of the theory is not, however, matched by empirical testing and
support. Empirical research into the drivers of economic growth (why country growth rates
differ for example), remains backward rather than forward looking, focussing upon large panels
of countries where data are typically constrained to recent, typically post-1945 periods (see for
example, Durlauf, Kourtellos, and Tan (2008), Brock and Durlauf (2001) and Durlauf, Johnson,
and Temple (2005)).
2 Acemoglu (2009, p.288)

3
The lack of empirical support for neoclassical growth models, which assume exogenous
population processes, does not surprise Galor and Weil (2000)3, where they see demographic
transition, technological change and standard of living as inexorably linked. In their ‘unified
growth model’, the pace of technological progress separates Malthusian and Post-Malthusian
regimes, and demographic transition is the mechanism that shifts economies into a “Modern
Growth” era where technology and output per capita increase rapidly as population growth
moderates. The demographic transition, however, is in part, influenced by the pace of
technological change leading to decisions to invest more in human capital – inducing a
substitution of quality (more educated) children for quantity.
A clear implication in their unified model is an increasing proportion of human capital in the
(broadly defined) capital stock as we progress through the Modern era. That is, as economies
grow, the balance between different types of capital within total wealth is changing (World
Bank, 2006). Furthermore, ‘children with high levels of human capital are, in turn, more likely
to advance the technological frontier or to adopt advanced technologies,’ (op cit., p. 810).
Fertility and income are also important in their model in relation to the possibility of ‘wealth
dilution’, where growing populations make higher demands on the availability of (exhaustible
and fixed) capital availability to future populations. In contrast to the simple Neo-classical
model of growth, key elements in the Galor and Weil (2000) approach are thus non-constant
population growth (with demographic transition as endogenous); the pace of technological
change (which is affected by the stock of human capital); and the potential effects of wealth
dilution (of population growth on fixed or exhaustible capital). We incorporate all of these
features in the empirical work reported below.
Although important differences exist between e.g., Galor and Weil (2000) and the simpler Neo-
classical underpinnings of the benchmark models of e.g., Barro and Sala-i-Martin (2004),
Acemoglu (2009) and Aghion and Howitt (2008), there is an inter-temporal welfare-maximising
assumption which underlies both approaches. This remains an untested assumption. The fact
that no such tests are reported or referred to in any of these seminal texts reflects a striking
dearth of empirical testing in this crucial area of macroeconomics.
3 “Neoclassical growth models with exogenous population are unable to capture this intricate (evolution of
population, technology and growth throughout human history) transition process.” Galor and Weil, 2000, p.809.
4
The work presented here is, we believe, the first to explicitly test the present value optimizing
assumptions expressed as equation (1) above, the importance of which cannot be over-stated in
the field of modern macroeconomics. Utilising the modelling framework of Ferreira and
Vincent (2005) and Ferreira, Vincent and Hamilton (2008), which is based on a theoretical
result from Weitzman (1976), we will test whether welfare was in (historical) fact maximised in
the US over the period 1870-2000. We focus on the USA over this particular time period as it is
the longest interval over which consistent macro data on investment (broadly defined) and
consumption can be assembled.
In detail, Section 2 will briefly describe the theoretical model presented by Ferreira and Vincent
(2005) and Ferreira, Vincent and Hamilton (2008), and demonstrate how its testable
implications relate to the untested assumptions of for example, Acemoglu et. al. This involves
us looking at how changes in net investment in multiple forms of capital are related to changes
in the present value of future consumption (Sala-I-Martin, 1997) over the long run, as well as
the effects of including technological advances as measured by changes in Total Factor
Productivity, and changes in the population growth rate (Easterly and Levine 2001; Arrow et al,
2003). In Section 3 we describe the data, followed in Section 4 by the econometric testing
implications. Section 5 presents the empirical results and Section 6 concludes.
2. The theoretical model and its testable implications. We start with the model of Weitzman (1976). He studies an economy which produces a single
consumption good (or multiple consumption goods representable by an index number) using
multiple types of capital over infinite time, with a constant discount rate equal to the
consumption rate of interest, r. Weitzman states that this total stock of capital includes produced
capital (“..equipment, structures and inventories”..), but also human capital, technology and
natural resources. He assumes that all sources of growth can be attributed to one of these capital
stocks. Prices for consumption goods and for investment goods are determined competitively.
Setting the price of consumption goods equal to one and using these as the numeraire, then the
national accounting identity states that NNP in period t is by definition equal to the sum of
consumption and net investment, the latter evaluated at a vector of prices p:
Y(t) ≡ C(t) + 𝐩(t)𝐈(t) (2)

5
His most important result is then that Net National Product at time t, Y(t), is equal to a weighted
average of future consumption, C� (t):
Y(t) = (C� (t)) (3)
where the inter-temporal weights used to calculate C� (t) depend on r. He shows that NNP in any
period is identical to the Hamiltonian of the optimal control problem which maximises social
welfare W (the discounted value of future consumption):
𝑊(𝑡) = ∫ 𝐶(𝑠)∞𝑡 𝑒−𝑟(𝑠−𝑡) 𝑑𝑠 (4)
subject to the production possibilities of the economy. NNP, in this optimising economy, is thus
a forward-looking measure of future well-being as measured by the discounted value of future
consumption streams. For (3) to correctly describe a dynamic economy, a number of
assumptions must hold, noted by Weitzman as (i) perfectly competitive markets, including a
perfect capital market (implying prices used to measure NNP being equal to marginal rates of
transformation) and (ii) perfect foresight4.
Ferreira and Vincent (2005) adapt (3) by deducting the value of present period consumption
from each side of (2) to obtain:
C �(t) − C(t) = 𝐩(t)𝐈(t) (5)
They then use (5) to derive a reduced form econometric model which enables them to test the
predictive ability of increasingly-comprehensive measures of net investment (that is, as one
considers an increasingly wide set of capital stocks) in relation to changes in future
consumption. This provides the key insight for what we do in the empirical part of the paper.
Based on Hamilton and Hartwick (2005), Ferreira, Hamilton and Vincent (2008) amend (5) to
the following, to show how current-period net investment5 in all forms of capital (It) is related to
future well-being:
∫ dC(s)ds
∞t e−∫ r(τ)dτs
t ds = I(t) (6)
4 Asheim and Weitzman (2001) extend Weitzman (1976) for the case of multiple consumption goods whose
relative values are expressed using a Divisia index. 5 They refer to net investment in all forms of capital as “genuine savings”.

6
where C is consumption and r is the consumption rate of discount. Equation (6) states that the
present value of changes in consumption will be equal to the value of net investment in period t,
assuming the economy is indeed on a PV-optimal path. Changes in a country’s total capital – its
comprehensive wealth – are thus related to changes in future consumption relative to the present
(Weitzman, 2003; Arrow et al, 2012). If population is growing over time at some constant rate
γ, then Dasgupta (2001) shows that the relationship in (6) can be re-stated in per-capita terms as:
∫ dc(s)ds
∞t e−∫ −r(τ)−γdτs
t ds = g(t) (7)
where c is now per-capita consumption, the discount rate is reduced by the rate of population
growth γ, and g is per capita net investment in all forms of capital (genuine savings per capita, in
the terminology of Ferreira et al).
As noted in section 1, Galor and Weil (2000) point to the importance of technological progress
in modelling growth. Arrow et al (2012) include the effects of technological change over time in
their measure of comprehensive wealth (the value of all capital stocks in the economy), arguing
that this is “….an increment to knowledge capital beyond what is captured in (changes in)
human capital” (p 321). Arrow et al accomplish this by using changes in TFP as their measure of
technological change, adding the TFP growth rate to the year-on-year change in comprehensive
wealth. In the empirical work reported below, we also include the value of TFP growth in our
estimates of changes in total capital, albeit using a different approach to Arrow et al.
The specification of the link between changings in inter-temporal welfare (the left hand side of
(6) and changes in comprehensive wealth (the right hand side of (6) leads to an econometric
model which can be tested. With population growing at a constant rate, the relationship between
net investment and future consumption implied by (6) is given in per capita terms by:
PVΔCt = β0 + β1gt + ϵt (8)
where {PVΔCt} is the present value of changes in consumption in years (t+1, t+2, ….t+T)
relative to consumption in period t . Net investment per capita is defined as:
g = K̇N− γω (9)
where –γω is a wealth dilution effect determined by wealth per capita ω and the population
growth rate γ for a population of size N in time t. If the population growth rate varies over time,
then (8) becomes:
7
PVΔCt + PV(Δγtωt) = β0 + β1gt + ϵt (10)
If (6) or (7) describes reality (and therefore that economic agents are present-value maximizing),
then a testable hypothesis is that β1 = 1 in (8) or (10). We now describe the data used to test this
hypothesis.
3. The Data
3.1 Measures of net changes in capital stocks over time This section defines and outlines the components of increasingly comprehensive measures of
annual investment in the USA, 1869-2000. Further information can be found in the Data
Appendix. Aggregate wealth comprises produced, human, natural and knowledge capital
(Arrow et al, 2012). In summary, we have constructed a sequence of net changes in capital
stocks:
• NETINV: changes in net produced and net foreign capital.
• GREENINV: NETINV plus changes in farmland, renewable and non-renewable
resources, and the disinvestment associated with CO2 emissions.
• CI: GREENINV plus net changes in human capital.
• GREENTFP and CITFP: GREEN and CI augmented with the value of changes in the
knowledge stock.
• CITFPW: CITFP less wealth dilution.
This increasingly comprehensive view of what constitutes “capital” follows Ferreira et al (2008)
and Greasley et al (2014) and allows for scrutiny of the hypotheses β1 = 1 with the alternative
net investment measures.
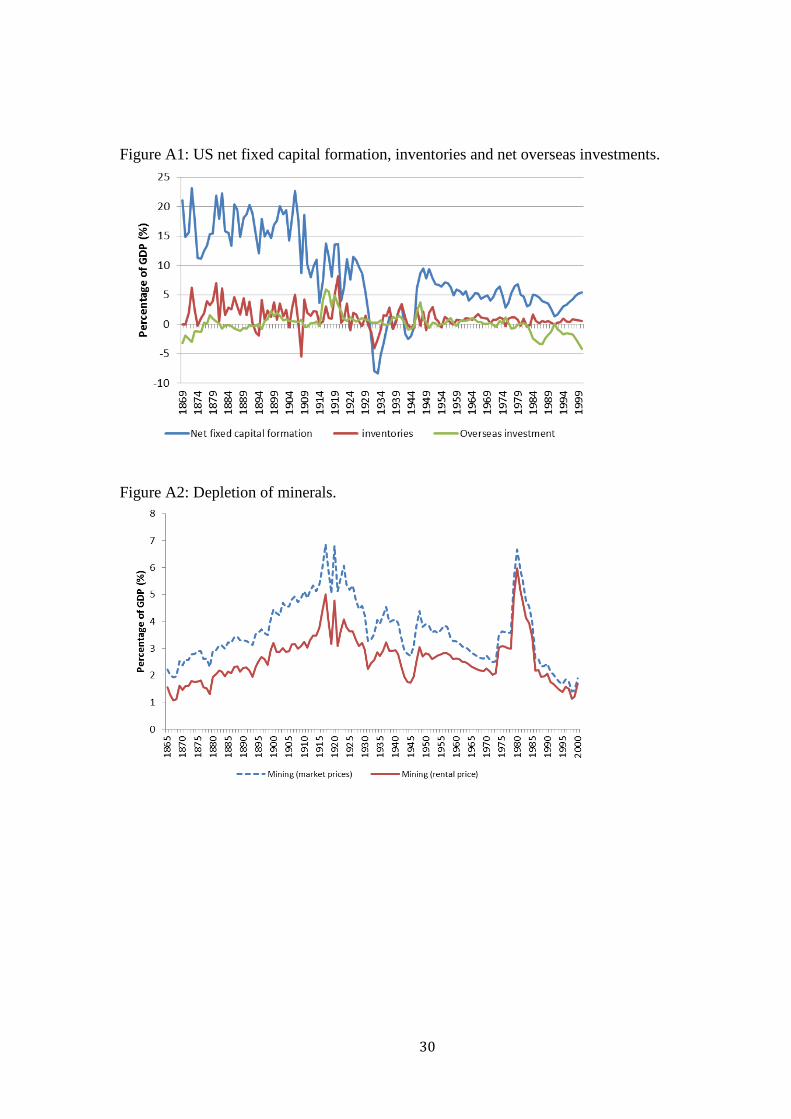
3.1.1 Changes in produced and net overseas capital (NETINV)
Net produced investment comprises net fixed capital formation, changes in inventories and net
overseas investment (Figure A1) where these data are shown relative to GDP. Produced capital
formation fell from around 15-20% of GDP 1870-1900 to around 5% at the start of the 21st

8
century. The initial down-step in the produced investment ratio occurred in the 1920s, and the
USA experienced a long period of negative investment, which spanned the Great Depression
and World War 2. There was an upturn in the produced investment after 1945 but the earlier
highs were not regained. Net overseas investment was generally positive from the 1890s to the
1970s, while inventory changes gradually diminished relative to GDP. In per capita terms
NETINV falls after 1929, then it is generally negative until 1945, but the levels of the early 20th
century were restored in the 1970s (Figure 1).
3.1.2 Adding changes in natural capital (GREENINV)
The chief elements of natural capital included here are forestry, mining (metals and minerals)
and agricultural land. Forest area fell to the 1920s but rose over the next half-century to peak at
around 300 million hectares in the early 1970s. The standing value of the trees also fell to the
1920s but rose thereafter, partly reflecting the higher timber volumes per hectare after 1945.
The rental value of forest depletion (valued using the difference between harvest price and
marginal cost) averaged around 1% of GDP each year in the period 1870-1900; whereas
afforestation took place during the twentieth century (Table A1).
Increases in the area of farmland or its’ per hectare value are treated as net additions to the
natural capital stock. The farmland area of the USA more than doubled in size 1870-2000,
despite a gradual decline from around 1950. Changes in the rental value of farmland generally
augmented the US natural capital stock before 1950, although there was a brief decline during
the rural financial crisis after the post-World War 1 boom (Table A2). However, the annual
changes in the rental value of farmland are small, and peaked at around 0.42% of GDP in the
1890s.
Over the period 1869-2000 mining output valued at market prices averaged 3.9% of GDP while
the value of extracted mining rents, which deduct marginal extraction costs from prices,
averaged 2.8% of GDP. Fuels, including coal, oil and gas account for most of the extracted
rents (Figure A2). The market value of extracted metals, including iron ore, copper and bauxite
peaked relative to GDP during World War 1, and fell to below 1% thereafter. Other minerals’
output, including, gypsum, stone and salt, had a market value over 1% of GDP in the 1920s, but
this ratio fell thereafter. Overall, the extraction of mining rents rose above 5% of GDP during
World War 1, and hit 6% around 1980. Extracted mineral rents never fell below 1% of GDP,

9
and when the produced investment ratio collapsed during the 1930s, the depletion of minerals
accentuated the marked fall in the US capital stock.
Next we consider the extent to which pollution depletes natural capital. Emissions of
greenhouse gases add to the stock in the atmosphere, and many authors have included estimates
of the shadow cost of carbon emissions in comprehensive investment-type calculations (World
Bank, 2011; Pezzey and Burke, 2013). This value is a deduction from natural capital since it
represents a using-up of scarce global assimilative capacity. The estimates here, following
Kunnas et al (2014), suggest the disinvestment associated with carbon pollution averaged
around 0.3% of GDP during the 20th century (Figure A3), but pollution costs rose sharply in the
period to 1920 when energy-GDP ratios were also rising (Devine, 1983).
3.1.3 Adding changes in human capital (CI)
Like the World Bank (2006, 2011), we use annual investment in public education as a measure
of the change in the stock of human capital. Whilst one could use an alternative approach, based
on lifetime earnings and changes in worker productivity (Arrow et al, 2012), the expenditure
approach fits naturally with measures of comprehensive investment. A measure of such
expenditures would ideally include private spending on education and spending by firms on
worker training, but consistent, continuous data are not available on either of these. Public
education investment rose to around 6.5% of GDP by the 1960s, but the ratio levelled thereafter
(Figure A4). The earlier spike and trough in the ratio reflect that education spending was
maintained both when GDP collapsed at the onset of the Great Depression and surged during
World War 2.
Putting together these individual changes in capital stocks for the USA, we see that real CI per
capita rises by around four times 1869-2000 (Figure 1). Within these years CI per capita shows
no discernible trend from around 1880-1925. Net produced investment was above CI during
these years since public education investment was insufficient to offset the effects of natural
resource depletion. From 1925-1945 the USA witnessed a major slump in CI associated with
the Great Depression and World War 2, which included spells when the capital stocks included
in CI fell. After 1945 net produced investment per capita was typically no higher than it had
been before 1925. The major change after 1945 was that higher public investment in education

10
more than offsets natural capital depletion, hence CI per capita rises, and exceeds the earlier
1906 peak for the first time in 1965.
3.1.4 Adding changes in the value of exogenous technological progress (CITFP)
Trend growth TFP estimates can be used to value exogenous technological progress. Arrow et
al (2012) simply augment their measure of comprehensive investment with the current value of
TFP, to show how technological progress increases current income. Strictly, however, treating
time as an uncontrolled capital stock means TFP’s contribution to the change in wealth in any
year should be included in the measure of CI. Our approach to gauging how TFP contributes to
changes in the value of wealth follows Pezzey et al (2006, Equation 14) but calculates the
present value of future changes in TFP over a 20 years horizon. Trend growth TFP is illustrated
as Figure A5. Adding the value of TFP to CI results in the more comprehensive measure,
CITFP per capita (Figure 2), which is always positive. In 2000 CITFP is above $8000 per capita
or around three-times higher than CI.
Treating technological progress as an uncontrolled stock of capital associated with the ‘passing
of time’ which can be measured by TFP assumes that all technological progress is exogenous.
This is clearly not the case empirically, and part of the TFP might arise from, for example,
R&D spending. A particular issue for the CITFP measure is its inclusion of public education
investment, which might be associated with endogenous technological change. This potentially
introduces an element of double counting into the measure. Accordingly, our empirical tests
also consider an alternative formulation of technology-augmented investment, GREENTFP,
which adds the technological progress premium to GREENINV, also shown in Figure 2.
3.1.5 Allowing for wealth dilution (CITFPW)
Finally, wealth dilution is included in the measure of investment defined as CITFPW, shown in
Figure 4. The effect arises from the sharing of a given level of total capital across a higher
population. The wealth dilution effect, measured by the product of the population growth rate
and wealth per capita, is at is strongest during the baby boom of 1940-60, and led to negative
rates of CITFPW during these years.

11
3.2 Measuring Changes in Well-Being. Based on the approach in Ferreira, Hamilton and Vincent (2008) as shown in Equation 7, we
use the present value of future changes in consumption per capita as a measure of changes in
well-being. The present value of the change in consumption is calculated over four time
horizons; 20, 30, 50, 100 years initially using a 3.5% year discount rate. This discount rate is the
difference between the mean long-term interest rate on US government bonds and the mean
inflation rate, interpreted here as the real return on risk-free assets (Officer, 2014). Figure 3
illustrates the present value of changes in future consumption. Finally, to correspond with
Equation 10, we have incorporated a wealth dilution effect where the values of the future well-
being changes are adjusted, including by subtracting the average population growth rate from
the discount rate.
4. Econometric testing
The long spans of the univariate macroeconomic time series data used in the estimation and
testing of the various models have the potential to exhibit non-stationary properties.6 Thus,
without appropriate methods, estimates may be inefficient or spurious and the usual
significance tests may be invalid. Engle and Granger (1987) show that a linear combination of
two or more series that are integrated of order 1 may be stationary. The linear combination, if it
exists, defines a cointegrating relationship where the resulting vector characterises the long-run
relationship between the variables. A cointegration estimation approach: (i) resolves the
problem of non-stationary time series data and the inference issues of its neglect, (ii) has the
interpretation that the cointegrating relationship (if it exists) can be regarded as a (potentially)
unique long-run economic equilibrium relationship, (iii) has the properties that the estimates are
'super-consistent' i.e. they are consistent with much smaller sample sizes, (iv) 'washes-out' in the
long-run random errors that may exist in one or both series and, (v) means inferences can be
made on the levels of the series. If cointegration exists, the power of its long-run properties
dominates short-run variations, which by definition are going to be stationary. Cointegrating
relationships, however, and their benefits and properties, do not exist with all combinations of
non- stationary series – there is a need to test for their existence. Furthermore, not all estimators
are efficient in the presence of strong endogeneity, although they are typically super-consistent.
6 This contrasts with the samples of e.g., Ferreira, Hamilton and Vincent (2008) where they explicitly rule-out
any investigation of cointegration given the small t component of their panel dataset.

12
There are a range of methods available to test for the existence of cointegration ranging from
the simple and popular Engle-Granger (1987) 'two-step' approach which appraises the time
series properties of the residuals in a levels OLS regression and where the null hypothesis is of
no-cointegration; to the maximum likelihood-based tests of Johansen (1995) and the
adjustments made by Phillips and Hansen's (1990) Fully Modified OLS (FMOLS). The time
series properties of the residuals are investigated using the unit root test of Elliott, Rothenberg
and Stock (1996).
When translated into a (potentially) cointegrating regression environment, the approaches of
Engle and Granger (1987), Phillips and Ouliaris (1988) and Johansen (1995) are not the best to
use if there are breaks in the cointegrating vector as the methods fail to reject the null
hypothesis of no cointegration less often than they should. In an attempt to counteract this
potential problem we consider the cointegration test associated with Hansen (1992) which
explicitly involves testing the cointegrating relationship for parameter stability. In contrast to
the residual based tests underpinning Engle-Granger, etc., Hansen's test does not rely on
estimates from the original equation.
One important issue that arises in the ‘wealth dilution’ versions of the tests is the issue of
endogeneity (see Ferreira, Hamilton and Vincent (2008) pp. 241-42 for a discussion). Their
response was to use a generalized two-stage least squares ( 2 S L S ) estimator.7 We also
report 2SLS-based results, where appropriate, but in addition provide both OLS and
FMOLS8, cointegration-based results given the long spans of the data. As is well known,
ordinary 2SLS estimates will be less efficient than OLS, but will account for any
endogeneity-based bias. We utilise the Durbin-Wu-Hausman test to evaluate whether 2SLS
is appropriate, where we use instruments similar to those of Ferreira, Hamilton and Vincent
(2008)9. In addition, however, given the efficiency loss of 2SLS, we also report FMOLS
results. Although estimates from a cointegrated model will be superconsistent, in small
samples they may be biased, although this will disappear asymptotically. In order to
eliminate second-order bias in small samples, Phillips and Hansen (1990) correct the single-
7 The set of instruments they used included lagged values of green savings, produced capital, the percentage of the population of working age, the population growth rate, and a time trend.
8 We also considered Dynamic OLS (DOLS) and Canonical Cointegrating Regression (CCR) approaches, which provided results that were qualitatively similar in all cases and are not reported here.
9The list of instruments included (one period lags of) long run and short run interest rates; population growth rates; the relevant measure of savings and a time trend.
13
equation estimates non-parametrically to obtain median-unbiased and asymptotically normal
estimates.
It should be stressed however, that a finding of non-cointegration does not invalidate the results,
but they are potentially less robust. As will be seen in what is presented below, coefficient
estimates in (statistically) non-cointegrated models, and the inferences made, are generally very
similar to cases where cointegration (in a similar model) has been established. At this point we
also reiterate that in the results presented below we are specifically and solely concerned with
consideration of the results as tests of the size and sign of β1. Estimation and testing is restricted
to testing this implication, and as such the results should not to be construed as structural
models of the growth process, which would clearly entail much richer models with additional
variables drawn from a wide range of candidates.
5. Results
Firstly, the welfare-maximising assumption of the standard neo-classical growth model is
investigated. This model includes a constant population growth rate and implies a relationship
between changes in future consumption and changes in capital as defined in Equation 7. The
increasingly broad measures of net investment g discussed in section 3 are introduced
sequentially in the estimation of Equation 8, with the results for net produced and
comprehensive investment shown in Table 1 for consumption horizons spanning from 20-100
years. The estimates of β1 for the narrower measure of produced investment NETINV offer
scant support for the neo-classical model with a maximum value of 0.401. Given the
imprecision (the high standard errors) of the estimates, the hypothesis β1 = 1 is not rejected over
the 20 and 30 years horizons, but, in all cases, the tests for no cointegration fail to reject the
null. The broader investment measure CI, which adjusts for changes in natural and human
capital, offers more support for the standard theory, with the non-cointegration null rejected
over 20 or 30 years, and the estimates of β1 falling in the range 1.24-1.34. However, the
theoretical model incorporates an infinite consumption horizon and the β1 estimates over the 50
and 100 years horizons do not support the standard neo-classical model. One possibility for the
lack of support for the theoretical model over the longer horizons is that the measures NETINV
and CI define net investment too narrowly. One missing element from the changes in wealth
assessed so far is the value of technological progress (Weitzman, 1997).

14
The adjustment for changes in TFP on net investment is undertaken using the method outlined
in Greasley et al (2014). We focus just on the more inclusive measures of changes in total
capital, namely CI and GREENINV. Augmenting these measures of net investment with a value
for changes in the stock of knowledge, measured here by the discounted value of TFP, yields
estimates of β1 that are closer to unity, especially over the 30 years consumption horizon, with
coefficients of 0.86 and 1.04 (Table 2). The difference depends on whether or not education
investment is included, as in the case of CITFP, or not, as for GREENTFP, where human
capital formation will be simply reflected in TFP. The null of non-cointegration is not rejected
over the 20-50 years horizons for any of the technology-augmented measures, further
highlighting the case for including changes in knowledge’s value in net investment. Generally,
the estimated coefficients for technology-augmented investment have lower standard errors,
compared to those for NETINV and CI, and the hypothesis that β1 = 1 is rejected in all cases
except for GREENTFP over the 30 years horizon.
Next, the implications of extending the standard neo-classical model to allow varying
population growth are examined. Relaxing the assumption of a constant population growth leads
to the relationship between investment and future consumption being defined as Equation 10,
where net investment is reduced by wealth dilution if the population is growing. Since Equation
10 also embeds wealth in the dependent variable, a potential endogeneity issue arises. The results
in Table 3 focus on CITFP, given the demonstrated utility of including changes in the value of
knowledge in net investment, but the estimated coefficients are from OLS, 2SLS and FMOLS
methods, to allow investigation of the possible bias from endogeneity.
The OLS results (Estimates A-D) in Table 3 modify the findings of Tables 1 and 2 to allow for
the effects of wealth dilution associated with varying population growth. The estimates of β1 are
generally closer to unity with the adjustment for wealth dilution, and in all cases (A-D) the
hypothesis that β1 = 1 is not rejected. The tests for the null of no-cointegration are less clear-
cut10 with the ERS adjusted Dickey-Fuller statistics rejecting the null only over 30 and 100
years horizons. The utility of Estimates A-D also need to be judged in relation to the choice of
10 See fn. 11.

15
discount rate, which is not adjusted for population growth, and possible OLS estimation bias
from endogeneity.
To investigate the possible bias of the OLS estimates 2SLS estimates are also reported
(Estimates E-H). An additional modification in the 2SLS estimates is the reduction of the
consumption discounting factor by the population growth rate, which has averaged 1.48%/year
since 1870. Ferreira, Hamilton and Vincent (2008, p.236) articulate the consequences for
Equation 8 above of relaxing the restriction of constant population growth, including for the
consumption discount rate. One distinctive feature of the 2SLS results presented here is the
support they offer to the extended, varying population, neo-classical growth model over the 100
years horizon, where the null of non-cointegration is rejected by the DF-ERS test, but the
hypothesis β1 = 1 is not rejected. Further, the W-D-U test null for an exogenous independent
variable is only rejected in the case of the 30 years consumption horizon.
Accordingly, further, more efficient OLS estimates, are reported (Estimates I-L), and these only
differ from the OLS Estimates A-D in their use of the population growth adjusted discount rate
of 1.98%/year for all the variables. The use of the lower discount rate adds to the support for
the population varying neo-classical model over the 100 years horizon, with estimated β1 = 1.1
and non-cointegration rejected by the DF-ERS statistic. These results may be contrasted with
those of Tables 1 and 2 where the estimated coefficients over the 100 years horizon for CI and
CITFP were 0.24 and 0.36. Collectively the results highlight the importance of including a
value for changes in technology and population-related wealth dilution in tests of the welfare
maximizing assumption of the neo-classical growth model. The findings here are supportive of
the premises of the neoclassical model, but there are a few caveats.
First, the results are sensitive to the choice of discount rate, especially over the longer 50 and
100 years horizons. And while adjusting the standard neo-classical model for varying
population is important, it introduces a possible bias in the empirical estimates of β1 arising
from endogeneity. To an extent the findings of cointegration and their support for the existence
of long-run equilibrium relationships lessen the concerns surrounding endogeneity. Further, the
W-D-U tests only rejected an exogenous independent variable for the 30 years horizon. FMOLS
estimation, which is robust where endogeniety exists, over the 30 years horizon (Estimate N)
gives a β1 = 0.91, although the P-O statistic does not reject no-cointegration. The P-O test is
known to bias in favour of non-rejection of a unit root where there are structural breaks in the

16
sample period. This provides a salutary reminder that the post-1870 sample used here contains
two world wars and a great depression, with inevitable consequences for the shorter-run
variations in the measures of net investment and future consumption. Hence our preference for
the results over the longer 100 years horizon, including Estimate L, which do not reject
cointegration and provide an estimate of β1 =1.11, which accords closely with the assumptions
of the neo-classical model adjusted for varying population growth.
6. Conclusions The idea that (macro) economic agents are rational, welfare optimisers who base their savings
and consumption decisions on present value maximisation is a powerful one in economics.
Modern theories of economic growth revolve around this basic assumption. However, the extent
to which it has been empirically tested over the long run is very limited to date. In this paper,
we make use of a framework for testing the predictions of the “new economics of wealth and
well-being” (Hamilton and Hepburn, 2014) to examine the properties of a data set from the
USA which traces year-on-year changes in produced, human and natural capital from 1869 to
2000. Deriving a number of increasingly inclusive indicators of changes in total capital
(comprehensive wealth: Arrow et al, 2012), we examine the relationship between these
indicators and the present value of changes in future consumption, up to 100 years ahead. The
Weitzman/Ferreira/Hamilton/Vincent framework generates testable hypotheses on the
parameter relating changes in total capital to this present value of changes in future
consumption, conditional on the assumption of an economy which is competitive in the sense of
Dixit et al (1980). This testing procedure has previously been applied to the examination of the
forward-looking properties of sustainable development indicators such as Genuine Savings
(Arrow et al, 2003).
The main results that emerge are that we once the measures of changes in total capital are
extended to include human and natural capital, then the β1 parameter is found to be close to
unity (as predicted by the theory). Cointegration (and thus a long-run equilibrium relationship)
also exists between these indicators of changes in total capital and future consumption up to 30
years ahead. Once a measure of the value of technological progress is included in net
investment, β1 moves even closer to unity, and evidence of cointegration is found up to 50
years ahead. Adding in the effects of varying population growth rates over time with
consequent wealth dilution effects improves the fit between theory and reality even more.

17
Overall, then, 130 years of data from the USA provides support for the basic building block of
modern growth theory, but only once a sufficiently comprehensive view of what constitutes a
country’s wealth or capital is taken. Caveats are many: we have very partial measures of
changes in natural and human capital; no account is taken of changes in social capital; our
measure of technological progress is easy to criticise. Nevertheless, we argue that the paper
provides interesting and important findings which are genuinely novel.

18
Data Appendix GDP, GDP deflator, population: Johnston and Williamson (2013). Consumption: 1869-1900 from Rhode (2002), 1901-1962 from Carter et al (2006) and 1963-2012 from ERP (2012). Nominal series are deflated with CPI from Johnston and Williamson (2013). The present value of the change in consumption adopts 3.5%/year (or 1.98%/year in the varying population growth model) discount rate based on Officer (2014). Net Investment: Net investment consists of produced capital, inventories and overseas investment. Gross fixed capital formation, inventories and net overseas investment for 1869-1909 are from Rhode (2002), for 1909-1929 from Kuznets (1961), for1929-1992 from Carter et al (2006) and for 1992-2000 from the ERP (2011). Capital consumption from Kuznets (1961) for 1869-1929, from ERP (1963, 1995, 2011) for 1929-2000. Green Investment: Forestry: Changes in forestry stock are estimated by the product of the area of forests and the standing volume of timber (m3). Forest area is from Carter et al (2006, series CF101-118 and Cf135-144) and standing volume from (Zon (1910), Zon &Sparhawk (1923), Clawson (1979), Oswalt et al. (2007), USDA (1997), Smith & Darr (2002), Smith, et al. (1997), USDA (1997) and Carter et al (2006). The earliest estimate of standing volume of 94.59 cubic metres per hectare in 1920 is adopted for 1850-1920. The change in the standing volume of timber is valued at market prices minus average costs. For the period 1869-1904 forestry prices are derived from Warren & Pearson (1932) and stumpage prices for 1905-2000 from Carter et al (2006). Employment and annual lumbering estimates are derived from the Carter et al (2006) and Lebedys (2004), the wage cost per m3 use unskilled wages from Officer (2012) and David and Solar (1977). Land: Changes in the volume of farmland are valued using the present value of rents looking forward 30 years. Land values are from Carter et al (2006), DA17. Lindert (1988) shows that rental values average 15% of the land values, a ratio used here to estimate annual rental values. Rents to 2030 are forecasted using an ARIMA (5,1,1). Non-renewables: 1880-2000 mining (fuel, metals and minerals) data are from Carter et al (2006). Fuel comprises Coal Bituminous, Coal Subbituminous, Coal Lignite, Coal Pennsylvania Anthracite, Crude Petroleum, Natural Gasoline and Cycle Products, and Liquefied Petroleum Gases, Natural Gas Marketed, Uranium Concentrate. Metals included are Iron Ore, Copper, Zinc, Manganese Ore, Chromite, Tungsten Concentrates, Molybdenum Ores and Concentrates, Vanadium Ores and Concentrates, Nickel, Bauxite, Aluminum Primary, Magnesium Primary, Gold, and Silver. Minerals are comprised of Crude Gypsum Mined, Lime, Sand and Gravel, Stone, Sulfur Production from Frasch Mines, Pyrites Production, Salt, Potash sold by producers, and Phosphate Rock. 1869-1880 mining production estimates are from Herfindahl (1996), (Gallman 1960) and Carter (2006 and valued at international prices. Commodities included are iron ore, copper, lead, zinc, gold, silver, coal and crude petroleum. Mining wage costs per tonne are based on coal wages and the relative productivity of coal and other mining. Over the period 1869-2000 the mean relative labor productivity difference between coal and all forms of mining was 1.06. Employment and wage data are from Carter et al (2006).

19
Carbon Emissions: US carbon pollution estimates are taken from Andres et al (1999) and Boden et al (1995) and the price series from is derived from Tol (2012). The 2015 price of $29 per tonne of carbon is discounted by 1.99%/year to 1869. TFP: The present value of future changes in TFP is measured over 20 horizons using a 3.5%/year discount rate (or 1.98%/year in the case of varying population growth model). Trend TFP growth rates are estimated for the period 1870 to 2013 with the Kalman filter (Figure A5). The TFP estimates include the real capital stock data of Gallman (1992), Kendrick (1963) and BEA (2014). Labour and hours worked are taken from Margo (2000), Greasley & Madsen (2006), and BLS (2014). Real GDP are from Johnston and Williamson (2013) and factor shares used from Greasley and Madsen (2006). Wealth dilution: Wealth is calculated from the above estimates of private and public consumption. The net present value of consumption is calculated over a 25 years horizon discounted at 3.5%/year (or 1.98%/year in the case of varying population growth model). For measures of wealth from 1988-2010 it is necessary to estimate future consumption for t+25. This was done using an ARIMA (3,1,2). Wealth dilution is calculated as the product of wealth per capita and the population growth rate.

20
References Acemoglu, D. (2009). An Introduction to Modern Economic Growth. Princeton University Press. Aghion P. and Howitt P. (2008). Endogenous Growth Theory. MIT Press.
Andres, R. J., Fielding, D. J., Marland, G., Boden, T. A., Kumar, N. & Kearney, A. T. (1999). Carbon dioxide emissions from fossil-fuel use, 1751-1950. Tellus, 51B, 759-765. Arrow, K.J. (1968). Applications of control theory to economic growth, In Mathematics of
Decision Sciences, George B. Dantzig & Arthur F Veinott (eds). Providence, R.I: American Mathematical Society.
Arrow KJ and Kurz M (1970). Public investment, the rate of return and optimal fiscal policy.
Baltimore: Johns Hopkins University Press. Arrow K J., Dasgupta P. and Maler K-G (2003). The Genuine Savings Criterion and the value
of population, Economic Theory, 21 (2), 217-225. Arrow, K.J., et al. (2012). Sustainability & the Measurement of Wealth. Environment and Development Economics, 17(3), 317-353. Barro RJ and Sala-i-Martin X (2004). Economic Growth. Cambridge, MA: MIT Press. T. A. Boden, G. Marland & R. J. Andres (1995). Estimates of Global, Regional, and National
Annual CO2 Emissions from Fossil-Fuel Burning, Hydraulic Cement Production, and Gas Flaring: 1950-1992. Oak Ridge National Laboratory and Carbon Dioxide Information Analysis Center, http://cdiac.ornl.gov/epubs/ndp/ndp030/ndp0301.htm
BEA (2014). Bureau of Economic Analysis, fixed asset accounts tables: http://www.bea.gov/iTable/iTable.cfm?ReqID=10&step=1#reqid=10&step=1&isuri=1 BLS (2014). Bureau of Labor Statistics. Employment, hours and earnings (CES). http://www.bls.gov/webapps/legacy/cesbtab1.htm Brock, W., and Durlauf, S. (2001). Growth empirics and reality, World Bank Economic Review, 15(2), 229-72. Clawson, M. (1979). Forests in the Long Sweep of American History, Science, 204 (4398), 1168-1174. Carter, Susan B., Gartner, Scott Sigmund, Haines, Michael R., Olmstead, Alan L., Sutch,
Richard Sutch, Wright, Gavin (2006). Historical Statistics of the United States, Earliest Times to the Present: Millennial Edition, Cambridge University Press.

21
Dasgupta P. (2001). Human Well-Being and the Natural Environment. New York: Oxford University Press. David, P. A. & Solar, P. (1977). A Bicentenary Contribution to the History of the Cost of Living in America. Research in Economic History, 2, pp. 1-80. Devine, W. D. (1983). From Shafts to Wires: Historical Perspective on Electrification. Journal of Economic History, 43(2), 347-72. Dixit A., Hammond P. and Hoel M. (1980). On Hartwick’s Rule for regular maximum paths of
capital accumulation Review of Economic Studies, 47 (3), 551-556. Durlauf, S., Kourtellos, A., and Tan, C.H. (2008). Are any growth theories robust? Economic Journal, 118, 329-346 Durlauf, S., Johnson, P., and Temple, J. (2005). Growth econometrics, in P Aghion and S. Durlauf. eds.,) Handbook of Economic Growth, Amsterdam, North Holland. ERP (1963, 1995, 2011). Economic Report of the President together with the annual Report of the Council of Economic Advisors, United States Government Printing Office, Washington. Easterly W. and Levine R. (2001). It’s not factor accumulation: stylized facts and growth
models World Bank Economic Review, 15 (2), 177-219. Elliott, G., Rothenberg, T., and Stock, J. (1996). Efficient tests of an autoregressive unit root. Econometrica, 64: 813-36. Engle, R. and Granger, C.W.J. (1987). Co-integration and erro-correction: Representation, estimation and testing, Econometrica, 55, 251-276. Ferreira, S. & J.R. Vincent. (2005). Genuine Savings: Leading Indicator of Sustainable Development? Economic Development and Cultural Change, 53, 737-754. Ferreira, S., K. Hamilton, & J.R. Vincent (2008). Comprehensive wealth and future
consumption: accounting for population growth. The World Bank Economic Review, 22(2), 233-248.
Gallman, R. E. (1960). The United States Commodity Output, 1839-1899, in (ed.), Trends in the American Economy in the Nineteenth Century, NBER Gallman, R. E. (1992). American Economic Growth before the Civil War: The Testimony of
the Capital Stock Estimates, in R. E. Gallman and J. J. Wallis (eds.) American Economic Growth and Standards of Living before the Civil War. Chicago: University of Chicago Press.
Galor O. and Weil D. (2000). Population, technology and growth American Economic Review,
90 (4), 806-828.

22
Greasley, D. & Madsen, J. B. (2006). Employment and total factor productivity convergence. Kyklos, 59, 527-555. Greasley, D. & Madsen, J. B. (2010). Curse and Boon: Natural resources and long run growth in currently rich economies. Economic Record, 86, 311-28. Greasley D., Hanley N, Kunnas J., McLaughlin E., Oxley L. and Warde P. (2014). Testing the
predictive power of genuine savings as an indicator of future well-being, Journal of Environmental Economics and Management, 67 (2014) 171–188.
Hamilton, K. & J. Hartwick. (2005). Investing exhaustible resource rents and the path of consumption Canadian Journal of Economics 38 (2), 615-621. Hamilton K., Hepburn C. (2014). Wealth. Oxford Review of Economic Policy, 30 (1), 1-20. Hansen, B. (1992). Efficient estimation and testing of cointegration vectors in the presence of deterministic trends, Journal of Econometrics, 53, 87-121. Herfindahl, O. C. (1966). Development of the Major Metal Mining Industries in the United
States from 1839 to 1909, in e. Dorothy S. Brady (ed.), Output, Employment, and Productivity in the United States after 1800, NBER.
Johansen, S. (1995). Likelihood-Based Inference in Cointegrated Vector Autoregressive Models. Oxford: Oxford University Press. Johnston, Louis & Williamson, Samuel H. (2013). What Was the U.S. GDP Then? Measuring Worth, URL: http://www.measuringworth.org/usgdp/ Kendrick, J. W. (1963). Productivity Trends in the United States. Princeton: Princeton University Press. Kunnas, J., McLaughlin E., Hanley N, Greasley, D., Oxley L. and Warde P. (2014). Counting
carbon: historic emissions from fossil fuels, long-run measures of sustainable development and carbon debt, Scandinavian Economic History Review. DOI: 10.1080/03585522.2014.896284
Kuznets, S. (1961). Capital in the American Economy: Its Formation and Financing, New Jersey: Princeton University Press. Lindert, P. H. (1988). Long-Run Trends in American Farmland values, Agricultural History, 62 ( 3) 45-85. Lebedys, A. (2004). Trends and current status of the contribution of the forestry sector to
national economies. Food and Agriculture Organisation of the United Nations, http://www.fao.org/docrep/007/ad493e/ad493e06.htm
Margo, R. A. (2000). Wages and labour markets in the United States, 1820-1860. Chicago: University of Chicago Press.
23
Officer, L. H. (2012). What Was the Value of the US Consumer Bundle Then? http://www.measuringworth.com/consumer/ Officer, L. H. (2014). What Was the Interest Rate Then? http://www.measuringworth.com/interestrates/ Oswalt, S. N., Thompson, M. & Smith, W. B. (2007). U.S. Forest Resource Facts and Historical Trends, Forest Inventory and Analysis National Program, http://fia.fs.fed.us. Rhode, P. W. (2002). Gallman's Annual Output series for the United States, 1834-1909. NBER working paper, Working Paper 8860. Pezzey, J.C.V. (2004). One-sided sustainability tests with amenities, and changes in technology, trade and population. Journal of Environmental Economics and Management, 48, 613- 631. Pezzey, J.C.V., Hanley N., Turner K. & Tinch D. (2006). Comparing augmented sustainability measures for Scotland: Is there a mismatch? Ecological Economics, 57, 70-74. Pezzey J.C.V. & Burke P. (2013). Measuring global sustainability using a precautionary
valuation of CO2 emissions. Paper to the Australian Association of Agricultural and Resource Economists’ conference, Sydney.
Phillips, P.C.B and Hansen, B. (1990). Statistical inference in instrumental variables regression
with I(1) processes. Review of Economic Studies, 57, 99-125. Phillips, P.C.B., and Ouliaris, S. (1990). Asymptotic properties of residual based tests for
cointegration. Econometrica, 58: 165-93. Ramsey, F. (1928). A mathematical theory of savings, Economic Journal, 38: 543-59. Sala-I-Martin X. (1997). “I just ran a million regressions” American Economic Review, 87 (2),
178-183. Smith, W. B. & Darr, D. (2002). U.S. Forest Resource Facts and Historical Trends. Smith, W. B., Vissage, J. S., Darr, D. R. & Sheffield, R. M. (1997). Forest Resources of the United States, 1997. Stiglitz J., Sen A. and Fitoussi JP (2010). Mis-measuring our lives: why GDP does not add up.
New York: New Books. Tol, R. S. J. (2012). On the Uncertainty About the Total Economic Impact of Climate Change, Environ Resource Economics, 53 (1)97-116. USDA (1997). U.S. Forest Facts and Historical Trends, US Department of Agriculture Forest Service. Warren & Pearson (1932). ‘Wholesale prices in the United States for 135 years, 1797 to 1932’.
in Wholesale prices for 213 years, 1820 to 1932. Agricultural Experiment Station, Cornell University, Ithaca N.Y.

24
Weitzman M. (1976). On the welfare significance of national product in a growing economy” Quarterly Journal of Economics, 90, 156-162. Weitzman, M. (1997). Sustainability and technical progress. Scandinavian Journal of Economics, 91 (1), 1-13. Weitzman M. (2003) Income, Wealth and the Maximum Principle. Cambridge, MA.: Harvard University Press. World Bank. (2006). Where is the wealth of nations? Measuring Capital for the 21st century. Washington DC. World Bank. World Bank. (2011). The Changing Wealth of Nations Measuring Sustainable Development in the New Millennium, Washington DC: World Bank. Zon, R. (1910). The Forest Resources of the World, U.S. Department of Agriculture. - Washington D.C: Forestry Service Zon, R. & Sparhawk, W. N. (1923). Forest Resources of the World. New York: McGraw-Hill.

25
Figure 1: Comprehensive investment (CI) per capita
Figure 2: CITFP and GREENTFP per capita

26
Figure 3 Present value consumption $(2000 price level, discounted at 3.5%)
Figure 4: Wealth dilution effect

27
11 The cvs for the DF-ERS statistic have not been corrected for the fact that residuals from equations 8 or 10 have been used in the calculation. This is likely to mean that the null hypothesis of no cointegration is less likely to be rejected than if true standard errors had been used representing a standard generated regressor problem.
Table 1. OLS Estimates of β0 and β1 for Two Investment Series (3.5% per annum discount rate)
Dependent Independent β0 β1 β1=1 DF-ERS CONS 20 NETINV 2267.4* 0.154 3.39 -2.47
(412.1) (0.459) (0.06) CONS 30 2660.2* 0.401 2.16 -1.84
(553.1) (0.684) (0.14) CONS 50 3916.6* -0.854 14.5* -1.22
(390.2) (0.487) (0.00) CONS 100 2270.6* 0.308 10.5* -2.68
(172.1) (0.214) (0.00) CONS 20 CI 1289.8* 1.242* 0.38 -3.25*
(496.3) (0.392) (0.54) CONS 30 1845.2* 1.343* 1.44 -2.87**
(293.8) (0.285) (0.23) CONS50 3399.8* -0.068 1.21 -0.99
(663.6) (0.971) (0.27) CONS 100 2335.5* 0.243 10.1* -2.51
(212.3) (0.238) (0.00) Notes: CONS=Net Present Value of Consumption per capita for 20-100 year horizons, * and ** denote significant at the 5 and 10% level respectively. DF-ERS = Elliott, Rothenberg and Stock DF statistic11.

28
Table 2. OLS Estimates of β0 and β1 for technology-augmented investment series (3.5% per annum discount rate)
Dependent Independent β0 β1 β1=1 DF-ERS CONS 20 CITFP 123.4 0.628* 28.0* -2.92** (330.7) (0.070) (0.00) CONS 30 208.1 0.856* 7.26* -2.82** (200.9) (0.053) (0.00) CONS50 -127.4 1.405* 13.9* -2.87** (301.0) (0.108) (0.00) CONS 100 1922.9* 0.360* 37.6* -2.75 (215.3) (0.104) (0.00) CONS 20 GREENTFP -122.7 0.791* 5.72* -3.19* (367.0) (0.087) (0.02) CONS 30 -53.7 1.043* 0.22 -3.06* (426.9) (0.092) (0.64) CONS50 -140.5 1.500* 9.39* -2.88** (551.9) (0.163) (0.00) CONS 100 1941.8* 0.357* 35.5* -2.75 (217.4) (0.107) (0.00) Notes: As for Figure 3

29
Table 3: Wealth Adjusted Estimates of β0 and β1 for technology-augmented investment (Estimates A-D 3.5%/year and Estimates E-Q 1.98%/year discount rates)
OLS Dependent Independent β0 β1 β1=1 D-W-H DF-ERS A CONSWP 20 CITFPW 1744.7* 1.064* 0.340 -2.59 (149.0) (0.110) (0.56) B CONSWP 30 2397.2* 1.191* 1.88 -2.81** (160.1) (0.139) (0.17)
C CONSWP50 3120.2* 1.080* 0.08 -2.48 (213.9) (0.268) (0.77)
D CONSWP 100 2327.2* 0.700* 2.73 -2.89** (118.7) (0.182) (0.09)
2SLS E CONSWPAD 20 CITFPWAD 2679.1* 0.630* 7.80* 0.20 -3.18* (168.3) (0.132) (0.00) (0.88)
F CONSWPAD 30 3746.5* 0.753* 1.46 4.53** -2.67 (219.2) (0.204) (0.23) (0.10)
G CONSWPAD50 4825.6* 0.286 2.60 3.66 -0.92 (366.1) (0.443) (0.11) (0.16)
H CONSWPAD 100 6018.0* 1.430* 1.20 1.89 -3.64* (332.7) (0.392) (0.27) (0.17)
OLS I CONSWPAD 20 CITFPWAD 2646.4* 0.646* 9.59* -3.14* (166.2) (0.114) (0.00) J CONSWPAD 30 3727.6* 0.756* 2.09 -2.76** (217.3) (0.169) (0.15)
K CONSWPAD50 4810.2* 0.267 5.26* -1.38 (338.2) (0.319) (0.02) L CONSWPAD 100 5756.8* 1.114* 0.19 -3.52* (242.0) (0.263) (0.66)
FMOLS β0 β1 β1=1 P-O M CONSWPAD 20 CITFPWAD 2630.4* 0.767* 1.00 -2.28
(348.2) (0.239) (0.32) N CONSWPAD 30 3735.1* 0.909* 0.06 -1.32 (466.0) (0.363) (0.80)
P CONSWPAD50 4879.9* 0.376 1.04 0.85 (645.2) (0.611) (0.31)
Q CONSWPAD 100 6143.2* 1.590* 1.73 -9.22 (409.7) (0.449) (0.19)
Notes: CONSWP = PVΔCit + PV(Δγitωit) from Equation 8, with 3.5%/year discount rate, for 20-100 years horizons. CONSWPAD = CONSWP with 3.5%/year – population growth discount rate. CITFPW = CITFP less wealth dilution with 3.5%/year discount rate. CITFPWAD = CITFPW with population growth adjusted discount rate, 1.98%/year. W-D-H = Durbin-Wu-Hausman J test. DF-ERS = Elliott, Rothenberg and Stock DF statistic. P-O = Phillips and Ouliaris cointegration test.
30
Figure A1: US net fixed capital formation, inventories and net overseas investments.
Figure A2: Depletion of minerals.

31
Figure A3: Carbon emissions and carbon share of GDP, 1869-2000
Figure A4: Public investment in education
012345678
1869
1875
1881
1887
1893
1899
1905
1911
1917
1923
1929
1935
1941
1947
1953
1959
1965
1971
1977
1983
1989
1995
Perc
enta
ge o
f GDP
(%)
Primary and secondary
Tertiary
All public expenditure on education

32
Figure A5: Trend Total Factor Productivity (%)
Figure A6 US consumption

33
Table A1: The value of US forest stocks (decade average)
Area
Volume per hectare
Standing volume
Change in Standing volume
Price - cost
Value of change in volume
Value of change in volume /GDP
Million hectares
M3 per hectare
Million M3
Million M3
$ M3 $ million
%
1861-1870 256.06 94.86 24289.05 -97.00 0.25 -24.18 -0.31 1871-1880 237.14 94.86 22494.33 -243.59 0.24 -58.04 -0.68 1881-1890 220.44 94.86 20909.75 -92.13 0.23 -21.46 -0.17 1891-1900 176.60 94.86 16751.08 -644.90 0.21 -137.30 -0.84 1901-1910 145.21 94.86 13773.59 -49.90 0.48 -23.61 -0.08 1911-1920 137.23 94.86 13016.88 -95.97 0.74 -71.45 -0.16 1921-1930 137.23 94.86 13016.88 -95.97 0.74 -71.45 -0.16 1931-1940 147.34 89.94 13251.84 -37.67 0.44 -24.15 -0.02 1941-1950 151.27 86.90 13139.04 167.66 0.88 232.23 0.08 1951-1960 201.09 86.35 17400.32 689.77 3.05 2043.01 0.45 1961-1970 239.80 92.87 22271.17 272.42 2.63 981.51 0.10 1971-1980 291.88 102.50 29941.73 724.68 12.64 5912.80 0.40 1981-1990 294.74 110.91 32691.59 231.54 11.79 2477.30 0.05 1991-2000 298.21 115.55 34458.02 119.52 29.33 3436.64 0.05 Sources: see Data Appendix

34
Table A2: Changes in farmland rental value, decade averages
Present value of rent per acre
Total farmland
Change in farmland
Change in rental value
Change in rents/GDP
$ Million acres Million acres $ m % 1861-1870 1.27 407.74 0.52 0.66 0.00 1871-1880 3.27 536.08 128.35 419.64 0.40 1881-1890 5.73 623.22 87.14 499.15 0.33 1891-1900 4.00 841.20 217.98 872.93 0.42 1901-1910 2.18 881.43 40.23 105.22 0.03 1911-1920 4.17 923.38 7.72 32.37 0.06 1921-1930 6.94 950.70 3.14 31.58 0.03 1931-1940 12.14 1044.65 7.50 81.38 0.12 1941-1950 35.57 1132.03 9.63 270.04 0.13 1951-1960 52.82 1144.49 -4.06 -198.25 -0.04 1961-1970 65.90 1091.85 -6.73 -468.95 -0.06 1971-1980 94.49 1019.34 -5.29 -492.57 -0.03 1981-1990 101.58 971.79 -4.76 -481.00 -0.01 1991-2000 111.40 936.03 -2.94 -326.91 0.00 Sources: see Data Appendix