Embed Size (px)
Citation preview
Wahyu Triyoso
Geophysics Working Group-FIKTM-ITB Bandung
-Developing Model for Sumatra Plate Margin-Most Material Was Presented JSPS Meeting at ERI, August, 2007 and Ministry
Research & Technology of Indonesia on September 2007
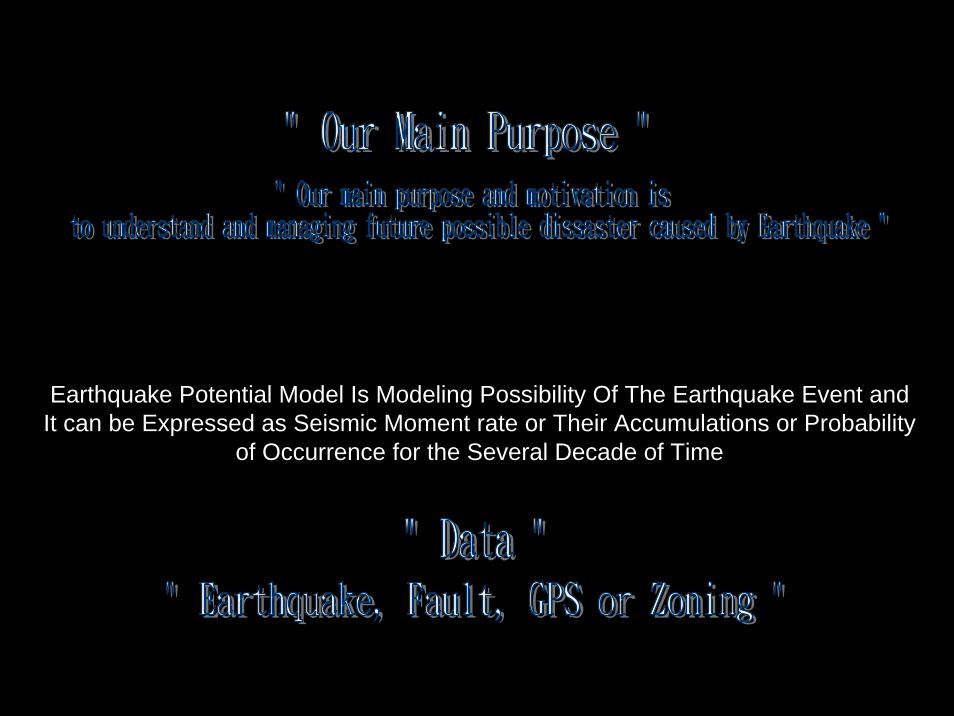
Earthquake Potential Model Is Modeling Possibility Of The Earthquake Event and It can be Expressed as Seismic Moment rate or Their Accumulations or Probability
of Occurrence for the Several Decade of Time
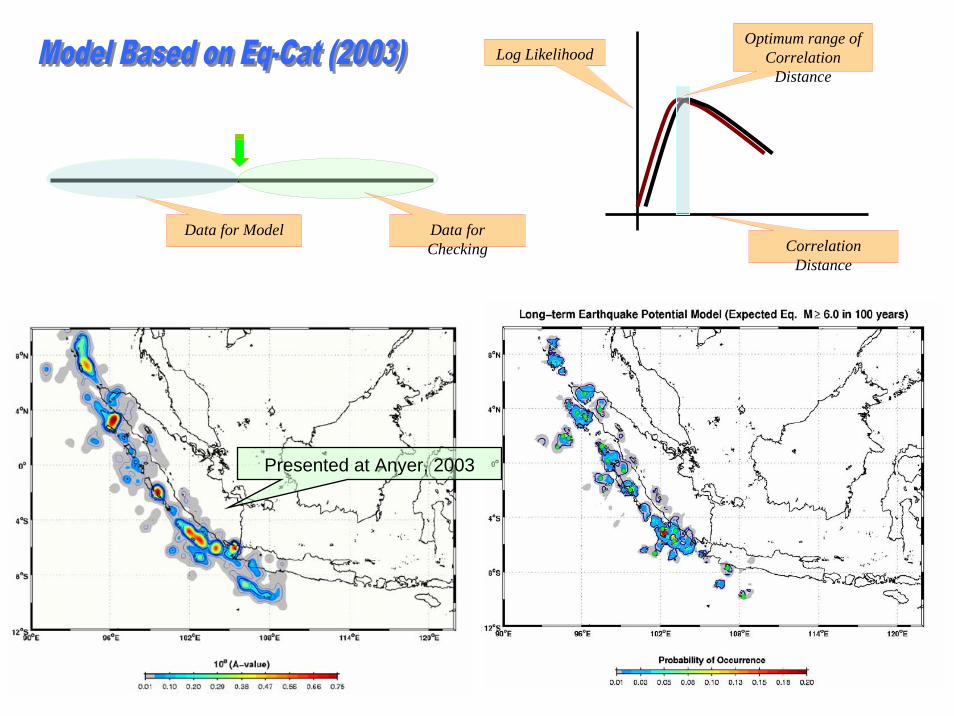
Data for Model Data for Checking
Optimum range of Correlation
DistanceLog Likelihood
Correlation Distance
Presented at Anyer, 2003
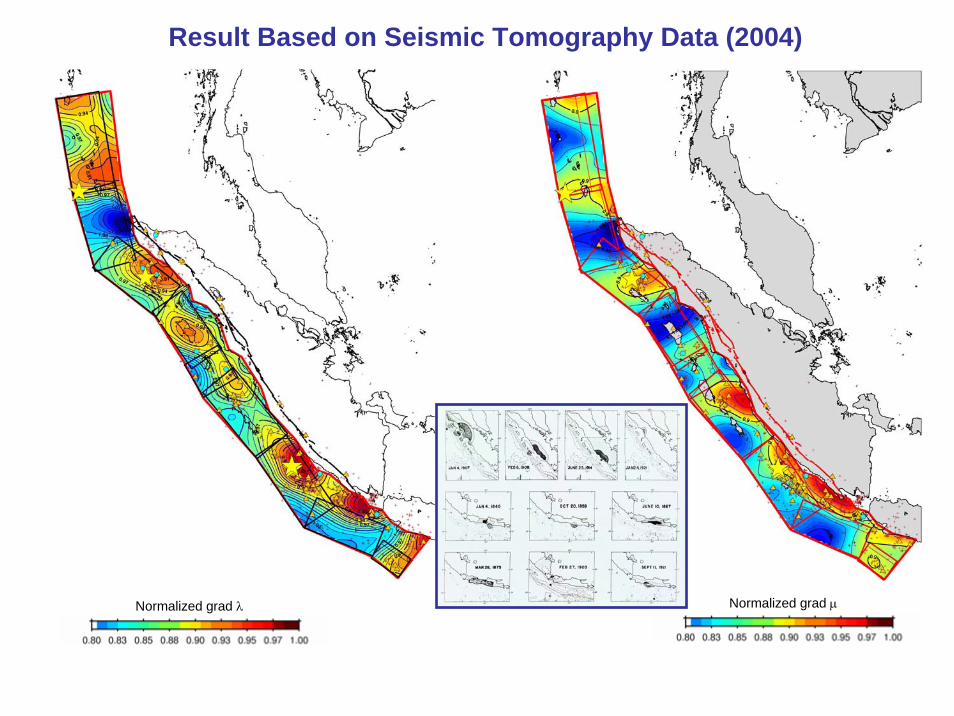
Normalized grad μ
Result Based on Seismic Tomography Data (2004)
Normalized grad λ
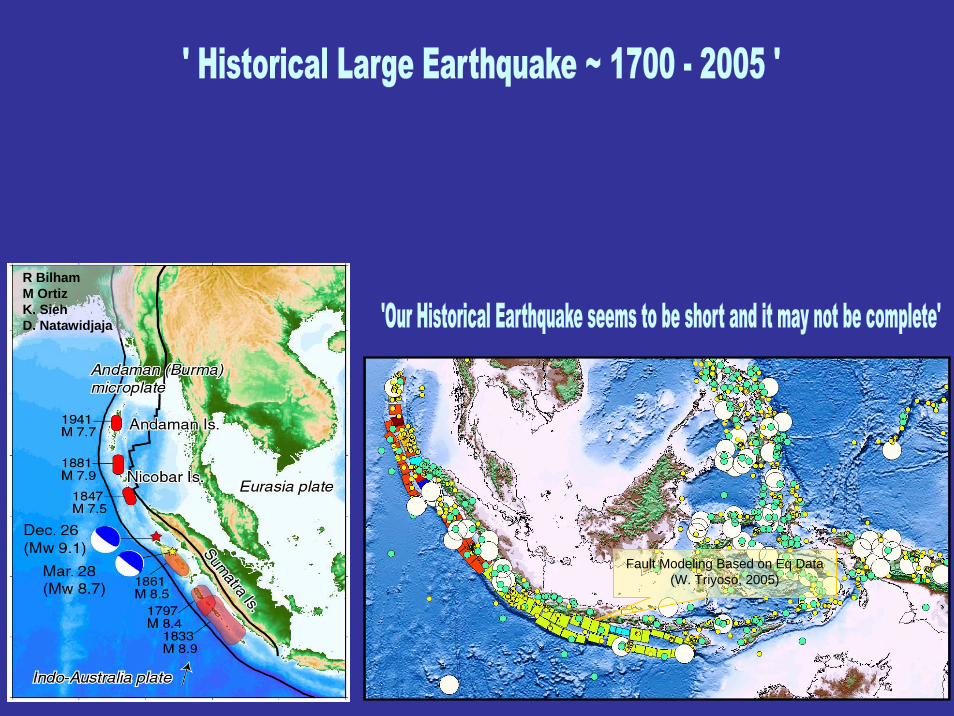
R BilhamM OrtizK. SiehD. Natawidjaja
Fault Modeling Based on Eq Data(W. Triyoso, 2005)
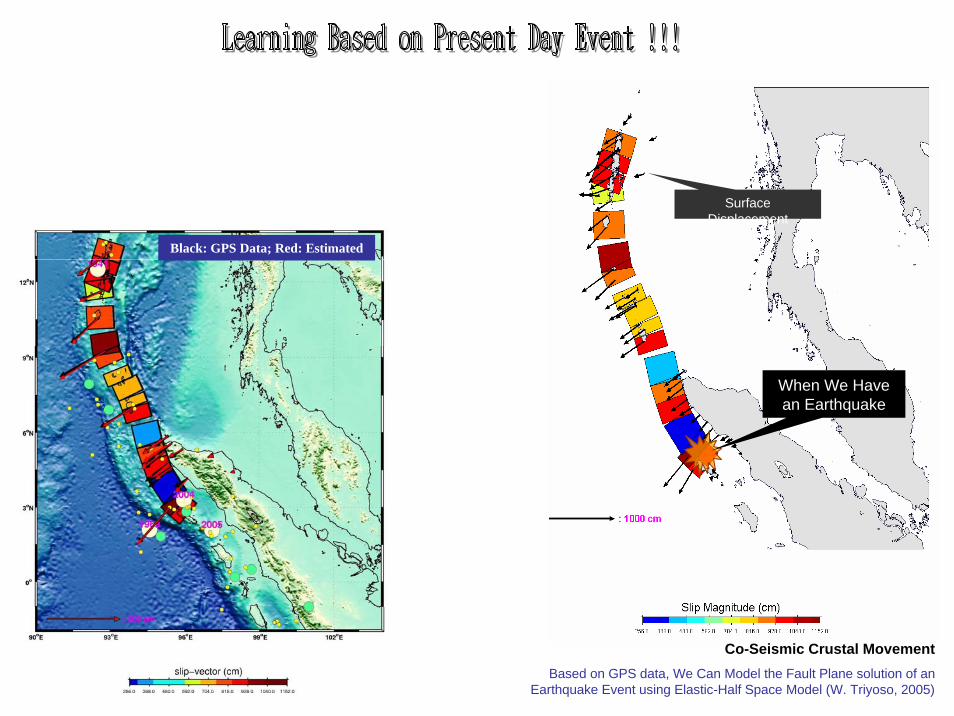
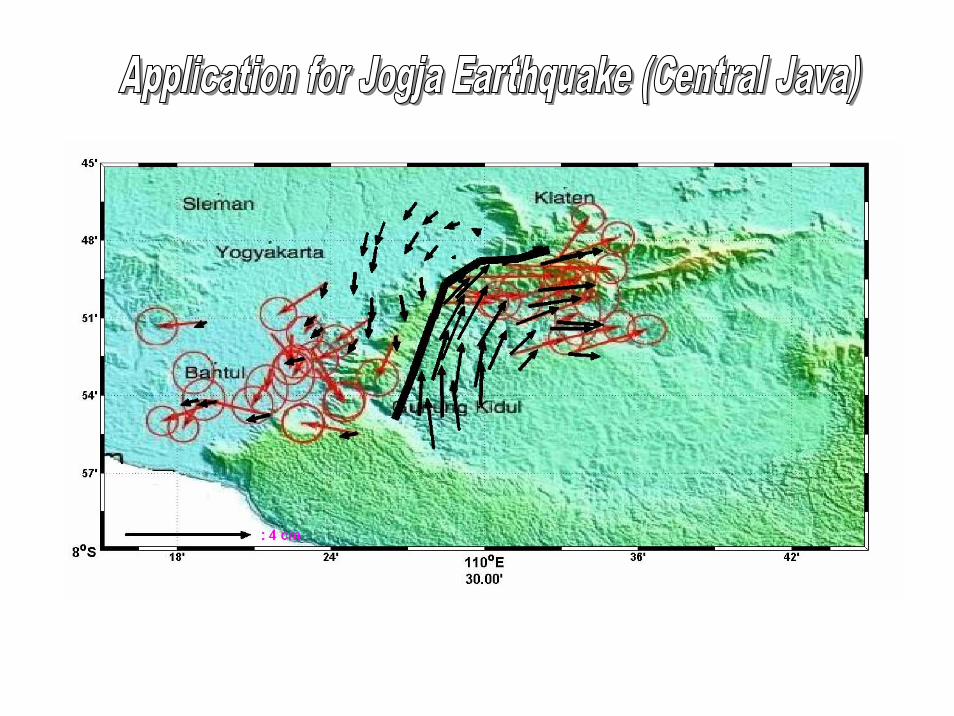
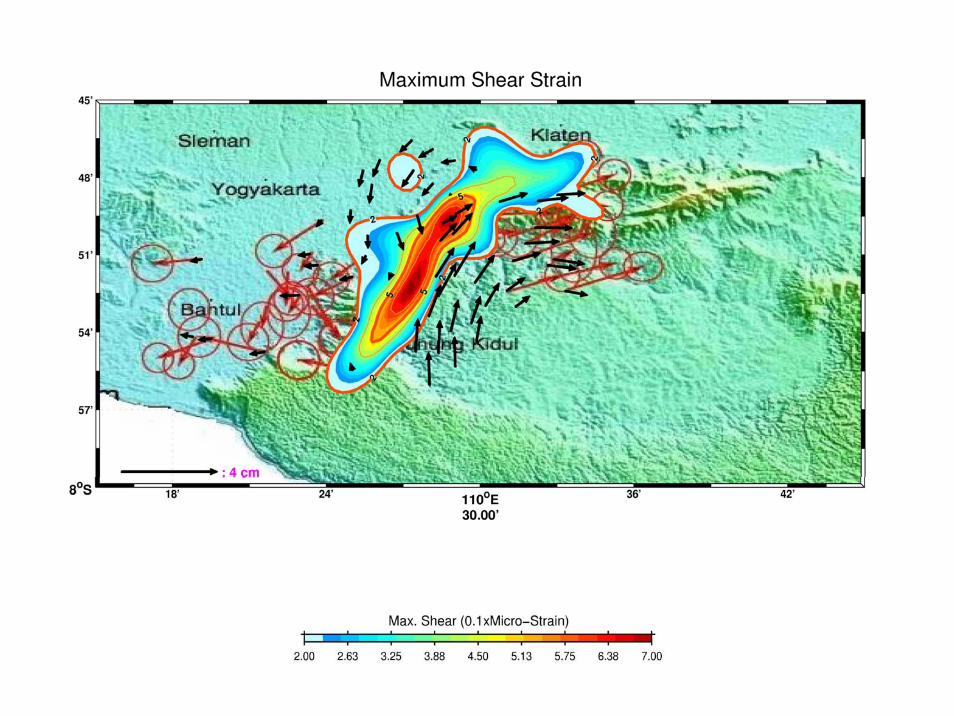
Surface Displacement
Co-Seismic Crustal MovementBased on GPS data, We Can Model the Fault Plane solution of an
Earthquake Event using Elastic-Half Space Model (W. Triyoso, 2005)
When We Have an Earthquake
Black: GPS Data; Red: Estimated
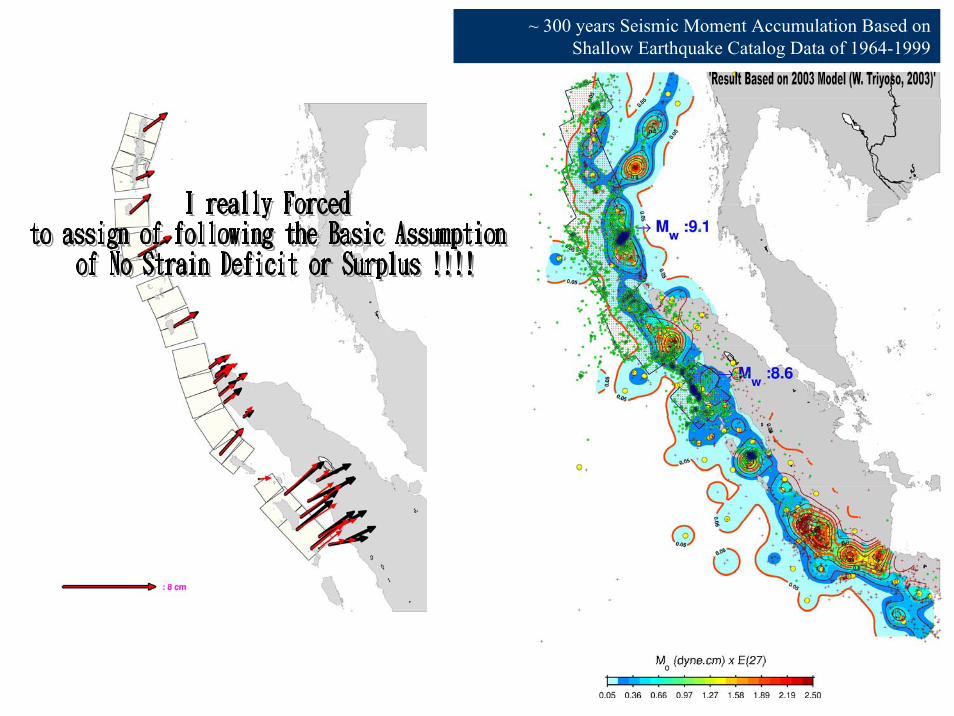
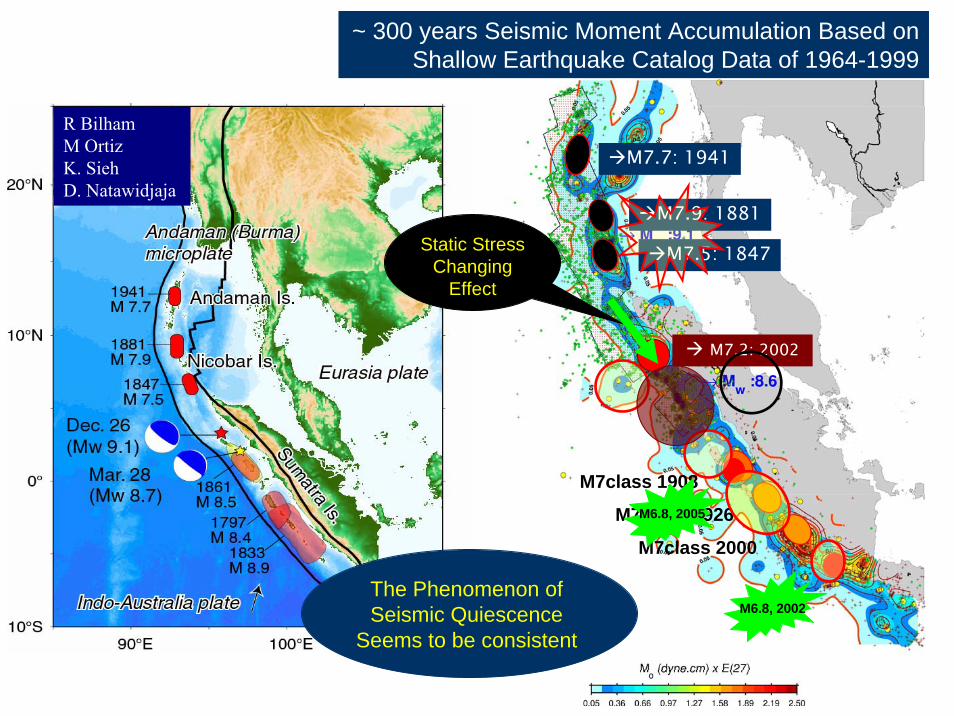
~ 300 years Seismic Moment Accumulation Based on Shallow Earthquake Catalog Data of 1964-1999
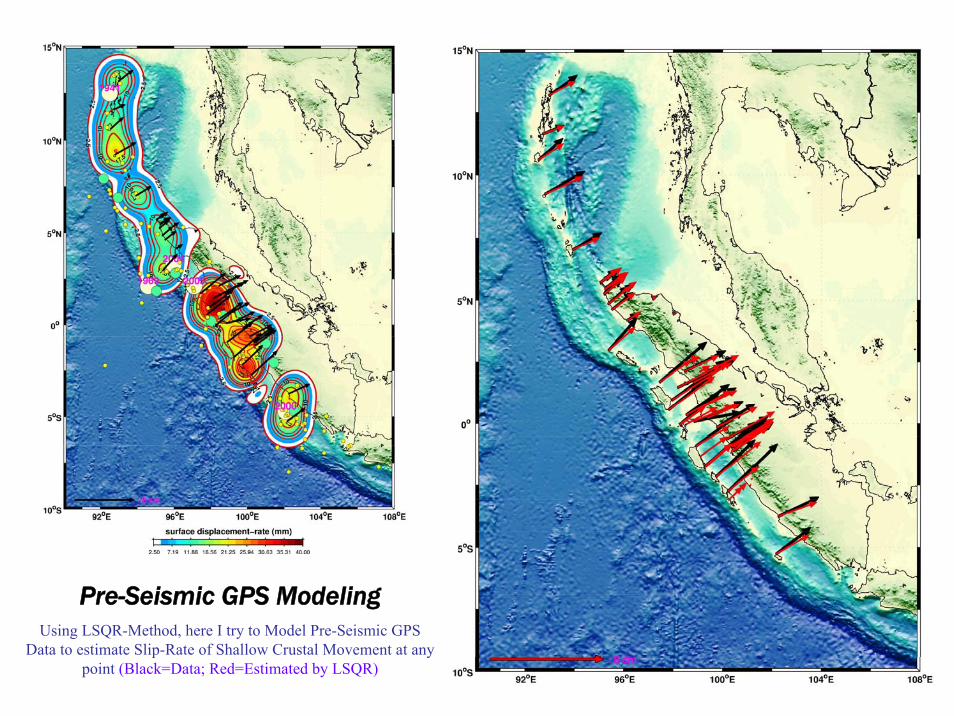
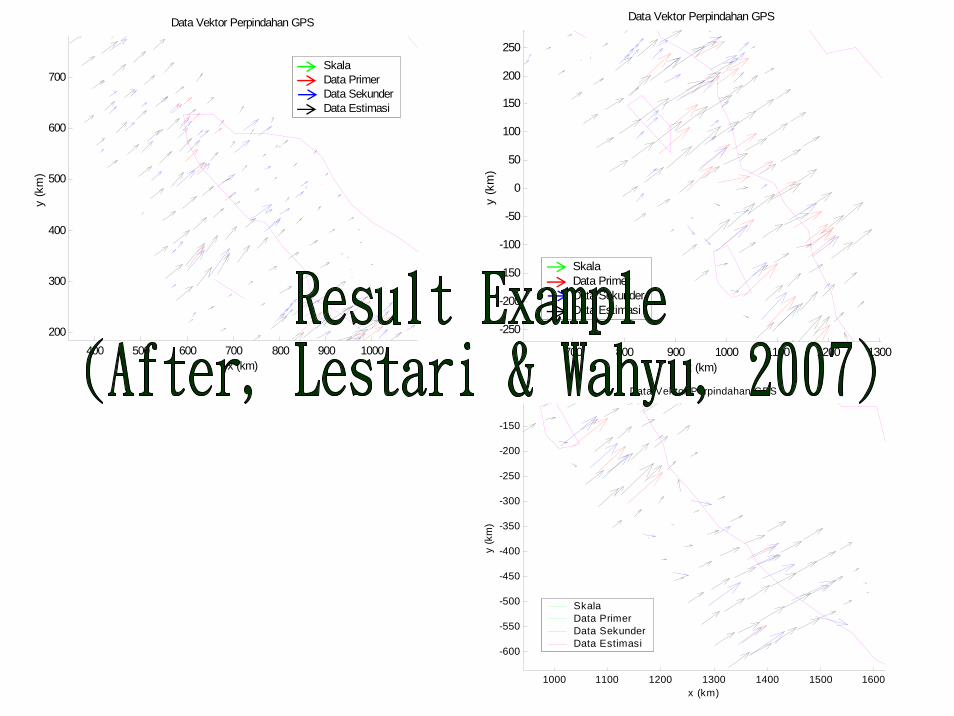
Pre-Seismic GPS ModelingUsing LSQR-Method, here I try to Model Pre-Seismic GPS
Data to estimate Slip-Rate of Shallow Crustal Movement at any point (Black=Data; Red=Estimated by LSQR)
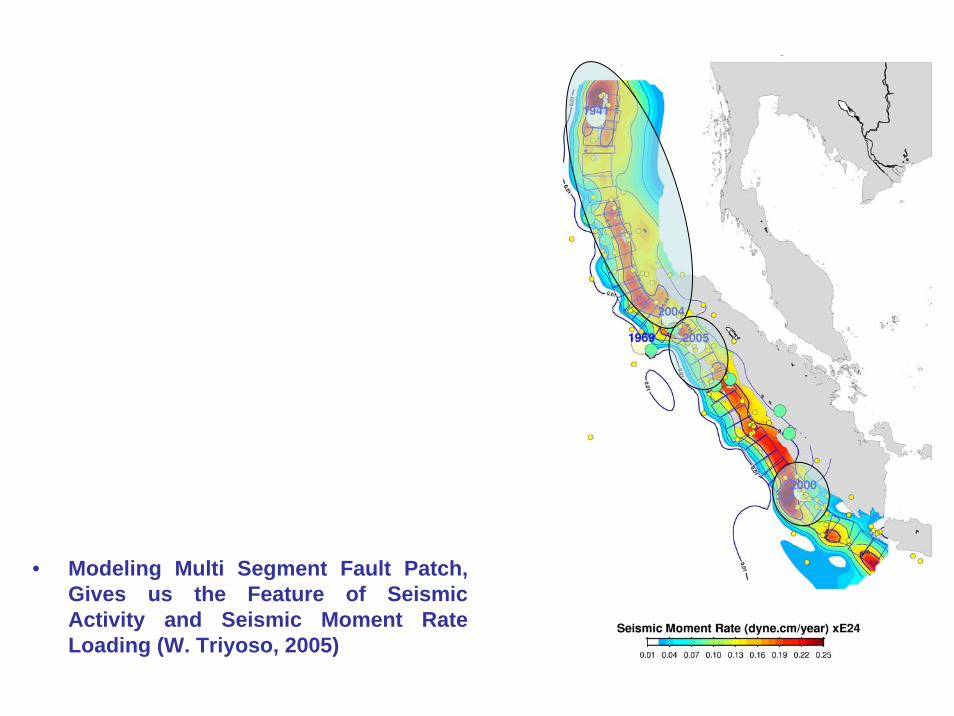
• Modeling Multi Segment Fault Patch, Gives us the Feature of Seismic Activity and Seismic Moment Rate Loading (W. Triyoso, 2005)
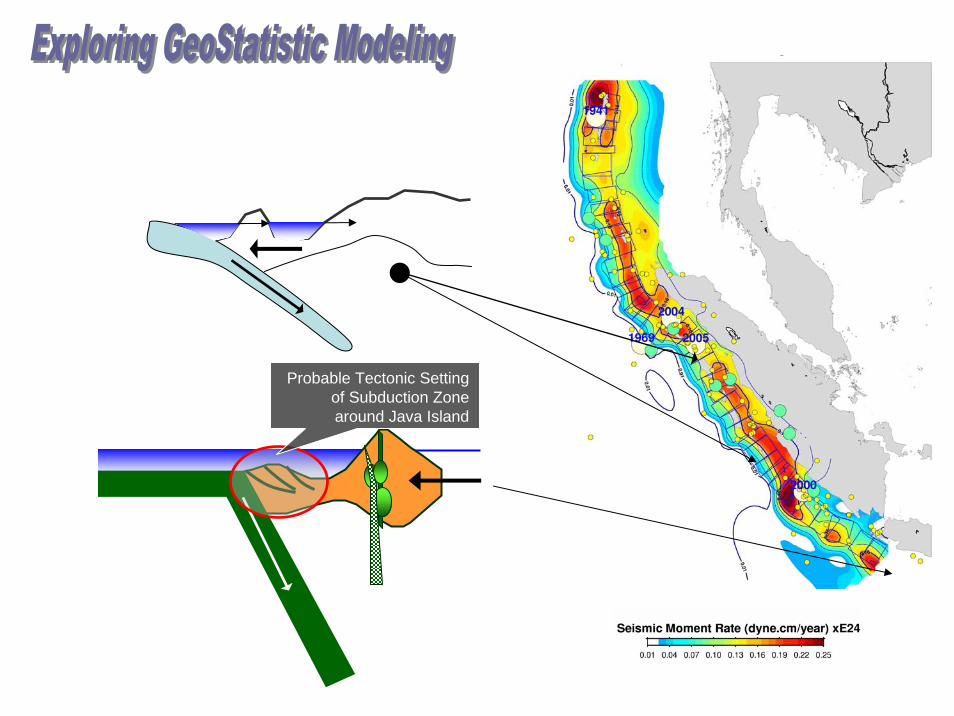
Probable Tectonic Setting of Subduction Zone around Java Island
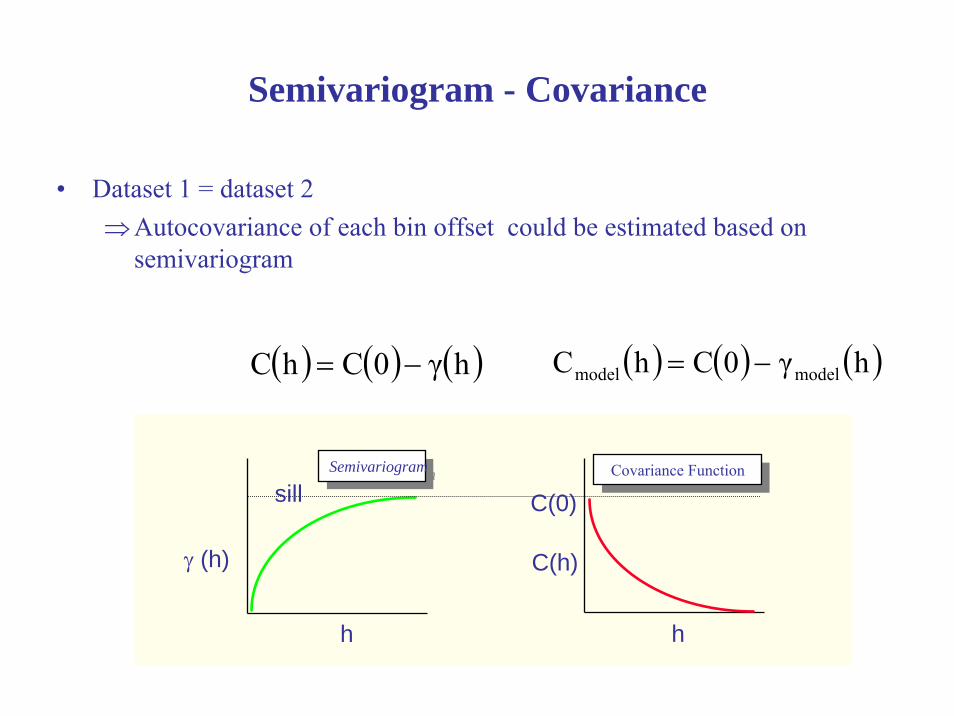
Semivariogram - Covariance
• Dataset 1 = dataset 2⇒Autocovariance of each bin offset could be estimated based on
semivariogram
( ) ( ) ( )hγ0ChC −= ( ) ( ) ( )hγ0ChC modelmodel −=
h h
C(h)γ (h)
SemivariogramSemivariogramCovariance FunctionCovariance Function
C(0)sill
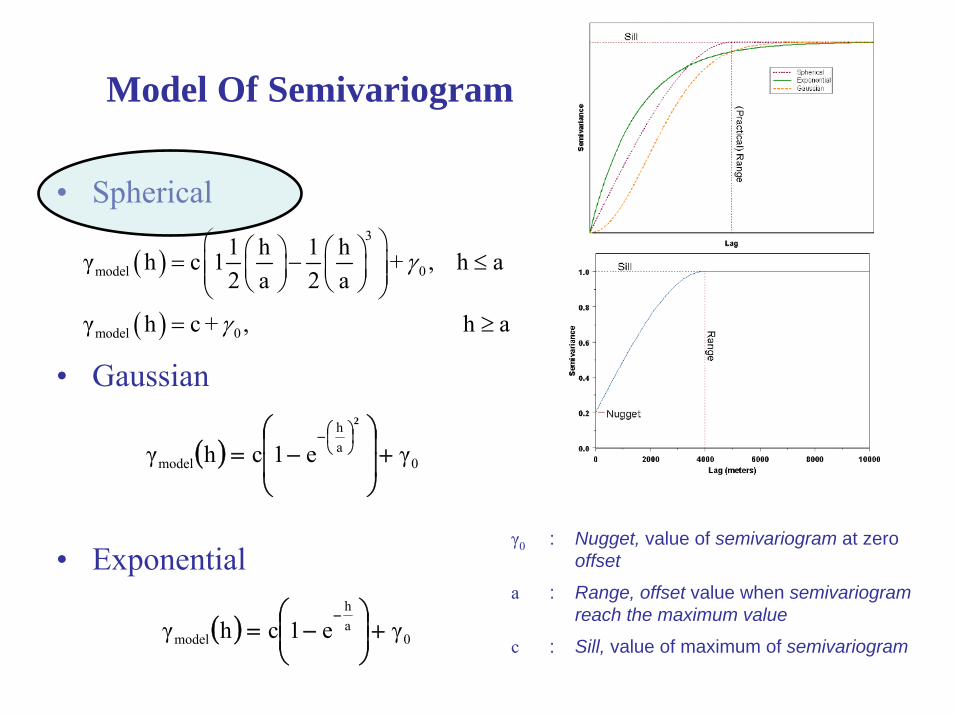
Model Of Semivariogram
• Spherical
• Gaussian
• Exponential
( )
( )
3
model 0
model 0
1 h 1 hγ h c 1 + , h a2 a 2 a
γ h c + , h a
γ
γ
⎛ ⎞⎛ ⎞ ⎛ ⎞= − ≤⎜ ⎟⎜ ⎟ ⎜ ⎟⎜ ⎟⎝ ⎠ ⎝ ⎠⎝ ⎠= ≥
( ) 0ah
model γe1chγ +⎟⎟
⎠
⎞
⎜⎜
⎝
⎛−=
⎟⎠⎞
⎜⎝⎛−
2
( ) 0ah
model γe1chγ +⎟⎟⎠
⎞⎜⎜⎝
⎛−=
−
γ0 : Nugget, value of semivariogram at zero offset
a : Range, offset value when semivariogram reach the maximum value
c : Sill, value of maximum of semivariogram
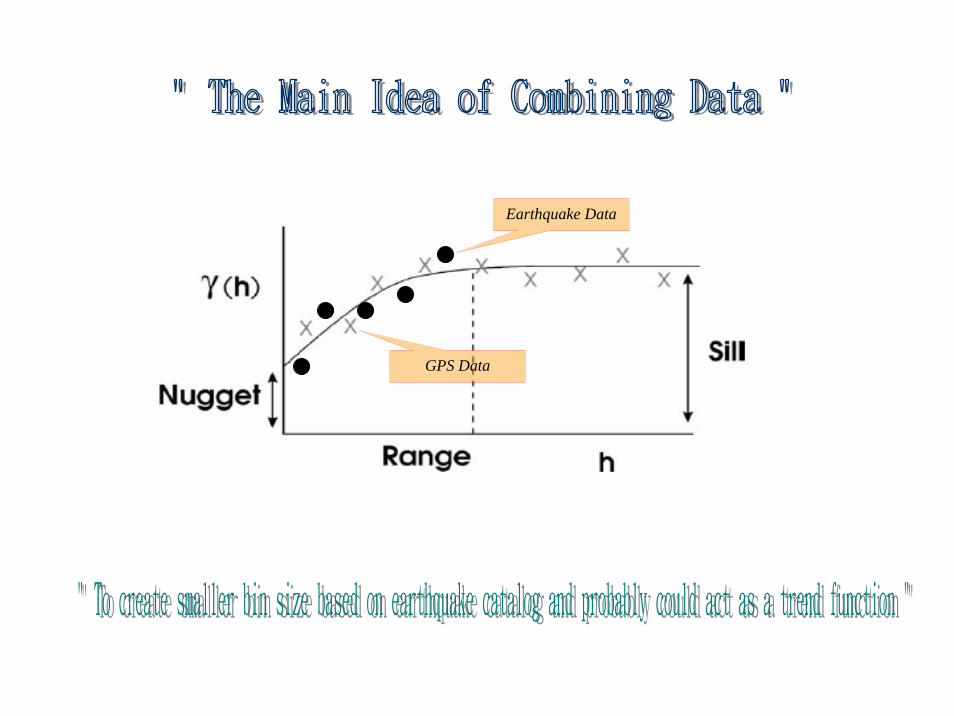
GPS Data
Earthquake Data
400 500 600 700 800 900 1000200
300
400
500
600
700
Data Vektor Perpindahan GPS
x (km)
y (k
m)
Skala Data Primer Data SekunderData Estimasi
700 800 900 1000 1100 1200 1300
-250
-200
-150
-100
-50
0
50
100
150
200
250
Data Vektor Perpindahan GPS
x (km)
y (k
m)
Skala Data Primer Data SekunderData Estimasi
1000 1100 1200 1300 1400 1500 1600
-600
-550
-500
-450
-400
-350
-300
-250
-200
-150
Data Vektor Perpindahan GPS
x (km)
y (k
m)
Skala Data Primer Data SekunderData Estimasi
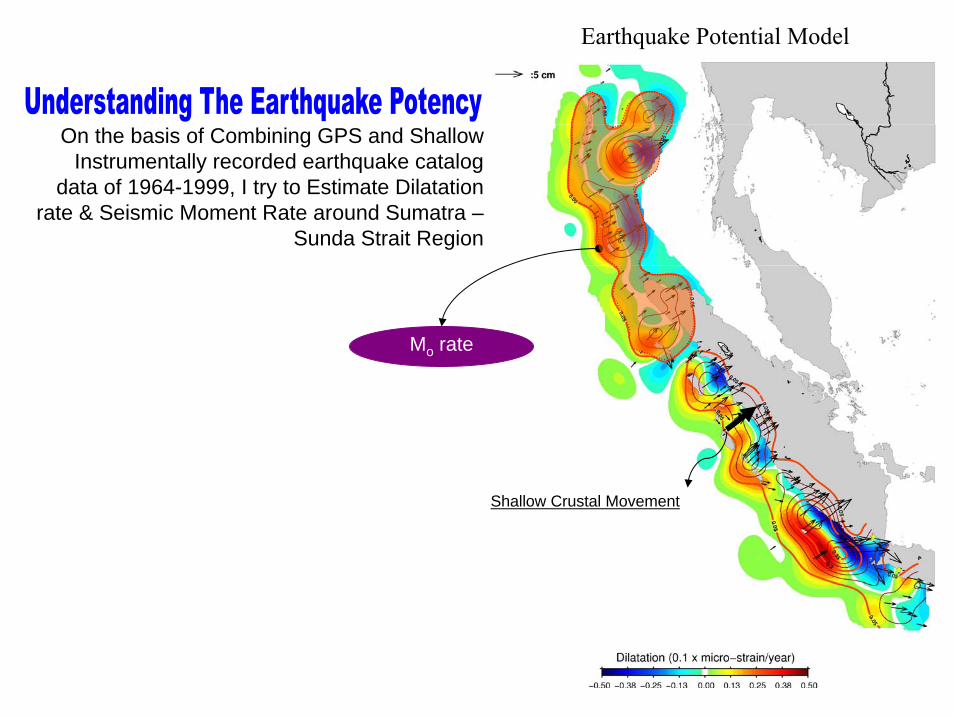
On the basis of Combining GPS and Shallow Instrumentally recorded earthquake catalog
data of 1964-1999, I try to Estimate Dilatation rate & Seismic Moment Rate around Sumatra –
Sunda Strait Region
Shallow Crustal Movement
Mo rate
Earthquake Potential Model
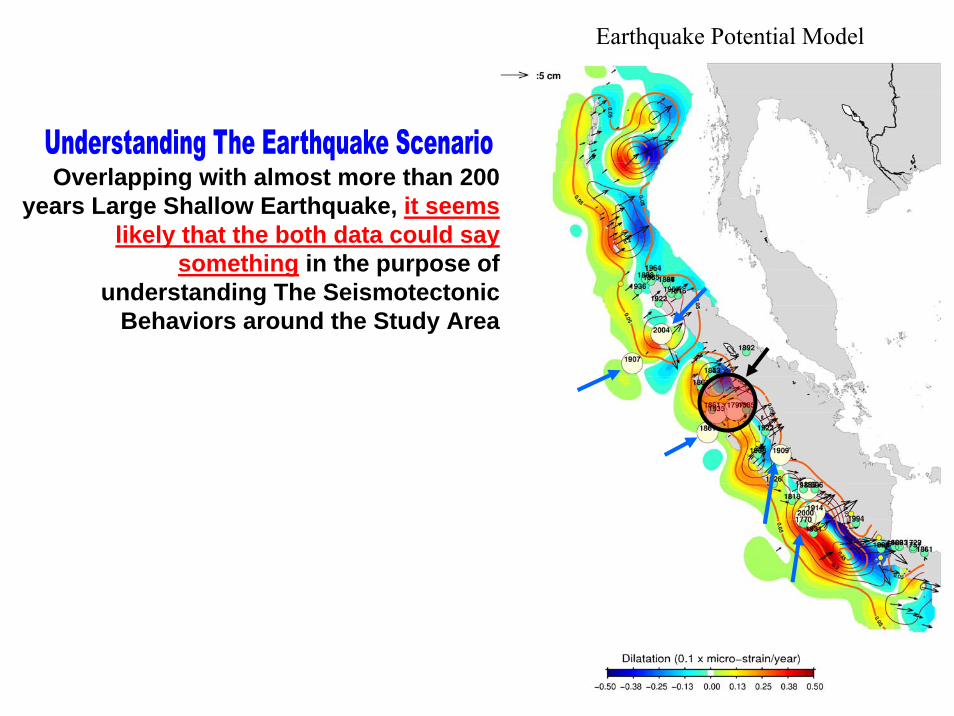
Overlapping with almost more than 200 years Large Shallow Earthquake, it seems
likely that the both data could say something in the purpose of
understanding The SeismotectonicBehaviors around the Study Area
Earthquake Potential Model
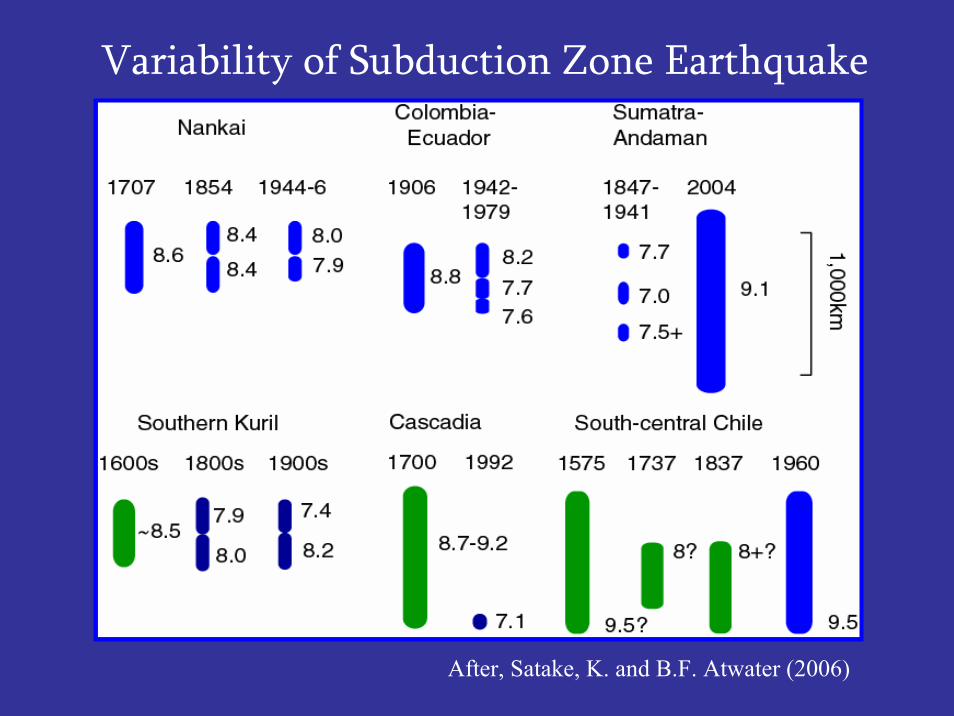
Variability of Subduction Zone Earthquake
After, Satake, K. and B.F. Atwater (2006)
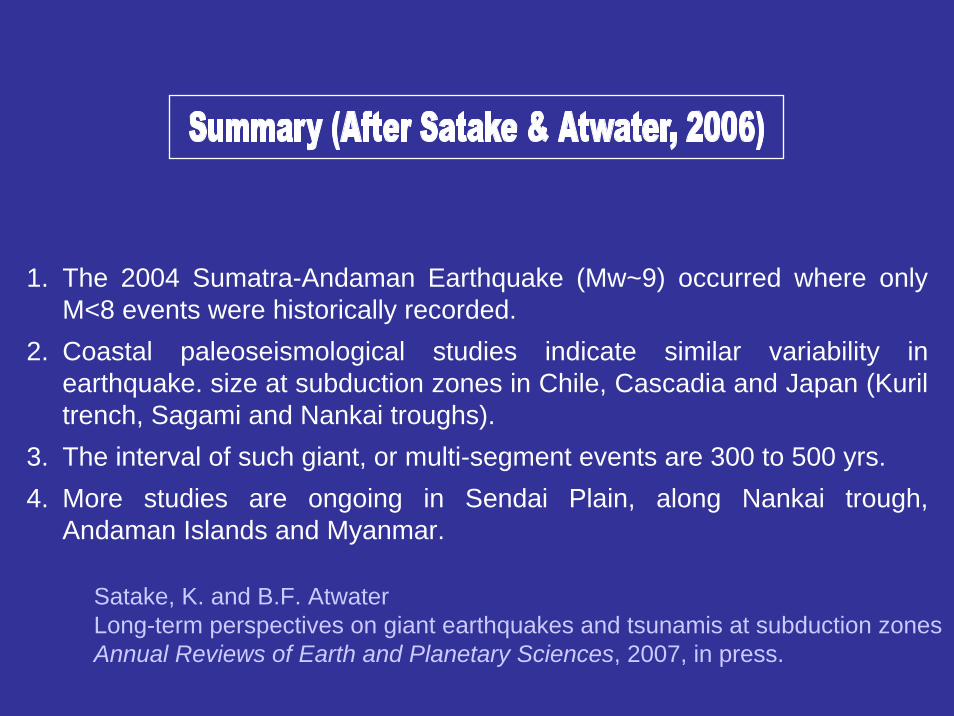
1. The 2004 Sumatra-Andaman Earthquake (Mw~9) occurred where only M<8 events were historically recorded.
2. Coastal paleoseismological studies indicate similar variability in earthquake. size at subduction zones in Chile, Cascadia and Japan (Kuril trench, Sagami and Nankai troughs).
3. The interval of such giant, or multi-segment events are 300 to 500 yrs.4. More studies are ongoing in Sendai Plain, along Nankai trough,
Andaman Islands and Myanmar.
Satake, K. and B.F. AtwaterLong-term perspectives on giant earthquakes and tsunamis at subduction zonesAnnual Reviews of Earth and Planetary Sciences, 2007, in press.

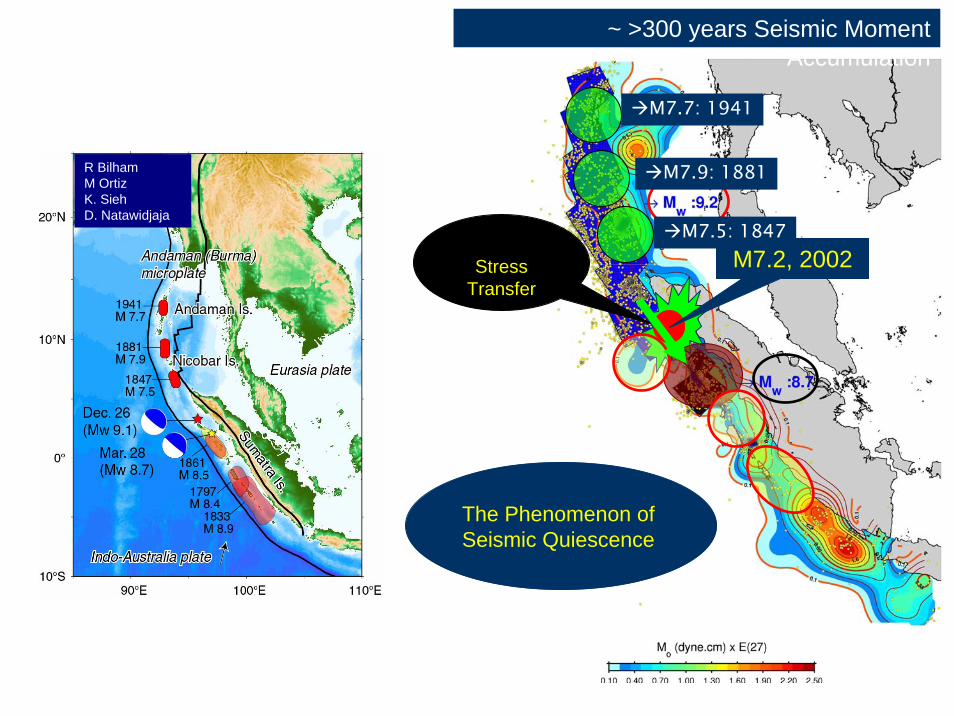
M7.2, 2002
The Phenomenon of Seismic Quiescence
M7.5: 1847
M7.9: 1881
M7.7: 1941
R BilhamM OrtizK. SiehD. Natawidjaja
~ >300 years Seismic Moment Accumulation
Stress Transfer
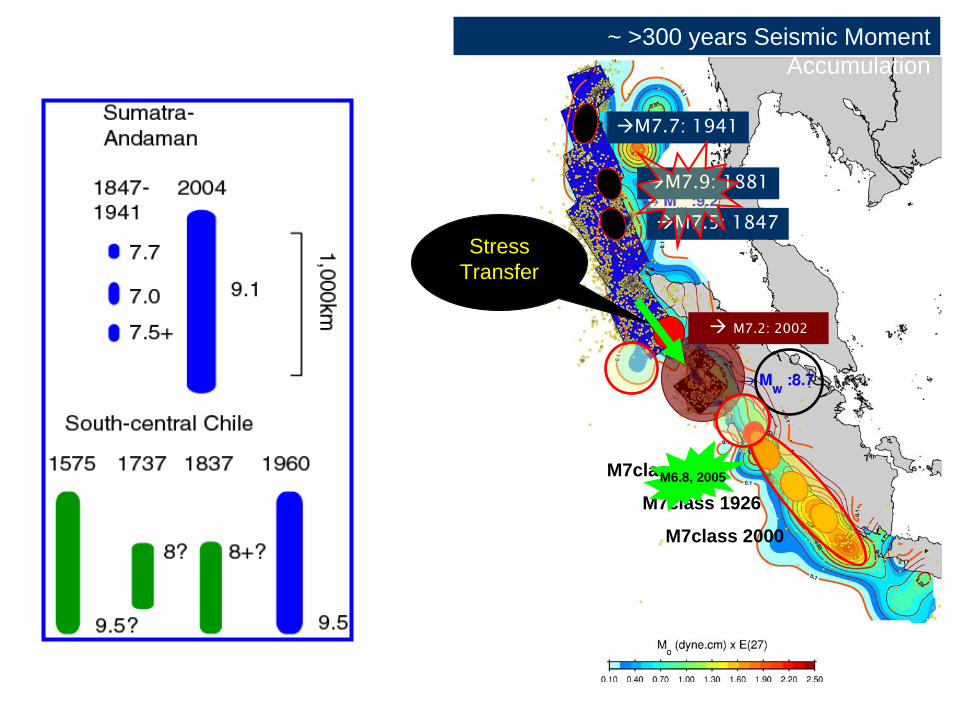
~ >300 years Seismic Moment Accumulation
M7.5: 1847
M7.9: 1881
M7.7: 1941
M7.2: 2002
M7class 1908
M7class 1926
M7class 2000
M6.8, 2005
Stress Transfer
~ 300 years Seismic Moment Accumulation Based on Shallow Earthquake Catalog Data of 1964-1999
R BilhamM OrtizK. SiehD. Natawidjaja
M7.5: 1847
M7.9: 1881
M7.7: 1941
M7.2: 2002
M7class 1908
M7class 1926
M7class 2000
M6.8, 2002
M6.8, 2005
The Phenomenon of Seismic Quiescence
Seems to be consistent
Static Stress Changing
Effect
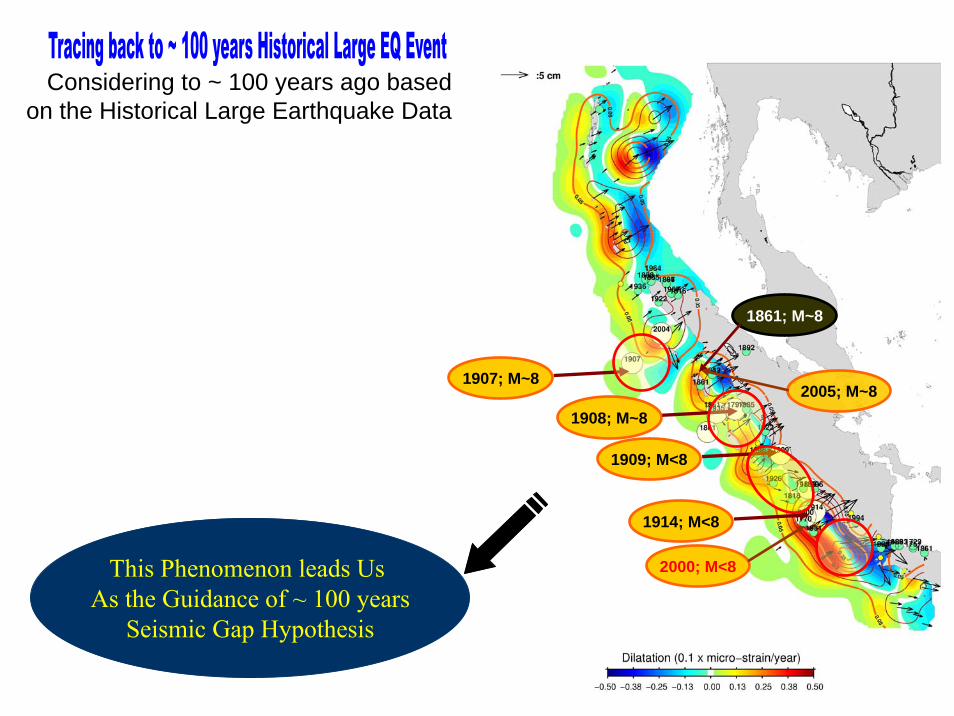
Considering to ~ 100 years ago based on the Historical Large Earthquake Data
1907; M~8
1908; M~8
1909; M<8
1914; M<8
1861; M~8
2005; M~8
2000; M<8This Phenomenon leads Us As the Guidance of ~ 100 years
Seismic Gap Hypothesis

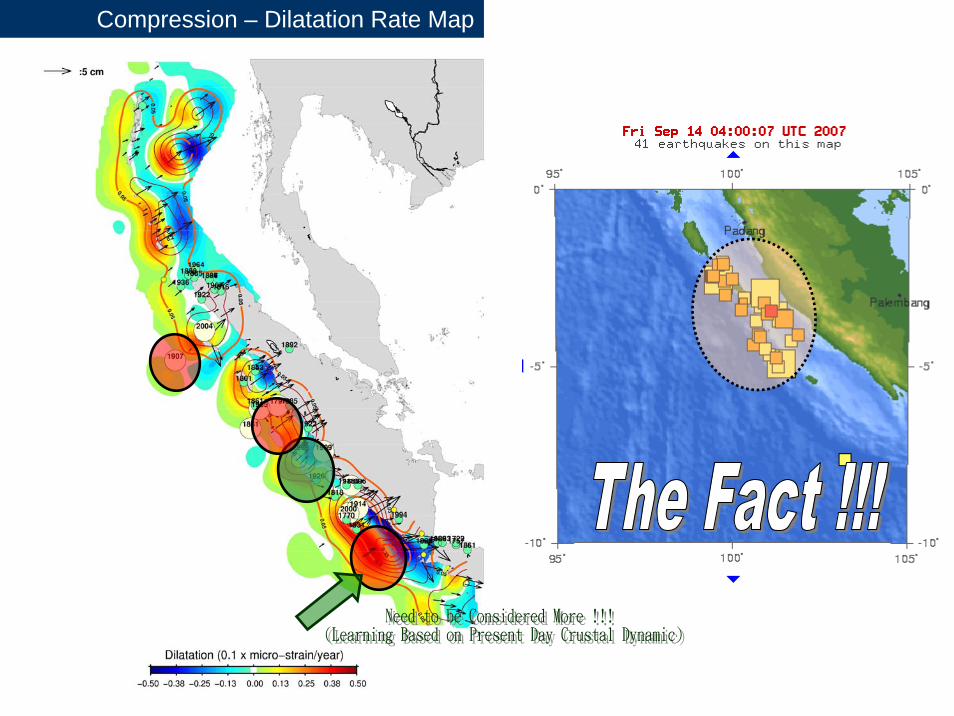
Compression – Dilatation Rate Map

My Understanding about Crustal Dynamic seems to be Changed!!!
After Strain Released, There is something really hiding… It is about Healing Process Of Fault In Crustal Volume!!!. The Geological Evidence, Perhaps Give
Us An Understanding of The Existence Based on Historical Asperity But Scenario and The Series in term of Mechanism Of Strain Released is Perhaps
Evolve with State & Time.
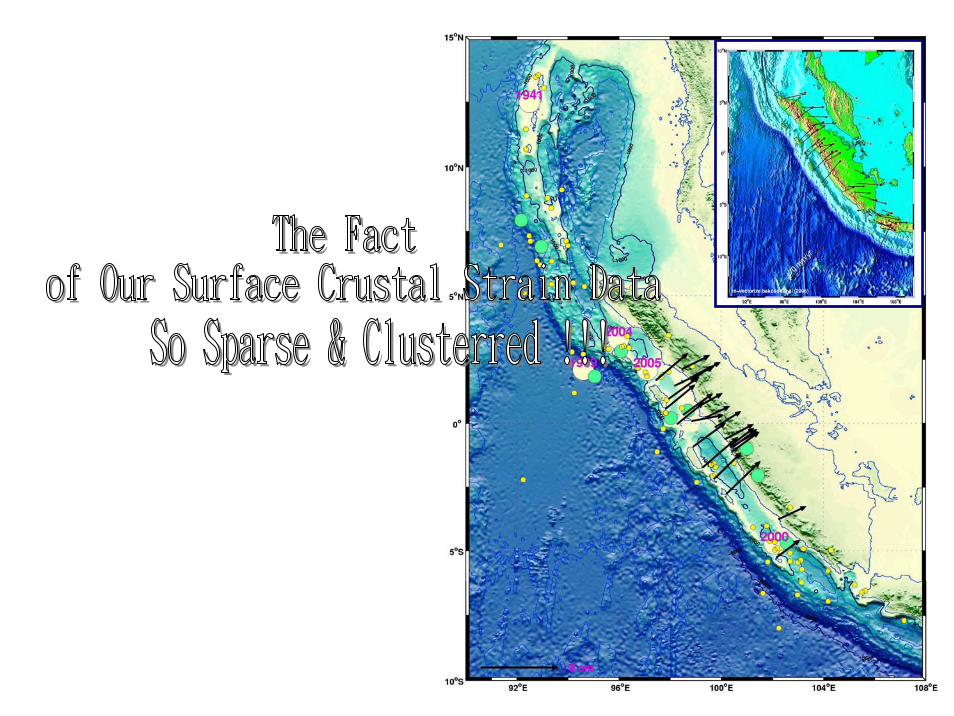
From This Basis, We really Need to Record Surface Crustal Strain Continuously, … Do not ever STOP Monitoring ……
First proposal of joint research project
We will retrieve historical seismograms in Off Coast Sumatra Island.
We will carry out source process inversions for the slip distributions using them as well as teleseismic, geodetic and tsunami data.
If we can rely on this hypothesis, it is very important to study the slip distributions of past plate-boundary
earthquakes.
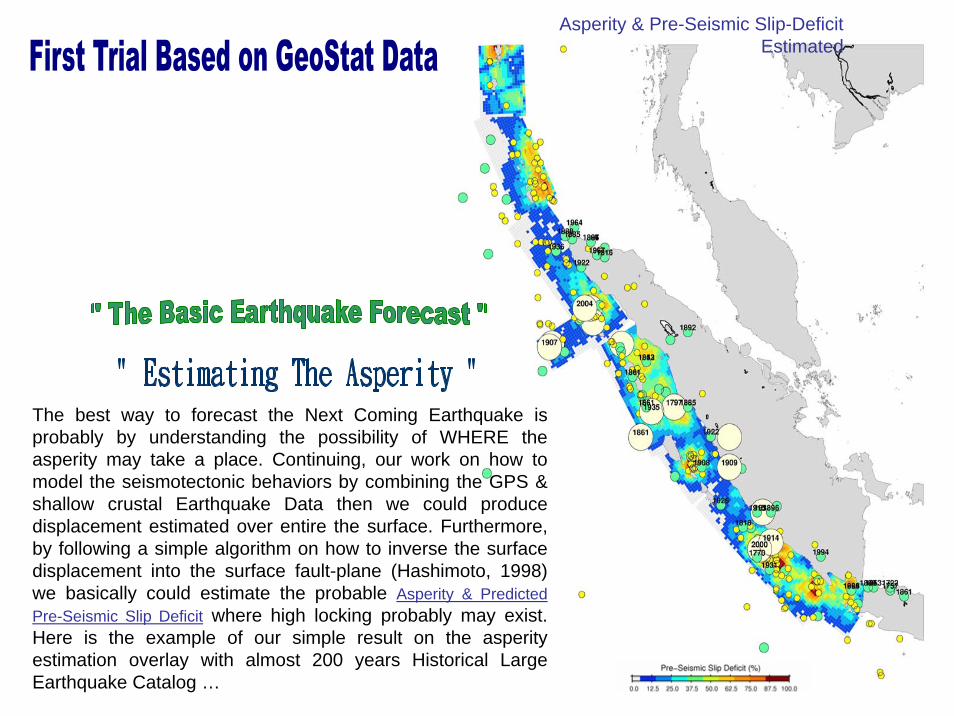
Asperity & Pre-Seismic Slip-Deficit Estimated
The best way to forecast the Next Coming Earthquake is probably by understanding the possibility of WHERE the asperity may take a place. Continuing, our work on how to model the seismotectonic behaviors by combining the GPS & shallow crustal Earthquake Data then we could produce displacement estimated over entire the surface. Furthermore, by following a simple algorithm on how to inverse the surface displacement into the surface fault-plane (Hashimoto, 1998) we basically could estimate the probable Asperity & Predicted Pre-Seismic Slip Deficit where high locking probably may exist. Here is the example of our simple result on the asperity estimation overlay with almost 200 years Historical Large Earthquake Catalog …
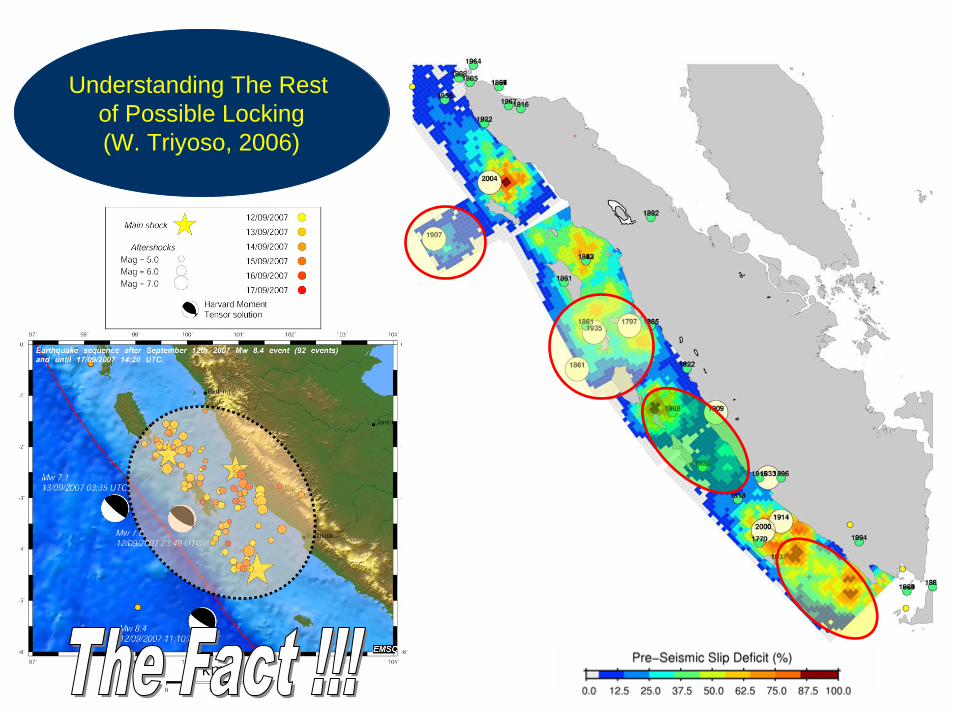
Understanding The Rest of Possible Locking(W. Triyoso, 2006)
Proposal to LIPI in support of an application for a research permitProject Title: Seismicity and deep structure of the Sumatra subduction zone
Proposer: Dr Frederik Tilmann (University of Cambridge)Bullard Laboratories
University of CambridgeMadingley Road
Cambridge CB3 0EZUnited Kingdom
Phone: +44 1223 765545, Fax: +44 1223 360779Email: [email protected]
Nationality: German DOB: 25th February 1972
Period of research: 2008/2009 (detailed dates to be determined)
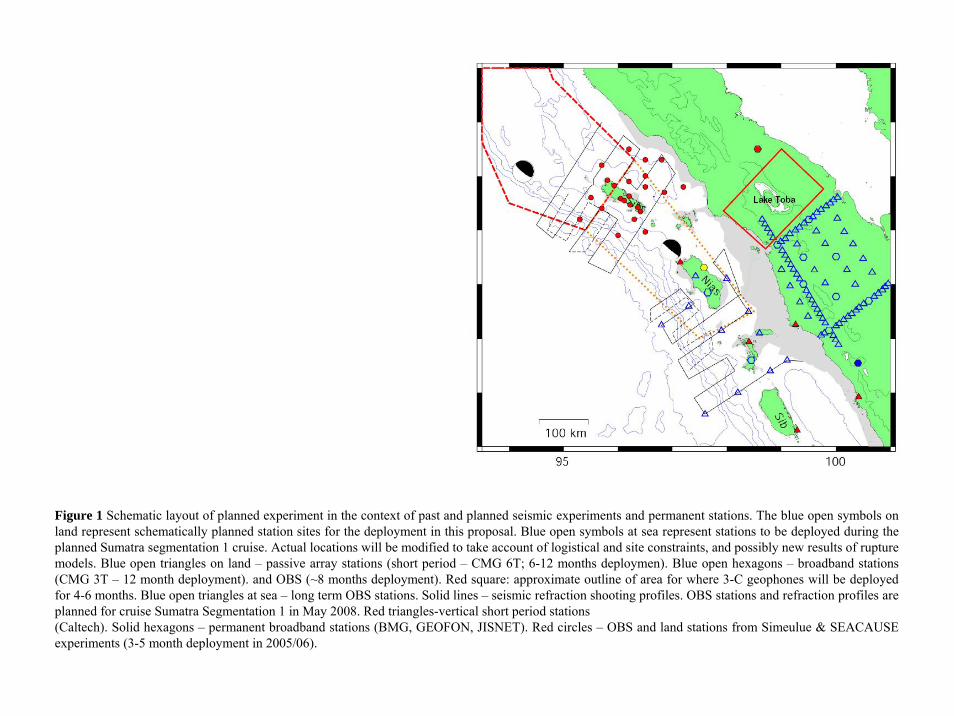
Figure 1 Schematic layout of planned experiment in the context of past and planned seismic experiments and permanent stations. The blue open symbols on land represent schematically planned station sites for the deployment in this proposal. Blue open symbols at sea represent stations to be deployed during the planned Sumatra segmentation 1 cruise. Actual locations will be modified to take account of logistical and site constraints, and possibly new results of rupture models. Blue open triangles on land – passive array stations (short period – CMG 6T; 6-12 months deploymen). Blue open hexagons – broadband stations (CMG 3T – 12 month deployment). and OBS (~8 months deployment). Red square: approximate outline of area for where 3-C geophones will be deployed for 4-6 months. Blue open triangles at sea – long term OBS stations. Solid lines – seismic refraction shooting profiles. OBS stations and refraction profiles are planned for cruise Sumatra Segmentation 1 in May 2008. Red triangles-vertical short period stations(Caltech). Solid hexagons – permanent broadband stations (BMG, GEOFON, JISNET). Red circles – OBS and land stations from Simeulue & SEACAUSE experiments (3-5 month deployment in 2005/06).
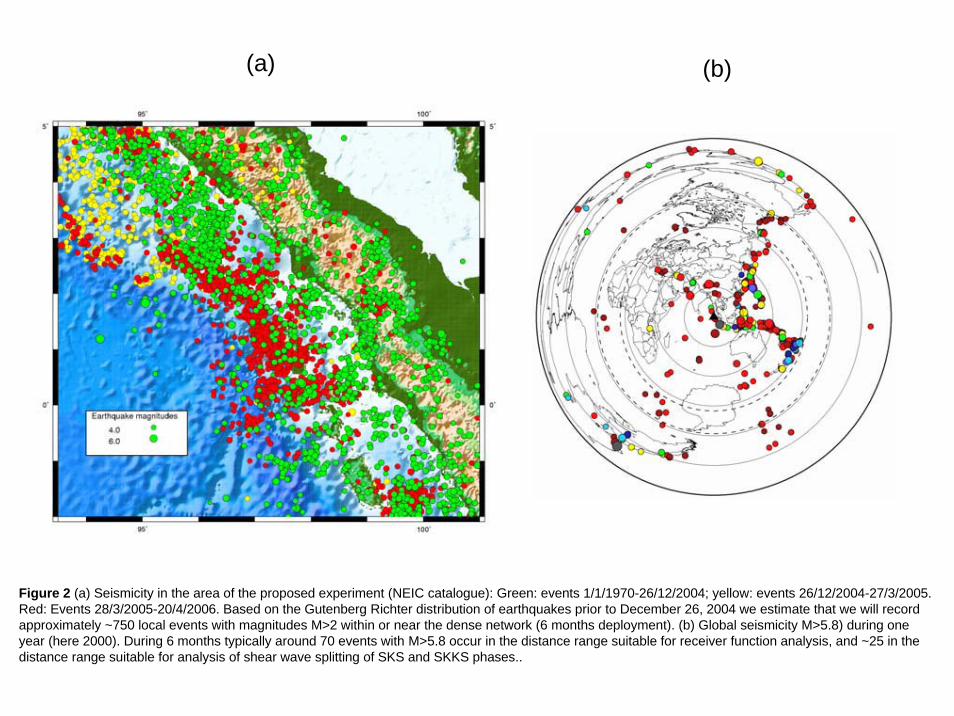
Figure 2 (a) Seismicity in the area of the proposed experiment (NEIC catalogue): Green: events 1/1/1970-26/12/2004; yellow: events 26/12/2004-27/3/2005. Red: Events 28/3/2005-20/4/2006. Based on the Gutenberg Richter distribution of earthquakes prior to December 26, 2004 we estimate that we will recordapproximately ~750 local events with magnitudes M>2 within or near the dense network (6 months deployment). (b) Global seismicity M>5.8) during one year (here 2000). During 6 months typically around 70 events with M>5.8 occur in the distance range suitable for receiver function analysis, and ~25 in the distance range suitable for analysis of shear wave splitting of SKS and SKKS phases..
(a) (b)
A Research Progress in Understanding The Earthquake Potency of The Whole Sunda Arc & Its
Implication to Probabilistic & Deterministic Earthquake Hazard (W. Triyoso, 2007)