Embed Size (px)
Citation preview
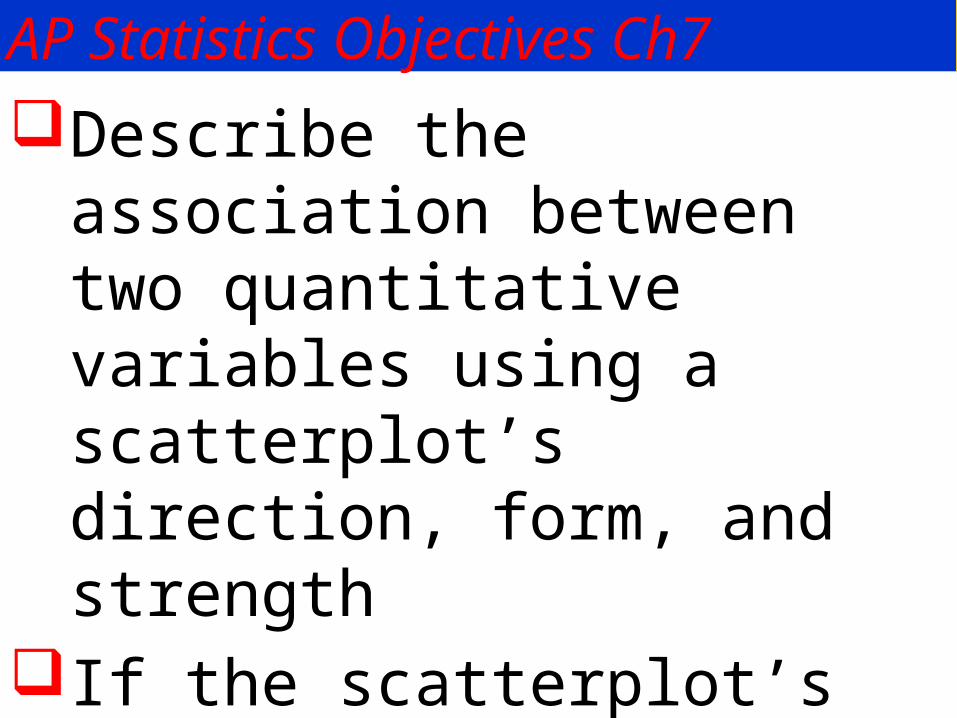
Describe the association between two quantitative variables using a scatterplot’s direction, form, and strength
If the scatterplot’s form is linear, use correlation to describe its direction and strength
AP Statistics Objectives Ch7
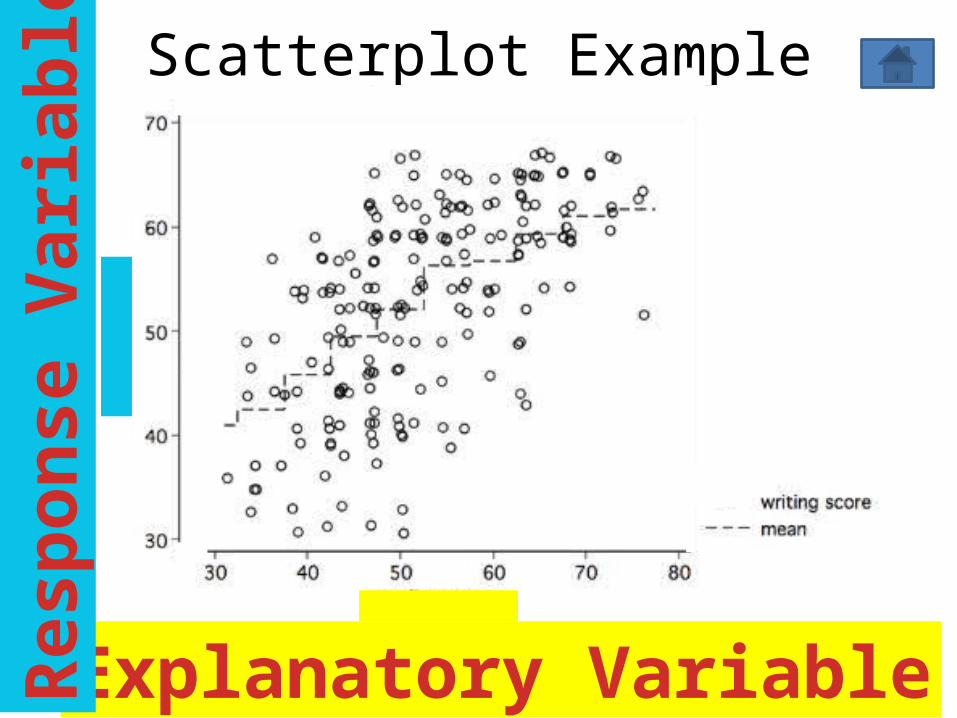
Scatterplot Association Direction OutlierExplanatory/Predictor VariableResponse variable
Vocabulary
Form Strength
CorrelationQuantitative ConditionStraight Enough ConditionOutlier Condition
Vocabulary
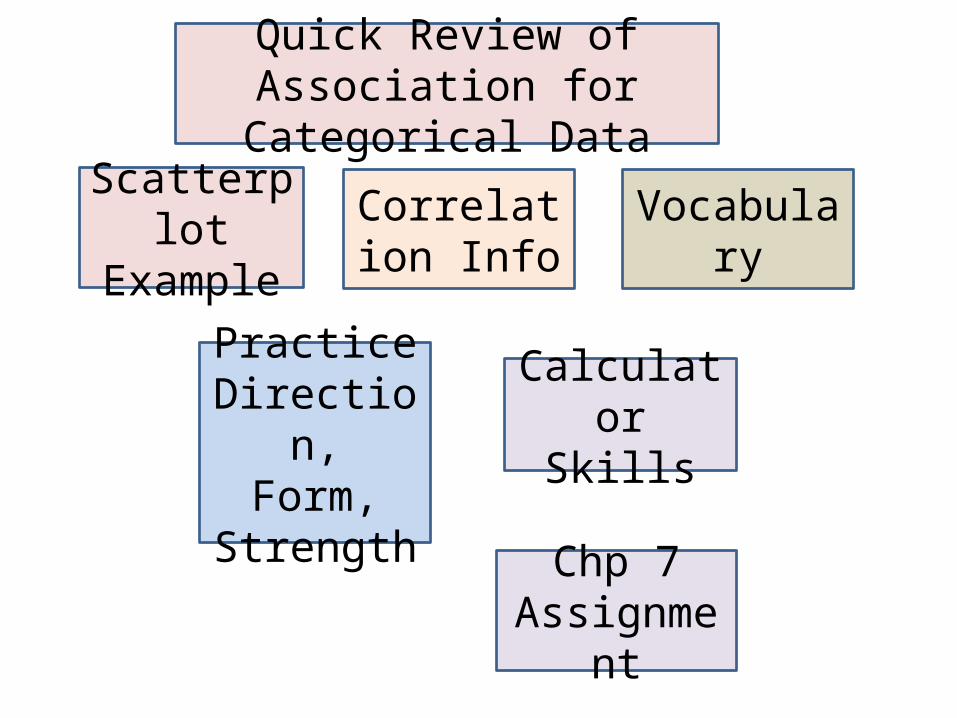
Scatterplot Example
Correlation Info Vocabulary
Chp 7 Assignment
Practice Direction,
Form,Strength
Quick Review of Association for Categorical Data
CalculatorSkills
Chapter 7 Assignment
Pages: 161-166 Problems: #6,12,24,29&30
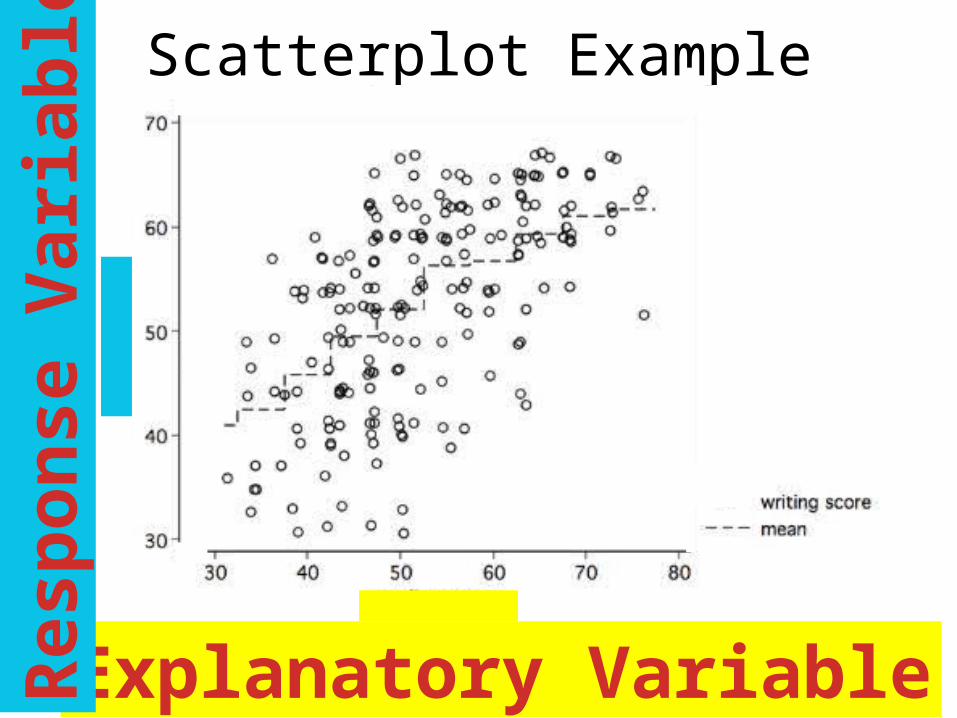
Scatterplot Example
Explanatory Variable
Resp
onse
Var
iabl
e
Scatterplot Example
Explanatory Variable
Resp
onse
Var
iabl
e
Chp 7 – Scatterplots, Association, and Correlation
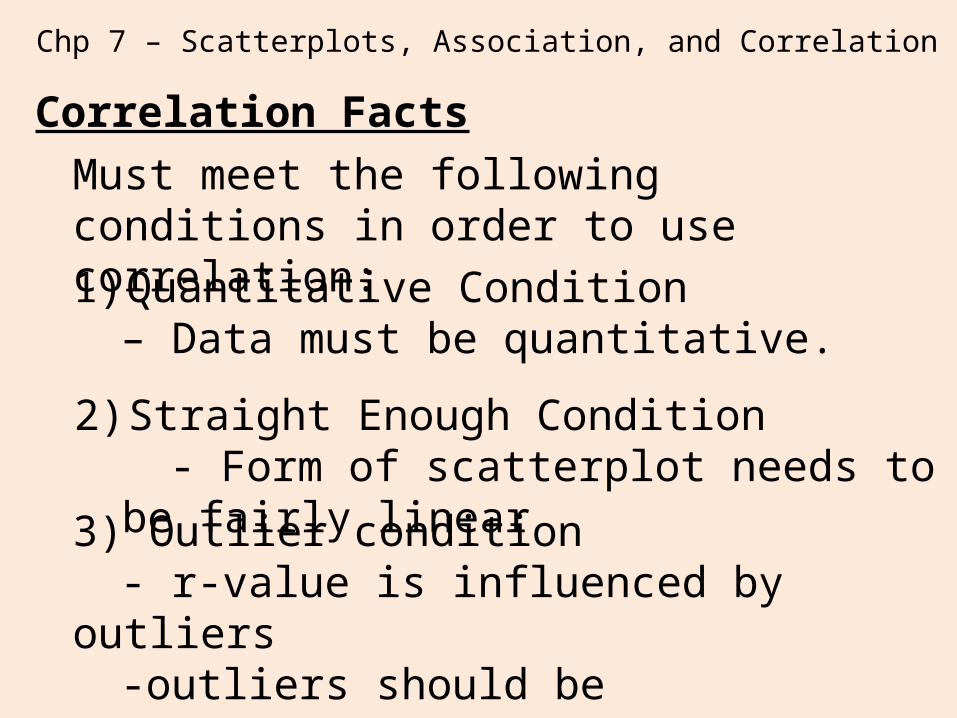
Correlation Facts
1) Quantitative Condition – Data must be quantitative.
2) Straight Enough Condition- Form of scatterplot needs to be fairly
linear3) Outlier condition- r-value is influenced by outliers-outliers should be investigated and
regression should be done w/ and w/o outliers
Must meet the following conditions in order to use correlation:
Chp 7 – Scatterplots, Association, and Correlation
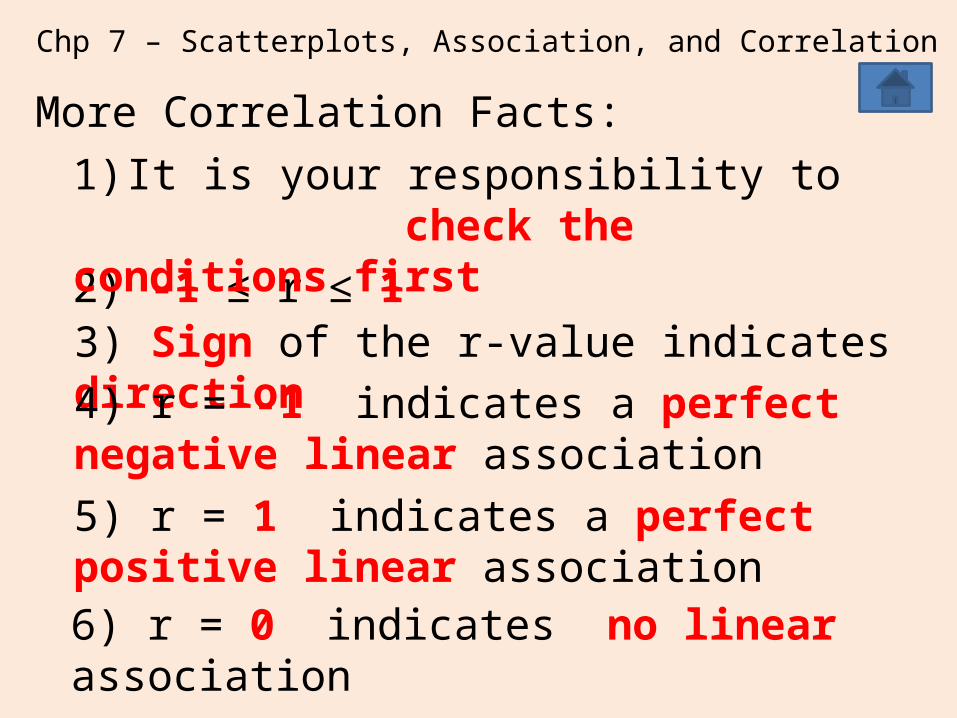
More Correlation Facts:
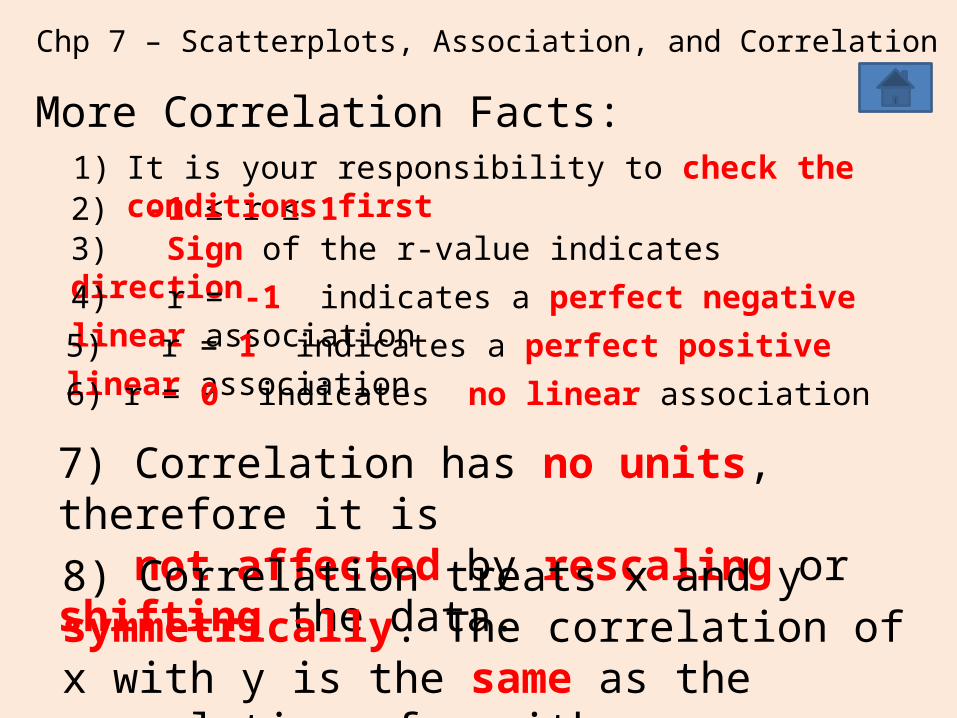
2) -1 ≤ r ≤ 13) Sign of the r-value indicates direction4) r = -1 indicates a perfect negative linear association 5) r = 1 indicates a perfect positive linear association6) r = 0 indicates no linear association
1) It is your responsibility to check the conditions first
Chp 7 – Scatterplots, Association, and Correlation
More Correlation Facts:
2) -1 ≤ r ≤ 13) Sign of the r-value indicates direction4) r = -1 indicates a perfect negative linear association 5) r = 1 indicates a perfect positive linear association6) r = 0 indicates no linear association
1) It is your responsibility to check the conditions first
7) Correlation has no units, therefore it is not affected by rescaling or shifting the data.8) Correlation treats x and y symmetrically. The correlation of x with y is the same as the correlation of y with x.
Chp 7 – Scatterplots, Association, and Correlation
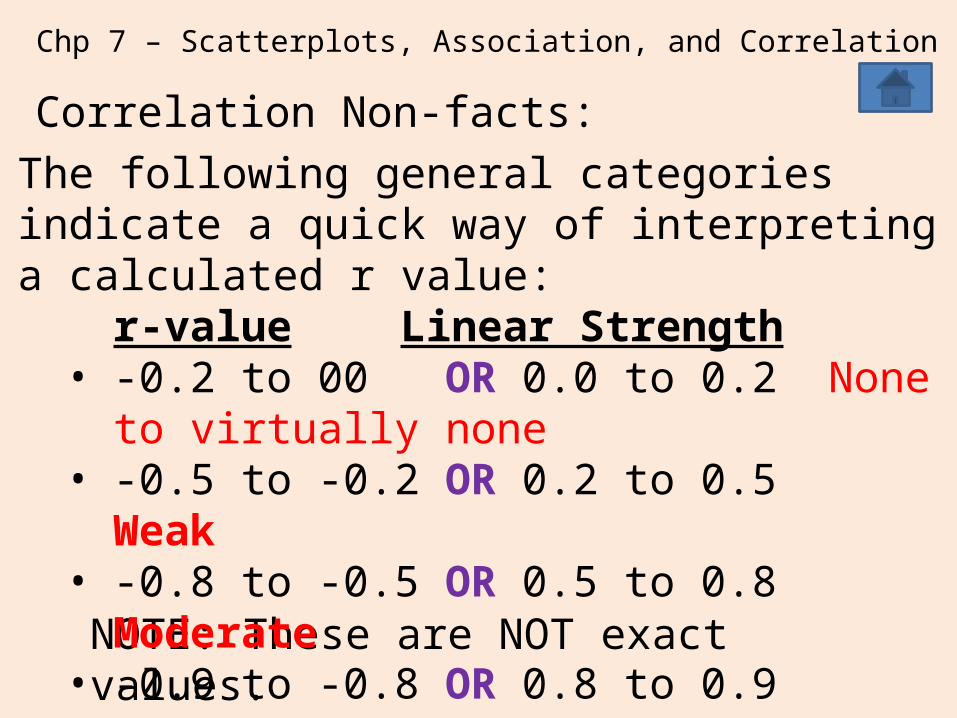
Correlation Non-facts:
NOTE: These are NOT exact values. Only gauges to help you start.
The following general categories indicate a quick way of interpreting a calculated r value:
r-value Linear Strength• -0.2 to 00 OR 0.0 to 0.2 None to virtually none • -0.5 to -0.2 OR 0.2 to 0.5 Weak• -0.8 to -0.5 OR 0.5 to 0.8 Moderate • -0.9 to -0.8 OR 0.8 to 0.9 Strong• -1.0 to -0.9 OR 0.9 to 1.0 Very strong• Exactly -1 OR Exactly +1 Perfect
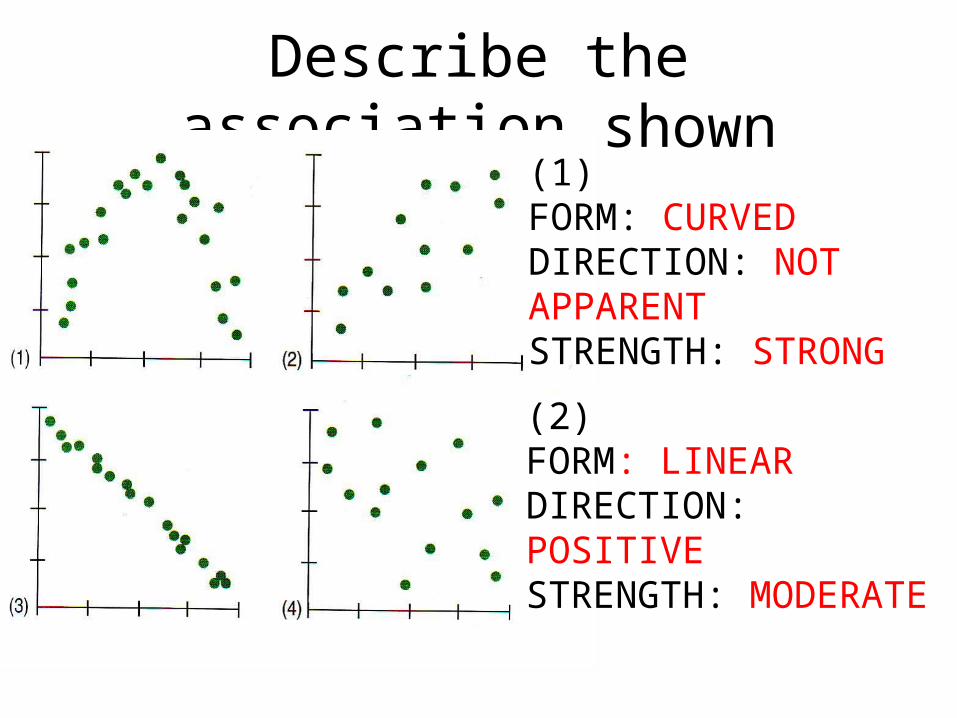
Describe the association shown(1)FORM: CURVEDDIRECTION: NOT APPARENTSTRENGTH: STRONG
(2)FORM: LINEARDIRECTION: POSITIVESTRENGTH: MODERATE
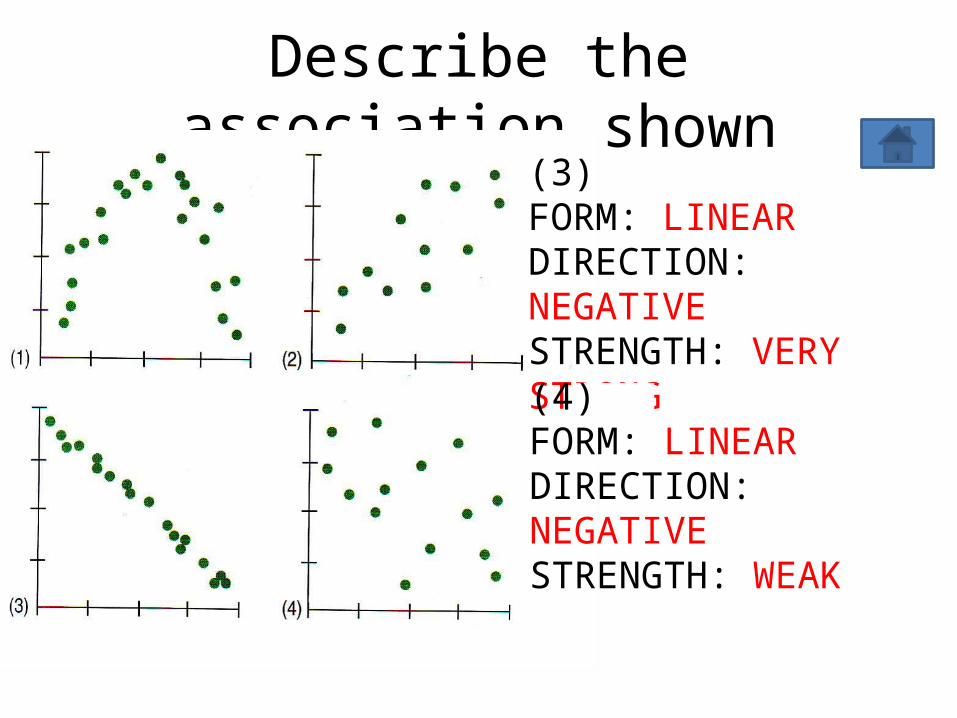
Describe the association shown(3)FORM: LINEARDIRECTION: NEGATIVESTRENGTH: VERY STRONG
(4)FORM: LINEARDIRECTION: NEGATIVESTRENGTH: WEAK
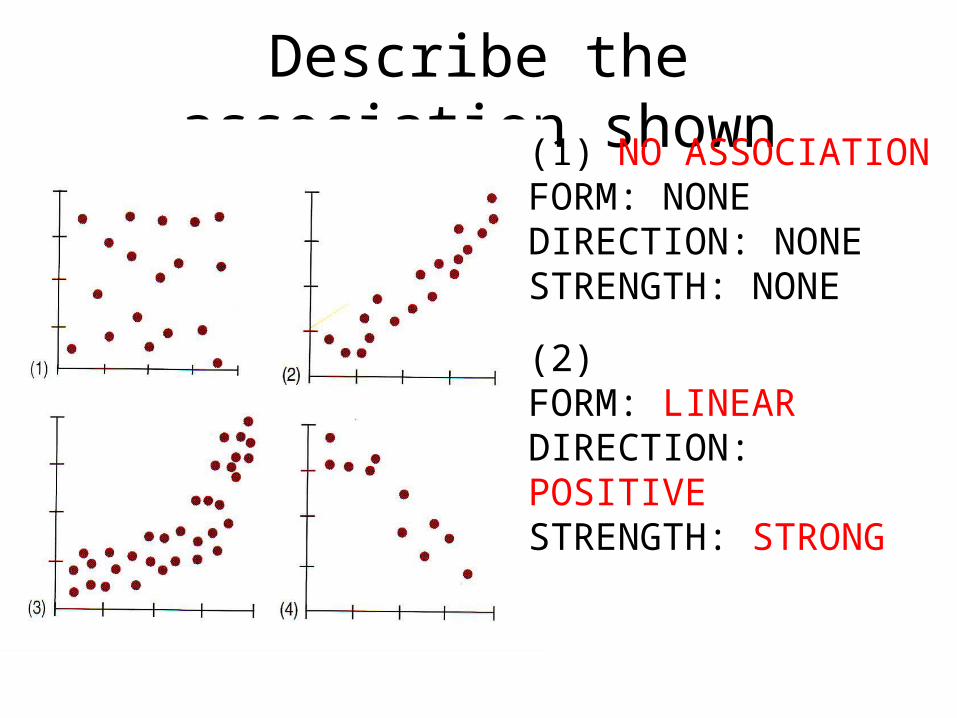
Describe the association shown(1) NO ASSOCIATIONFORM: NONEDIRECTION: NONESTRENGTH: NONE
(2) FORM: LINEARDIRECTION: POSITIVESTRENGTH: STRONG
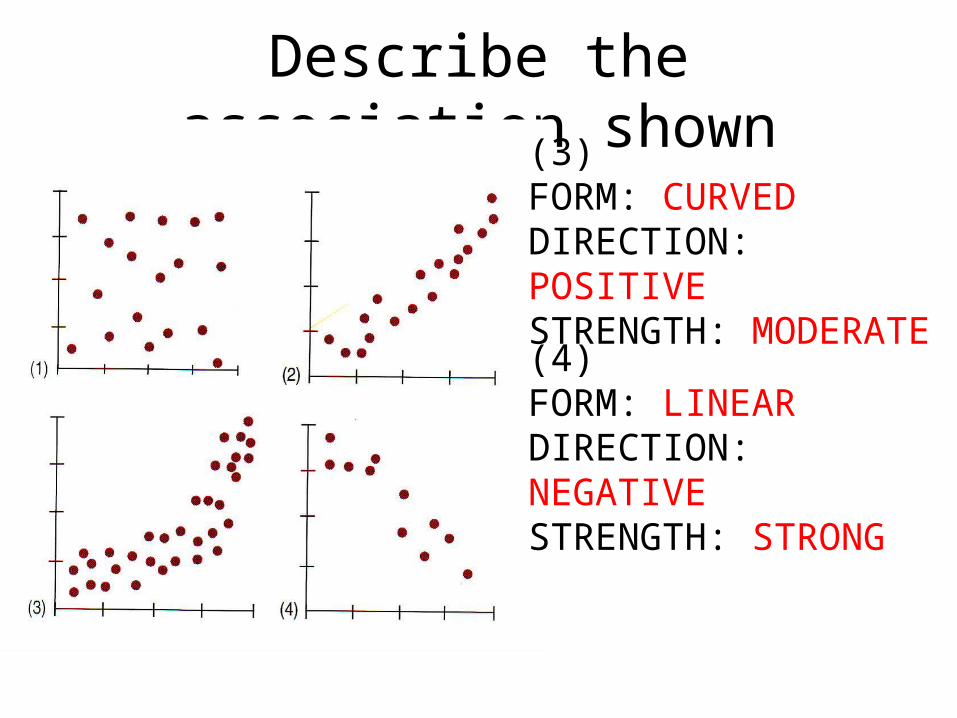
Describe the association shown(3)FORM: CURVEDDIRECTION: POSITIVESTRENGTH: MODERATE
(4) FORM: LINEARDIRECTION: NEGATIVESTRENGTH: STRONG
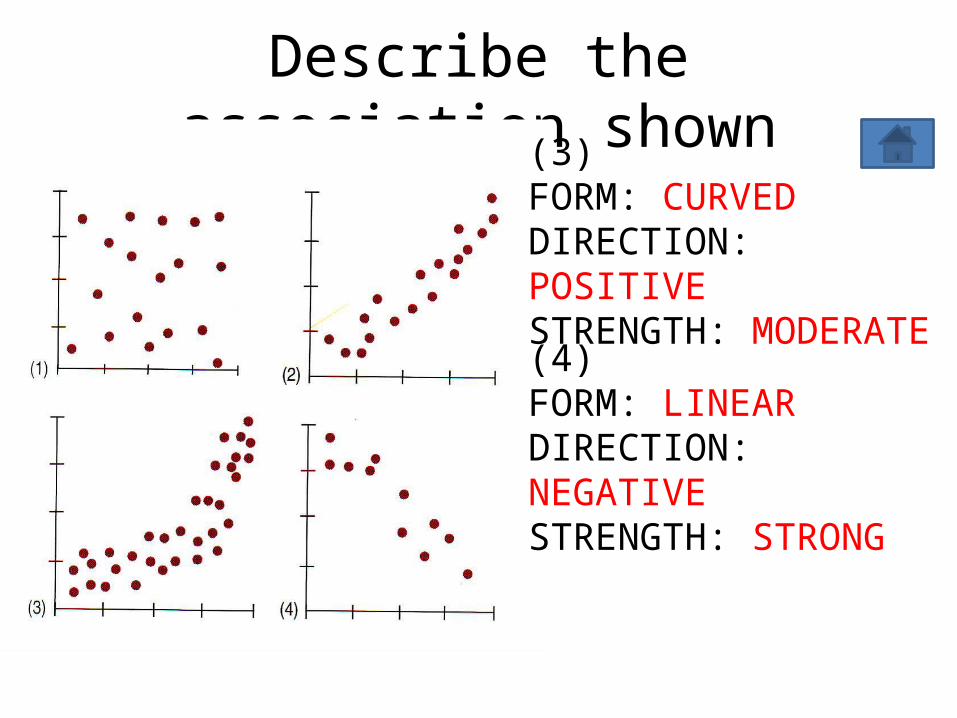
Describe the association shown(3)FORM: CURVEDDIRECTION: POSITIVESTRENGTH: MODERATE
(4) FORM: LINEARDIRECTION: NEGATIVESTRENGTH: STRONG
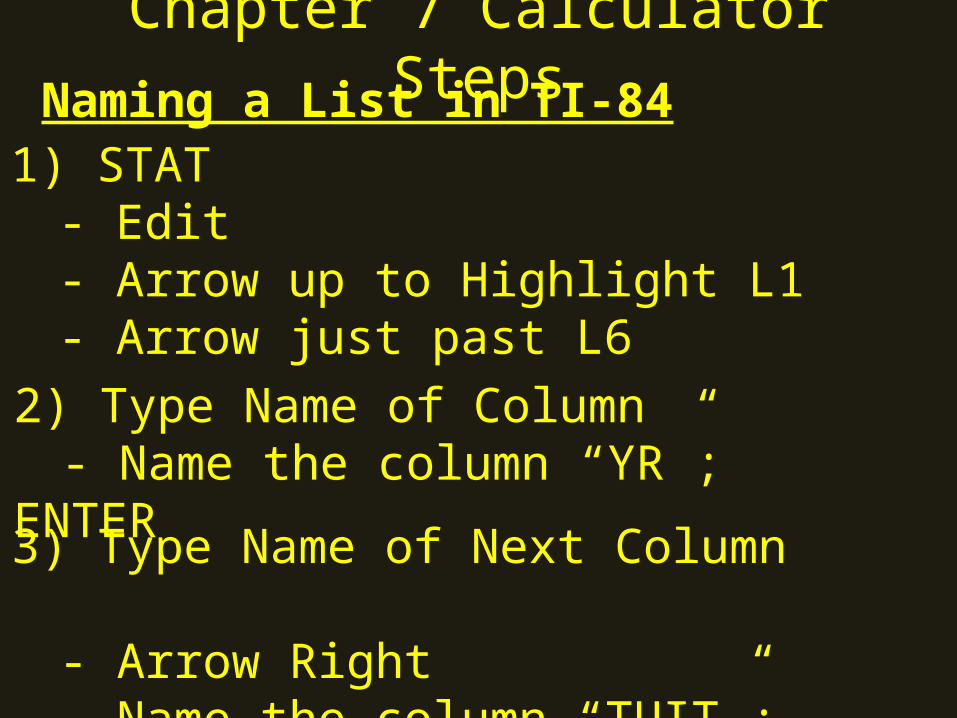
Chapter 7 Calculator StepsNaming a List in TI-84
1) STAT - Edit- Arrow up to Highlight L1- Arrow just past L6
2) Type Name of Column - Name the column “YR”; ENTER
3) Type Name of Next Column - Arrow Right- Name the column “TUIT”; ENTER
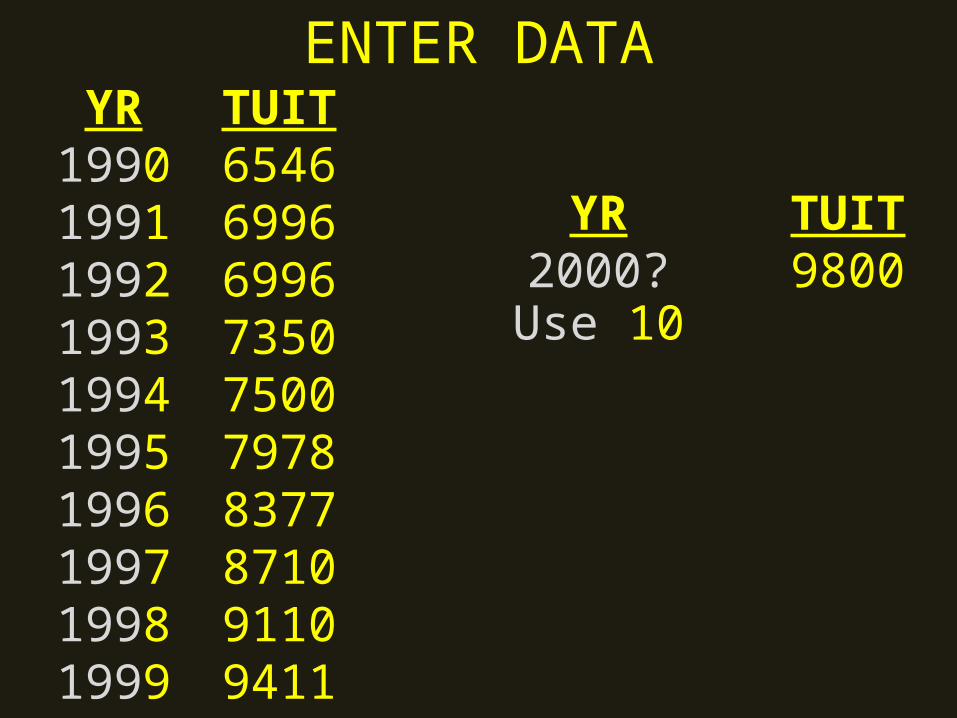
ENTER DATAYR
1990199119921993199419951996199719981999
TUIT6546699669967350750079788377871091109411
YR2000?Use 10
TUIT9800
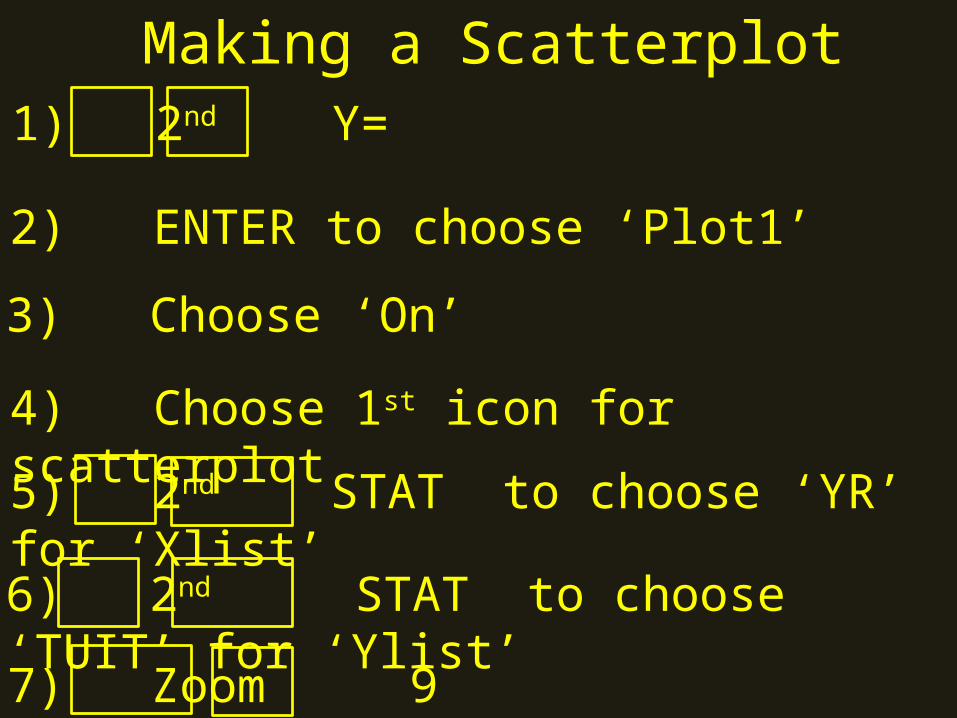
Making a Scatterplot1) 2nd Y=
2) ENTER to choose ‘Plot1’
3) Choose ‘On’
4) Choose 1st icon for scatterplot
5) 2nd STAT to choose ‘YR’ for ‘Xlist’
6) 2nd STAT to choose ‘TUIT’ for ‘Ylist’
7) Zoom 9
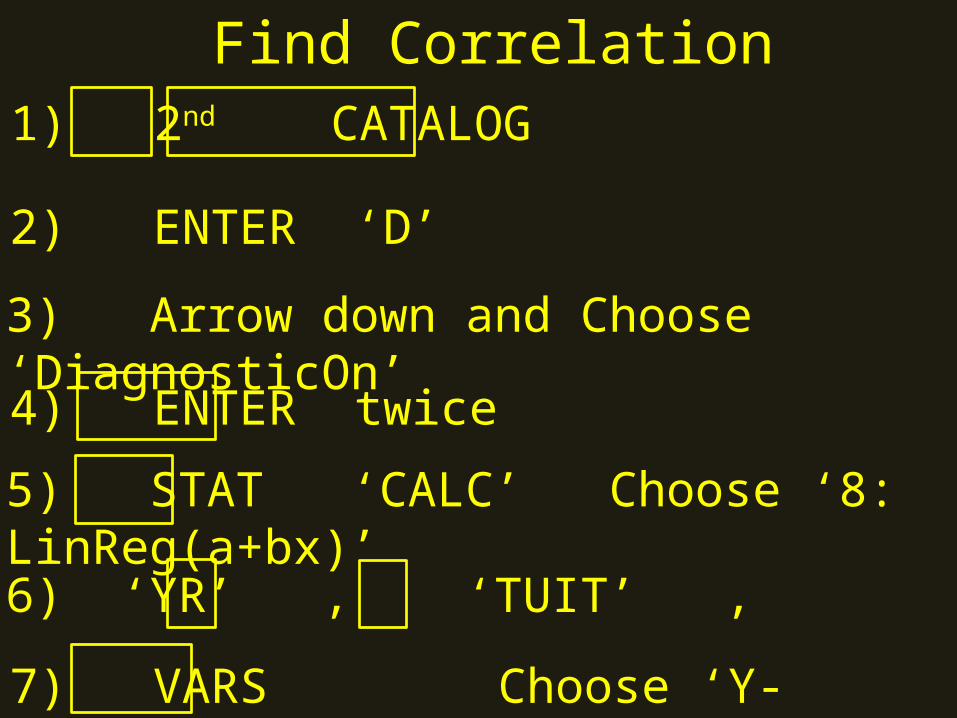
Find Correlation1) 2nd CATALOG
2) ENTER ‘D’
3) Arrow down and Choose ‘DiagnosticOn’
4) ENTER twice
5) STAT ‘CALC’ Choose ‘8: LinReg(a+bx)’
6) ‘YR’ , ‘TUIT’ ,
7) VARS Choose ‘Y-VARS’ ENTER x3
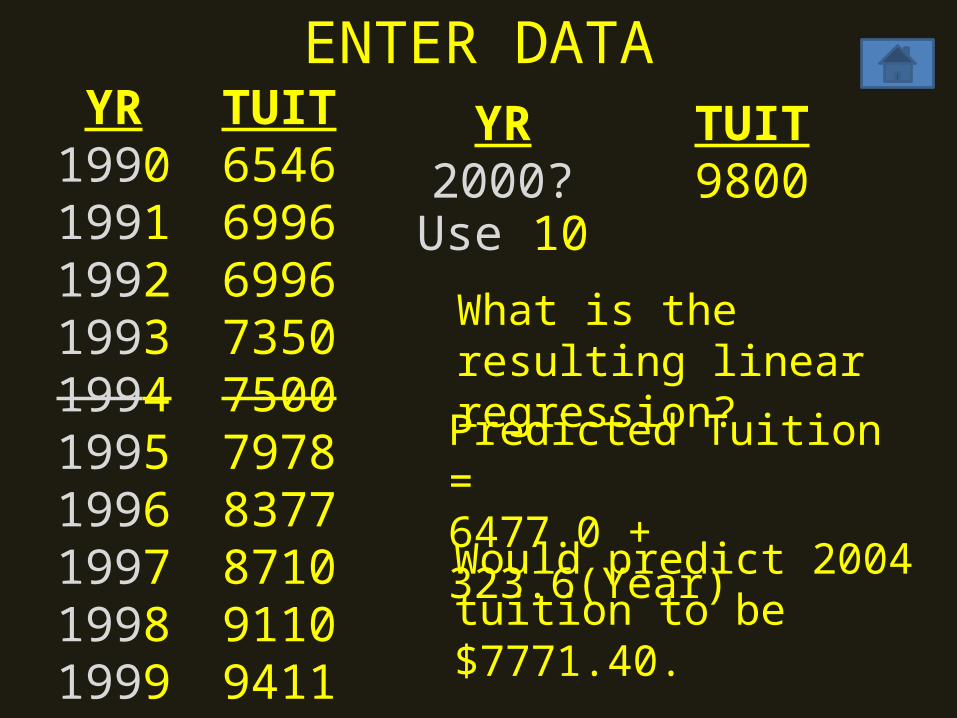
ENTER DATAYR
1990199119921993199419951996199719981999
TUIT6546699669967350750079788377871091109411
YR2000?Use 10
TUIT9800
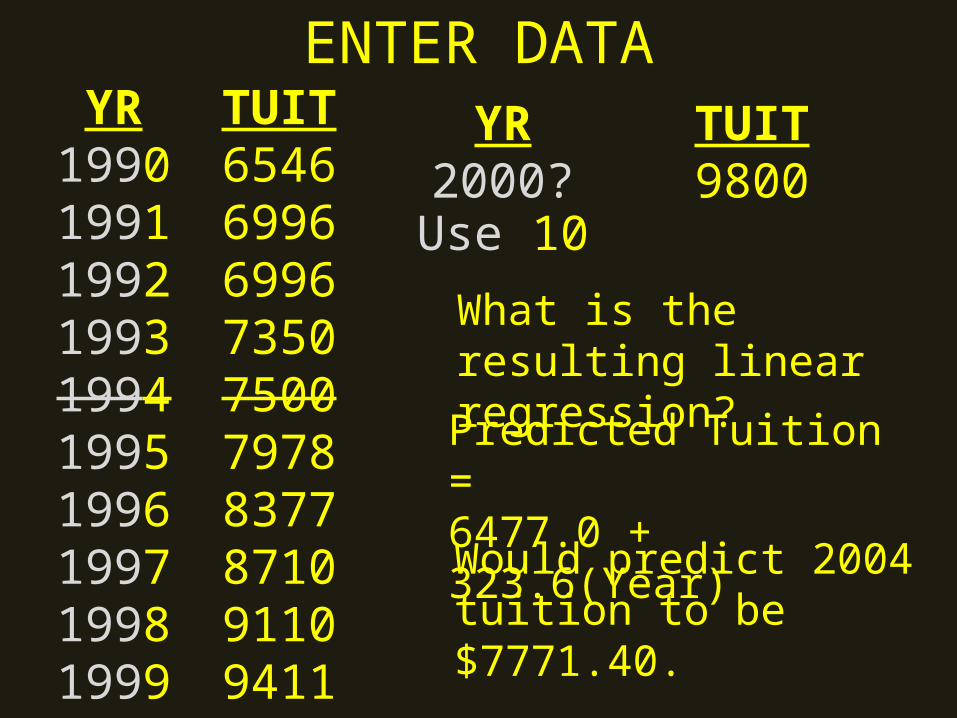
What is the resulting linear regression?
Predicted Tuition =6477.0 + 323.6(Year)
Would predict 2004 tuition to be $7771.40.
ENTER DATAYR
1990199119921993199419951996199719981999
TUIT6546699669967350750079788377871091109411
YR2000?Use 10
TUIT9800
What is the resulting linear regression?
Predicted Tuition =6477.0 + 323.6(Year)
Would predict 2004 tuition to be $7771.40.
Quick ReviewAssociation of two Categorical Variables
28.6%
8.2%
16.6%
11.2
%
25.0% 35.4%29.8% 45.2%
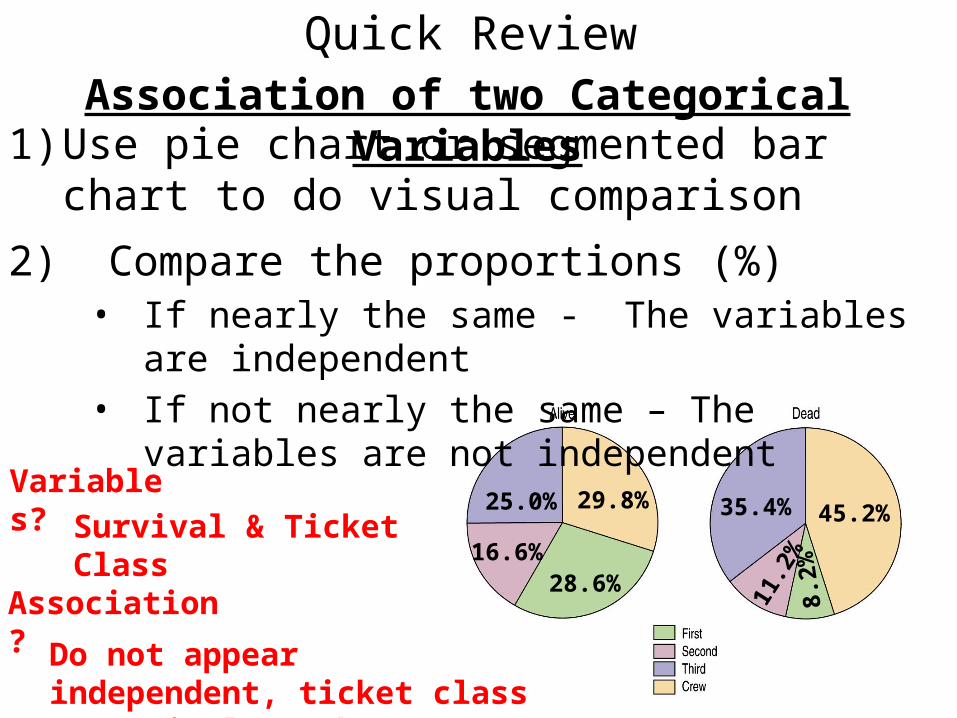
1) Use pie chart or segmented bar chart to do visual comparison
2) Compare the proportions (%)• If nearly the same - The variables are independent• If not nearly the same – The variables are not
independent
Variables?Survival & Ticket Class
Association?
Do not appear independent, ticket class & survival may be associated.
Quick ReviewAssociation of two Categorical Variables
28.6%
8.2%
16.6%
11.2
%
25.0% 35.4%29.8% 45.2%
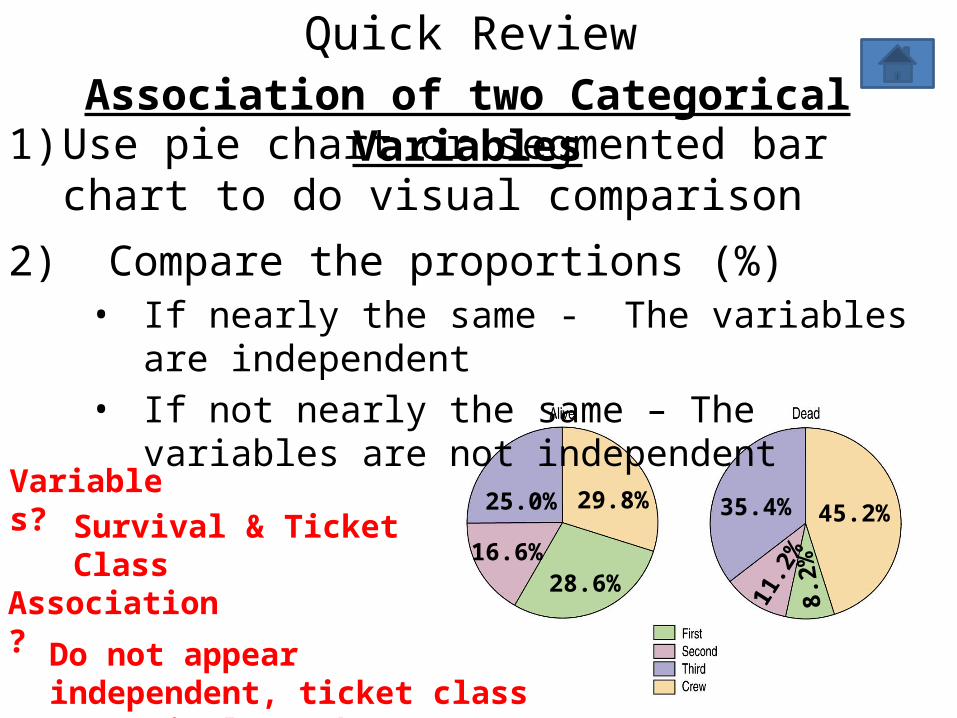
1) Use pie chart or segmented bar chart to do visual comparison
2) Compare the proportions (%)• If nearly the same - The variables are independent• If not nearly the same – The variables are not
independent
Variables?Survival & Ticket Class
Association?
Do not appear independent, ticket class & survival may be associated.
Chp 7 – Scatterplots, Association, and CorrelationVocabulary
1. Scatterplot – Graph which shows the relationship between two quantitative variables
2. Explanatory variable – the quantitative variable which is plotted on the horizontal axis (aka x-axis) of a scatterplot. It is used as the “predictor” of the other variable, but should not be interpreted as the cause of the other variable.
3. Response variable – the variable which is plotted on the vertical axis (aka y-axis) of a scatterplot. Be careful not to interpret the effect of the other.
Chp 7 – Scatterplots, Association, and CorrelationVocabulary
4.Form – what type of pattern is seen? Is it LINEAR? Is it CURVED?
6.Strength – How tight is the scatter around the underlying form? Is it VERY STRONG? STRONG? MODERATE? WEAK? Maybe even PERFECT or NONE.
5. Direction – If it is POSITIVE, as one variable increases so does the other. If it is NEGATIVE, as one variable increases the other decreases
7. Outliers – They need to be identified
Chp 7 – Scatterplots, Association, and CorrelationVocabulary
8. Correlation – a numerical measure of direction and strength of a linear association (also referred to as the r-value) -----BEFORE using you must meet the following CONDITIONS:
Chp 7 – Scatterplots, Association, and CorrelationVocabulary
8. Correlation – a numerical measure of direction and strength of a linear association (also referred to as the r-value) -----BEFORE using you must meet the following CONDITIONS:
1) Quanitative Variables Condition – both variables must be quantitative
2) Straight Enough Condition – the form of the scatterplot must be basically linear, not curved
3) Outlier Condition – no apparent outliers exist
Chp 7 – Scatterplots, Association, and Correlation9. Lurking Variable – A variable other than the explanatory and response variables recorded that affects both variables, accounting for the correlation between the two variables recorded.Example– The r-value for “average number of televisions sets per home” for a country and “average life span” for the country is very high. Does this mean we should ship tv’s to third world countries? The lurking variable here is “average income per household”. It affects both the number of tv’s and ability to increase life span through medical care.
Chp 7 – Scatterplots, Association, and Correlation9. Lurking Variable – A variable other than the explanatory and response variables recorded that affects both variables, accounting for the correlation between the two variables recorded.Example– The r-value for “average number of televisions sets per home” for a country and “average life span” for the country is very high. Does this mean we should ship tv’s to third world countries? The lurking variable here is “average income per household”. It affects both the number of tv’s and ability to increase life span through medical care.