Embed Size (px)
Citation preview

© Copyright National University of Singapore. All Rights Reserved.
AUTOMATED LINK GENERATION FOR SENSOR-ENRICHED SMARTPHONE IMAGES
IBM Interview talk, Sept 29th 2015, SingaporePresenter: Seshadri Padmanabha VenkatagiriAdvisor: Prof. Chan Mun ChoonCollaborating Advisor: Prof. Ooi Wei Tsang
© Copyright National University of Singapore. All Rights Reserved.
MOBILE USER GENERATED CONTENT: PHOTO
SLIDE: 2
More than 1.8 Billion photo uploads in 2014 till date
Source: Kleiner Perkins Caufield & Byers, Internet Trends 2014
© Copyright National University of Singapore. All Rights Reserved.
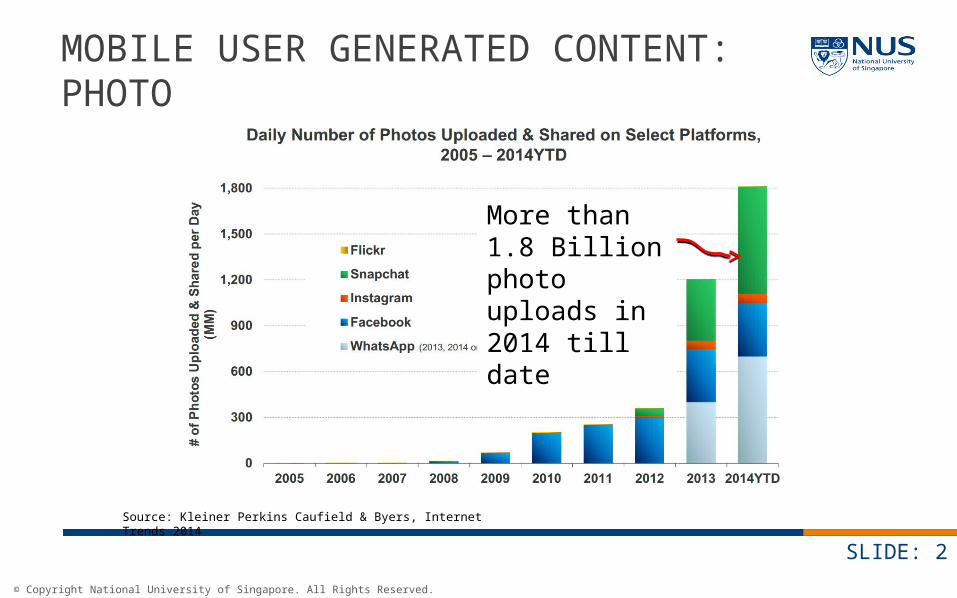
ADHOC EVENTS: IMPORTANT SOURCE OF MOBILE UGC
SLIDE: 3
Exhibitions
Street Performances
Mishaps
Social events
Well attended
Attendees share same event context
Lack of prior information. Eg. Training data
Lack of planned infrastructure. Eg. GPS, camera deployments etc.

© Copyright National University of Singapore. All Rights Reserved.
OBJECTIVE OF AUTOLINK
SLIDE: 4
To organize noisy unstructured photo collections to improve user interaction
© Copyright National University of Singapore. All Rights Reserved.
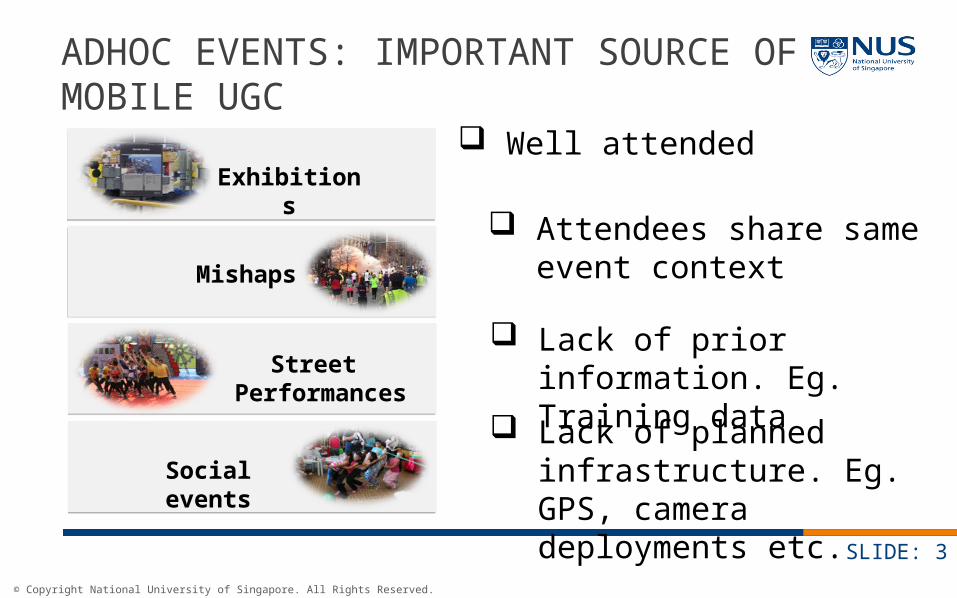
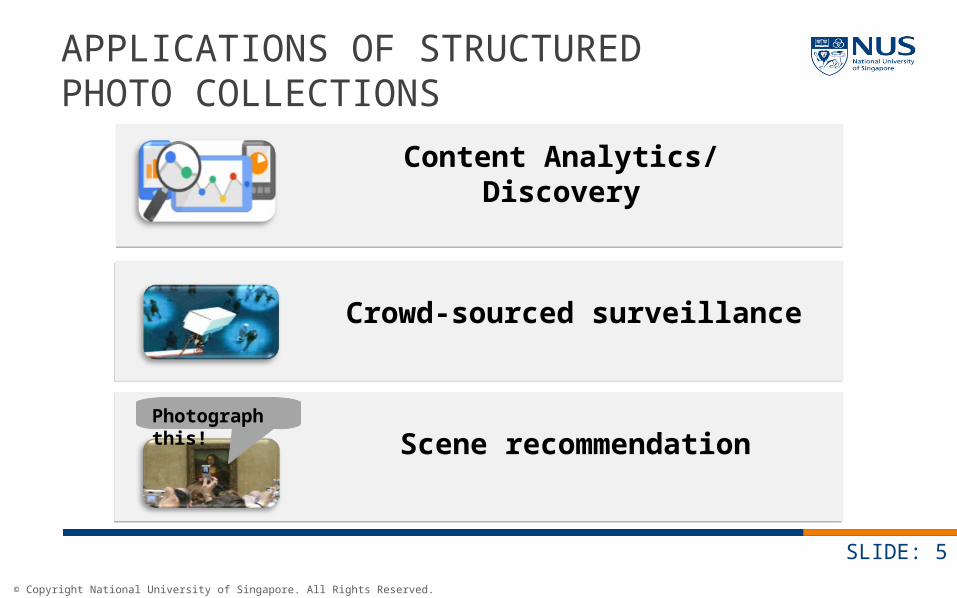
APPLICATIONS OF STRUCTURED PHOTO COLLECTIONS
SLIDE: 5
Content Analytics/Discovery
Crowd-sourced surveillance
Photograph this! Scene recommendation
© Copyright National University of Singapore. All Rights Reserved.
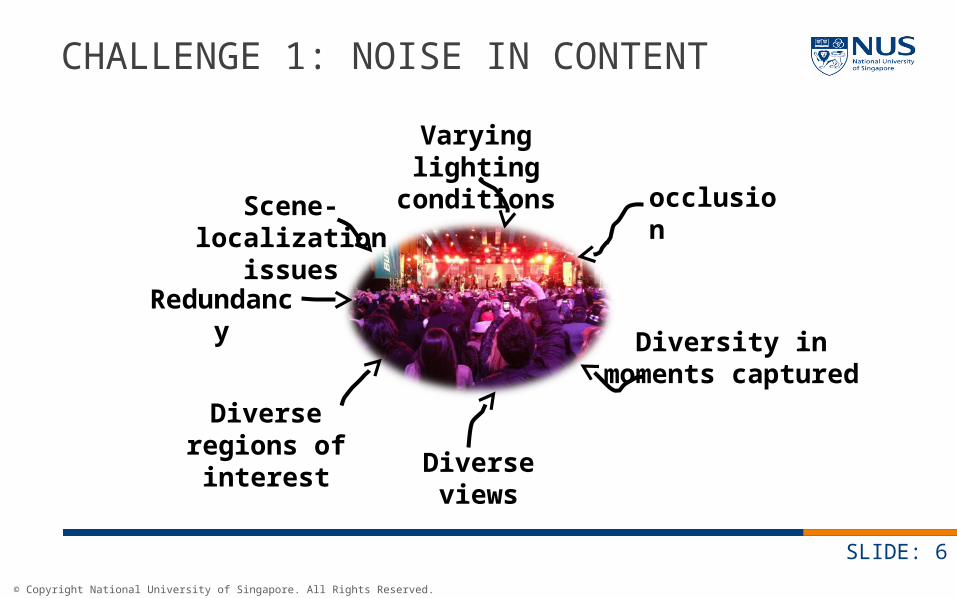
CHALLENGE 1: NOISE IN CONTENT
SLIDE: 6
occlusion
Varying lighting conditions
Diverse views
Diverse regions of interest
Diversity in moments captured
Scene-localization issues
Redundancy
© Copyright National University of Singapore. All Rights Reserved.
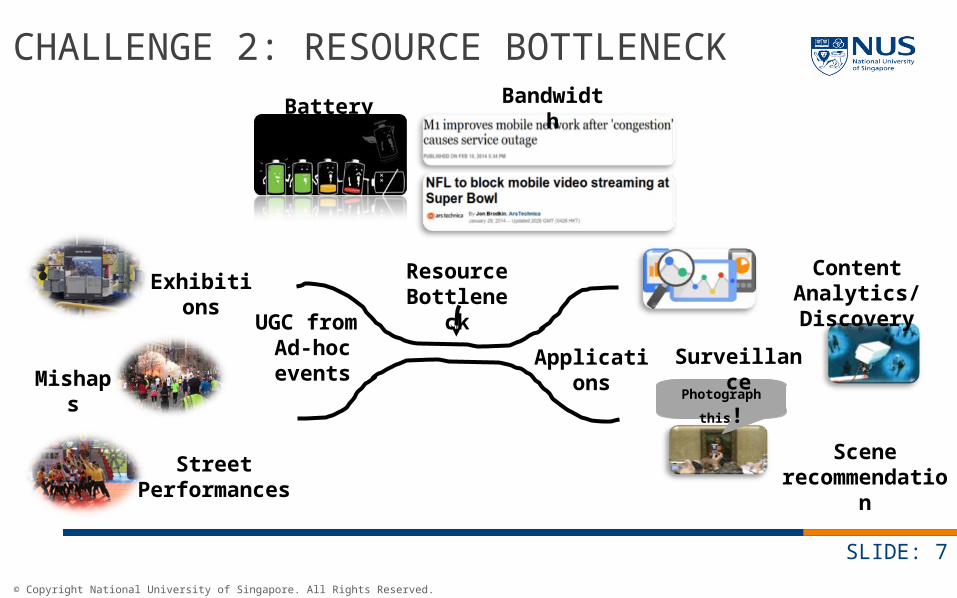
CHALLENGE 2: RESOURCE BOTTLENECK
SLIDE: 7
Resource Bottleneck
UGC from Ad-hoc events
Exhibitions
Street Performances
Mishaps
Battery Bandwidth
Applications
Photograph this!
Content Analytics/Discovery
Scene recommendation
Surveillance

© Copyright National University of Singapore. All Rights Reserved.
OUR APPROACH: DETAIL-ON-DEMAND PARADIGM
SLIDE: 8
Does not overwhelm users with lots of content. Suited for small-factor devices.
Retrieves specific content, on-demand. Consumes less bandwidth and power
Organizing content by providing progressively detailed content, helps analytics and elicits user interest

© Copyright National University of Singapore. All Rights Reserved.
DETAIL-ON-DEMAND PARADIGM: EXISTING SOLUTIONS
SLIDE: 9
Hyperlinking Provides progressive content Could be adapted to link content from multiple
sources
Zooming Provides progressively detailed content Not suitable for relating content from multiple
sources
WE CHOOSE HYPERLINK BASED DETAIL-ON-DEMAND TO PROVIDE PROGRESSIVELY DETAILED CONTENT
WE CHOOSE HYPERLINK BASED DETAIL-ON-DEMAND TO PROVIDE PROGRESSIVELY DETAILED CONTENT
© Copyright National University of Singapore. All Rights Reserved.
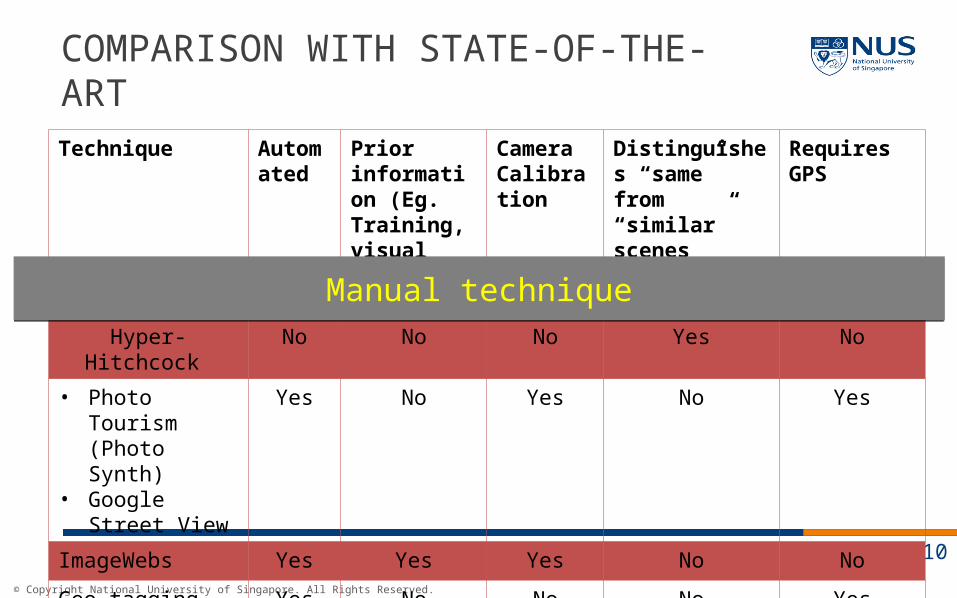
COMPARISON WITH STATE-OF-THE-ART
SLIDE: 10
Technique Automated
Prior information (Eg. Training, visual dictionary)
Camera Calibration
Distinguishes “same” from “similar” scenes
Requires GPS
Hyper-Hitchcock No No No Yes No
• Photo Tourism (Photo Synth)
• Google Street View
Yes No Yes No Yes
ImageWebs Yes Yes Yes No No
Geo-tagging Yes No No No Yes
AutoLink Yes No No Yes No
Manual techniqueManual technique
© Copyright National University of Singapore. All Rights Reserved.
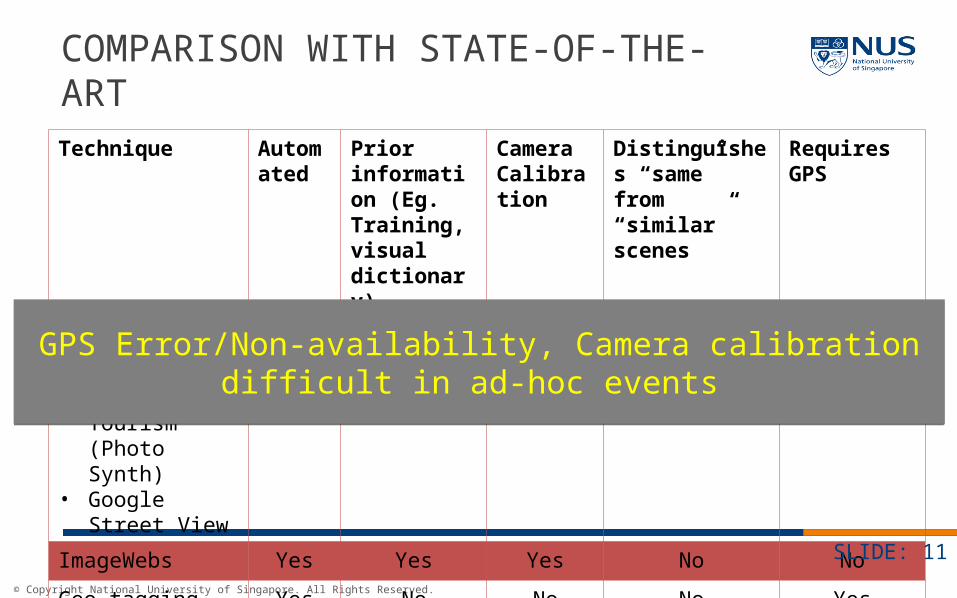
Technique Automated
Prior information (Eg. Training, visual dictionary)
Camera Calibration
Distinguishes “same” from “similar” scenes
Requires GPS
Hyper-Hitchcock No No No Yes No
• Photo Tourism (Photo Synth)
• Google Street View
Yes No Yes No Yes
ImageWebs Yes Yes Yes No No
Geo-tagging Yes No No No Yes
AutoLink Yes No No Yes No
COMPARISON WITH STATE-OF-THE-ART
SLIDE: 11
GPS Error/Non-availability, Camera calibration difficult in ad-hoc events
GPS Error/Non-availability, Camera calibration difficult in ad-hoc events
© Copyright National University of Singapore. All Rights Reserved.
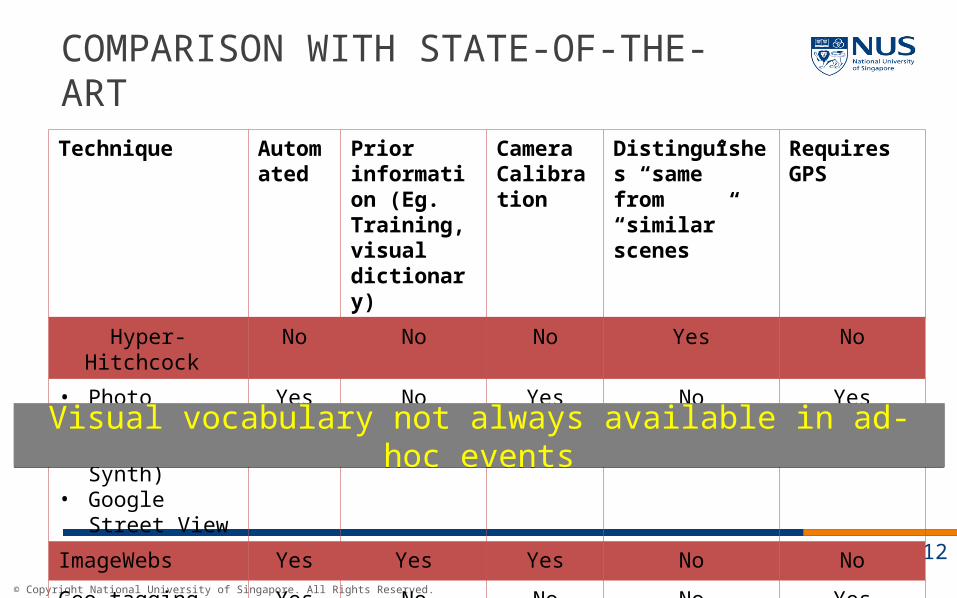
COMPARISON WITH STATE-OF-THE-ART
SLIDE: 12
Technique Automated
Prior information (Eg. Training, visual dictionary)
Camera Calibration
Distinguishes “same” from “similar” scenes
Requires GPS
Hyper-Hitchcock No No No Yes No
• Photo Tourism (Photo Synth)
• Google Street View
Yes No Yes No Yes
ImageWebs Yes Yes Yes No No
Geo-tagging Yes No No No Yes
AutoLink Yes No No Yes No
Visual vocabulary not always available in ad-hoc eventsVisual vocabulary not always available in ad-hoc events
© Copyright National University of Singapore. All Rights Reserved.
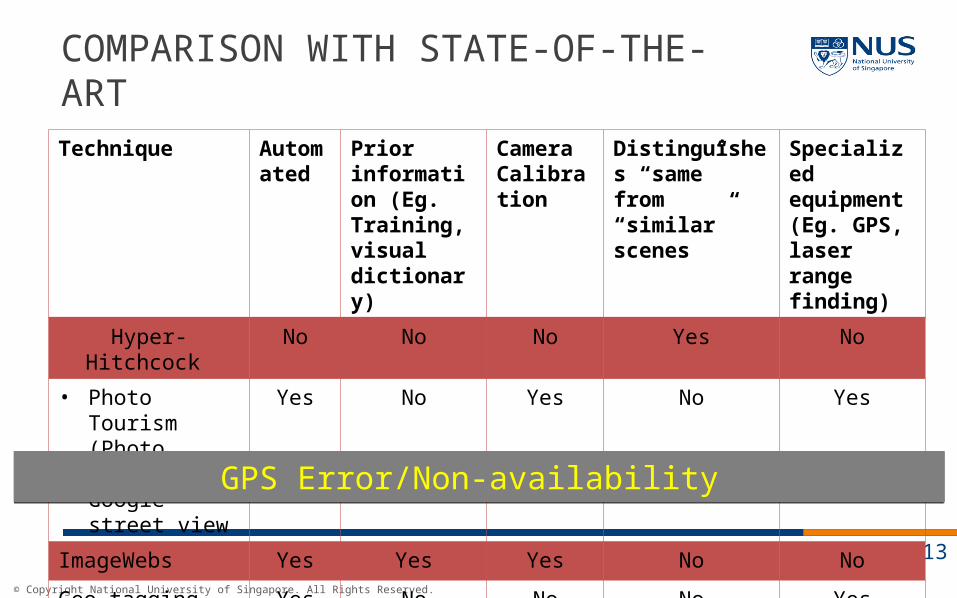
COMPARISON WITH STATE-OF-THE-ART
SLIDE: 13
Technique Automated
Prior information (Eg. Training, visual dictionary)
Camera Calibration
Distinguishes “same” from “similar” scenes
Specialized equipment (Eg. GPS, laser range finding)
Hyper-Hitchcock No No No Yes No
• Photo Tourism (Photo Synth)
• Google street view
Yes No Yes No Yes
ImageWebs Yes Yes Yes No No
Geo-tagging Yes No No No Yes
AutoLink Yes No No Yes NoGPS Error/Non-availability GPS Error/Non-availability
© Copyright National University of Singapore. All Rights Reserved.
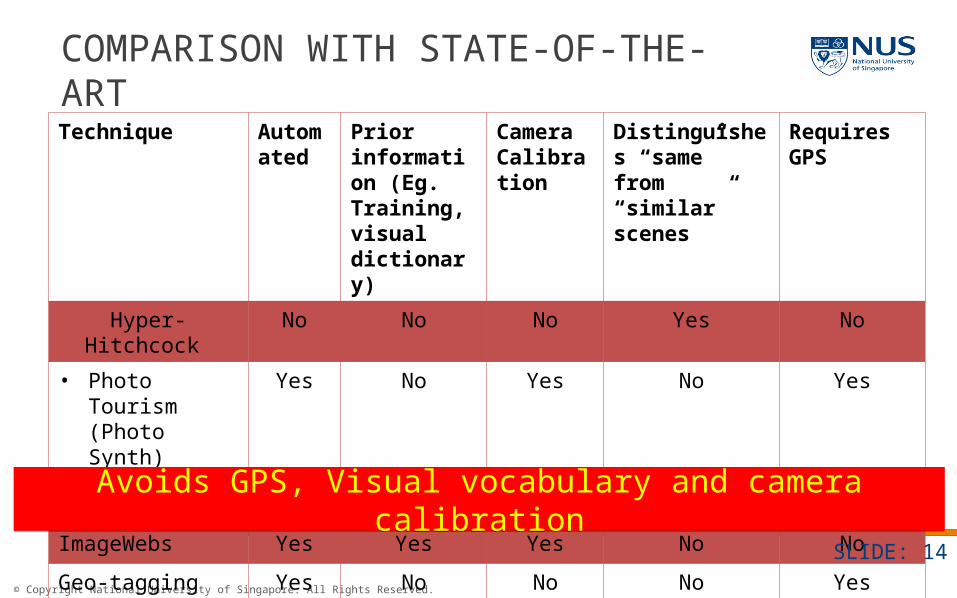
Technique Automated
Prior information (Eg. Training, visual dictionary)
Camera Calibration
Distinguishes “same” from “similar” scenes
Requires GPS
Hyper-Hitchcock No No No Yes No
• Photo Tourism (Photo Synth)
• Google Street View
Yes No Yes No Yes
ImageWebs Yes Yes Yes No No
Geo-tagging Yes No No No Yes
AutoLink Yes No No Yes No
COMPARISON WITH STATE-OF-THE-ART
SLIDE: 14
Avoids GPS, Visual vocabulary and camera calibrationAvoids GPS, Visual vocabulary and camera calibration
© Copyright National University of Singapore. All Rights Reserved.
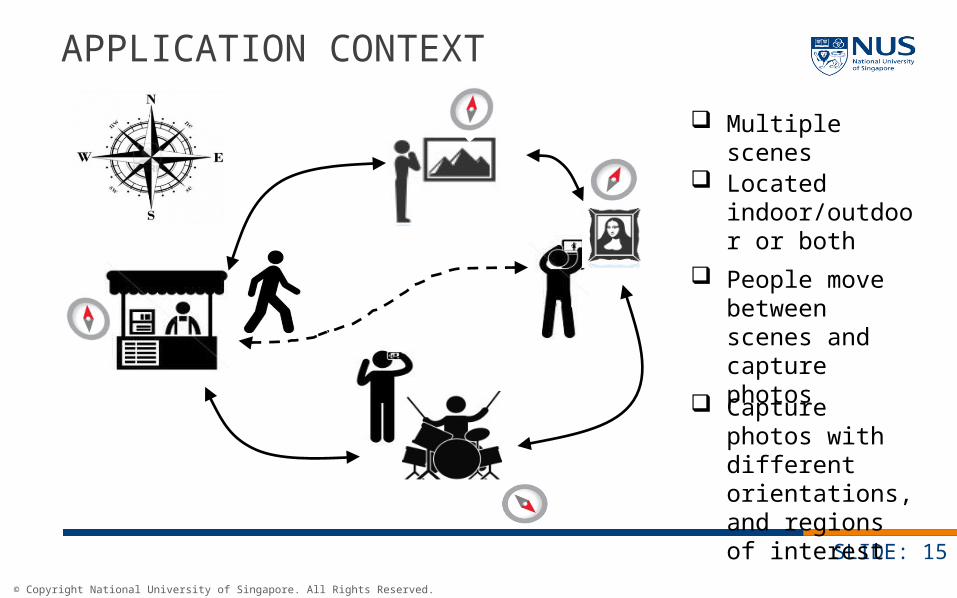
APPLICATION CONTEXT
SLIDE: 15
Multiple scenes
Located indoor/outdoor or both
People move between scenes and capture photos
Capture photos with different orientations, and regions of interest

© Copyright National University of Singapore. All Rights Reserved.
PROBLEM
SLIDE: 16
Image collection
Inertial Sensor log
Set of scenes user is interested in
?
Detail-on-demand Image hierarchy
High Context
High Detail
© Copyright National University of Singapore. All Rights Reserved.
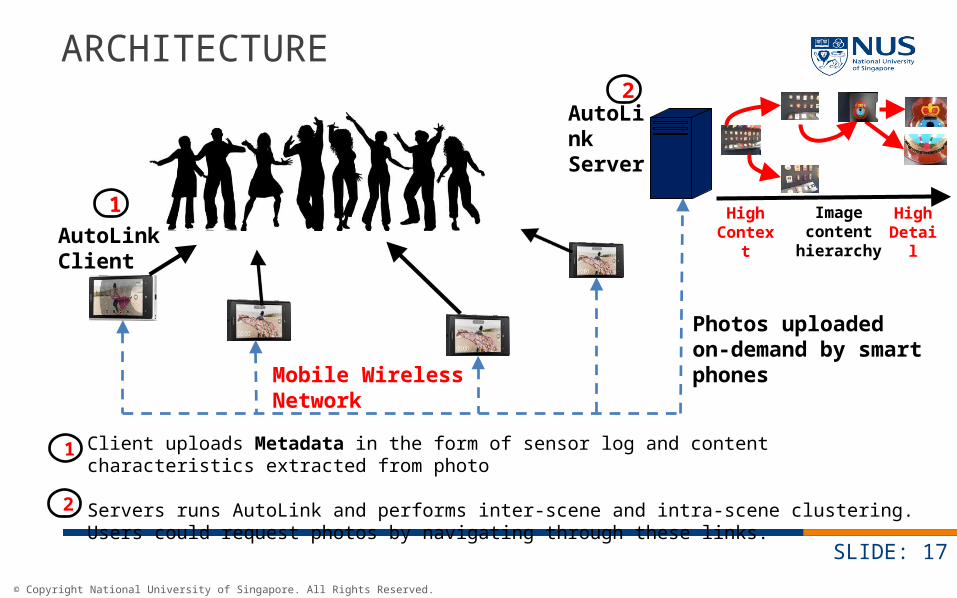
ARCHITECTURE
SLIDE: 17
AutoLink Server
Mobile Wireless Network
AutoLinkClient
1
2
Photos uploaded on-demand by smart phones
Client uploads Metadata in the form of sensor log and content characteristics extracted from photo Servers runs AutoLink and performs inter-scene and intra-scene clustering. Users could request photos by navigating through these links.2
1
Image content
hierarchy
High Context
High Detail
© Copyright National University of Singapore. All Rights Reserved.
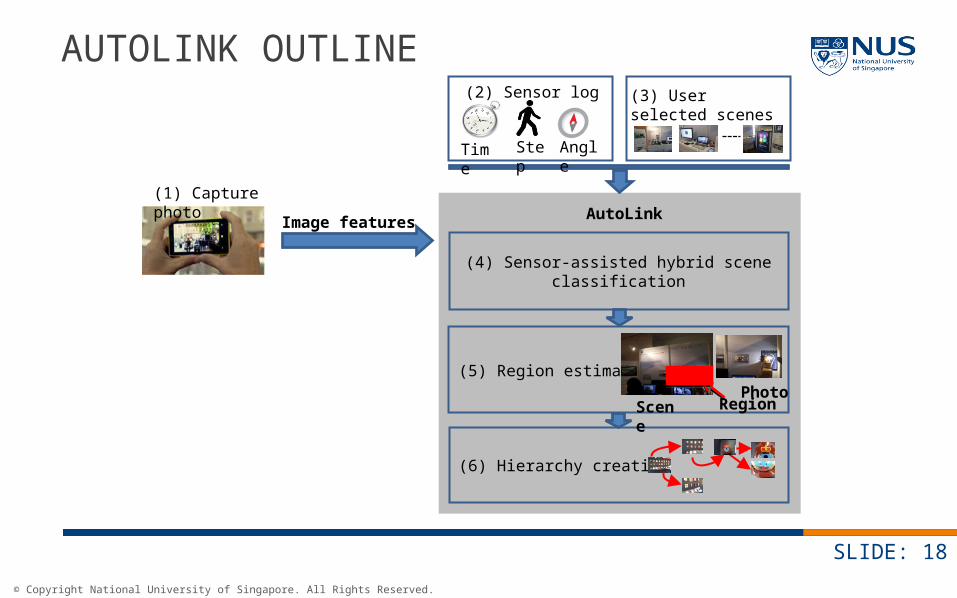
AUTOLINK OUTLINE
SLIDE: 18
Image features
(4) Sensor-assisted hybrid scene classification
(6) Hierarchy creation
(5) Region estimationPhoto
Scene Region
(3) User selected scenes
AngleTime Step
(2) Sensor log
(1) Capture photoAutoLink
© Copyright National University of Singapore. All Rights Reserved.
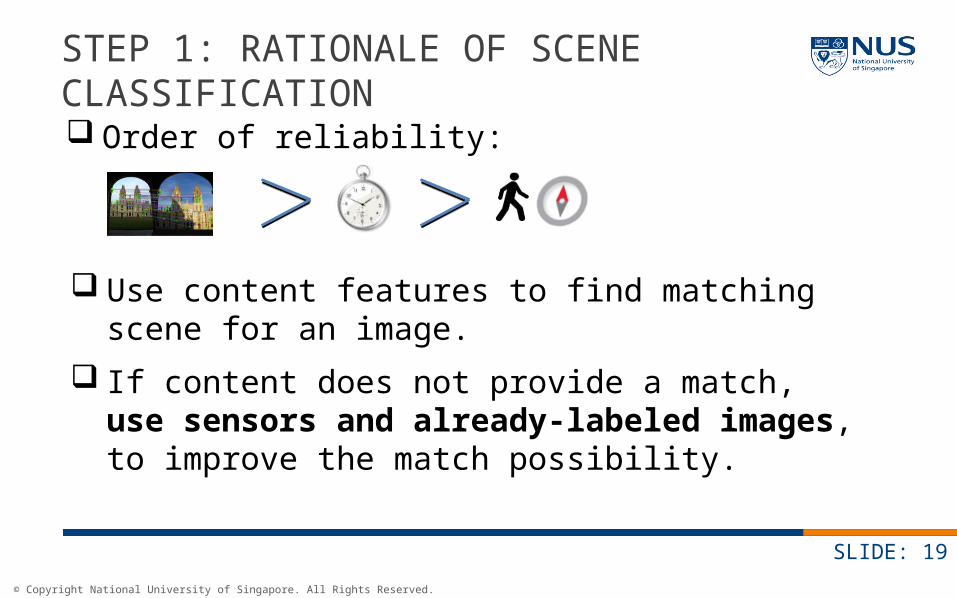
STEP 1: RATIONALE OF SCENE CLASSIFICATION
SLIDE: 19
Order of reliability:
Use content features to find matching scene for an image.
If content does not provide a match, use sensors and already-labeled images, to improve the match possibility.

© Copyright National University of Singapore. All Rights Reserved.
STEP 1: SCENE CLASSIFICATION
SLIDE: 20
Content features
User specified scenes
Match content
features
Match content
features
Apply Naïve Bayes Nearest
Neighbor classification
Apply Naïve Bayes Nearest
Neighbor classification
No scene match?
Label image with scene
Label image with scene
Scene match?
Remains unlabeledRemains
unlabeled
© Copyright National University of Singapore. All Rights Reserved.
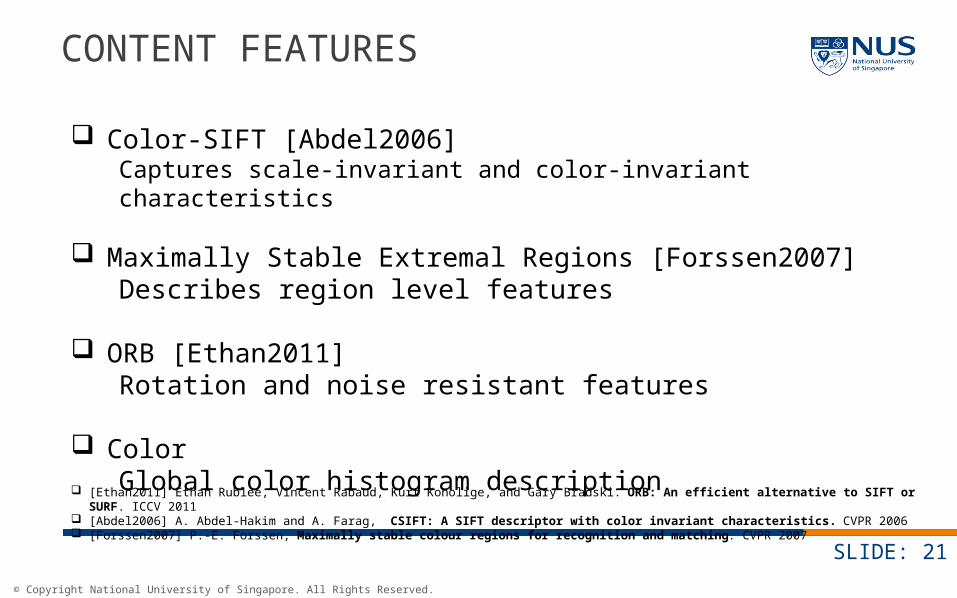
CONTENT FEATURES
SLIDE: 21
Color-SIFT [Abdel2006]Captures scale-invariant and color-invariant characteristics
Maximally Stable Extremal Regions [Forssen2007]Describes region level features
ORB [Ethan2011]Rotation and noise resistant features
ColorGlobal color histogram description
[Ethan2011] Ethan Rublee, Vincent Rabaud, Kurt Konolige, and Gary Bradski. ORB: An efficient alternative to SIFT or SURF. ICCV 2011
[Abdel2006] A. Abdel-Hakim and A. Farag, CSIFT: A SIFT descriptor with color invariant characteristics. CVPR 2006 [Forssen2007] P.-E. Forssen, Maximally stable colour regions for recognition and matching. CVPR 2007
© Copyright National University of Singapore. All Rights Reserved.
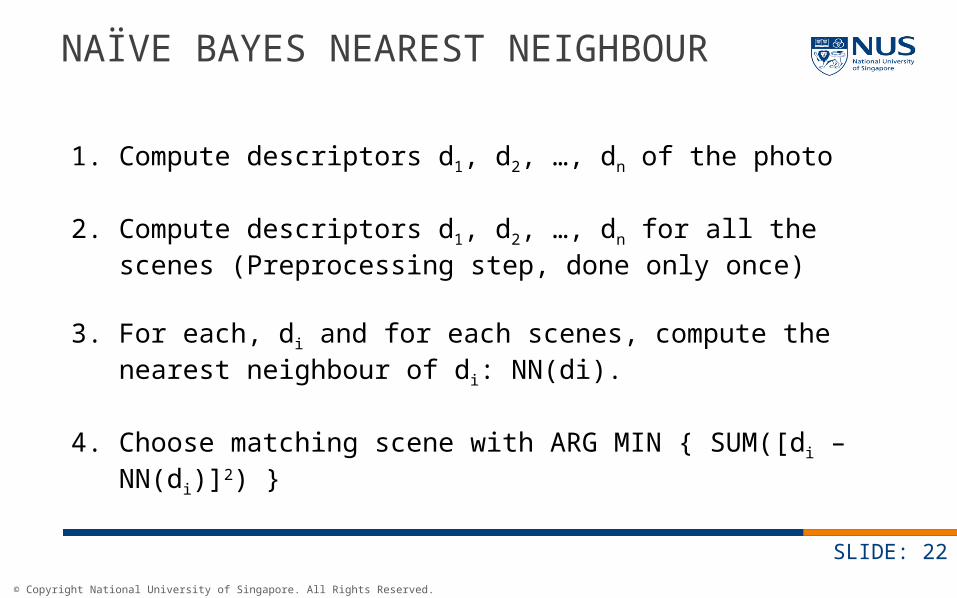
NAÏVE BAYES NEAREST NEIGHBOUR
SLIDE: 22
1. Compute descriptors d1, d2, …, dn of the photo
2. Compute descriptors d1, d2, …, dn for all the scenes (Preprocessing step, done only once)
3. For each, di and for each scenes, compute the nearest neighbour of di: NN(di).
4. Choose matching scene with ARG MIN { SUM([di – NN(di)]2) }

© Copyright National University of Singapore. All Rights Reserved.
STEP 1: SCENE CLASSIFICATION
SLIDE: 23
Content (interest points)
User specified scenes
Match content
features
Match content
features
Apply Naïve Bayes Nearest
Neighbor classification
Apply Naïve Bayes Nearest
Neighbor classification
No scene match?
Label image with scene
Label image with scene
scene match?
Combine content, time, sensor features to find matching scene label
Combine content, time, sensor features to find matching scene label
AngleTime Step Content
Remains unlabeledRemains
unlabeled

© Copyright National University of Singapore. All Rights Reserved.
TIME FEATURE: TEMPORAL CLUSTERING
SLIDE: 24
0
5
10
15
20
25
0 20 40 60 80 100Photo Timestamps (in minutes)
Clu
ster
Id
Inter-photo time gaps
Photo-clusters
© Copyright National University of Singapore. All Rights Reserved.
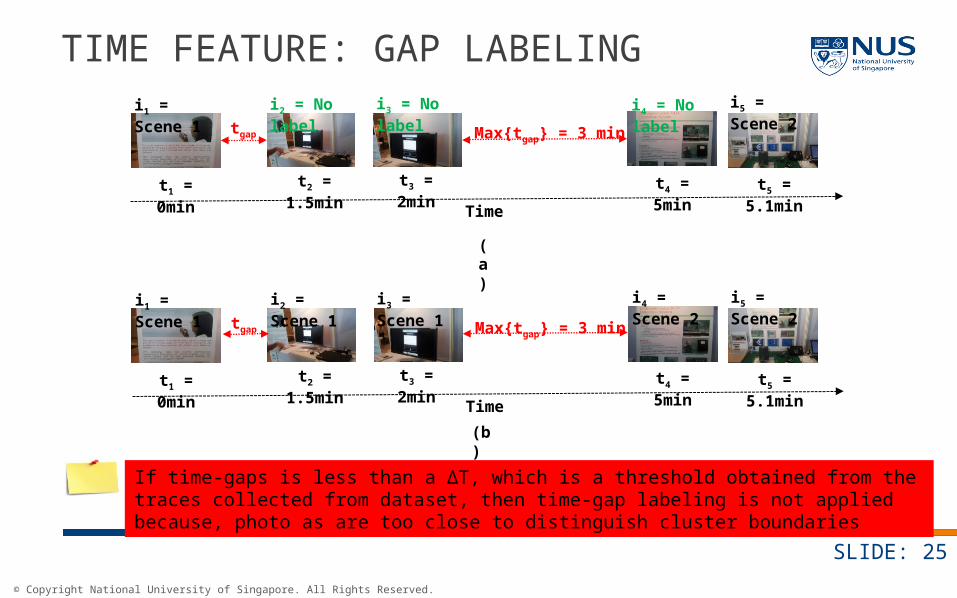
TIME FEATURE: GAP LABELING
SLIDE: 25
t1 = 0min t2 = 1.5min t3 = 2min t4 = 5min t5 = 5.1min
Time
tgap Max{tgap} = 3 min
i1 = Scene 1 i5 = Scene 2i2 = No label i3 = No label i4 = No label
t1 = 0min t2 = 1.5min t3 = 2min t4 = 5min t5 = 5.1min
Time
tgap Max{tgap} = 3 min
i1 = Scene 1 i5 = Scene 2i2 = Scene 1 i3 = Scene 1 i4 = Scene 2
(a)
(b)
If time-gaps is less than a ΔT, which is a threshold obtained from the traces collected from dataset, then time-gap labeling is not applied because, photo as are too close to distinguish cluster boundaries
© Copyright National University of Singapore. All Rights Reserved.
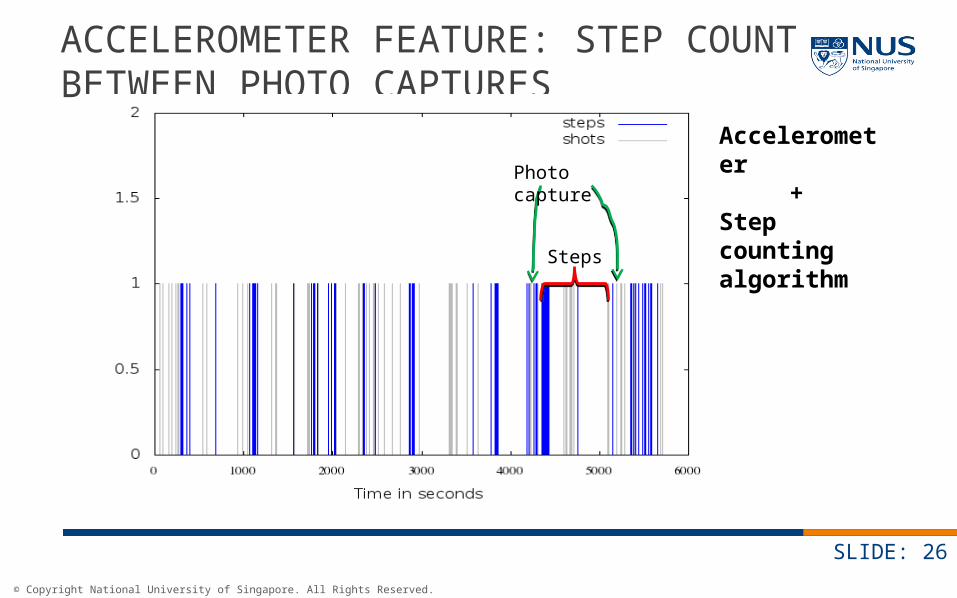
ACCELEROMETER FEATURE: STEP COUNT BETWEEN PHOTO CAPTURES
SLIDE: 26
Photo capture
Steps
Accelerometer +
Step counting algorithm

© Copyright National University of Singapore. All Rights Reserved.
PHOTO ORIENTATION
SLIDE: 27
Photo orientation is obtained from sensor fusion of magnetic field sensor + Gyroscope + Accelerometer
© Copyright National University of Singapore. All Rights Reserved.
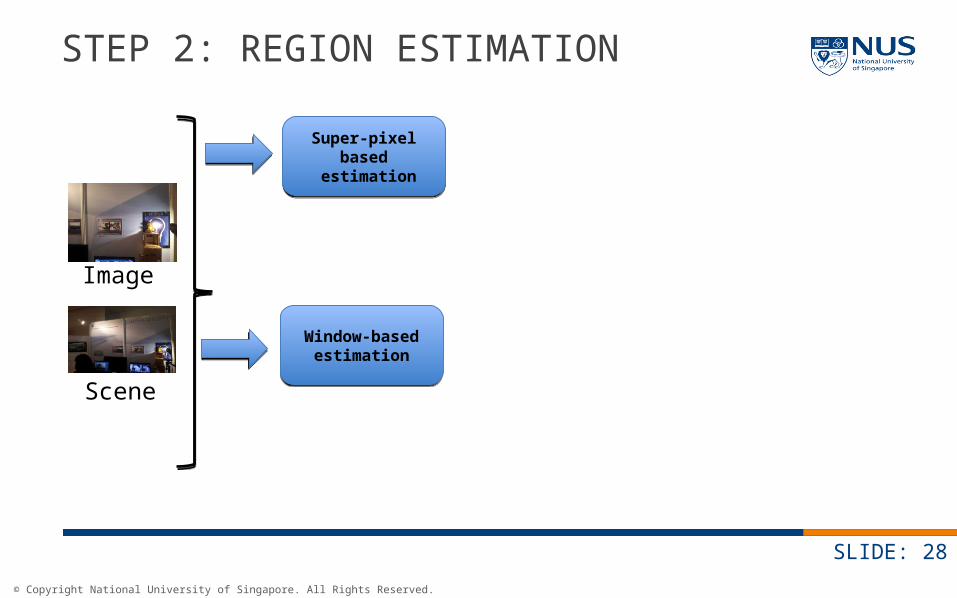
STEP 2: REGION ESTIMATION
SLIDE: 28
Image
Scene
Window-based estimation
Window-based estimation
Super-pixel based estimation
Super-pixel based estimation

© Copyright National University of Singapore. All Rights Reserved.
STEP 2: REGION ESTIMATION
SLIDE: 29
Image
Scene
Window-based estimation
Window-based estimation
Super-pixel based estimation
1.Apply SEEDS super-pixel to image and scene.
Super-pixel based estimation
1.Apply SEEDS super-pixel to image and scene.
© Copyright National University of Singapore. All Rights Reserved.
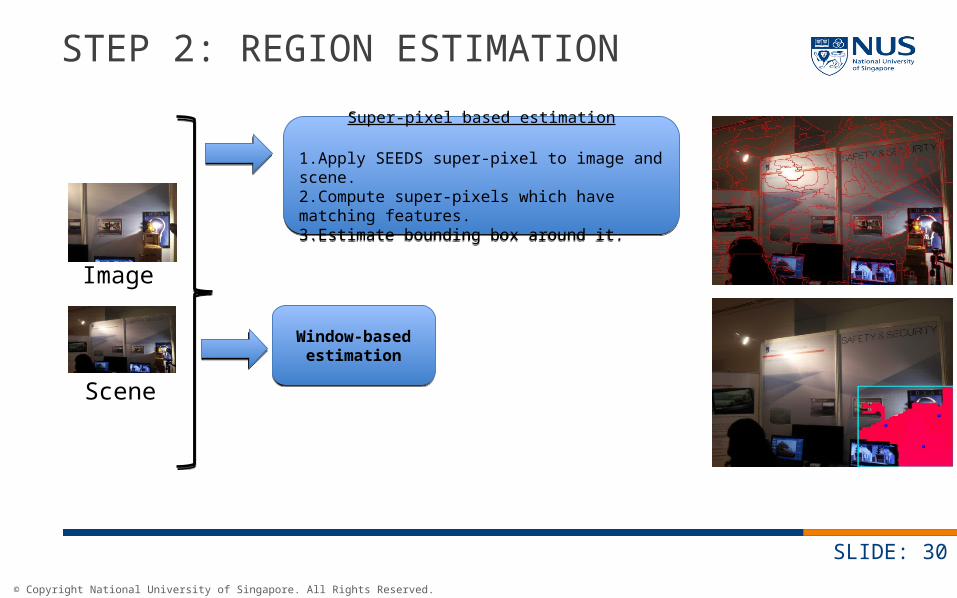
STEP 2: REGION ESTIMATION
SLIDE: 30
Image
Scene
Window-based estimation
Window-based estimation
Super-pixel based estimation
1.Apply SEEDS super-pixel to image and scene. 2.Compute super-pixels which have matching features.3.Estimate bounding box around it.
Super-pixel based estimation
1.Apply SEEDS super-pixel to image and scene. 2.Compute super-pixels which have matching features.3.Estimate bounding box around it.
© Copyright National University of Singapore. All Rights Reserved.
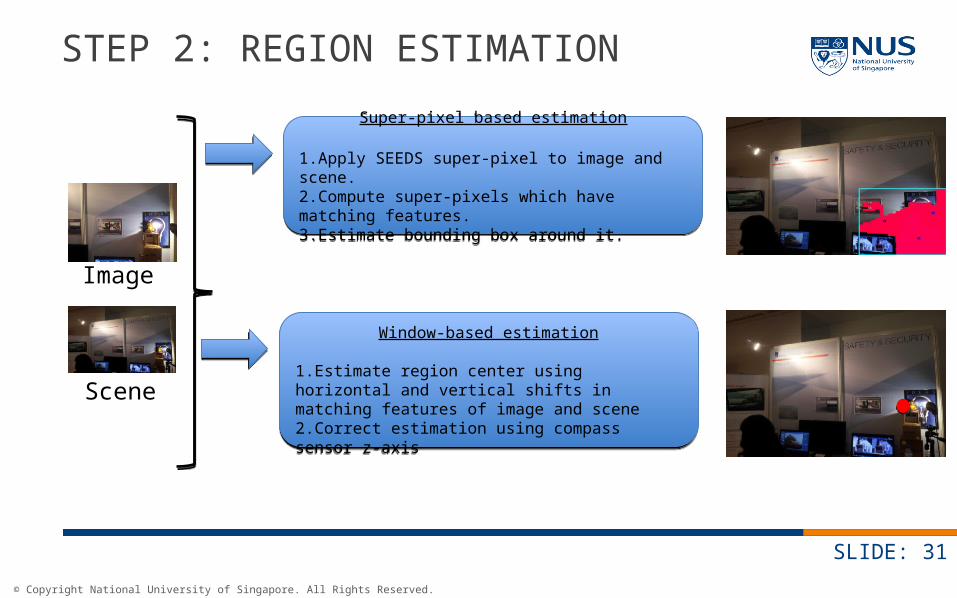
STEP 2: REGION ESTIMATION
SLIDE: 31
Image
Scene
Window-based estimation
1.Estimate region center using horizontal and vertical shifts in matching features of image and scene 2.Correct estimation using compass sensor z-axis
Window-based estimation
1.Estimate region center using horizontal and vertical shifts in matching features of image and scene 2.Correct estimation using compass sensor z-axis
Super-pixel based estimation
1.Apply SEEDS super-pixel to image and scene. 2.Compute super-pixels which have matching features.3.Estimate bounding box around it.
Super-pixel based estimation
1.Apply SEEDS super-pixel to image and scene. 2.Compute super-pixels which have matching features.3.Estimate bounding box around it.
© Copyright National University of Singapore. All Rights Reserved.
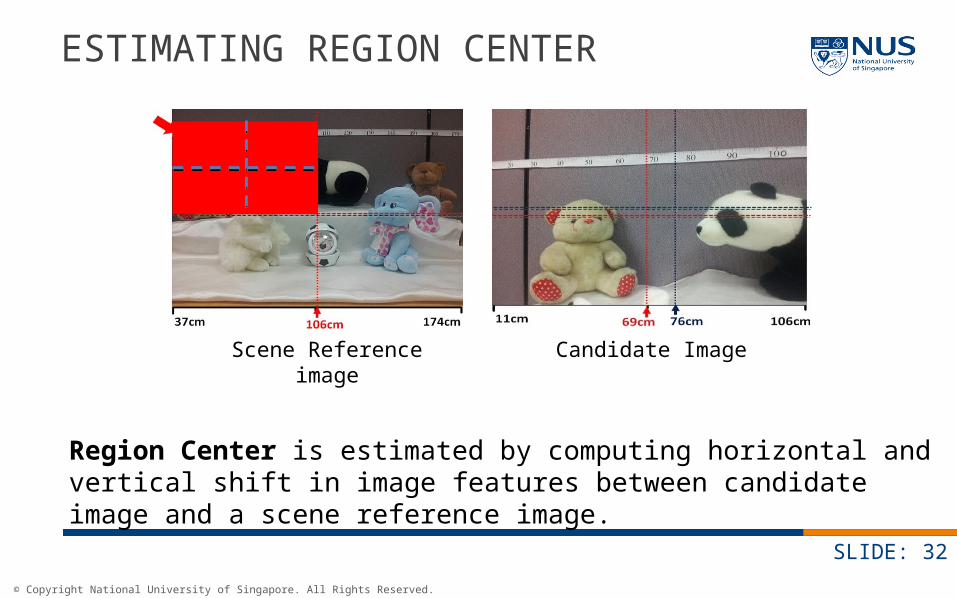
ESTIMATING REGION CENTER
SLIDE: 32
Region Center is estimated by computing horizontal and vertical shift in image features between candidate image and a scene reference image.
Scene Reference image Candidate Image
© Copyright National University of Singapore. All Rights Reserved.
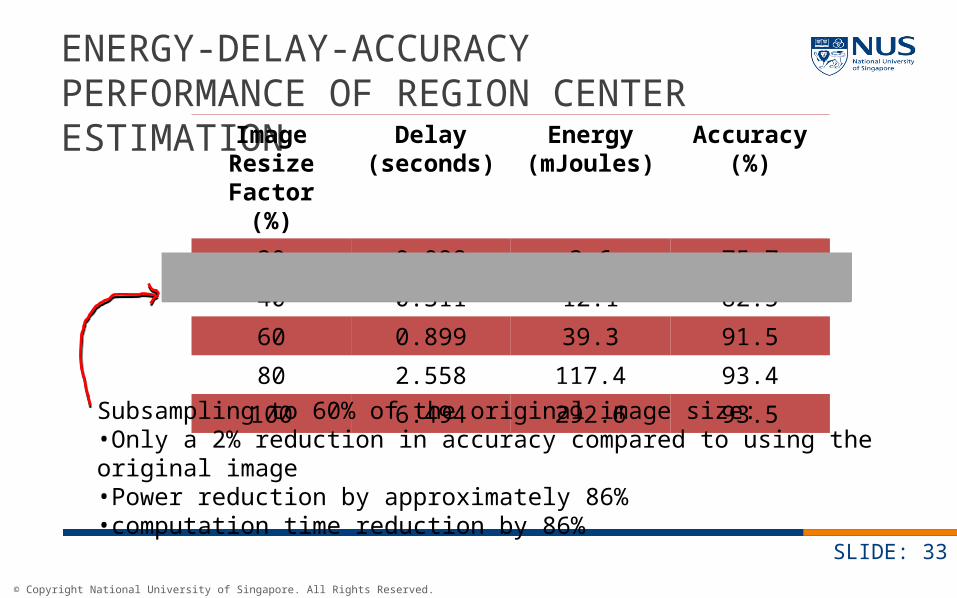
ENERGY-DELAY-ACCURACY PERFORMANCE OF REGION CENTER ESTIMATION
SLIDE: 33
Image Resize Factor (%)
Delay (seconds)
Energy (mJoules)
Accuracy(%)
20 0.098 3.6 75.7
40 0.311 12.1 82.5
60 0.899 39.3 91.5
80 2.558 117.4 93.4
100 6.494 292.6 93.5
Subsampling to 60% of the original image size:•Only a 2% reduction in accuracy compared to using the original image •Power reduction by approximately 86%•computation time reduction by 86%

© Copyright National University of Singapore. All Rights Reserved.
STEP 2: REGION ESTIMATION
SLIDE: 34
Image
Scene
Find region center
Find region center
Super-pixel estimationSuper-pixel estimation
1. Iterate through bounding box around the region center
2. Find best match bounding box with the scene.
1. Iterate through bounding box around the region center
2. Find best match bounding box with the scene.
© Copyright National University of Singapore. All Rights Reserved.
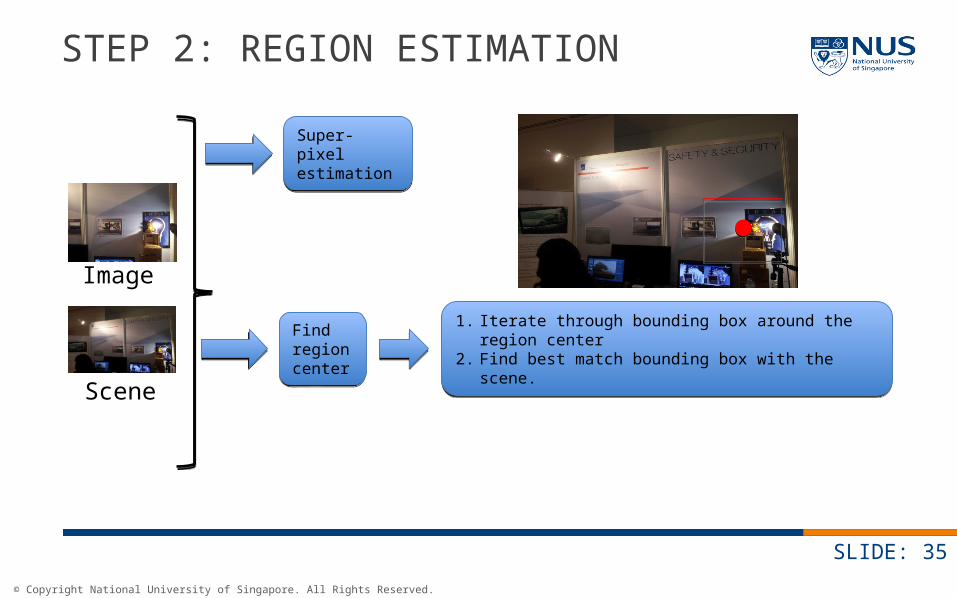
STEP 2: REGION ESTIMATION
SLIDE: 35
Image
Scene
Find region center
Find region center
Super-pixel estimationSuper-pixel estimation
1. Iterate through bounding box around the region center
2. Find best match bounding box with the scene.
1. Iterate through bounding box around the region center
2. Find best match bounding box with the scene.

© Copyright National University of Singapore. All Rights Reserved.
STEP 2: REGION ESTIMATION
SLIDE: 36
Image
Scene
Find region center
Find region center
Super-pixel estimationSuper-pixel estimation
1. Iterate through bounding box around the region center
2. Find best match bounding box with the scene.
1. Iterate through bounding box around the region center
2. Find best match bounding box with the scene.
© Copyright National University of Singapore. All Rights Reserved.
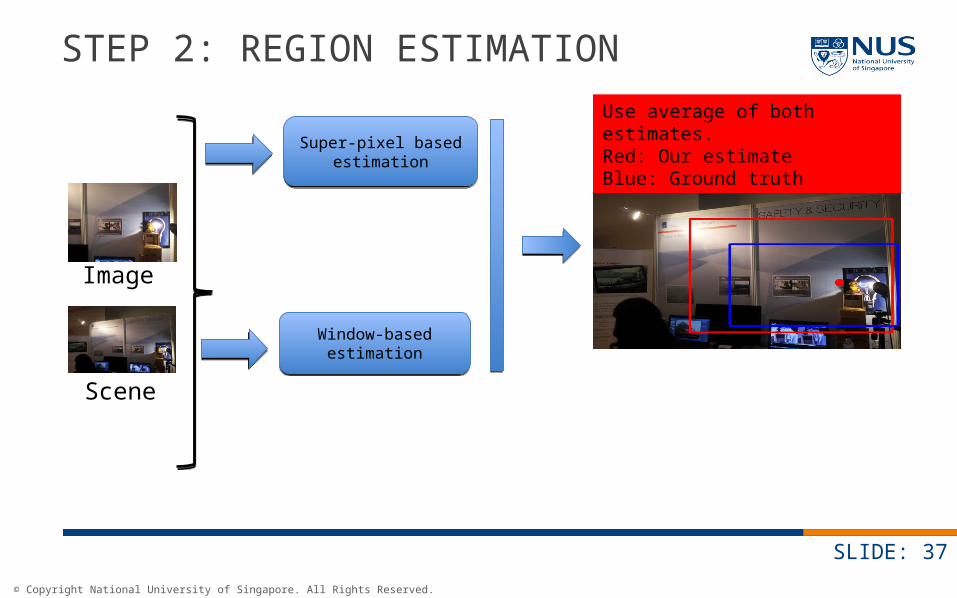
STEP 2: REGION ESTIMATION
SLIDE: 37
Image
Scene
Window-based estimation
Window-based estimation
Super-pixel based estimation
Super-pixel based estimation
Use average of both estimates.Red: Our estimateBlue: Ground truth

© Copyright National University of Singapore. All Rights Reserved.
DEMO: REGION CENTER AND REGION WINDOW ESTIMATION
SLIDE: 38
© Copyright National University of Singapore. All Rights Reserved.
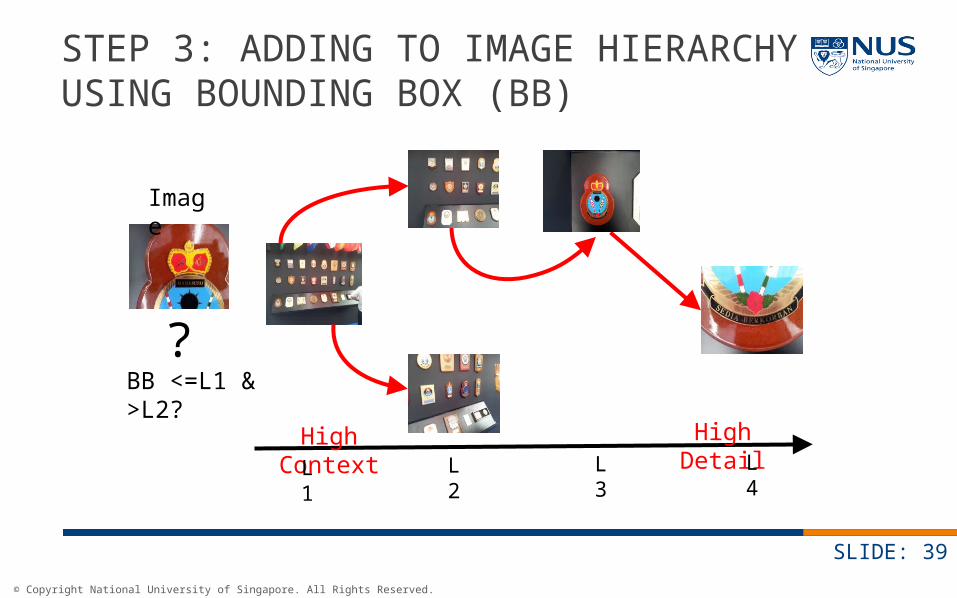
STEP 3: ADDING TO IMAGE HIERARCHY USING BOUNDING BOX (BB)
SLIDE: 39
High Context High Detail
Image
?BB <=L1 & >L2?
L1 L2 L3 L4
© Copyright National University of Singapore. All Rights Reserved.
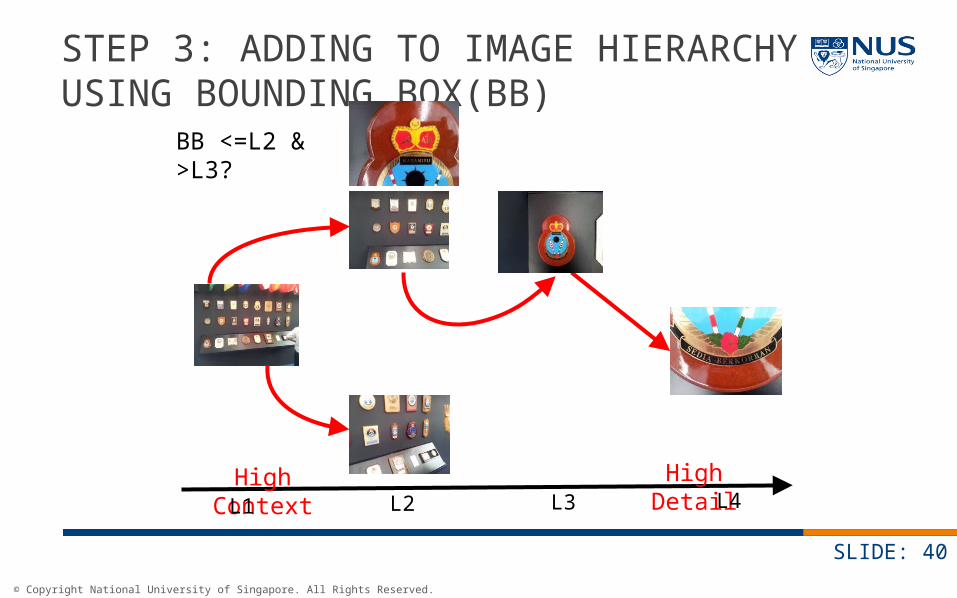
STEP 3: ADDING TO IMAGE HIERARCHY USING BOUNDING BOX(BB)
SLIDE: 40
High Context High Detail
BB <=L2 & >L3?
L1 L2 L3 L4
© Copyright National University of Singapore. All Rights Reserved.
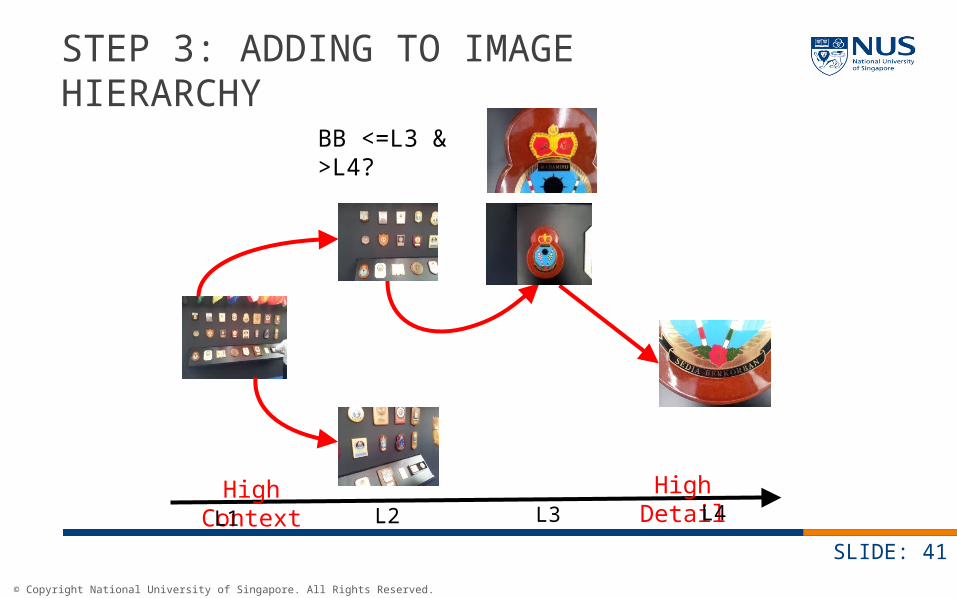
STEP 3: ADDING TO IMAGE HIERARCHY
SLIDE: 41
High Context High Detail
BB <=L3 & >L4?
L1 L2 L3 L4
© Copyright National University of Singapore. All Rights Reserved.
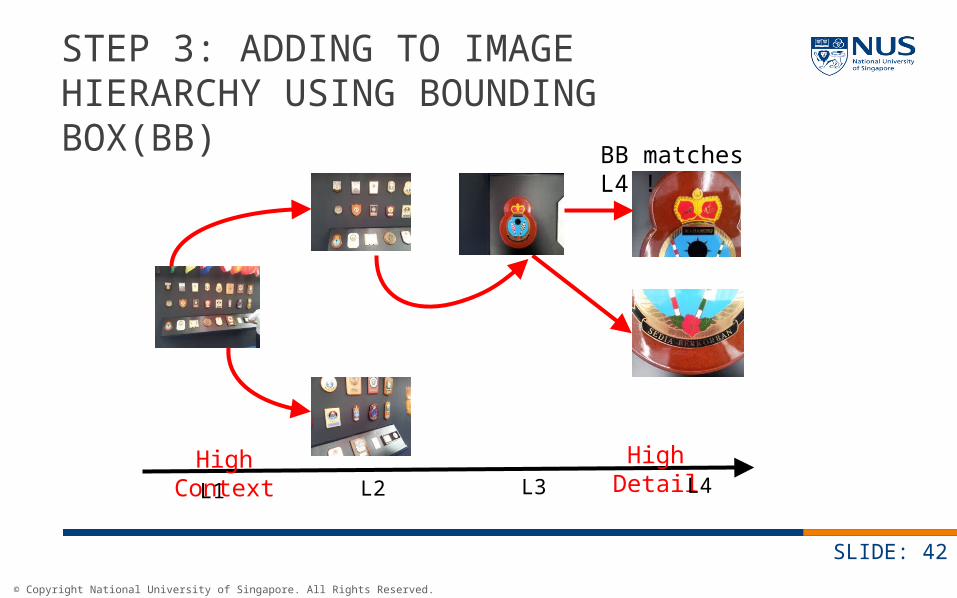
STEP 3: ADDING TO IMAGE HIERARCHY USING BOUNDING BOX(BB)
SLIDE: 42
High Context High Detail
BB matches L4 !
L1 L2 L3 L4

© Copyright National University of Singapore. All Rights Reserved.
DEMO: AUTOLINK IMAGE HIERARCHY
SLIDE: 43
© Copyright National University of Singapore. All Rights Reserved.
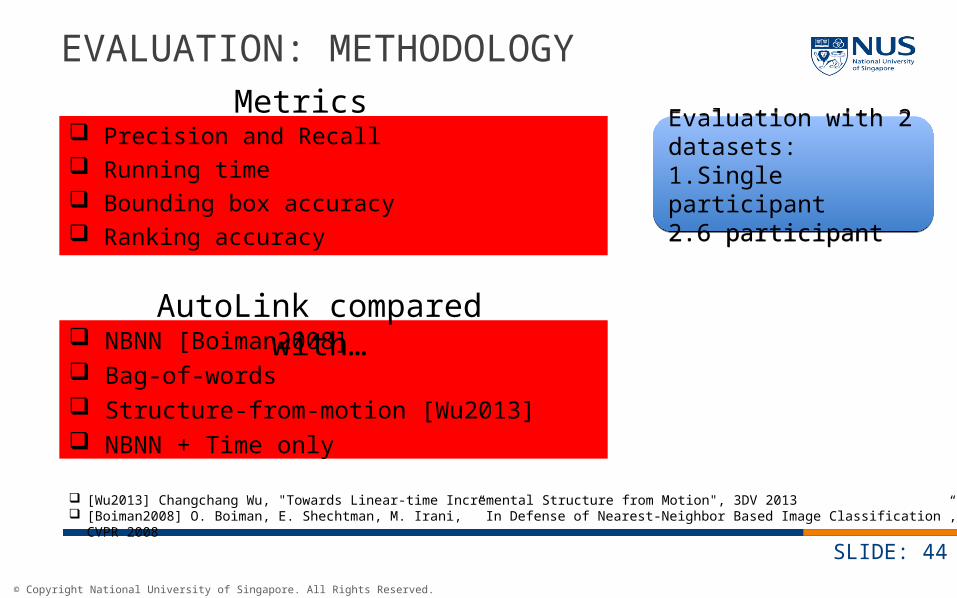
EVALUATION: METHODOLOGY
Precision and Recall Running time Bounding box accuracy Ranking accuracy
SLIDE: 44
Metrics
NBNN [Boiman2008] Bag-of-words Structure-from-motion [Wu2013] NBNN + Time only
AutoLink compared with…
Evaluation with 2 datasets:1.Single participant2.6 participant
Evaluation with 2 datasets:1.Single participant2.6 participant
[Wu2013] Changchang Wu, "Towards Linear-time Incremental Structure from Motion", 3DV 2013 [Boiman2008] O. Boiman, E. Shechtman, M. Irani, ” In Defense of Nearest-Neighbor Based Image Classification”, CVPR 2008

© Copyright National University of Singapore. All Rights Reserved.
EVALUATION: ACCURACY
SLIDE: 45
Dataset Single user Multiple user
Approach Precision Recall Precision Recall
AutoLink 0.7 0.78 0.71 0.51
NBNN + Sensors 0.76 0.38 0.74 0.37
NBNN + Time 0.64 0.73 0.64 0.32
NBNN 0.78 0.1 0.78 0.25
Structure-from-Motion
0.53 0.53 0.37 0.37
Bag-of-Visual words
0.19 0.029 0.19 0.19
Upto 70% precision and 78% recall
BOW poor performance without training
SfM does not classify scenes with similar features
© Copyright National University of Singapore. All Rights Reserved.
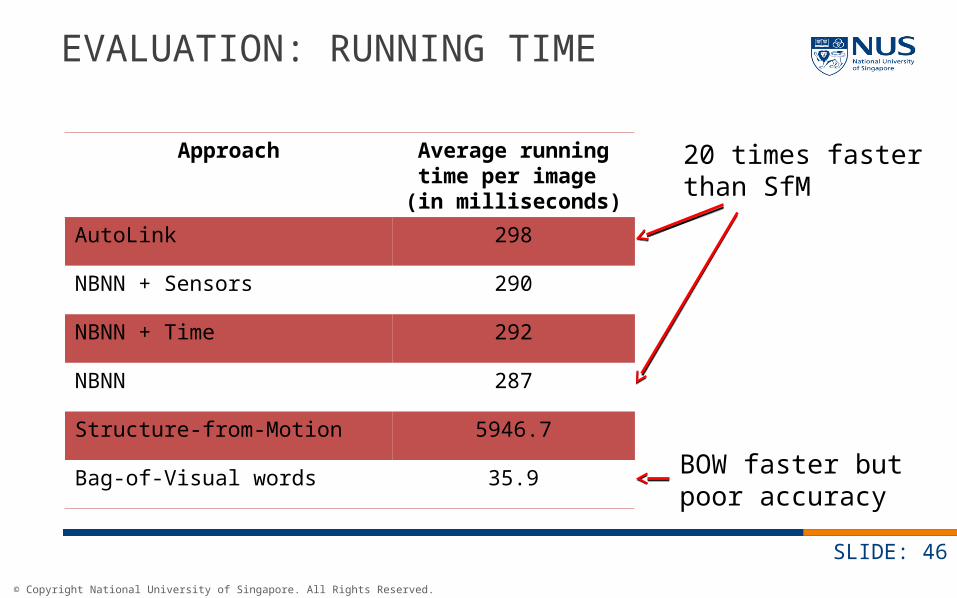
EVALUATION: RUNNING TIME
SLIDE: 46
Approach Average running time per image
(in milliseconds)
AutoLink 298
NBNN + Sensors 290
NBNN + Time 292
NBNN 287
Structure-from-Motion 5946.7
Bag-of-Visual words 35.9
20 times faster than SfM
BOW faster but poor accuracy
© Copyright National University of Singapore. All Rights Reserved.
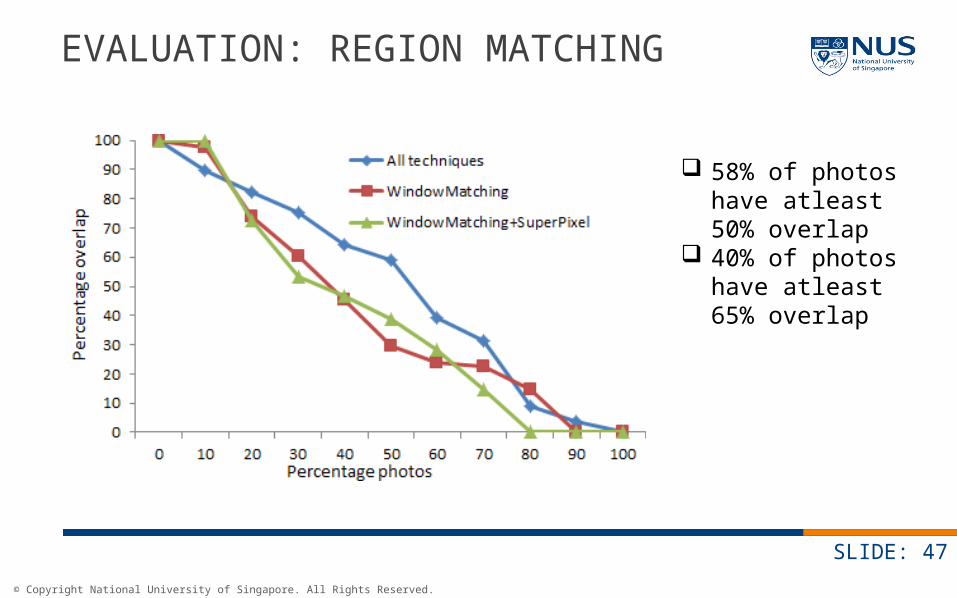
EVALUATION: REGION MATCHING
SLIDE: 47
58% of photos have atleast 50% overlap
40% of photos have atleast 65% overlap
© Copyright National University of Singapore. All Rights Reserved.
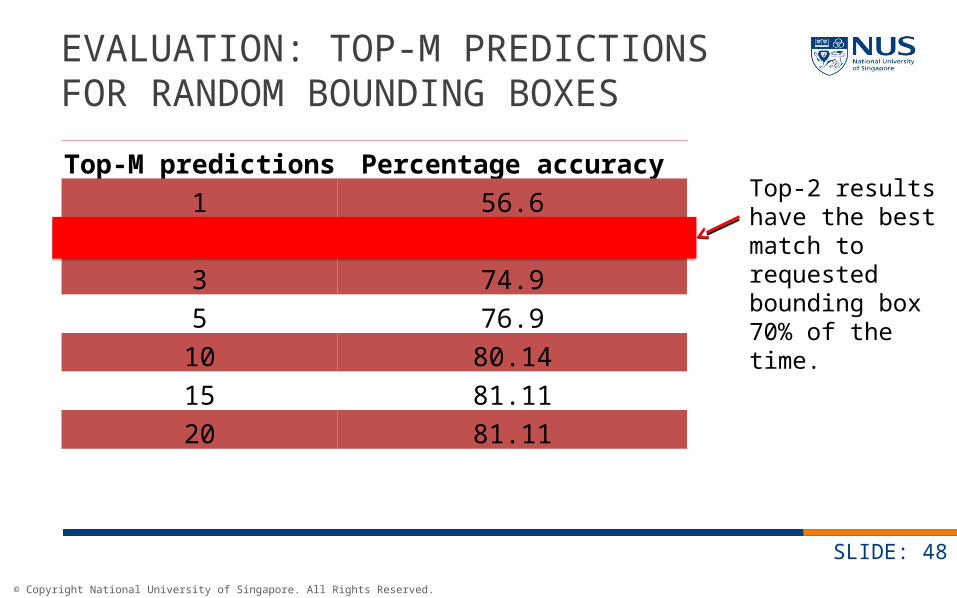
EVALUATION: TOP-M PREDICTIONS FOR RANDOM BOUNDING BOXES
SLIDE: 48
Top-M predictions Percentage accuracy
1 56.6
2 70.4
3 74.9
5 76.9
10 80.14
15 81.11
20 81.11
Top-2 results have the best match to requested bounding box 70% of the time.

© Copyright National University of Singapore. All Rights Reserved.
THANK YOU
© Copyright National University of Singapore. All Rights Reserved.
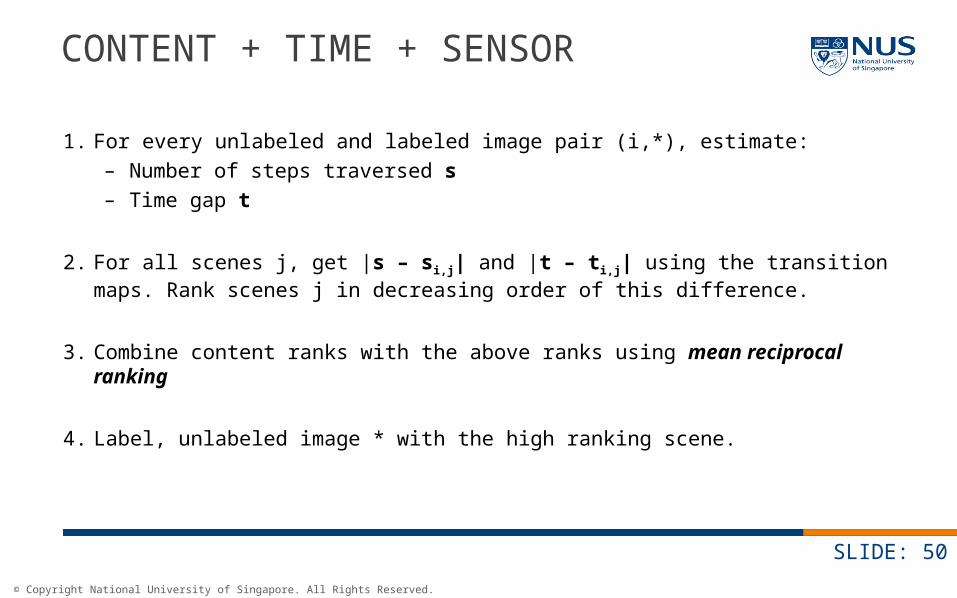
CONTENT + TIME + SENSOR
1. For every unlabeled and labeled image pair (i,*), estimate:– Number of steps traversed s– Time gap t
2. For all scenes j, get |s – si,j| and |t – ti,j| using the transition maps. Rank scenes j in decreasing order of this difference.
3. Combine content ranks with the above ranks using mean reciprocal ranking
4. Label, unlabeled image * with the high ranking scene.
SLIDE: 50
© Copyright National University of Singapore. All Rights Reserved.
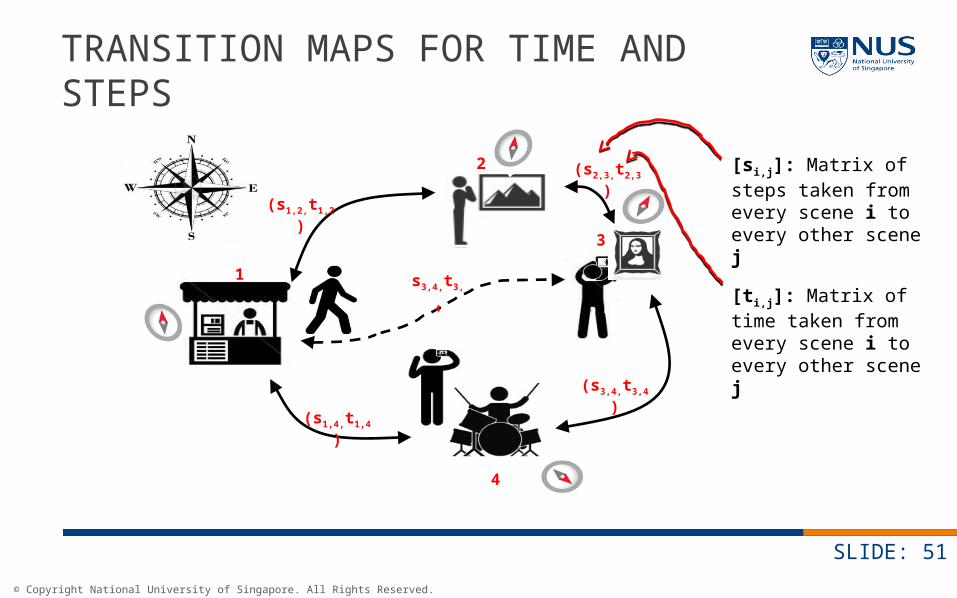
TRANSITION MAPS FOR TIME AND STEPS
SLIDE: 51
3
2
4
1
(s1,2,t1,2)
s3,4,t3,4
(s2,3,t2,3)
(s3,4,t3,4)
(s1,4,t1,4)
[si,j]: Matrix of steps taken from every scene i to every other scene j
[ti,j]: Matrix of time taken from every scene i to every other scene j