Embed Size (px)
Citation preview

© Chia Fah Choy 2005
Topic 2 – Investment Appraisal: Background and Techniques

© Chia Fah Choy 2005
Learning Objectives
After studying this topic you will:• understand the basis of long-term decision making;• be able to use traditional appraisal techniques of
Accounting Rate of Return and Payback;• know the reasons why Discounted Cash Flow (DCF)
techniques are used;• be able to calculate and interpret Net Present Value
(NPV);• understand Internal rate of Return (IRR);• know what is meant by the Excess Present Value Index;• understand the effects of inflation on investment
appraisal

© Chia Fah Choy 2005
Long Run Decision Making
Assuming that finance is available the decision to invest will be based on three major factors:
• The investor’s beliefs in the future• The alternative available in which to invest• The investor’s attitude to risk
© Chia Fah Choy 2005
Traditional Investment Appraisal Techniques
• Accounting rate of return
• Payback
© Chia Fah Choy 2005
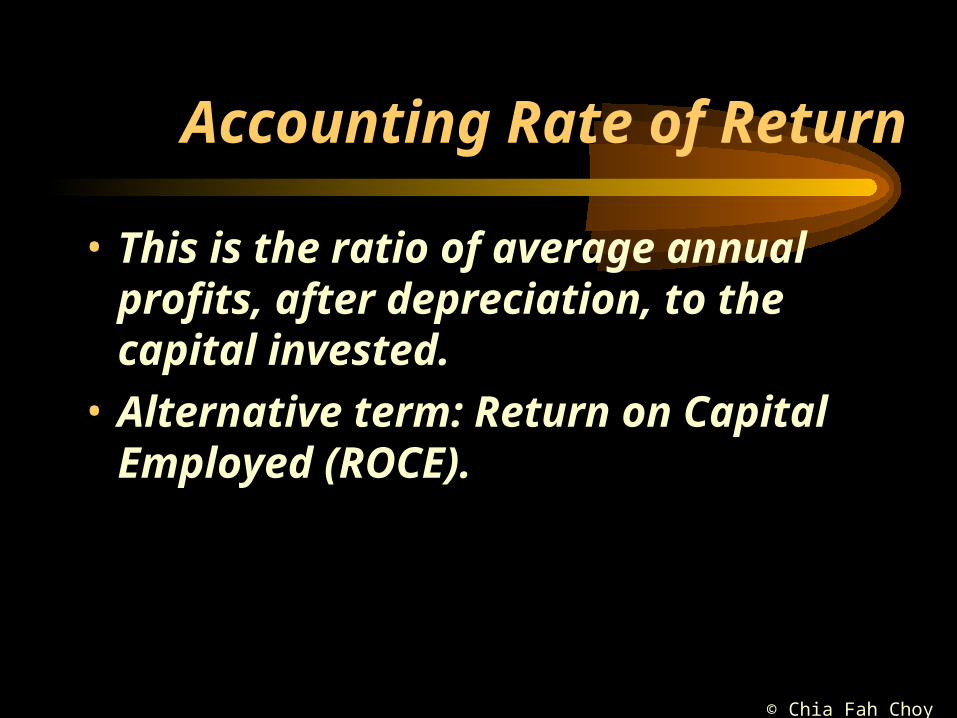
Accounting Rate of Return
• This is the ratio of average annual profits, after depreciation, to the capital invested.
• Alternative term: Return on Capital Employed (ROCE).

© Chia Fah Choy 2005
A firm is considering three projects each with an initial investment of $1,000 and a life of 5 years. The profits generated by the projects are estimated to be as follows:
Year Project I Project II Project III
1 200 350 150
2 200 200 150
3 200 150 150
4 200 150 200
5 200 150 350
Total 1,000 1,000 1,000
After tax and depreciation profits
Calculate the accounting rate of return (ARR) ona. Initial capitalb. Average capital
Example 1
© Chia Fah Choy 2005
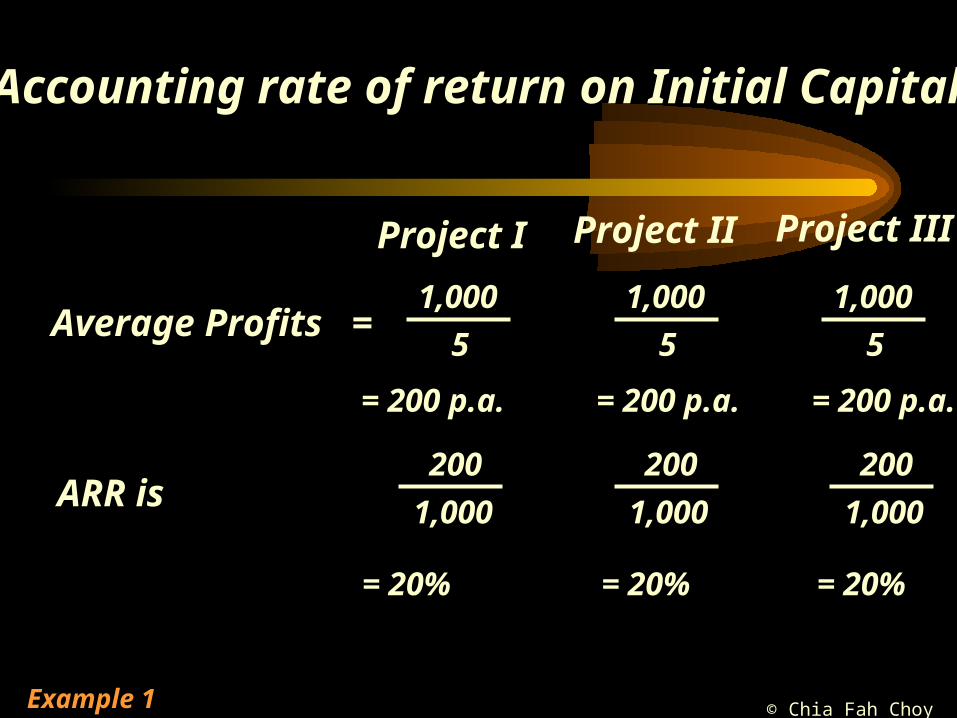
Accounting rate of return on Initial Capital
Project I Project II Project III
Average Profits =1,000
5
1,000
5
1,000
5
= 200 p.a. = 200 p.a. = 200 p.a.
200
1,000
= 20%
ARR is200
1,000
= 20%
200
1,000
= 20%
Example 1

© Chia Fah Choy 2005
Accounting rate of return on Average Capital
Project I Project II Project III
Average capital =1,000
2
1,000
2
1,000
2
= 500 = 500 = 500
200
500
= 40%
ARR is
= 40% = 40%
200
500
200
500
Example 1

© Chia Fah Choy 2005
Payback
• A period, usually expressed in years which it takes for the project’s net cash inflows to recoup the original investment.
• The usual decision rules is to accept the project with the shortest payback period.
© Chia Fah Choy 2005
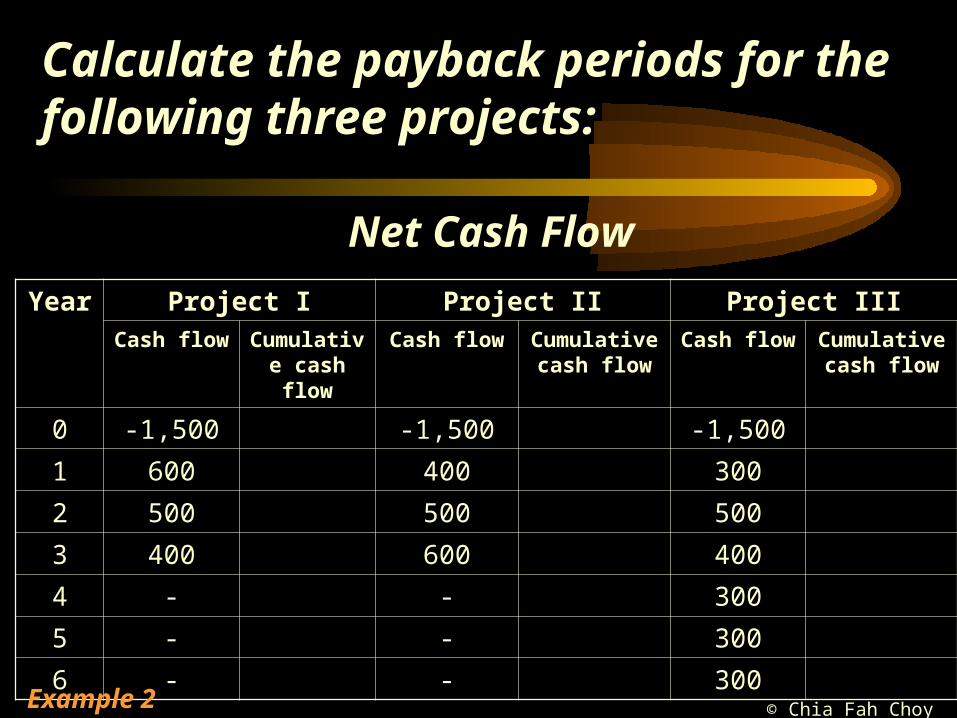
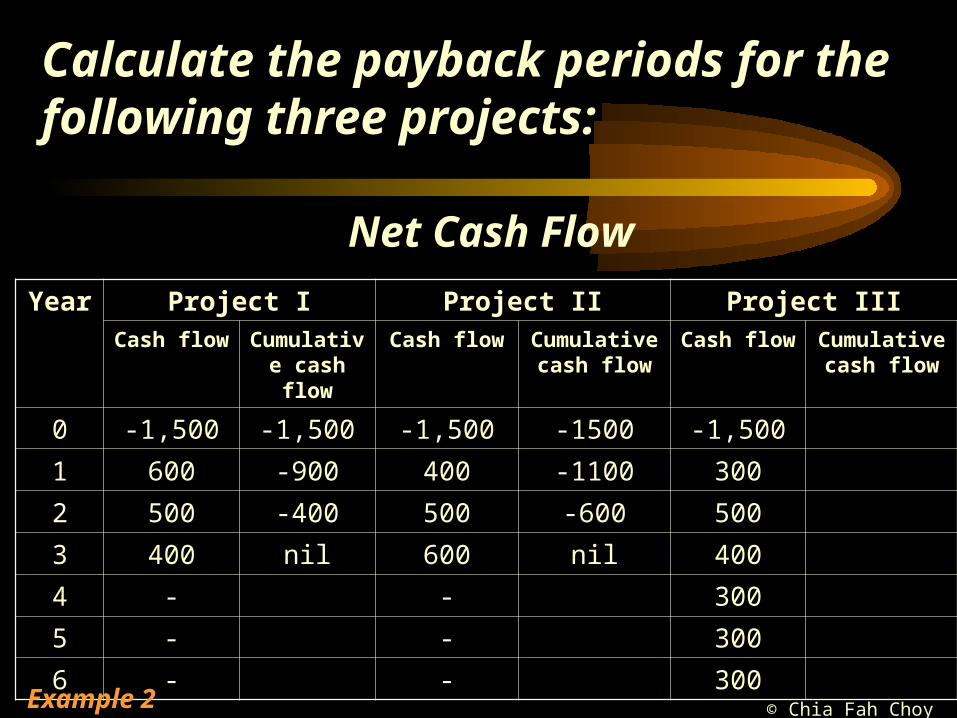
Calculate the payback periods for the following three projects:
Year Project I Project II Project IIICash flow Cumulative
cash flowCash flow Cumulative
cash flowCash flow Cumulative
cash flow
0 -1,500 -1,500 -1,500
1 600 400 300
2 500 500 500
3 400 600 400
4 - - 300
5 - - 300
6 - - 300
Net Cash Flow
Example 2

© Chia Fah Choy 2005
Calculate the payback periods for the following three projects:
Year Project I Project II Project IIICash flow Cumulative
cash flowCash flow Cumulative
cash flowCash flow Cumulative
cash flow
0 -1,500 -1,500 -1,500 -1,500
1 600 -900 400 300
2 500 -400 500 500
3 400 nil 600 400
4 - - 300
5 - - 300
6 - - 300
Net Cash Flow
Example 2
© Chia Fah Choy 2005
Calculate the payback periods for the following three projects:
Year Project I Project II Project IIICash flow Cumulative
cash flowCash flow Cumulative
cash flowCash flow Cumulative
cash flow
0 -1,500 -1,500 -1,500 -1500 -1,500
1 600 -900 400 -1100 300
2 500 -400 500 -600 500
3 400 nil 600 nil 400
4 - - 300
5 - - 300
6 - - 300
Net Cash Flow
Example 2
© Chia Fah Choy 2005
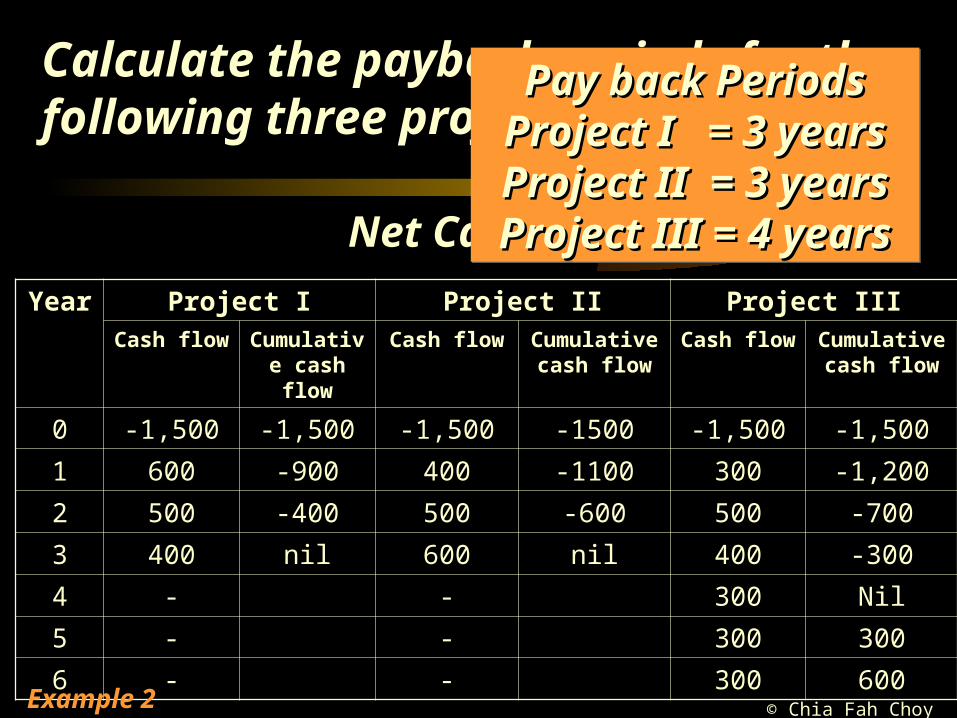
Calculate the payback periods for the following three projects:
Year Project I Project II Project IIICash flow Cumulative
cash flowCash flow Cumulative
cash flowCash flow Cumulative
cash flow
0 -1,500 -1,500 -1,500 -1500 -1,500 -1,500
1 600 -900 400 -1100 300 -1,200
2 500 -400 500 -600 500 -700
3 400 nil 600 nil 400 -300
4 - - 300 Nil
5 - - 300 300
6 - - 300 600
Net Cash Flow
Pay back PeriodsPay back PeriodsProject I = 3 yearsProject I = 3 yearsProject II = 3 yearsProject II = 3 yearsProject III = 4 yearsProject III = 4 years
Pay back PeriodsPay back PeriodsProject I = 3 yearsProject I = 3 yearsProject II = 3 yearsProject II = 3 yearsProject III = 4 yearsProject III = 4 years
Example 2
© Chia Fah Choy 2005
Discounted Cash Flow (DCF)
• Net Present Value (NPV)
• Internal Rate of Return (IRR)
© Chia Fah Choy 2005
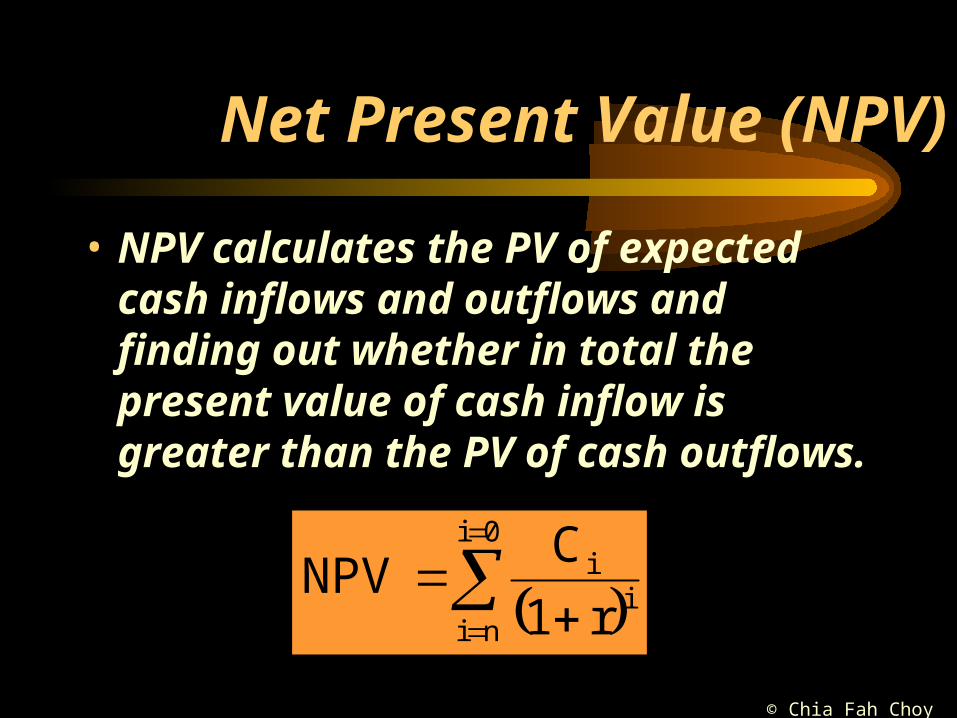
Net Present Value (NPV)
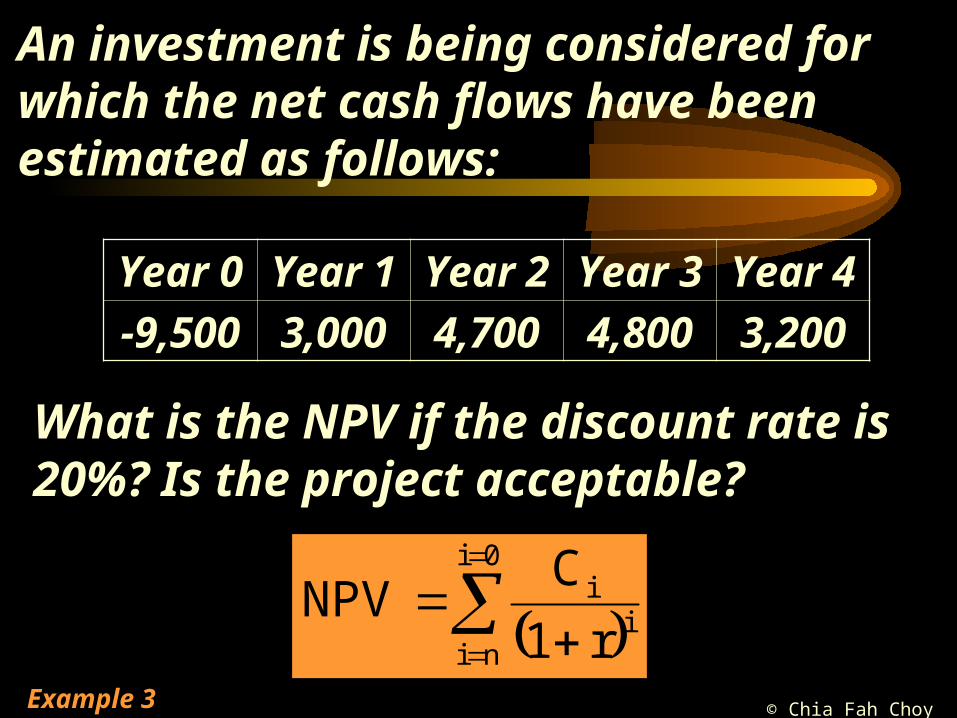
• NPV calculates the PV of expected cash inflows and outflows and finding out whether in total the present value of cash inflow is greater than the PV of cash outflows.
ii
0i
ni r1
CNPV

© Chia Fah Choy 2005
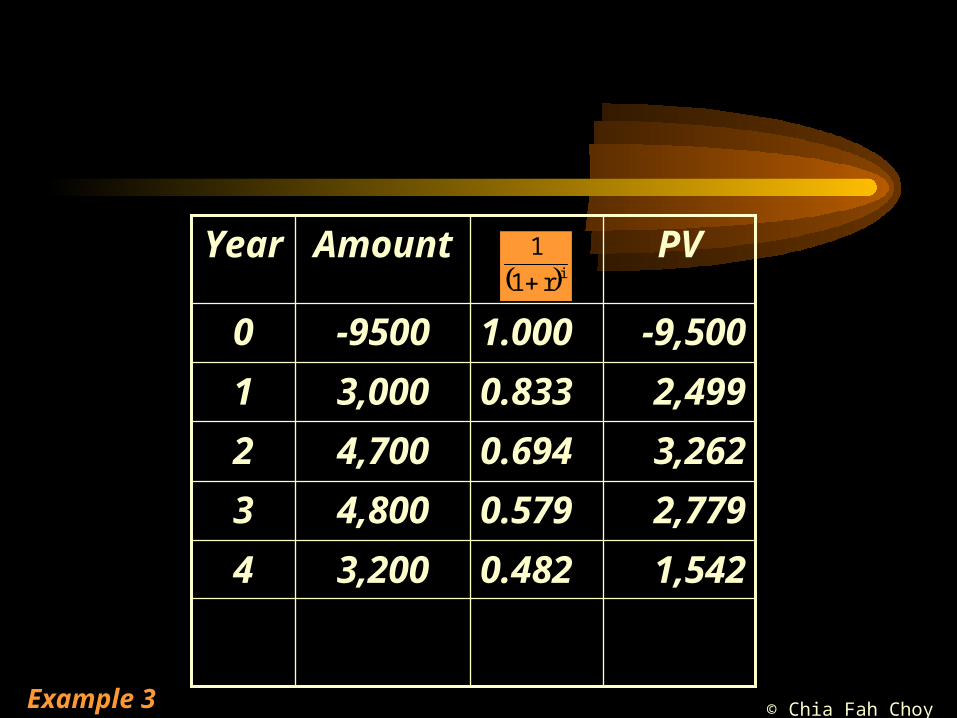
An investment is being considered for which the net cash flows have been estimated as follows:
What is the NPV if the discount rate is 20%? Is the project acceptable?
Year 0 Year 1 Year 2 Year 3 Year 4
-9,500 3,000 4,700 4,800 3,200
Example 3
© Chia Fah Choy 2005
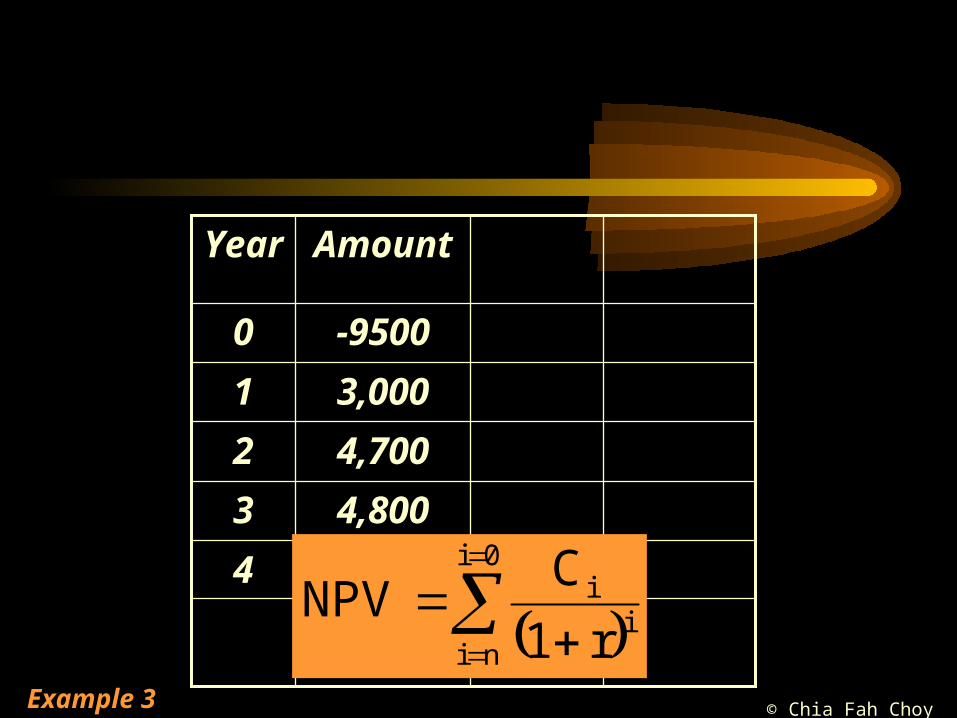
An investment is being considered for which the net cash flows have been estimated as follows:
What is the NPV if the discount rate is 20%? Is the project acceptable?
Year 0 Year 1 Year 2 Year 3 Year 4
-9,500 3,000 4,700 4,800 3,200
ii
0i
ni r1
CNPV
Example 3
© Chia Fah Choy 2005
3,2004
AmountYear
-95000
4,8003
4,7002
3,0001
ii
0i
ni r1
CNPV
Example 3
© Chia Fah Choy 2005
3,2004
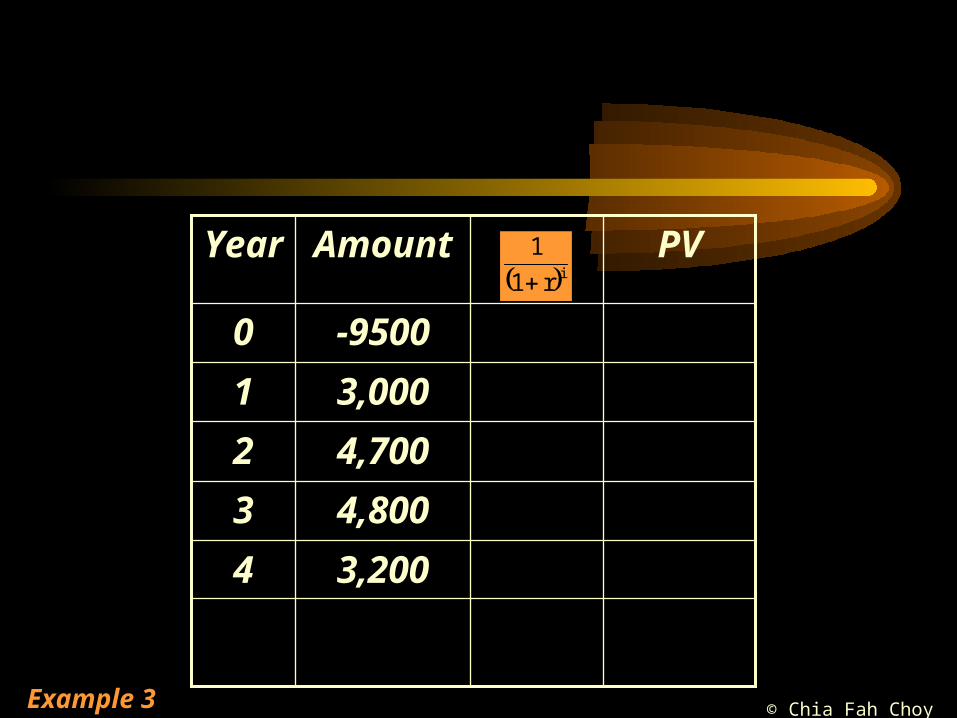
PVAmountYear
-95000
4,8003
4,7002
3,0001
ir1
1
Example 3
© Chia Fah Choy 2005
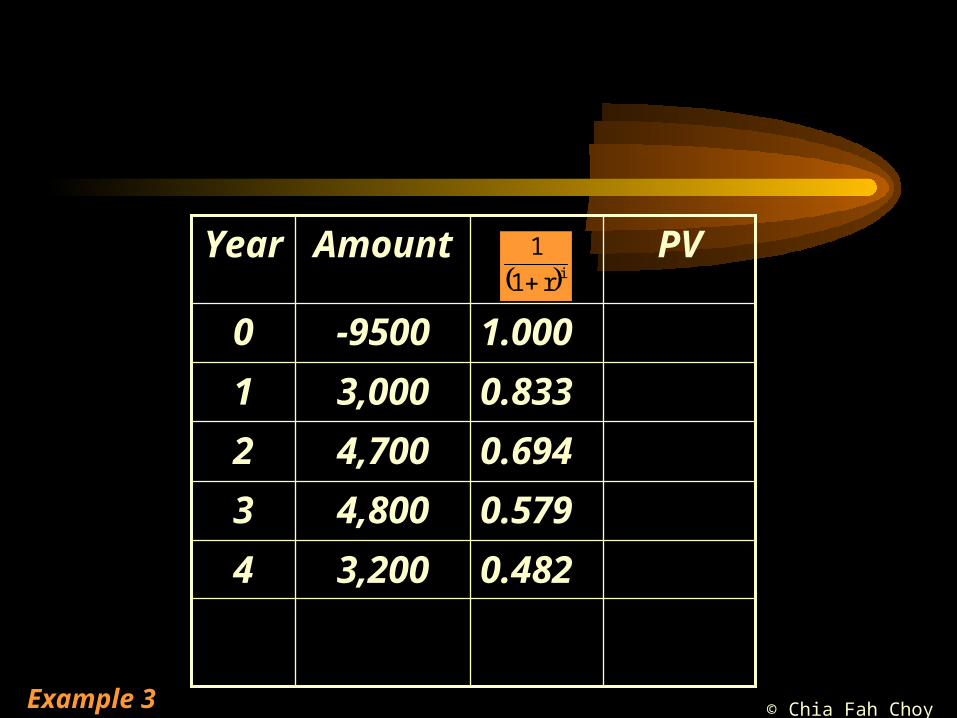
0.4823,2004
0.579
0.694
0.833
1.000
PVAmountYear
-95000
4,8003
4,7002
3,0001
ir1
1
Example 3
© Chia Fah Choy 2005
1,5420.4823,2004
0.579
0.694
0.833
1.000
PVAmountYear
-9,500-95000
2,7794,8003
3,2624,7002
2,4993,0001
ir1
1
Example 3
© Chia Fah Choy 2005
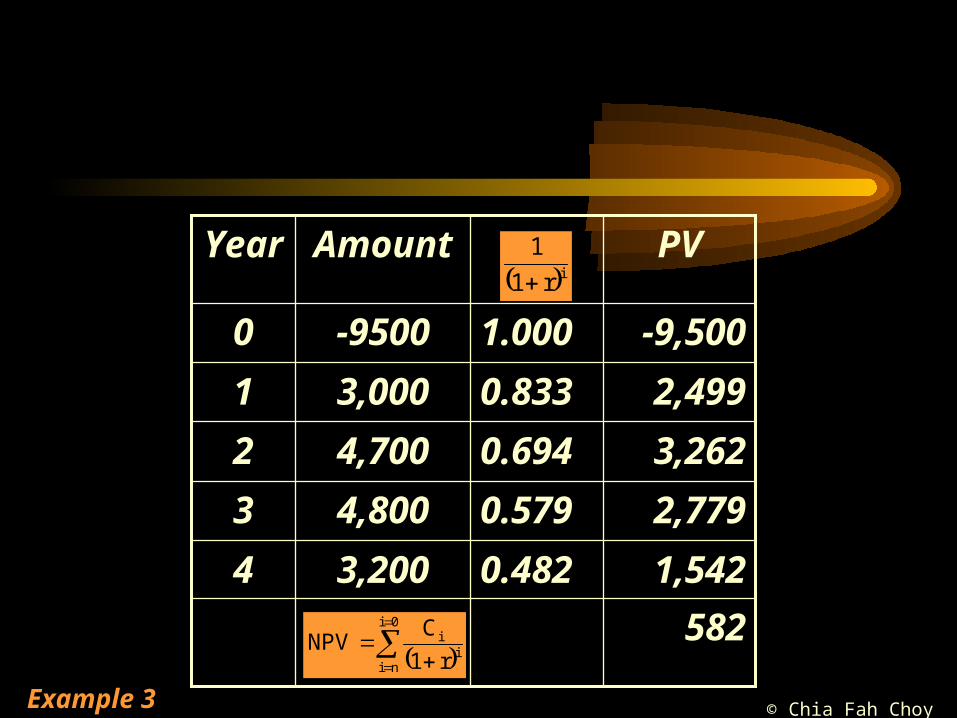
1,5420.4823,2004
0.579
0.694
0.833
1.000
PVAmountYear
-9,500-95000
582
2,7794,8003
3,2624,7002
2,4993,0001
ir1
1
ii
0i
ni r1
CNPV
Example 3
© Chia Fah Choy 2005
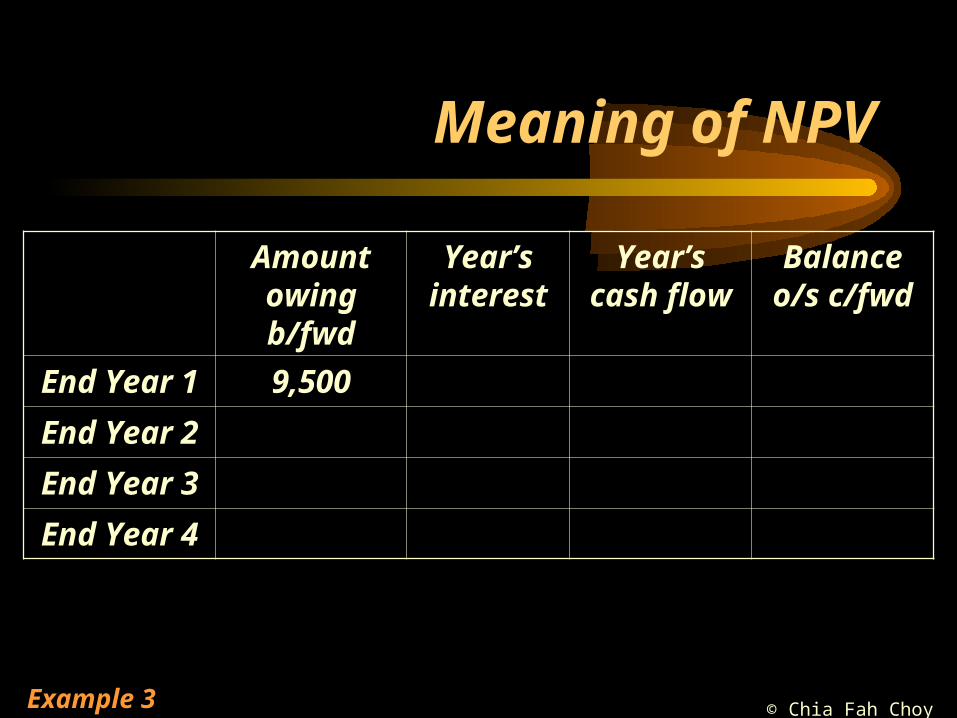
Meaning of NPV
Amount owing b/fwd
Year’s interest
Year’s cash flow
Balance o/s c/fwd
End Year 1 9,500
End Year 2
End Year 3
End Year 4
Example 3
© Chia Fah Choy 2005
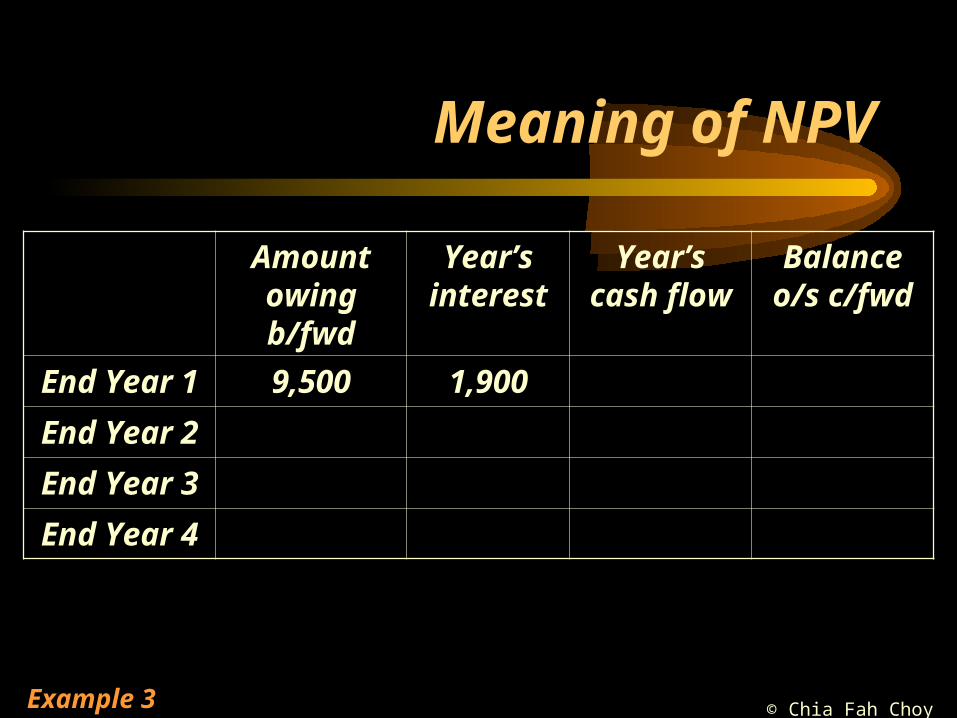
Meaning of NPV
Amount owing b/fwd
Year’s interest
Year’s cash flow
Balance o/s c/fwd
End Year 1 9,500 1,900
End Year 2
End Year 3
End Year 4
Example 3

© Chia Fah Choy 2005
Meaning of NPV
Amount owing b/fwd
Year’s interest
Year’s cash flow
Balance o/s c/fwd
End Year 1 9,500 1,900 3,000
End Year 2
End Year 3
End Year 4
Example 3

© Chia Fah Choy 2005
Meaning of NPV
Amount owing b/fwd
Year’s interest
Year’s cash flow
Balance o/s c/fwd
End Year 1 9,500 1,900 3,000 8,400
End Year 2
End Year 3
End Year 4
Example 3

© Chia Fah Choy 2005
Meaning of NPV
Amount owing b/fwd
Year’s interest
Year’s cash flow
Balance o/s c/fwd
End Year 1 9,500 1,900 3,000 8,400
End Year 2 8,400
End Year 3
End Year 4
Example 3

© Chia Fah Choy 2005
Meaning of NPV
Amount owing b/fwd
Year’s interest
Year’s cash flow
Balance o/s c/fwd
End Year 1 9,500 1,900 3,000 8,400
End Year 2 8,400 1,680 4,700 5,380
End Year 3
End Year 4
Example 3

© Chia Fah Choy 2005
Meaning of NPV
Amount owing b/fwd
Year’s interest
Year’s cash flow
Balance o/s c/fwd
End Year 1 9,500 1,900 3,000 8,400
End Year 2 8,400 1,680 4,700 5,380
End Year 3 5,380 1,076 4,800 1,656
End Year 4
Example 3

© Chia Fah Choy 2005
Meaning of NPV
Amount owing b/fwd
Year’s interest
Year’s cash flow
Balance o/s c/fwd
End Year 1 9,500 1,900 3,000 8,400
End Year 2 8,400 1,680 4,700 5,380
End Year 3 5,380 1,076 4,800 1,656
End Year 4 1,656 331 3,200 1,213
Example 3
© Chia Fah Choy 2005
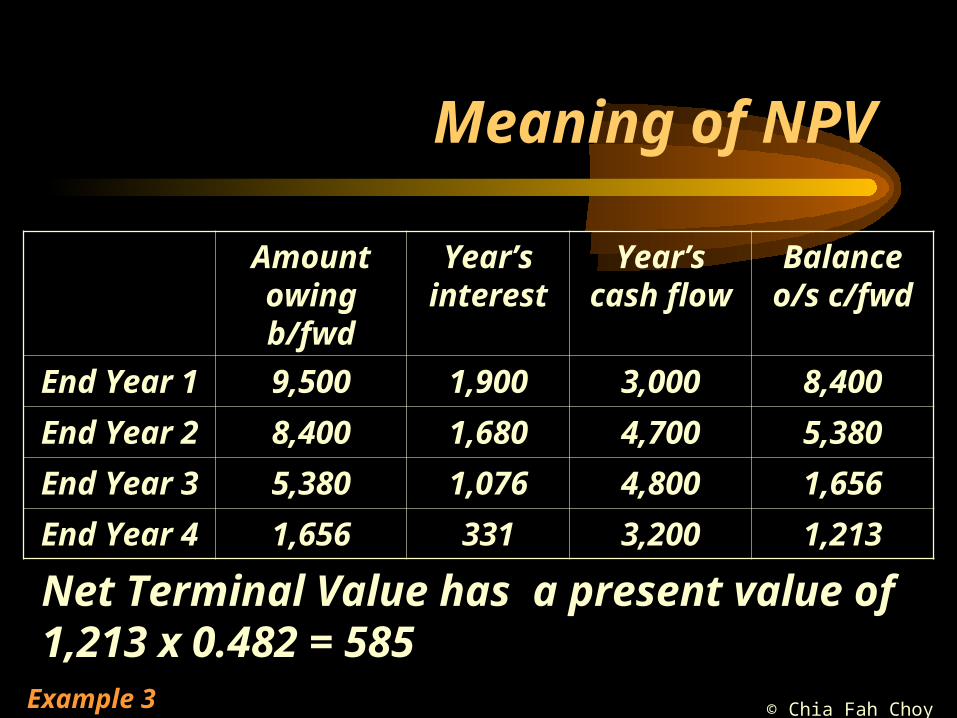
Meaning of NPV
Amount owing b/fwd
Year’s interest
Year’s cash flow
Balance o/s c/fwd
End Year 1 9,500 1,900 3,000 8,400
End Year 2 8,400 1,680 4,700 5,380
End Year 3 5,380 1,076 4,800 1,656
End Year 4 1,656 331 3,200 1,213
Net Terminal Value has a present value of 1,213 x 0.482 = 585
Example 3
© Chia Fah Choy 2005
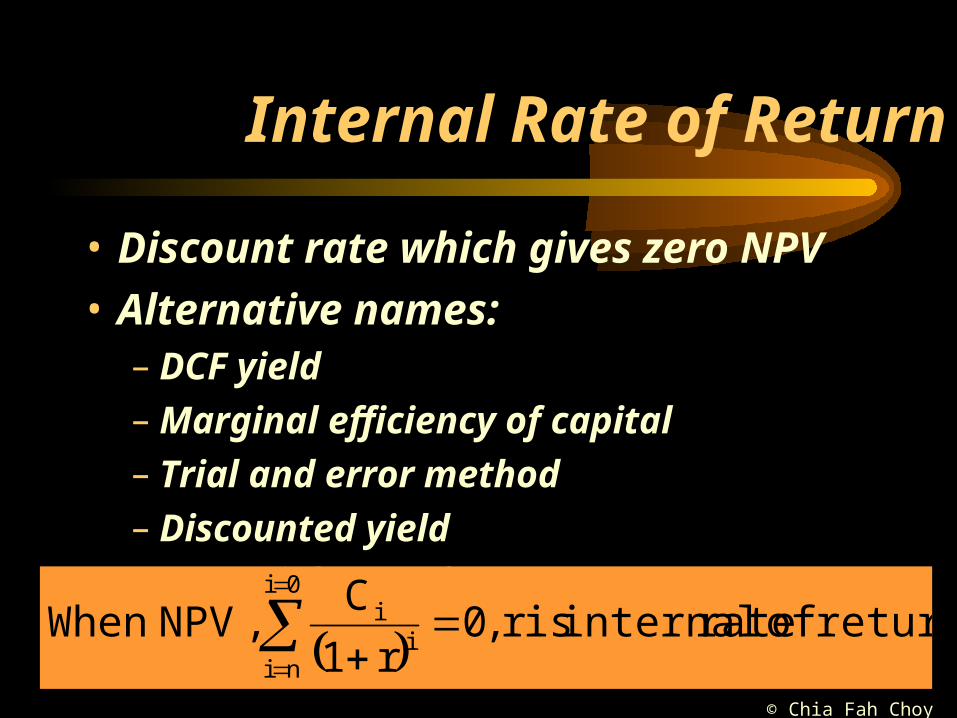
Internal Rate of Return
• Discount rate which gives zero NPV
• Alternative names:– DCF yield– Marginal efficiency of capital– Trial and error method– Discounted yield– Actuarial rate of return
return. of rate internal isr ,0
r1
C,NPVWhen i
i0i
ni
© Chia Fah Choy 2005
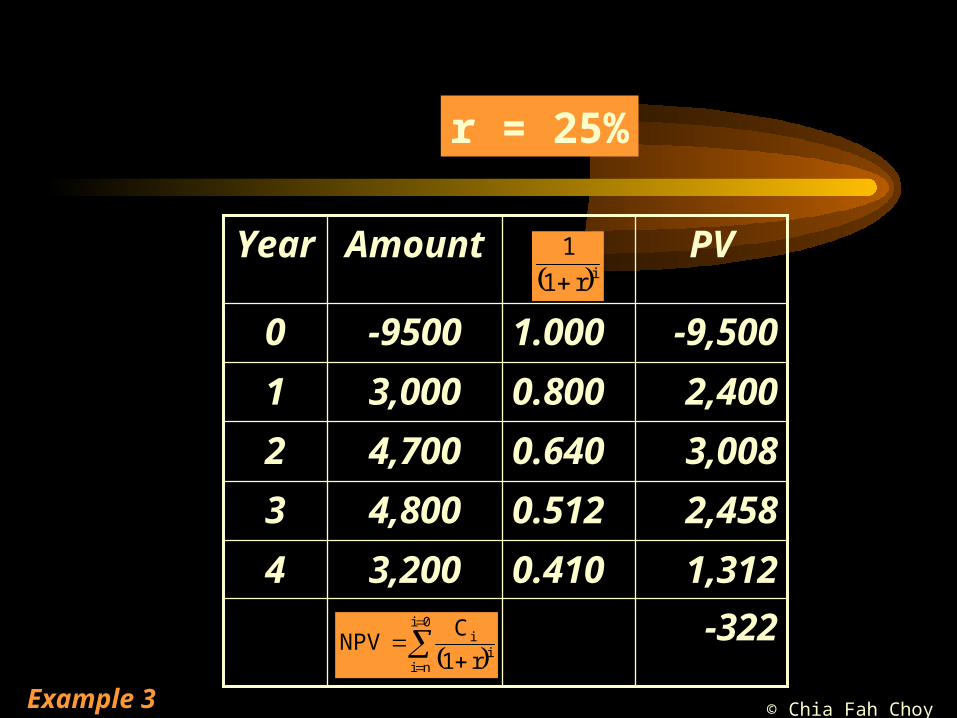
1,3120.4103,2004
0.512
0.640
0.800
1.000
PVAmountYear
-9,500-95000
-322
2,4584,8003
3,0084,7002
2,4003,0001
ir1
1
ii
0i
ni r1
CNPV
r = 25%
Example 3
© Chia Fah Choy 2005
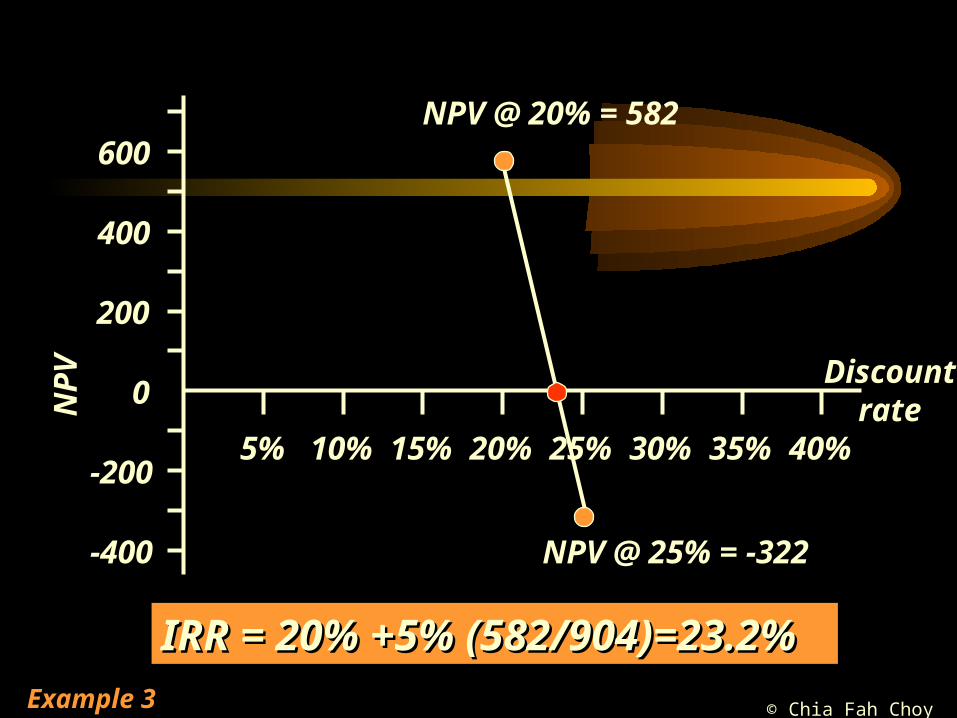
-200
-400
200
400
600
0NP
V
5% 10% 15% 20% 25% 30% 35% 40%
Discount rate
NPV @ 20% = 582
NPV @ 25% = -322
IRR = 20% +5% (582/904)=23.2%IRR = 20% +5% (582/904)=23.2%Example 3

© Chia Fah Choy 2005
Decision rule using IRR
• Where the calculated IRR is greater than the company’s cost of capital then the project is acceptable.
© Chia Fah Choy 2005
NPV and IRR compared
• Accept/reject decisions
• Absolute and relative measures
• Mutually exclusive projects
© Chia Fah Choy 2005
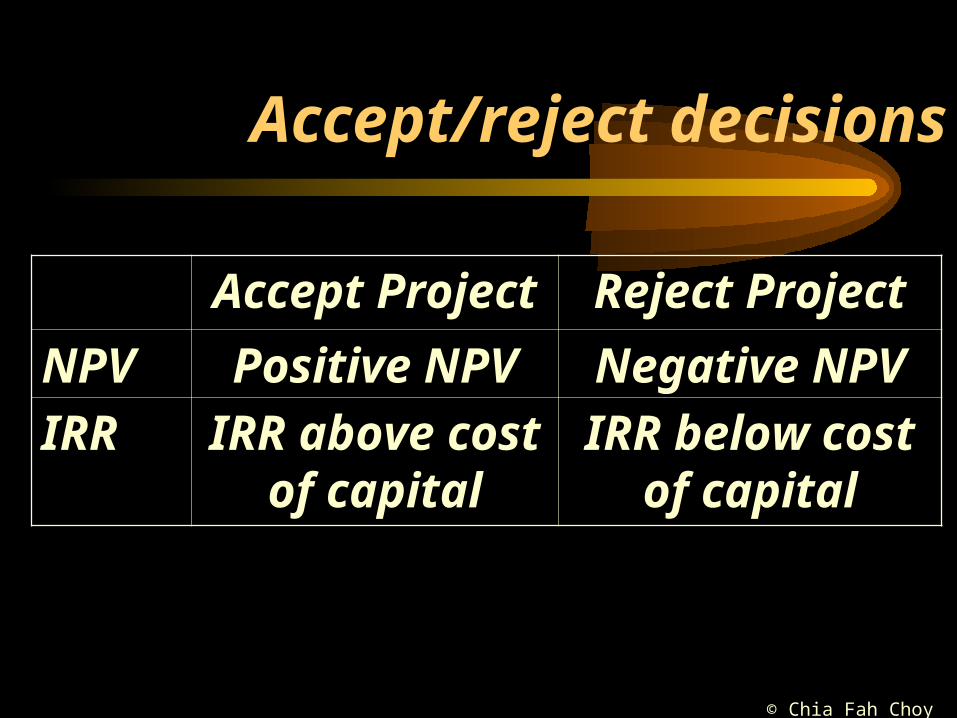
Accept/reject decisions
Accept Project Reject Project
NPV Positive NPV Negative NPV
IRR IRR above cost of capital
IRR below cost of capital

© Chia Fah Choy 2005
Absolute and relative measures
• NPV is an absolute measure of the return on a project
• IRR is a relative measure relating the size and timing of the cash flows to the initial investment

© Chia Fah Choy 2005
Assume a project has the following cash flows:
Project acceptable by both methods – assuming 10% is the cost of capital.
Year 0 Year 5
Project x -20,000 40,241
NPV@10% 4,990
IRR 15%
Now assume that the project is scaled up by a factor of 10.
Year 0 Year 5
Project 10x -200,000 402,410
NPV@10% 49,900
IRR 15%
The NPV method clearly discriminates between Project X and Project 10X whereas the IRR remains unchanged at 15%.
Example 4

© Chia Fah Choy 2005
Mutually exclusive projects
• Only one of several alternative projects can be chosen
© Chia Fah Choy 2005
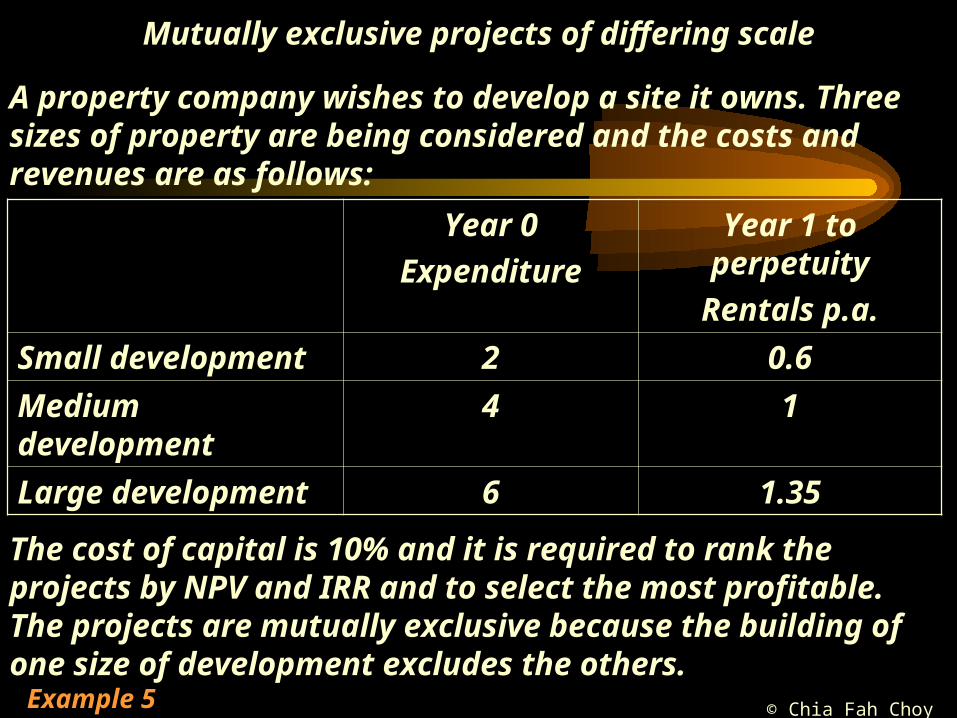
Mutually exclusive projects of differing scale
A property company wishes to develop a site it owns. Three sizes of property are being considered and the costs and revenues are as follows:
Year 0
Expenditure
Year 1 to perpetuity
Rentals p.a.
Small development 2 0.6
Medium development
4 1
Large development 6 1.35
The cost of capital is 10% and it is required to rank the projects by NPV and IRR and to select the most profitable.The projects are mutually exclusive because the building of one size of development excludes the others.
Example 5

© Chia Fah Choy 2005
Expenditure P.V. of rentals
NPV IRR %
Small 2 6 4 30
Medium 4 10 6 25
Large 6 13.5 7.5 22.5
Incremental expenditure
Incremental rental
Incremental IRR
Stage 1 (small) 2 0.6 30Stage 2 (medium - small) 2 0.4 20Stage 3 (large - medium) 2 0.35 17.5
Example 5
Ranking of NPV and IRR
Incremental IRR
© Chia Fah Choy 2005
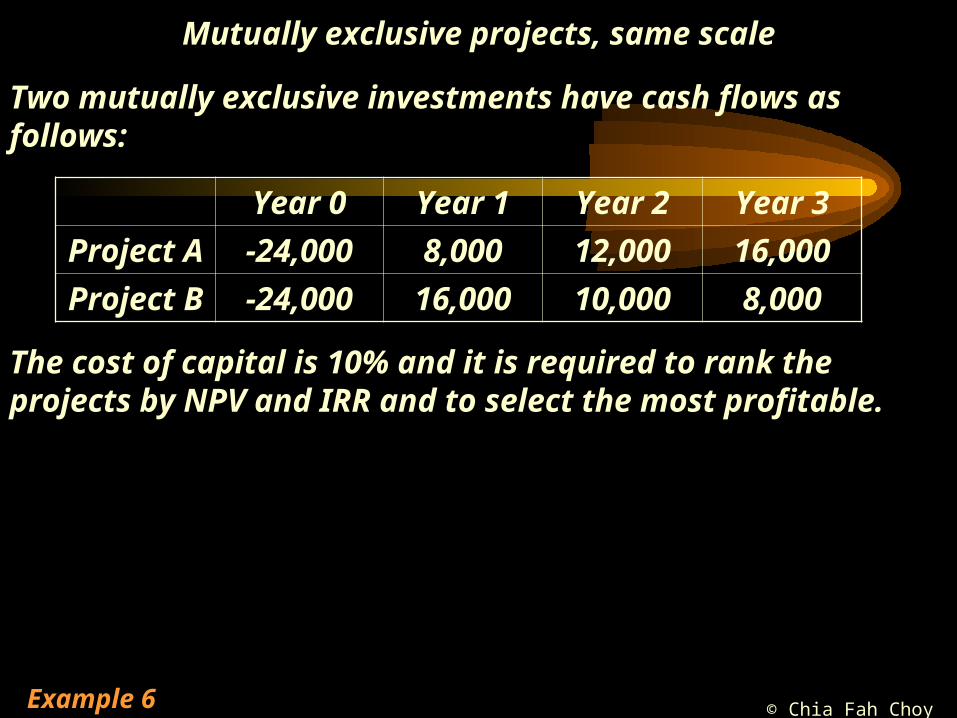
Mutually exclusive projects, same scale
Two mutually exclusive investments have cash flows as follows:
Year 0 Year 1 Year 2 Year 3
Project A -24,000 8,000 12,000 16,000
Project B -24,000 16,000 10,000 8,000
The cost of capital is 10% and it is required to rank the projects by NPV and IRR and to select the most profitable.
Example 6
© Chia Fah Choy 2005
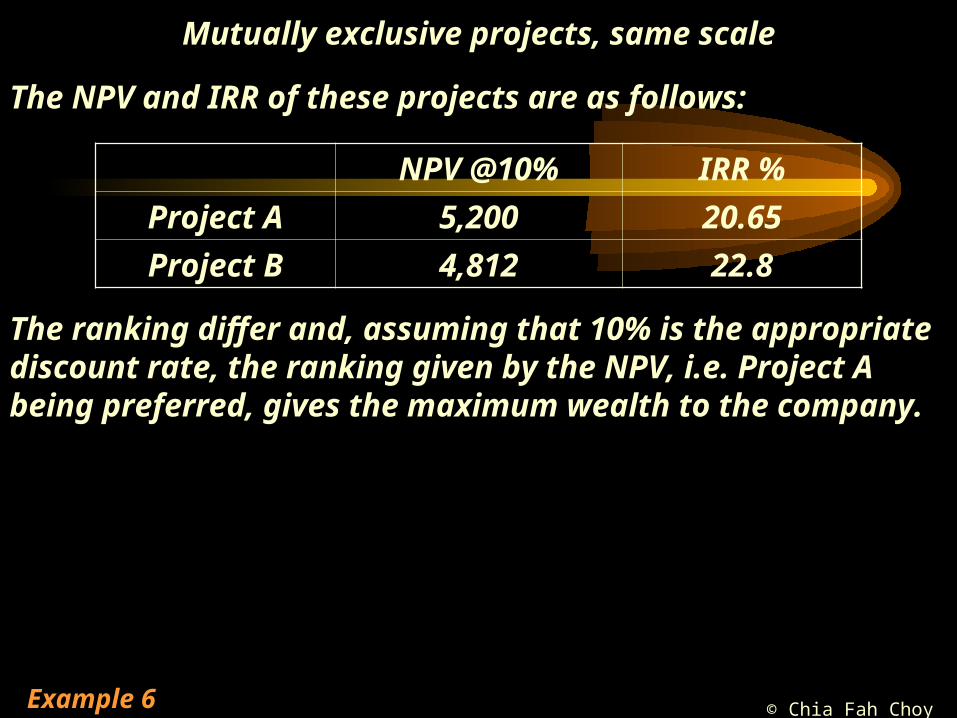
Mutually exclusive projects, same scale
The NPV and IRR of these projects are as follows:
NPV @10% IRR %
Project A 5,200 20.65
Project B 4,812 22.8
The ranking differ and, assuming that 10% is the appropriate discount rate, the ranking given by the NPV, i.e. Project A being preferred, gives the maximum wealth to the company.
Example 6

© Chia Fah Choy 2005
Non-conventional cash flows

© Chia Fah Choy 2005
Examples of Non-Conventional Cash-Flow Patterns
Year 0 Year 1 Year 2
Project X -2,000 4,700 -2,750
Project Y 2,000 -4,000 4000
• Project X has 2 outflows and is thus non-conventional
• Project Y has an outflow in a year’s time instead of initially and is thus non-conventional
• When a project has non-conventional cash flows it may have– One IRR
– Multiple IRRs
– No IRR
Example 7
© Chia Fah Choy 2005
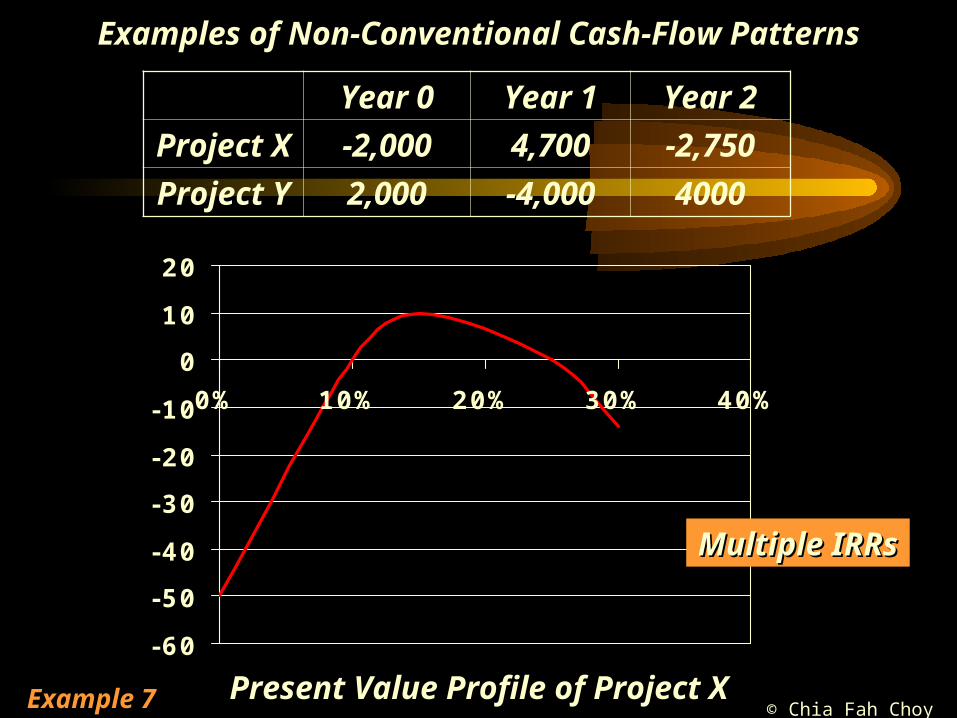
Examples of Non-Conventional Cash-Flow Patterns
Year 0 Year 1 Year 2
Project X -2,000 4,700 -2,750
Project Y 2,000 -4,000 4000
-60
-50
-40
-30
-20
-10
0
10
20
0% 10% 20% 30% 40%
Present Value Profile of Project X
Multiple IRRsMultiple IRRs
Example 7
© Chia Fah Choy 2005
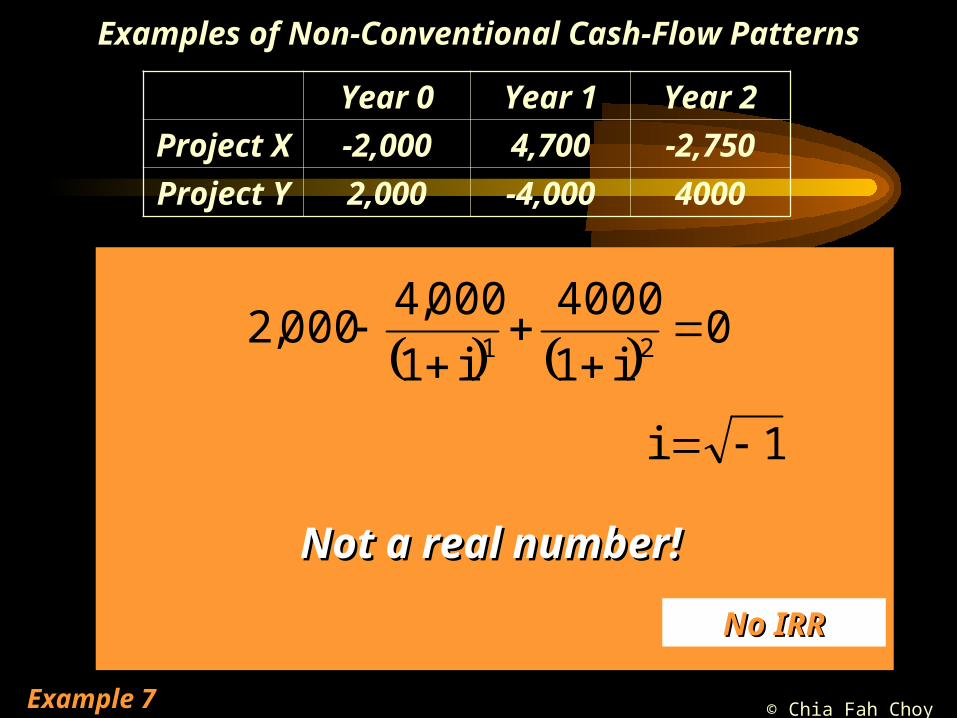
Examples of Non-Conventional Cash-Flow Patterns
Year 0 Year 1 Year 2
Project X -2,000 4,700 -2,750
Project Y 2,000 -4,000 4000
0
i1
4000
i1
000,4000,2 21
1i
Not a real number!Not a real number!
No IRRNo IRR
Example 7

© Chia Fah Choy 2005
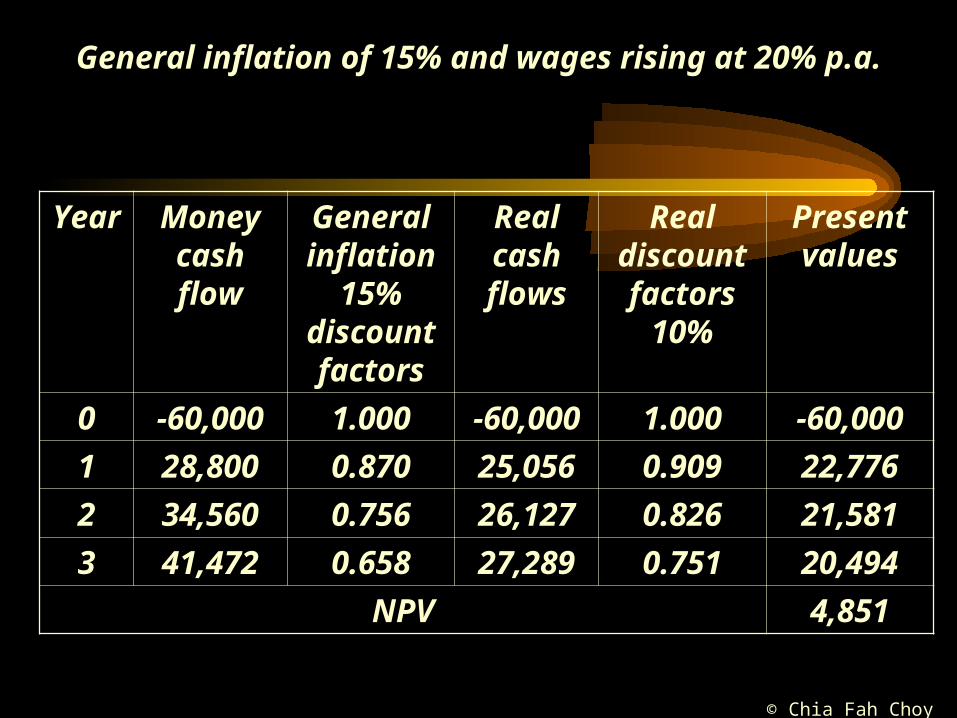
A labour saving machine costs $60,000 and will save $24,000 p.a. at current wage rates. The machine is expected to have a 3 year life and nil scrap value. The firm’s cost of capital is 10%.
Calculate the project’s NPVa. With no inflationb.With general inflation of 15% which wage
rates are expected to follow (i.e. synchronised inflation).
c. With general inflation of 15% and wages rising at 20% p.a. (i.e. differential inflation).
Example 8

© Chia Fah Choy 2005
%103A000,24000,60
NPV – No inflation
487.2000,24000,60 312
Project unacceptable as it has a negative NPV at company’s cost of
capital.
1.0
1.01
11 3
© Chia Fah Choy 2005
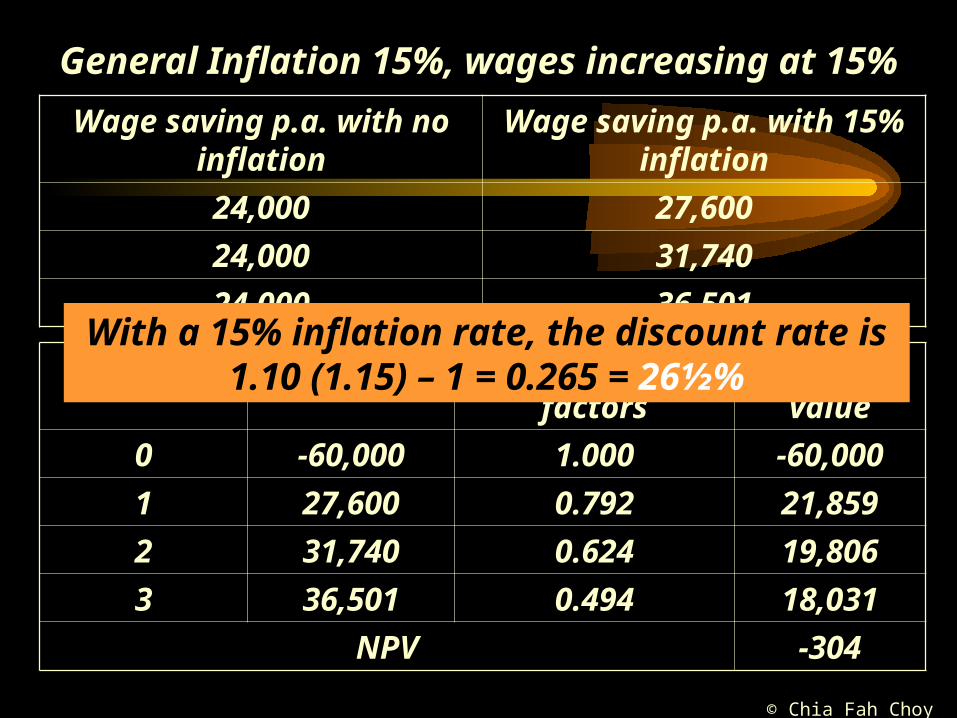
General Inflation 15%, wages increasing at 15%
487.2000,24000,60 312
Wage saving p.a. with no inflation
Wage saving p.a. with 15% inflation
24,000 27,600
24,000 31,740
24,000 36,501
Year Cash flow 26 ½% Discount factors
Present value
0 -60,000 1.000 -60,000
1 27,600 0.792 21,859
2 31,740 0.624 19,806
3 36,501 0.494 18,031
NPV -304
With a 15% inflation rate, the discount rate is 1.10 (1.15) – 1 = 0.265 = 26½%
© Chia Fah Choy 2005
General inflation of 15% and wages rising at 20% p.a.
487.2000,24000,60 312
Year Money cash flow
General inflation
15% discount factors
Real cash flows
Real discount factors
10%
Present values
0 -60,000 1.000 -60,000 1.000 -60,000
1 28,800 0.870 25,056 0.909 22,776
2 34,560 0.756 26,127 0.826 21,581
3 41,472 0.658 27,289 0.751 20,494
NPV 4,851
© Chia Fah Choy 2005
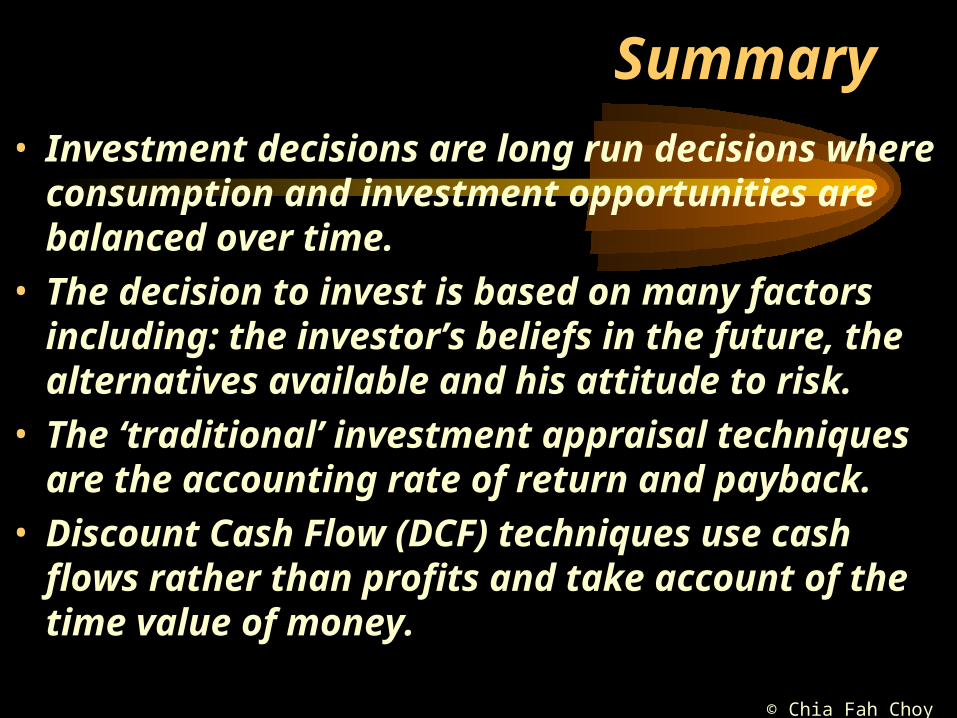
Summary• Investment decisions are long run decisions
where consumption and investment opportunities are balanced over time.
• The decision to invest is based on many factors including: the investor’s beliefs in the future, the alternatives available and his attitude to risk.
• The ‘traditional’ investment appraisal techniques are the accounting rate of return and payback.
• Discount Cash Flow (DCF) techniques use cash flows rather than profits and take account of the time value of money.

© Chia Fah Choy 2005
Summary• The formula for Net Present Value is
and given the assumption of the basic model, a project is acceptable if it has a positive NPV at the firm’s cost of capital.
• NPV can be interpreted as the potential increase in consumption made possible by the project valued in present day terms.
ii
0i
ni r1
CNPV
© Chia Fah Choy 2005
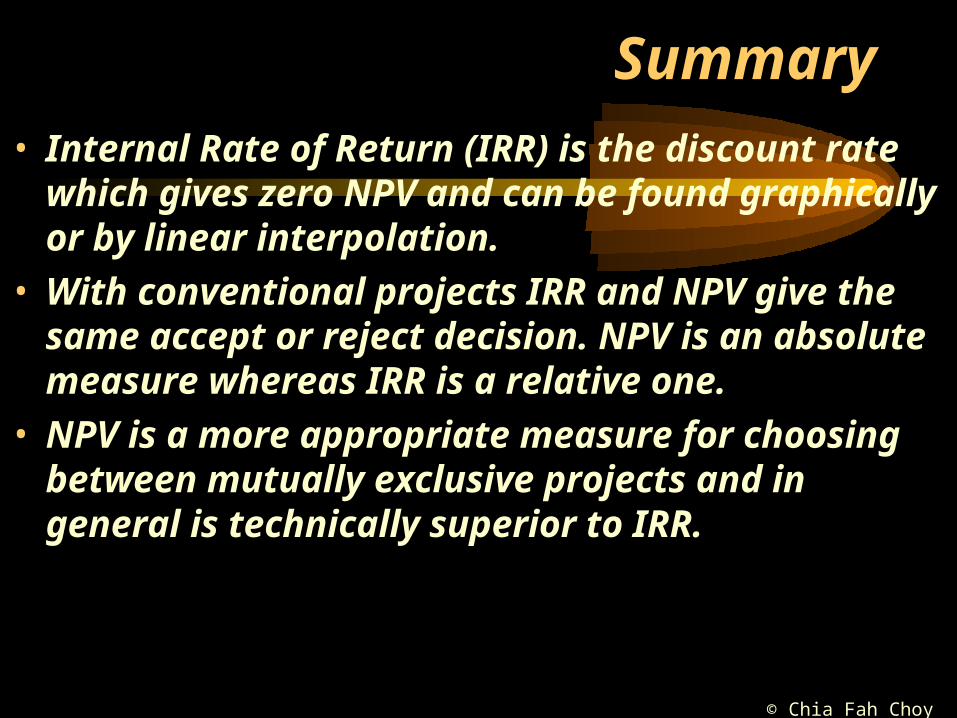
Summary• Internal Rate of Return (IRR) is the discount rate
which gives zero NPV and can be found graphically or by linear interpolation.
• With conventional projects IRR and NPV give the same accept or reject decision. NPV is an absolute measure whereas IRR is a relative one.
• NPV is a more appropriate measure for choosing between mutually exclusive projects and in general is technically superior to IRR.
© Chia Fah Choy 2005
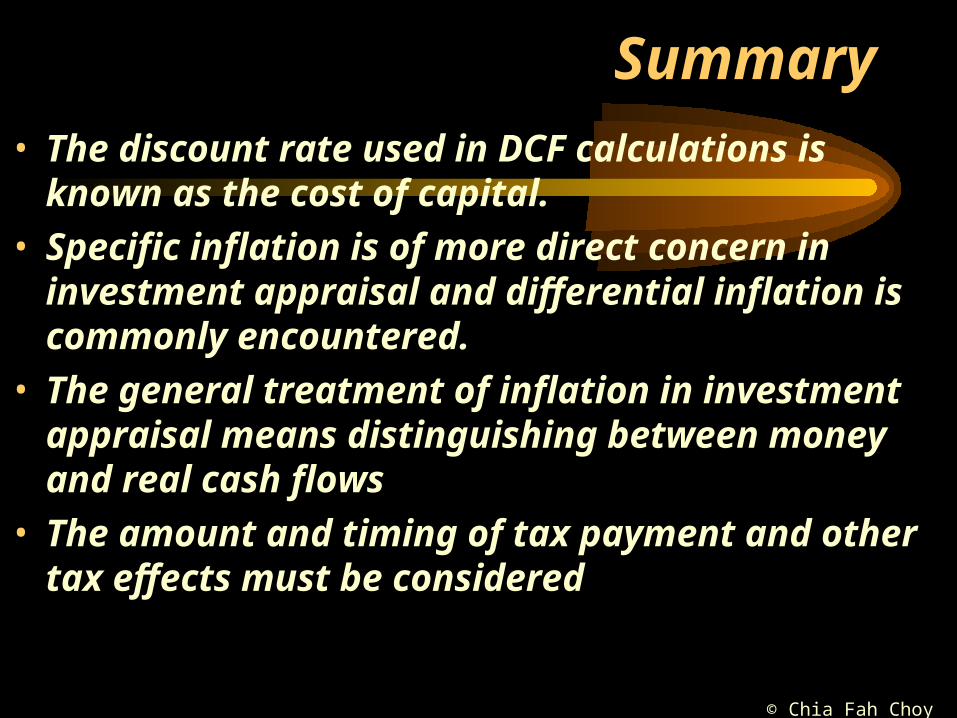
Summary• The discount rate used in DCF calculations is
known as the cost of capital.• Specific inflation is of more direct concern in
investment appraisal and differential inflation is commonly encountered.
• The general treatment of inflation in investment appraisal means distinguishing between money and real cash flows
• The amount and timing of tax payment and other tax effects must be considered
© Chia Fah Choy 2005
Points to note!!• Successful investment appraisal is entirely
dependent on the accuracy of cost and revenue estimates. No appraisal technique can overcome significant inaccuracies in the estimates.

© Chia Fah Choy 2005
Learning Objectives
After studying this topic you will:• understand the basis of long-term decision making;• be able to use traditional appraisal techniques of
Accounting Rate of Return and Payback;• know the reasons why Discounted Cash Flow (DCF)
techniques are used;• be able to calculate and interpret Net Present Value
(NPV);• understand Internal rate of Return (IRR);• know what is meant by the Excess Present Value Index;• understand the effects of inflation on investment
appraisal