Embed Size (px)
Citation preview
lack -catenin treated with vehicle (G, magnified in lower panel) or TGF- magnified in
lower panel). Data represent the mean± 95% confidence interval of 7 mice.
Supplementary Figure Legends
Figure S1. Schematic of myeloid lineage reporter mouse model used in this study.
(A) The Lyzs-Cre mouse was crossed with Gt(ROSA)26Sortm1(EYFP)Cos/J mice to label cells
expressing Lysz. In order to monitor -catenin/Tcf transcriptional activity, these mice were bred
with the Tcf reporter mouse. Tcf transcriptional activity is identified by the production of ß-gal.
These mice were used in lineage studies during wound repair. (B) Flow cytometry analysis of bone
marrow derived macrophages indicates that 87% of EYFP-positive myeloid cells are F4/80-
positive.
Figure S2. Bone marrow derived macrophages of Lysz-Cre;ROSA-EYFP mouse are EYFP+.
(A) Bone marrow derived cell culture from a ROSA-EYFP mouse expanded in macrophage
specific medium. (B) Bone marrow cell culture from Lysz-Cre;ROSA-EYFP mouse showing
EYFP-positive macrophage cells. (C) Flow cytometry analysis of bone marrow derived
macrophages from ROSA-EYFP mouse, showing absence of EYFP positive cells. (D) Flow
cytometry analysis of bone marrow derived macrophages from Lysz-Cre; ROSA-EYFP mouse,
showing a big population of EYFP positive cells.
Figure S3. -catenin deficient reporter mouse model used in this
study.
36
(A) Lysz-Cre transgenic mice were crossed with Catnbtm2Kem(fl/fl). -catenin is deleted when
Cre-recombinase is expressed in mice expressing the Catnbtm2Kem(fl/fl) allele. These mice were
crossed with an EYFP reporter mouse (Gt(ROSA)26Sortm1(EYFP)Cos/J). In order to monitor -
catenin/Tcf transcriptional activity, these mice were then bred with the Tcf reporter mouse. Tcf
transcriptional activity is identified in these mice (Lysz-Cre;ROSA-EYFP;Tcf) by the production
of ß-gal. (B) Quantitative RT- -catenin/Tcf
target Axin2 in -catenin-deficient bone marrow derived macrophages from Lysz-
Cre;Catnbtm2Kem(fl/fl);ROSA.EYFP mice compared to control littermates. (C) Western blot analysis
-catenin- -catenin
at protein level in compare to control mice. (D) Relative wound bed quantification shows a
significant increase in the wound area bed in Lysz.Cre;Catnbtm2Kem compared to control mice.
Data represent the mean± 95% confidence interval of 6 mice.
Figure S4. A subpopulation of myeloid lineage cells change their morphology during wound
healing.
Double immunofluorescence staining of the healing dermis in a Lysz-Cre;ROSA-EYFP
mouse, stained with EYFP and other antibodies. (A) co-staining with F4/80. Arrows show cells
that are positive only for EYFP while arrowheads show cells that are positive for EYFP and F4/80.
(B) Co-staining with an antibody to FAP. Arrows shows cells that are positive only for FAP while
arrowheads show cells that are positive for EYFP and FAP. (C) Co-staining with an antibody to
-SMA. Arrows show cells that -SMA while arrowheads show cells that are
-SMA. Data represent the average frequency from 8 mice.
37
Figure S5. A subpopulation of EYFP- -SMA in healing
dermis at the end of the healing process.
Double immunofluorescence staining of healing dermis in Lysz-Cre;ROSA-EYFP mouse
-SMA in (B). Arrowheads show cells which are positive only for
-SMA (B) while arrows show cells that are positive for EYFP and the specified
-SMA positive cells are myeloid lineage progeny.
-catenin mediates the development of fibroblastic phenotype of myeloid lineage cells.
(A) Bone marrow derived cells from a Lysz-Cre;ROSA-EYFP mouse grown in macrophage
specific medium (MSM), showing cells expressing the macrophage marker Mac1. Arrowheads
show round shaped macrophage cells which are EYFP-positive and Mac1-positive. (B) A
subpopulation of bone marrow derived macrophages that are deprived of MSM, showing a change
in their morphology to spindle shape fibroblast-like cells that do not express Mac1. Arrows show
that fibroblast-like cells are EYFP-positive and Mac1-negative. Arrowhead points to rounded
shape cells showing a macrophage phenotype that are EYFP-positive and Mac1-positive. (C)
Quantitative RT-PCR showing down-regulation of genes characteristically expressed by
macrophages, and up-regulation of genes characteristically expressed by fibroblasts in cultured
macrophages when deprived of MSM. (D) Quantification of percentage of cells that are positive
for each marker in macrophage medium compare to DMEM medium. (E) The phenotypes of bone
marrow derived macrophage cells cultured in either MSM medium (top panel) or deprived of
MSM medium (lower panel). Arrows show rounded cells characteristic of macrophages while
arrowheads show spindle shape fibroblasts like cells. Macrophages which are deprived of MSM
medium change their phenotype to a fibroblast-like shaped cell in cell from Lyzs.Cre; ROSA-
38

EYFP mice but not in cells from Lyzs.Cre;Catnbtm2Kem;ROSA-EYFP. (F) Quantitative RT-PCR
showing down-regulation of genes characteristically expressed in fibroblast and up-regulation of
genes characteristically expressed in macrophages. Data represent the mean± 95% confidence
interval of 6 mice.
Figure S7. Peripheral fibroblasts of Lysz-Cre;ROSA-EYFP mouse do not produce EYFP in
macrophage specific media.
Peripheral fibroblasts of Lysz-Cre;ROSA-EYFP mouse were cultured in macrophage specific
media for 96 hours. Note that unlike bone marrow cells (A), established fibroblast do not produce
EFYP protein (B), indicating that fibroblasts do not express lysozyme while exposed to MSM.
Figure S8. -catenin+ cells are enriched in human hypertrophic
scar in compare with normal scar.
-catenin positive cells in the dermal component of
hypertrophic scars compared with that observed in normal scars. This, shows a correlation
between numbers - -catenin positive
cells in the upper panels and F4/80+ cells in the lower panels. Data in right panel represent the
mean± 95% confidence interval of 10 hypertrophic scar samples and 3 normal scar samples.
Table S1. Tcf transcriptionally active cells express genes characteristically expressed by
macrophages during skin healing.
LacZ-expressing cells were sorted from digested granulation tissue using fluorescein di- -D-
galactopyranoside subjected to microarray. The table summarizes the relative expression ratio of
39
-gal-positive cells with -
-gal-negative cells.
Table S2. Down-regulation of genes attributed to migration in -catenin.
Data from the microarray analysis (Geo accession number: GSE52163) shows down-
regulation of genes attributed to macrophage migration in macrophages from
Lyzs.Cre;Catnbtm2Kem;ROSA-EYFP in comparison with control macrophages.
Table S3. Modulation of Integrin gene family in -catenin.
Integrin family member genes differentially expressed in the microarray analysis of
expression in macrophages from Lyzs.Cre;Catnbtm2Kem;ROSA-EYFP mice compared with control
macrophages.
Table S4. Modulation of Adam gene family in -catenin.
Summary of Adam gene family differential expression in cDNA microarray analysis of RNA
from macrophages from Lyzs.Cre;Catnbtm2Kem;ROSA-EYFP mice compared with control
macrophages.
40
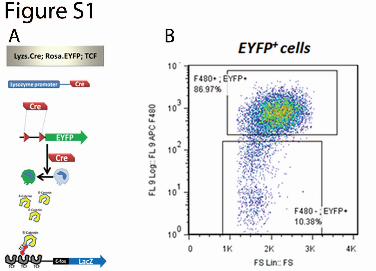

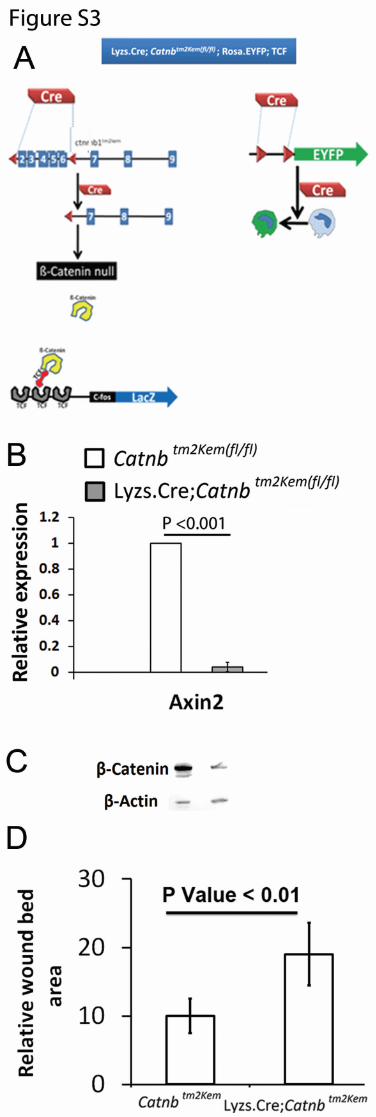


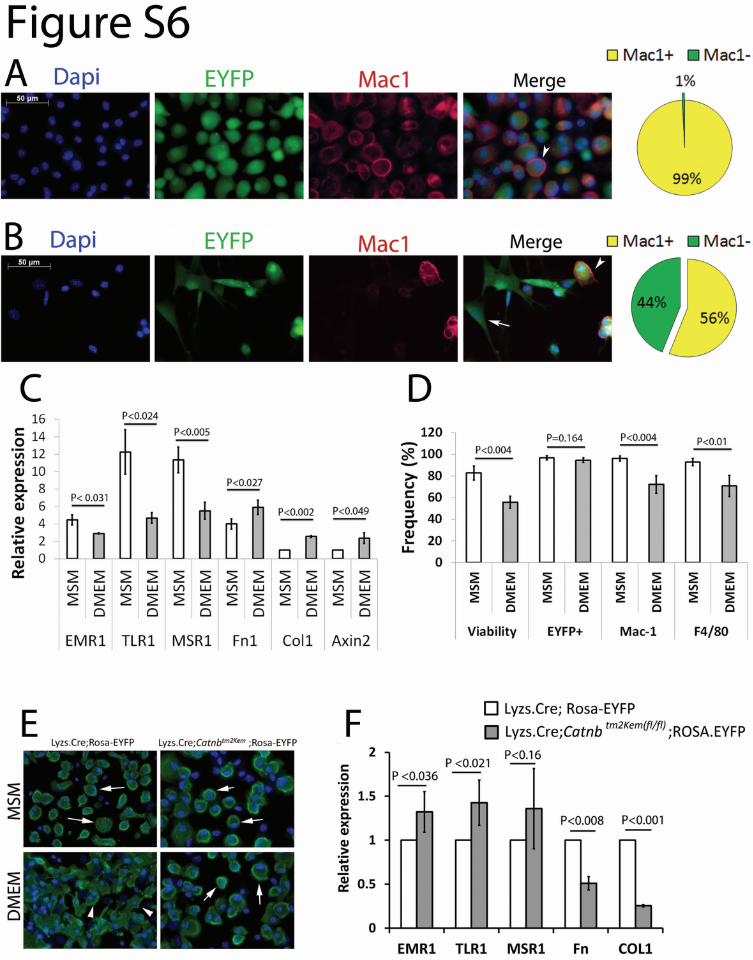
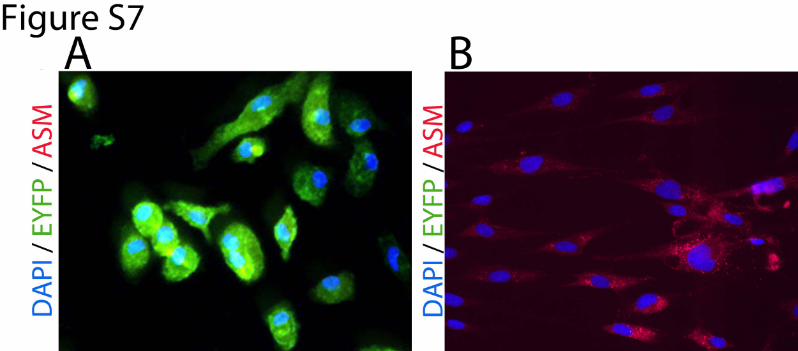
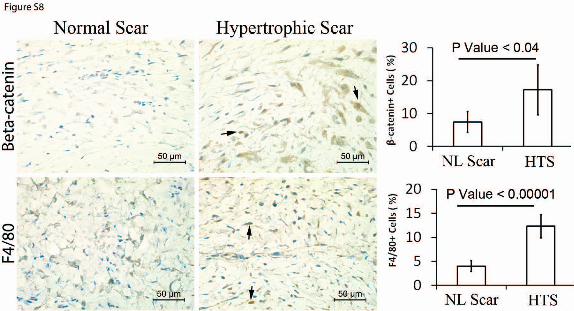

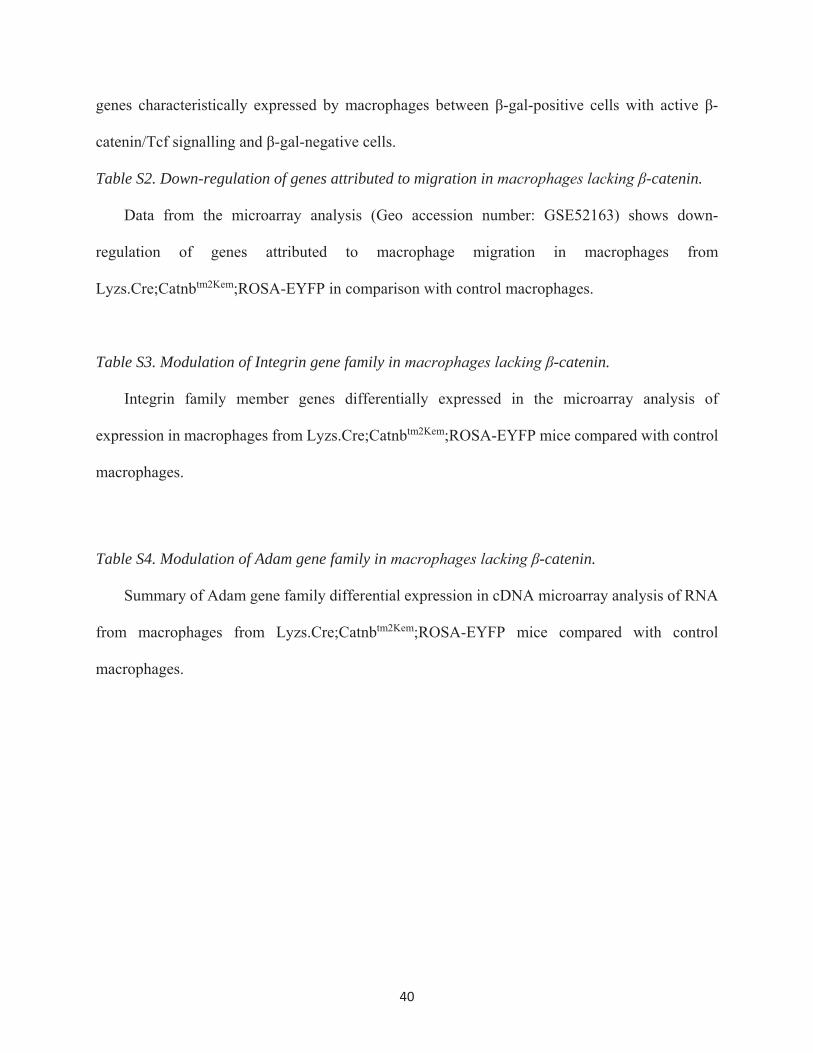
Table S1. Tcf transcriptionally active cells express genes characteristically expressed by macrophages during skin healing.
β-Gal+ / β-Gal- Tlr4 2.67 Tlr6 2.83 CD22 3.9 CD33 4.29 CD93 5.99 CD11b 6.5 CD68 9.8 CD204 11.67 MSR1 11.67 CD84 13.2 Tlr1 13.24 F4/80 26.9
Table S2. Genes Attributed to Macrophage Migration
RefSeq Gene.Symbol Gene name KO/WT NM_008118 Gif Glycosylation-inhibiting factor 0.562284 NM_011223 Pxn Paxillin 0.738619 NM_001162365 Ptk2b Protein tyrosine kinase 2 beta 0.773482 NM_010576 Itga4 VLA-4 0.788286 NM_020505 Vav3 Vav3 oncogene 0.810314 NM_001111316 Ptprc CD 45, role in migration 0.894839 NM_010736 Ltbr Lymphotoxin B receptor 0.947183 NM_001082960 Itgam Mac-1 0.971535

Table S3. Adam Gene Family RefSeq Gene.Symbol KO/WT RefSeq Gene.Symbol KO/WT NM_010084 Adam18 0.537267 NM_177872 Adamts3 0.905477 NM_021475 Adamdec1 0.566615 NM_177872 Adamts3 0.913203 NM_177872 Adamts3 0.590272 NM_177872 Adamts3 0.916544 NM_001033877 Adamts17 0.617274 NM_029967 Adamtsl1 0.923991 NM_007402 Adam7 0.620423 NM_172845 Adamts4 0.943594 NM_175506 Adamts19 0.622105 NM_013906 Adamts8 0.968468 NM_175939 Adam29 0.629918 NM_001003911 Adamts7 0.968973 NM_145745 Adam34 0.665905 NM_153397 Adam32 0.971559 NM_177872 Adamts3 0.680757 NM_007400 Adam12 0.976602 NM_172125 Adam1b 0.702741 NM_001081401 Adamts3 0.976721 NM_177872 Adamts3 0.708564 NM_177872 Adamts3 0.978318 NM_001001322 Adamts13 0.70957 NM_033615 Adam33 1.012868 NM_011781 Adam25 0.7223 NM_001009547 Adam26b 1.014347 NM_010086 Adam24 0.726665 NM_007401 Adam5 1.01455 NM_145745 Adam34 0.743746 NM_001081127 Adamts14 1.037296 NM_009616 Adam19 0.750183 NM_009618 Adam2 1.039012 NM_172466 Adamts18 0.750865 NM_177872 Adamts3 1.049208 NM_177872 Adamts3 0.763838 NM_007404 Adam9 1.054751 NM_001037722 Adam15 0.767754 NM_001033877 Adamts17 1.070653 NM_010082 Adam28 0.7764 NM_177872 Adamts3 1.079829 NM_174885 Adam6a 0.778271 NM_013906 Adamts8 1.097105 NM_001037722 Adam15 0.787446 NM_175501 Adamts12 1.110269 NM_029967 Adamtsl1 0.788609 NM_009615 Adam17 1.110969 NM_177431 Adamts20 0.789541 NM_001081020 Adamts6 1.117838 NM_007399 Adam10 0.793108 NM_172126 Adam1a 1.155448 NM_001007220 Adam22 0.795107 NM_001113548 Adamtsl5 1.182471 NM_027665 Adam30 0.803075 NM_177872 Adamts3 1.191522 NM_001110778 Adam11 0.805177 NM_144899 Adamtsl4 1.230599 NM_001025380 Adam39 0.811513 NM_177872 Adamts3 1.230684 NM_009619 Adam3 0.821438 NM_177872 Adamts3 1.291045 NM_009620 Adam4 0.835456 NM_172619 Adamts10 1.306561 ENSMUST00000094237 Adamtsl3 0.836585 NM_175314 Adamts9 1.464681 NM_001033877 Adamts17 0.846534 NM_175314 Adamts9 1.57999 NM_001009545 Adam6b 0.846981 NM_177872 Adamts3 1.612718 NM_029981 Adamtsl2 0.84956 ENSMUST00000049189 Adamts9 1.691706 NM_001024139 Adamts15 0.852374 NM_175314 Adamts9 1.730321 NM_001033877 Adamts17 0.853589 NM_175314 Adamts9 1.85765 NM_001033877 Adamts17 0.856495 NM_011780 Adam23 2.06231 NM_177872 Adamts3 0.872939 NM_175314 Adamts9 2.147783 NM_010085 Adam26a 0.882167 NM_175314 Adamts9 2.409637 NM_007403 Adam8 0.891508 NM_175643 Adamts2 2.512744 NM_172053 Adamts16 0.899952 NM_009621 Adamts1 3.00974 NM_020330 Adam21 0.903909 NM_011782 Adamts5 3.04486
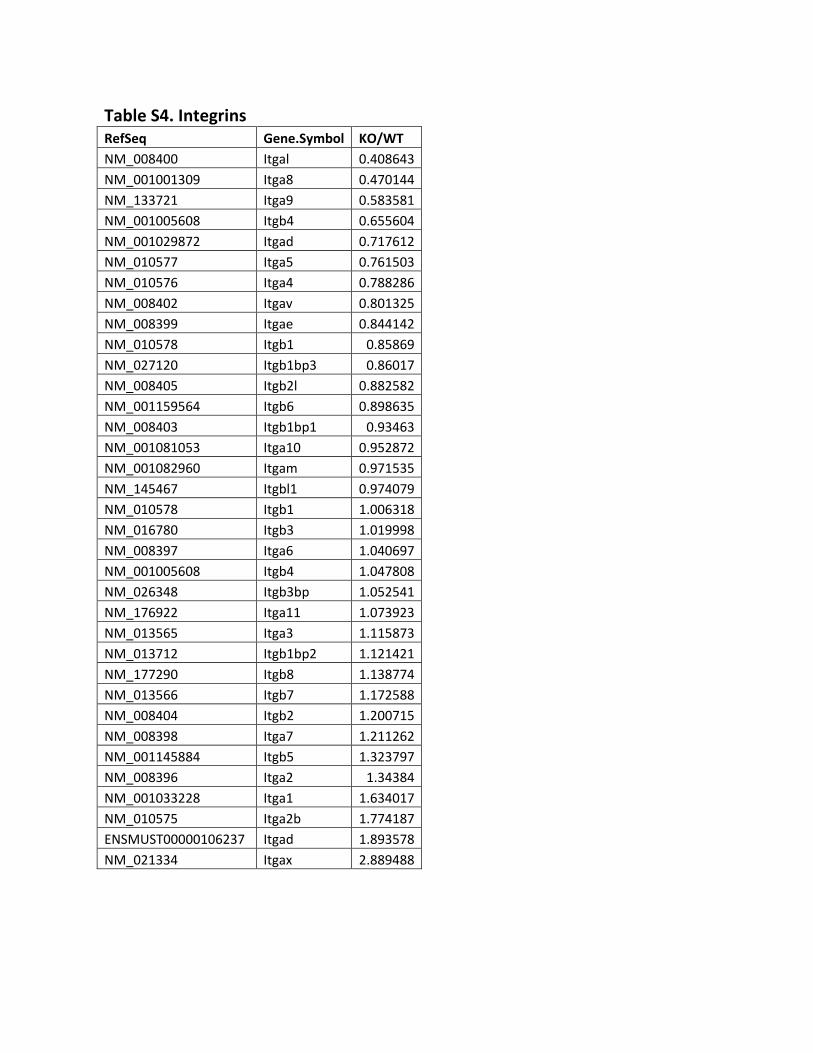
Table S4. Integrins RefSeq Gene.Symbol KO/WT NM_008400 Itgal 0.408643 NM_001001309 Itga8 0.470144 NM_133721 Itga9 0.583581 NM_001005608 Itgb4 0.655604 NM_001029872 Itgad 0.717612 NM_010577 Itga5 0.761503 NM_010576 Itga4 0.788286 NM_008402 Itgav 0.801325 NM_008399 Itgae 0.844142 NM_010578 Itgb1 0.85869 NM_027120 Itgb1bp3 0.86017 NM_008405 Itgb2l 0.882582 NM_001159564 Itgb6 0.898635 NM_008403 Itgb1bp1 0.93463 NM_001081053 Itga10 0.952872 NM_001082960 Itgam 0.971535 NM_145467 Itgbl1 0.974079 NM_010578 Itgb1 1.006318 NM_016780 Itgb3 1.019998 NM_008397 Itga6 1.040697 NM_001005608 Itgb4 1.047808 NM_026348 Itgb3bp 1.052541 NM_176922 Itga11 1.073923 NM_013565 Itga3 1.115873 NM_013712 Itgb1bp2 1.121421 NM_177290 Itgb8 1.138774 NM_013566 Itgb7 1.172588 NM_008404 Itgb2 1.200715 NM_008398 Itga7 1.211262 NM_001145884 Itgb5 1.323797 NM_008396 Itga2 1.34384 NM_001033228 Itga1 1.634017 NM_010575 Itga2b 1.774187 ENSMUST00000106237 Itgad 1.893578 NM_021334 Itgax 2.889488