Embed Size (px)
Citation preview
Capital Budgeting and Risk
Principles of Corporate FinanceBrealey and Myers Sixth Edition
Slides by
Matthew Will Chapter 9
©The McGraw-Hill Companies, Inc., 2000Irwin/McGraw Hill
©The McGraw-Hill Companies, Inc., 2000Irwin/McGraw Hill
9- 2
Topics Covered
Measuring Betas Capital Structure and COC Discount Rates for Intl. Projects Estimating Discount Rates Risk and DCF
©The McGraw-Hill Companies, Inc., 2000Irwin/McGraw Hill
9- 3
Company Cost of Capital
A firm’s value can be stated as the sum of the value of its various assets.
PV(B)PV(A)PV(AB) valueFirm
©The McGraw-Hill Companies, Inc., 2000Irwin/McGraw Hill
9- 4
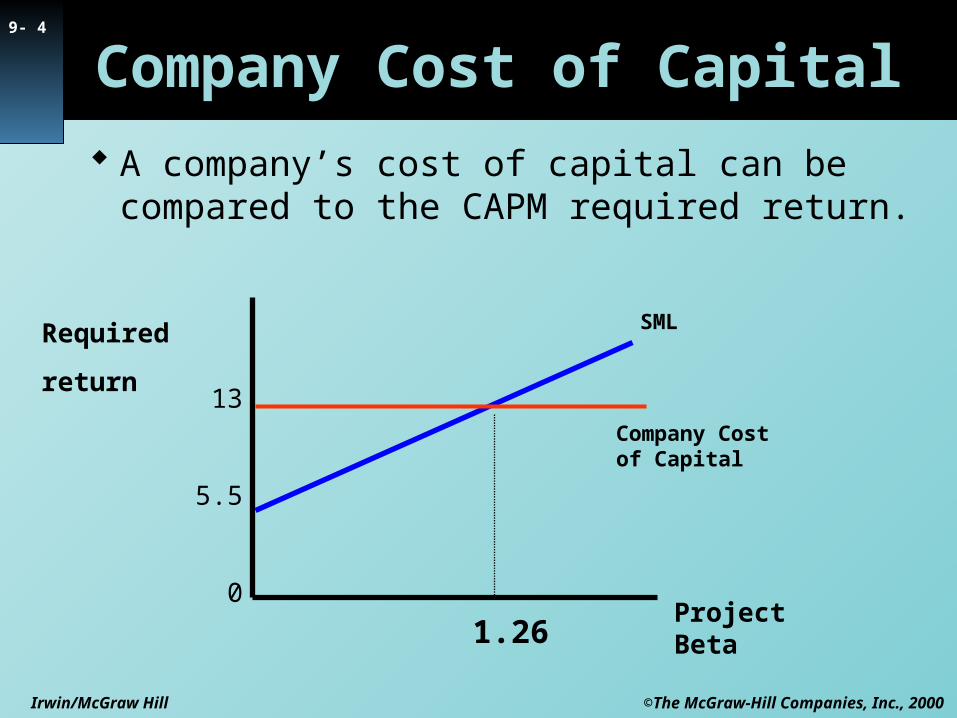
Company Cost of Capital
A company’s cost of capital can be compared to the CAPM required return.
Required
return
Project Beta1.26
Company Cost of Capital
13
5.5
0
SML
©The McGraw-Hill Companies, Inc., 2000Irwin/McGraw Hill
9- 5
Measuring Betas
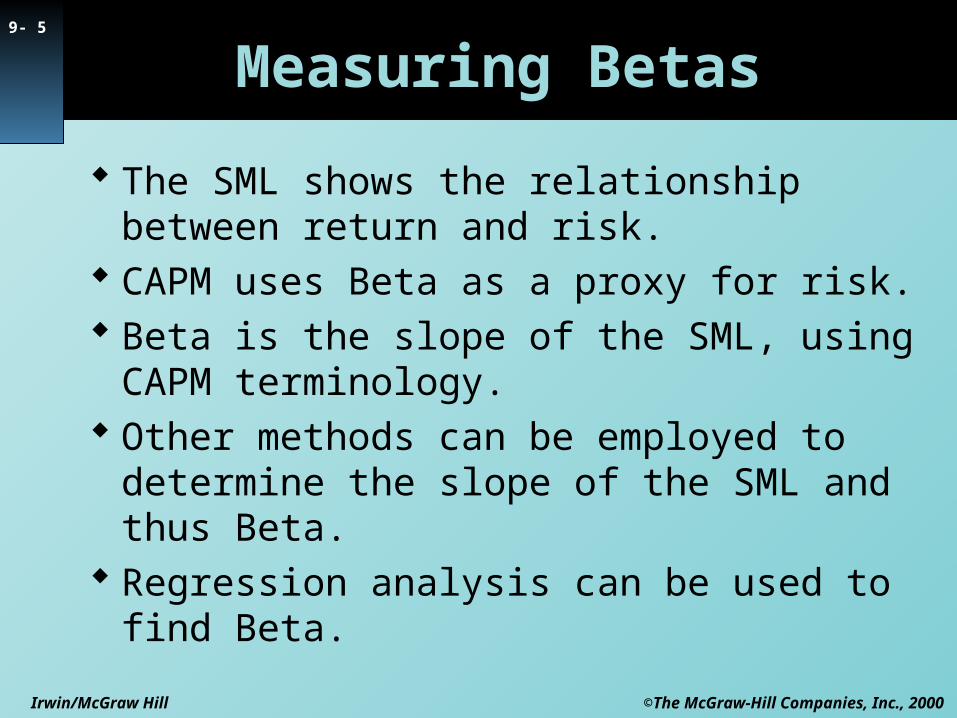
The SML shows the relationship between return and risk.
CAPM uses Beta as a proxy for risk. Beta is the slope of the SML, using CAPM
terminology. Other methods can be employed to determine
the slope of the SML and thus Beta. Regression analysis can be used to find Beta.
©The McGraw-Hill Companies, Inc., 2000Irwin/McGraw Hill
9- 6
Measuring Betas
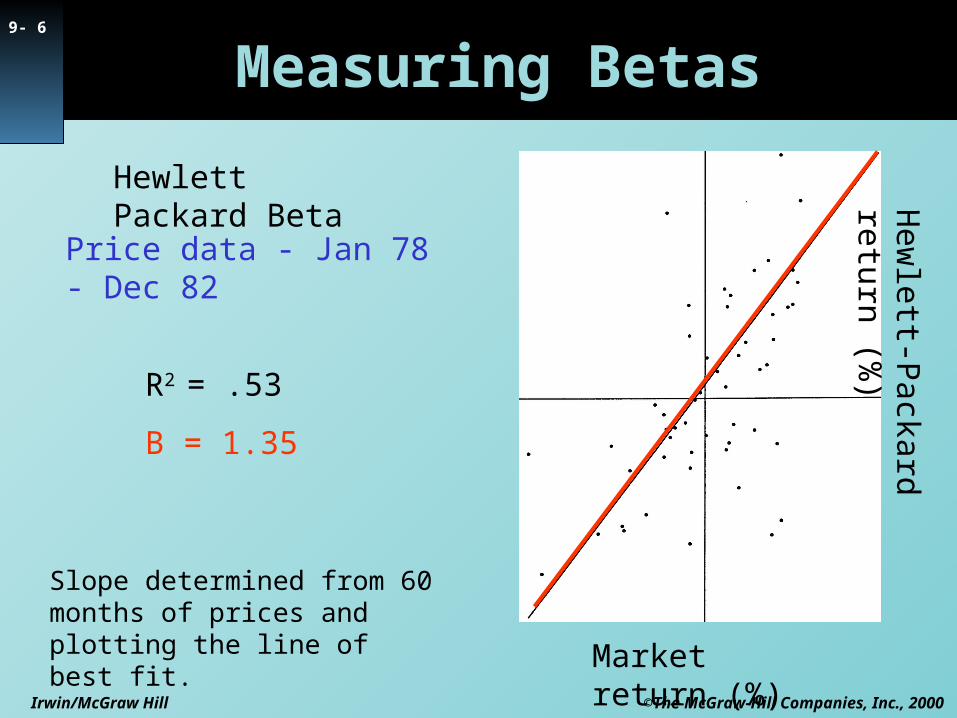
Hewlett Packard Beta
Slope determined from 60 months of prices and plotting the line of best fit.
Price data - Jan 78 - Dec 82
Market return (%)
Hew
lett-Packard return (%
)
R2 = .53
B = 1.35
©The McGraw-Hill Companies, Inc., 2000Irwin/McGraw Hill
9- 7
Measuring Betas
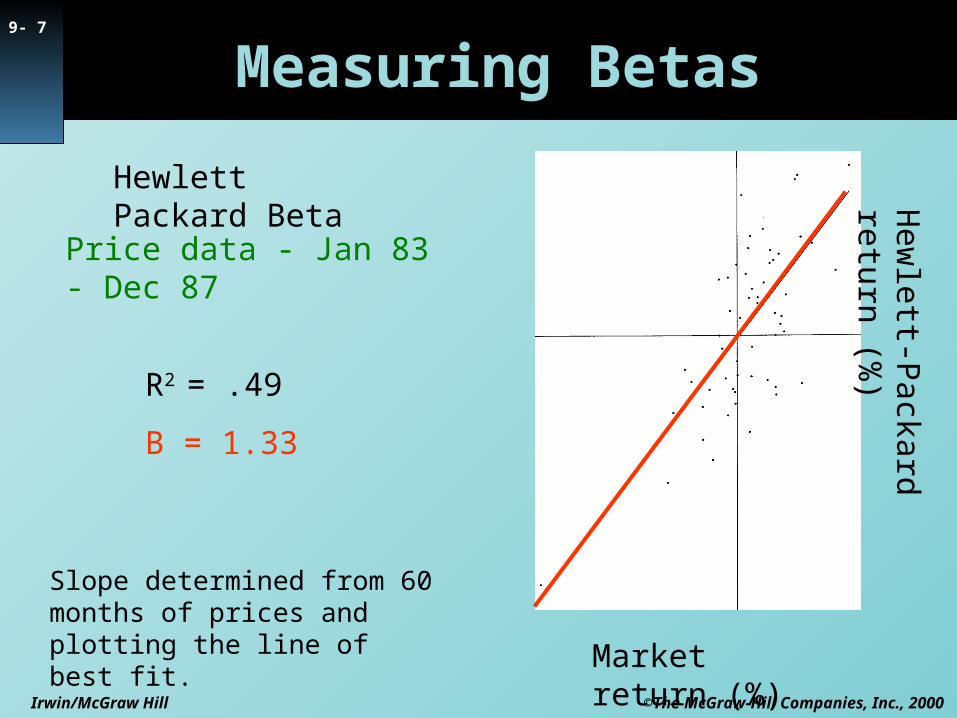
Hewlett Packard Beta
Slope determined from 60 months of prices and plotting the line of best fit.
Price data - Jan 83 - Dec 87
Market return (%)
Hew
lett-Packard return (%
)
R2 = .49
B = 1.33
©The McGraw-Hill Companies, Inc., 2000Irwin/McGraw Hill
9- 8
Measuring Betas
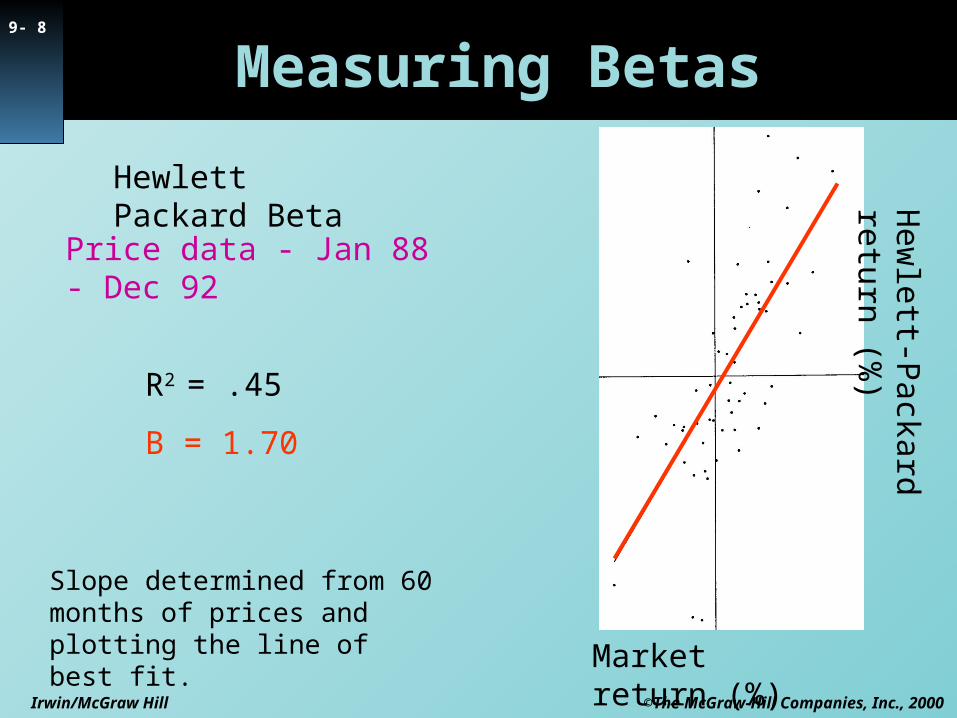
Hewlett Packard Beta
Slope determined from 60 months of prices and plotting the line of best fit.
Price data - Jan 88 - Dec 92
Market return (%)
Hew
lett-Packard return (%
)
R2 = .45
B = 1.70
©The McGraw-Hill Companies, Inc., 2000Irwin/McGraw Hill
9- 9
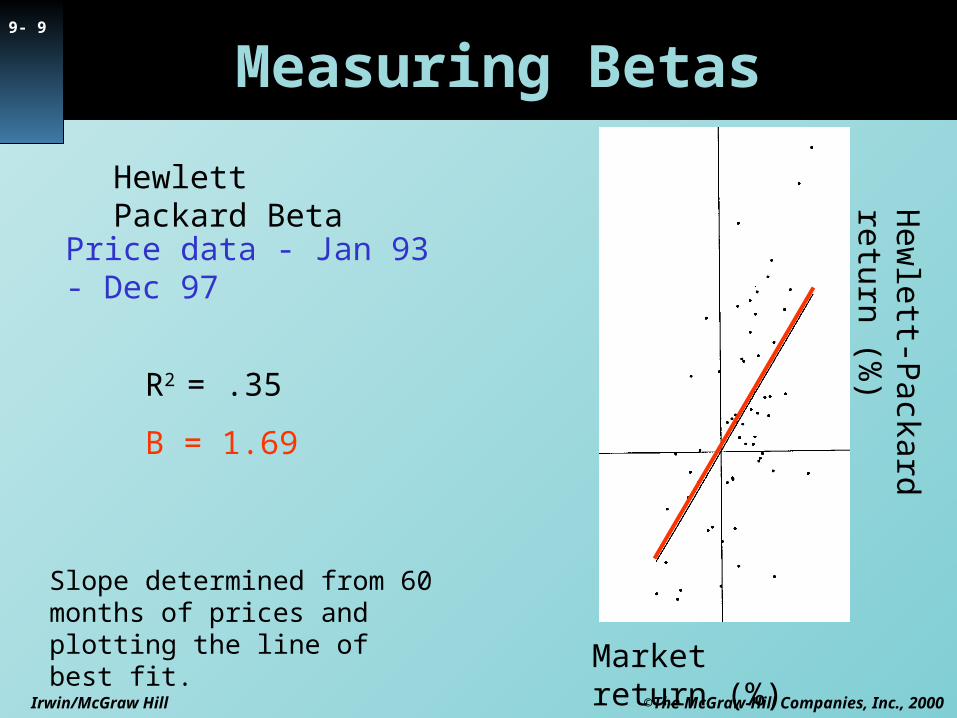
Measuring Betas
Hewlett Packard Beta
Slope determined from 60 months of prices and plotting the line of best fit.
Price data - Jan 93 - Dec 97
Market return (%)
Hew
lett-Packard return (%
)
R2 = .35
B = 1.69
©The McGraw-Hill Companies, Inc., 2000Irwin/McGraw Hill
9- 10
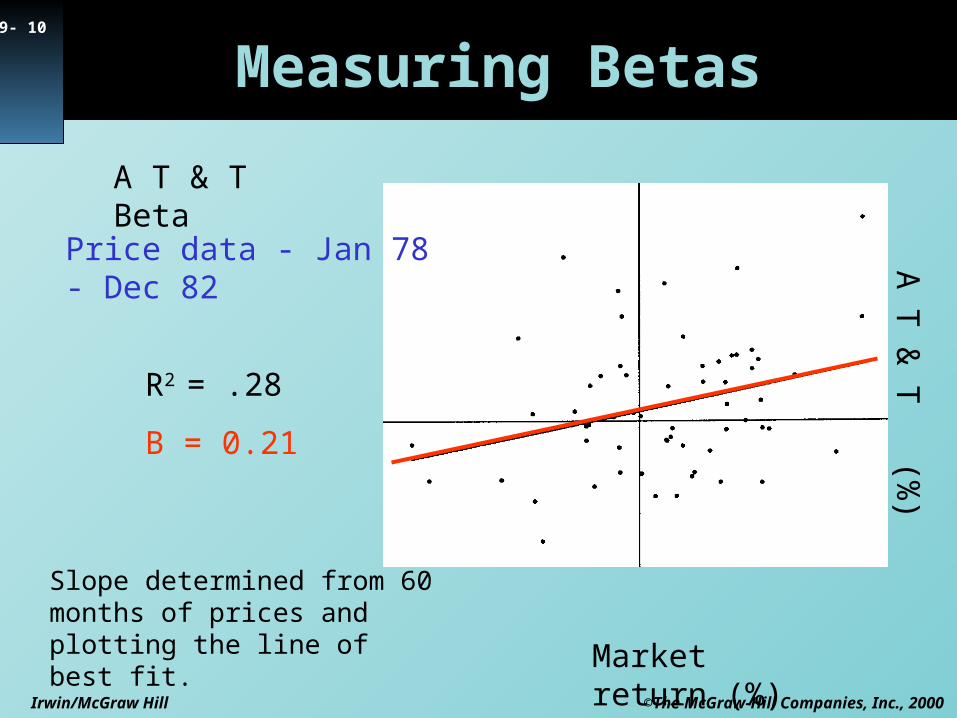
Measuring Betas
A T & T Beta
Slope determined from 60 months of prices and plotting the line of best fit.
Price data - Jan 78 - Dec 82
Market return (%)
A T
& T
(%)
R2 = .28
B = 0.21
©The McGraw-Hill Companies, Inc., 2000Irwin/McGraw Hill
9- 11
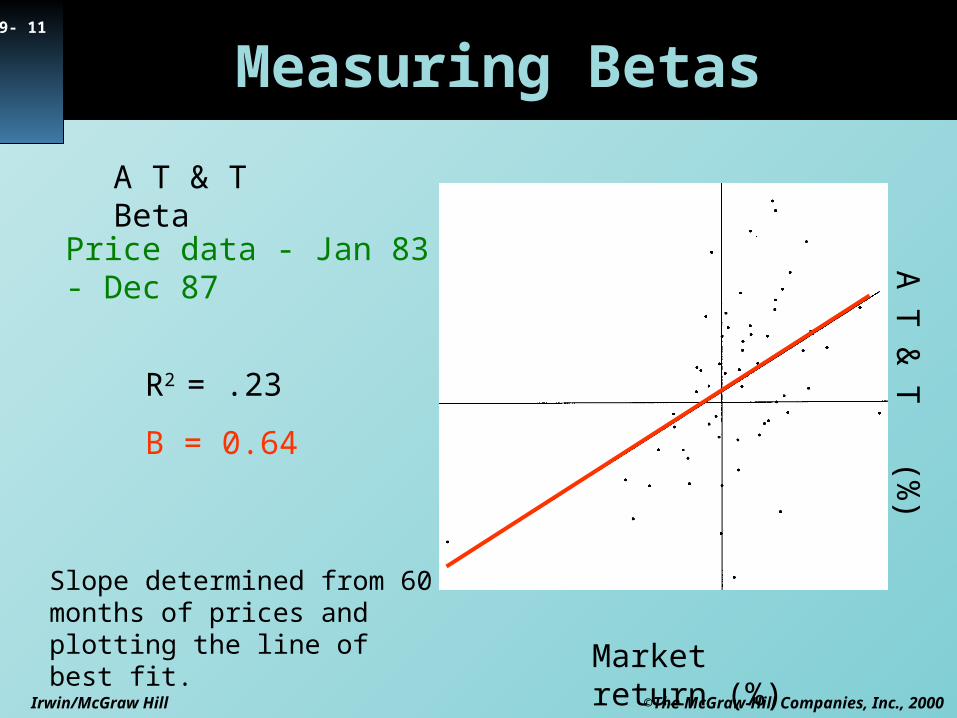
Measuring Betas
A T & T Beta
Slope determined from 60 months of prices and plotting the line of best fit.
Price data - Jan 83 - Dec 87
Market return (%)
R2 = .23
B = 0.64
A T
& T
(%)
©The McGraw-Hill Companies, Inc., 2000Irwin/McGraw Hill
9- 12
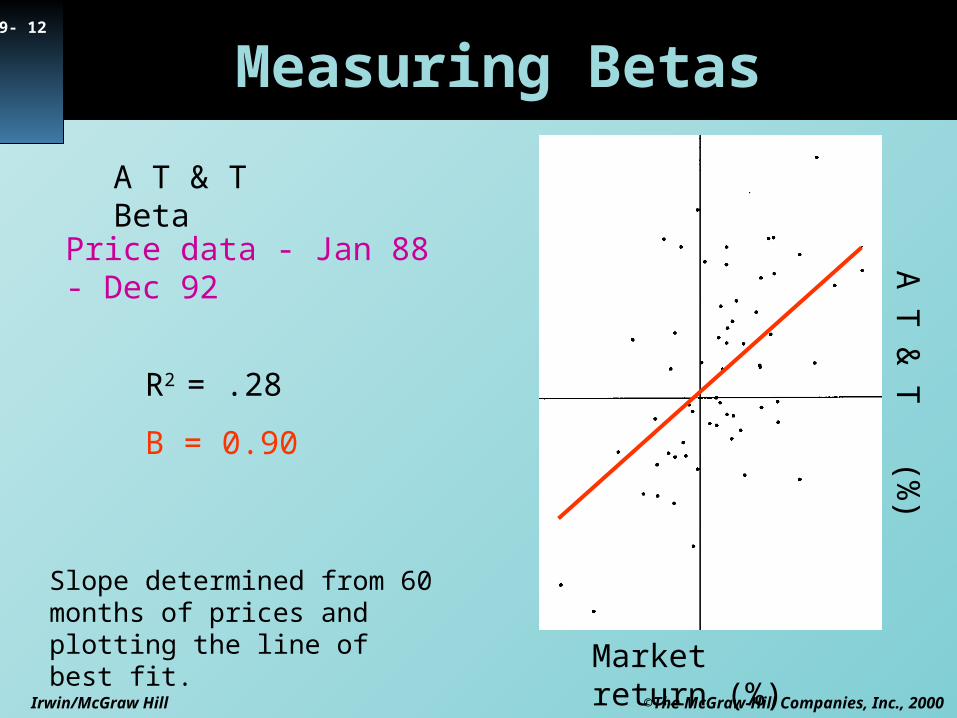
Measuring Betas
A T & T Beta
Slope determined from 60 months of prices and plotting the line of best fit.
Price data - Jan 88 - Dec 92
Market return (%)
R2 = .28
B = 0.90
A T
& T
(%)
©The McGraw-Hill Companies, Inc., 2000Irwin/McGraw Hill
9- 13
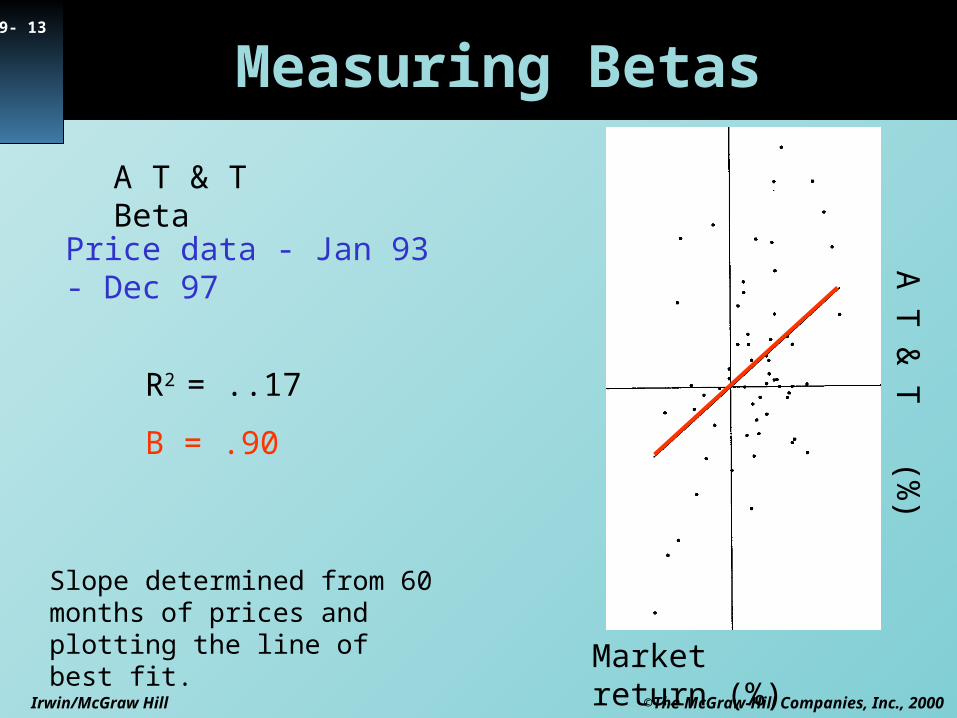
Measuring Betas
A T & T Beta
Slope determined from 60 months of prices and plotting the line of best fit.
Price data - Jan 93 - Dec 97
Market return (%)
R2 = ..17
B = .90
A T
& T
(%)
©The McGraw-Hill Companies, Inc., 2000Irwin/McGraw Hill
9- 14
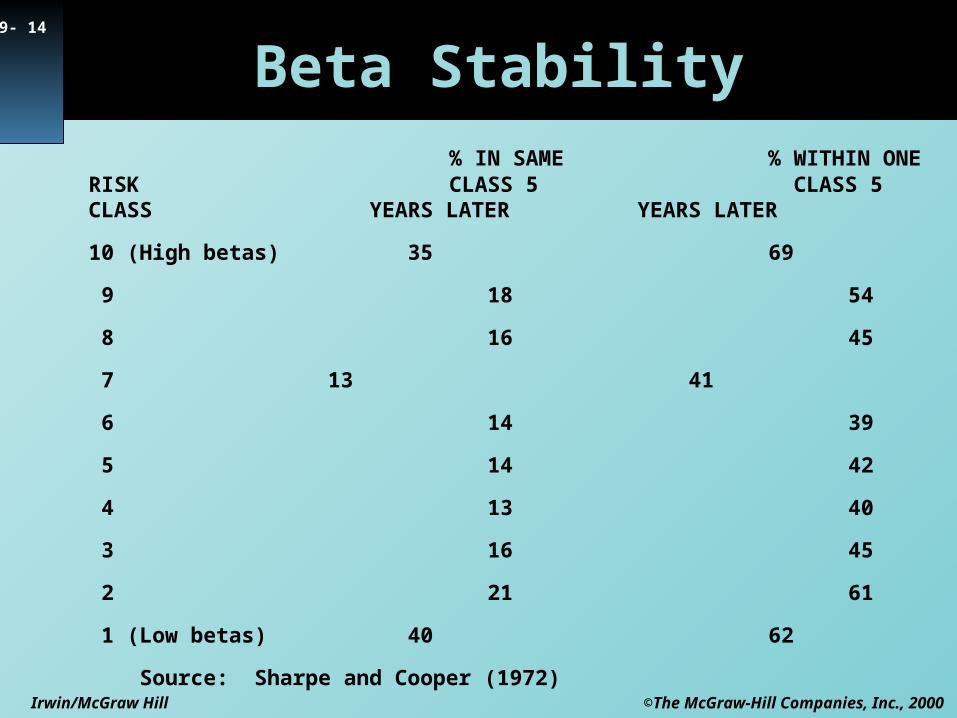
Beta Stability % IN SAME % WITHIN ONE RISK CLASS 5 CLASS 5 CLASS YEARS LATER YEARS LATER
10 (High betas) 35 69
9 18 54
8 16 45
7 13 41
6 14 39
5 14 42
4 13 40
3 16 45
2 21 61
1 (Low betas) 40 62
Source: Sharpe and Cooper (1972)
©The McGraw-Hill Companies, Inc., 2000Irwin/McGraw Hill
9- 15
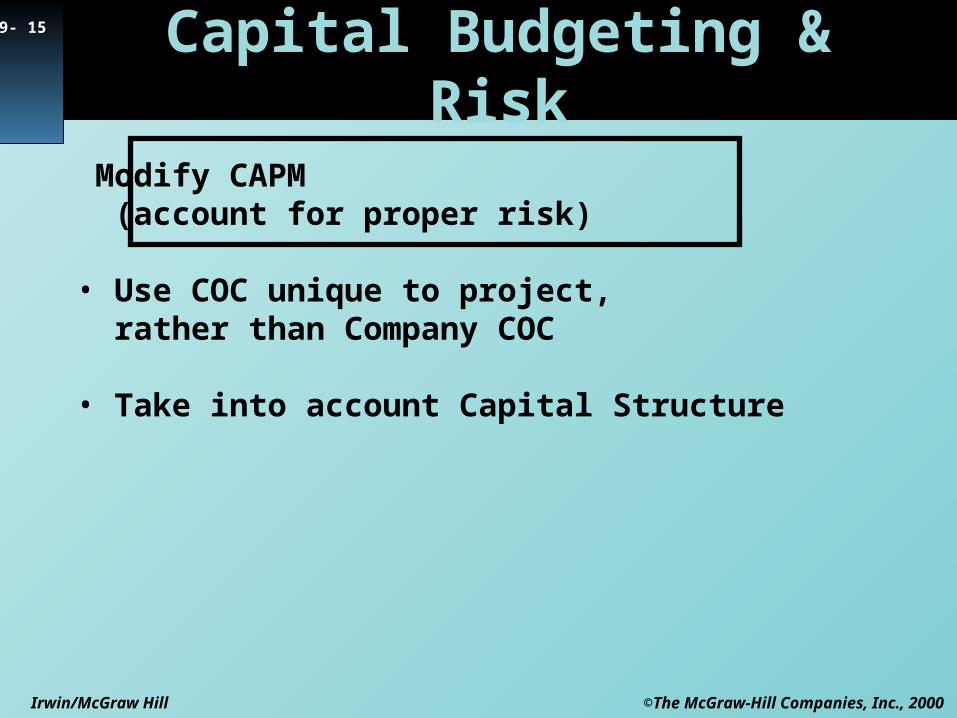
Capital Budgeting & Risk
Modify CAPM (account for proper risk)
• Use COC unique to project, rather than Company COC
• Take into account Capital Structure
©The McGraw-Hill Companies, Inc., 2000Irwin/McGraw Hill
9- 16 Company Cost of Capitalsimple approach
Company Cost of Capital (COC) is based on the average beta of the assets.
The average Beta of the assets is based on the % of funds in each asset.
©The McGraw-Hill Companies, Inc., 2000Irwin/McGraw Hill
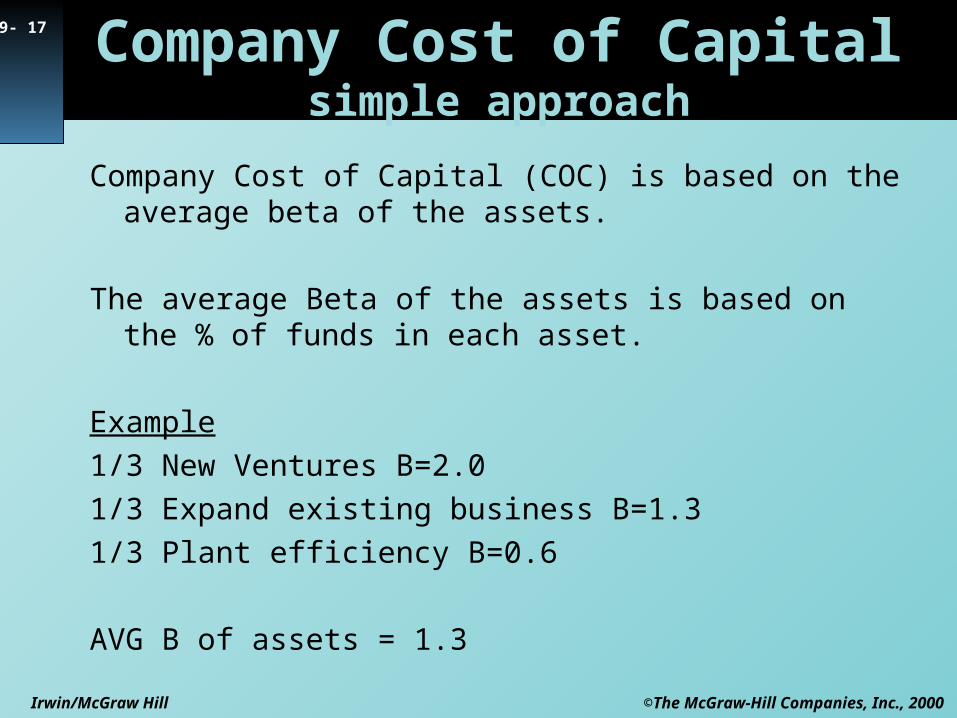
9- 17 Company Cost of Capitalsimple approach
Company Cost of Capital (COC) is based on the average beta of the assets.
The average Beta of the assets is based on the % of funds in each asset.
Example
1/3 New Ventures B=2.0
1/3 Expand existing business B=1.3
1/3 Plant efficiency B=0.6
AVG B of assets = 1.3
©The McGraw-Hill Companies, Inc., 2000Irwin/McGraw Hill
9- 18
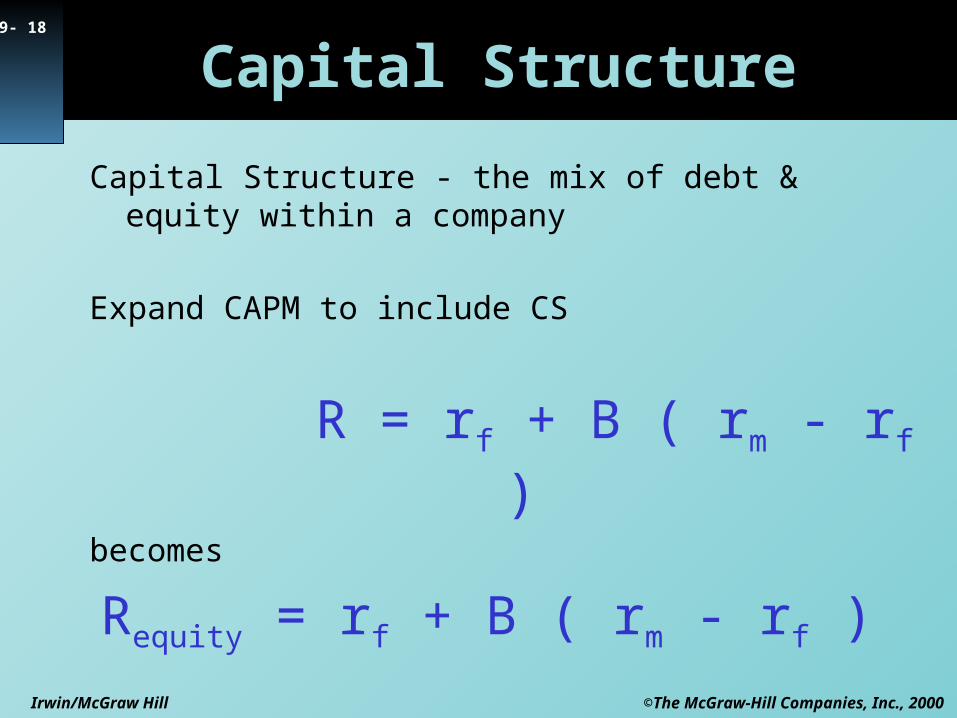
Capital Structure - the mix of debt & equity within a company
Expand CAPM to include CS
R = rf + B ( rm - rf )becomes
Requity = rf + B ( rm - rf )
Capital Structure
©The McGraw-Hill Companies, Inc., 2000Irwin/McGraw Hill
9- 19
Capital Structure & COC
COC = rportfolio = rassets
©The McGraw-Hill Companies, Inc., 2000Irwin/McGraw Hill
9- 20
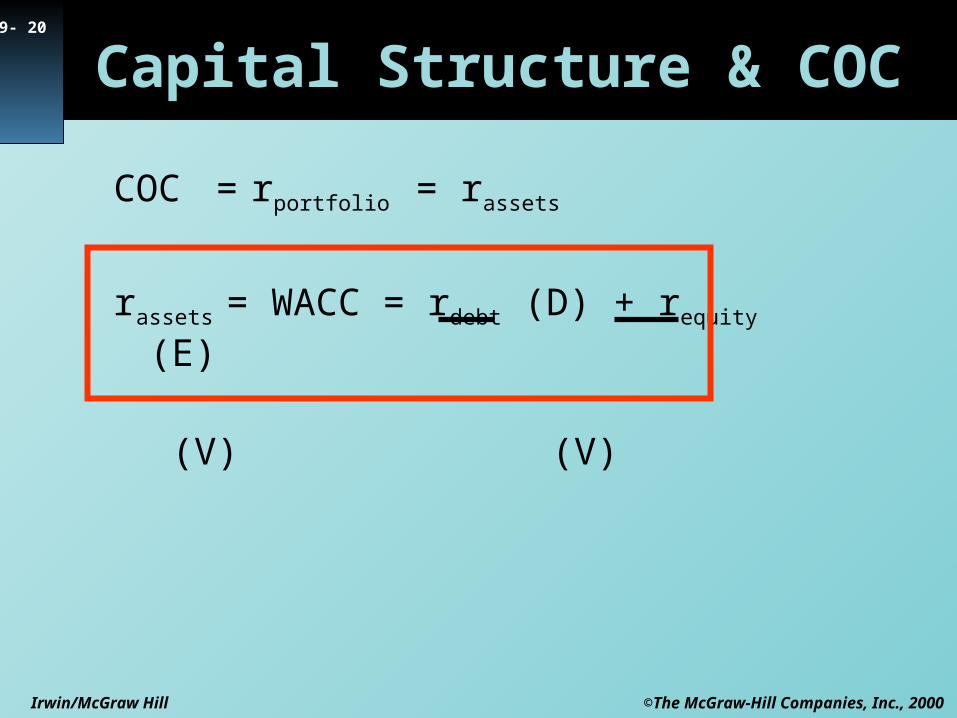
Capital Structure & COC
COC = rportfolio = rassets
rassets = WACC = rdebt (D) + requity (E)
(V) (V)
©The McGraw-Hill Companies, Inc., 2000Irwin/McGraw Hill
9- 21
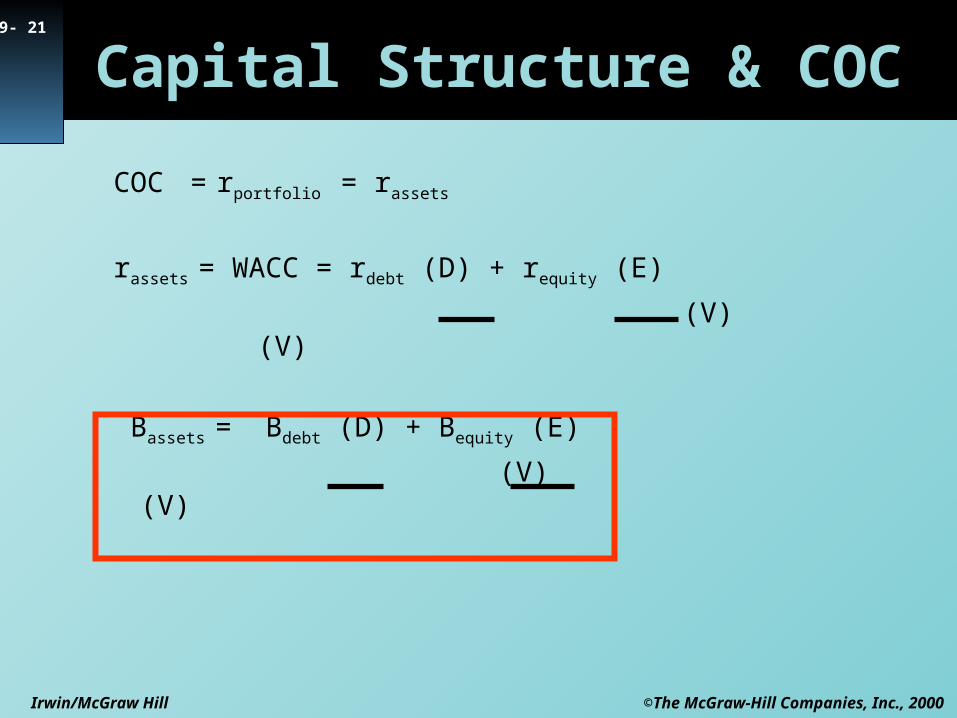
Capital Structure & COC
COC = rportfolio = rassets
rassets = WACC = rdebt (D) + requity (E)
(V) (V)
Bassets = Bdebt (D) + Bequity (E)
(V) (V)
©The McGraw-Hill Companies, Inc., 2000Irwin/McGraw Hill
9- 22
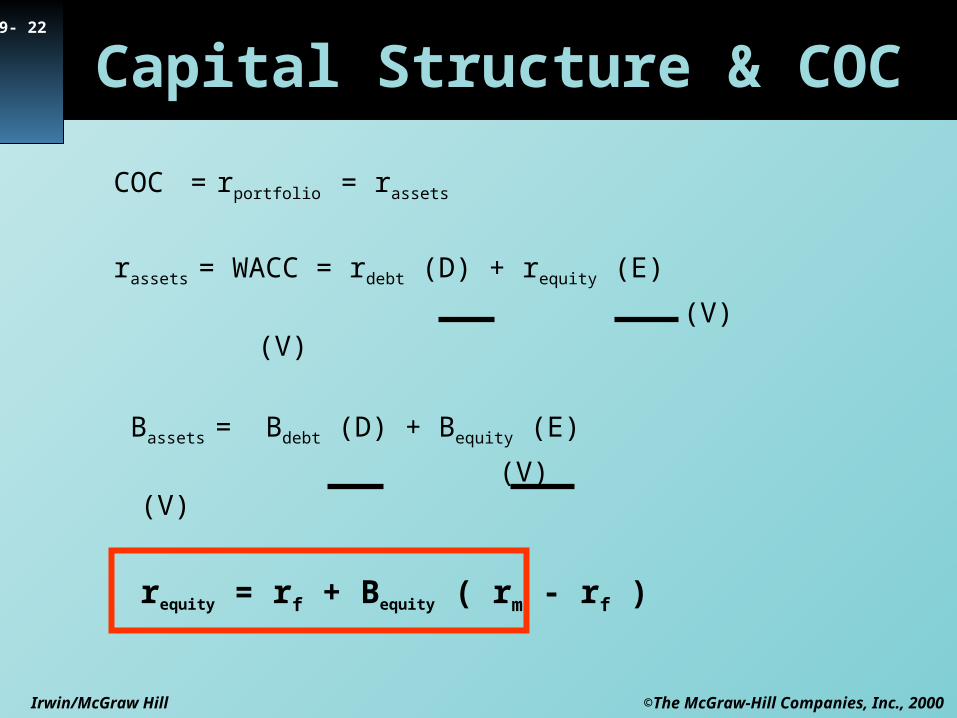
Capital Structure & COC
COC = rportfolio = rassets
rassets = WACC = rdebt (D) + requity (E)
(V) (V)
Bassets = Bdebt (D) + Bequity (E)
(V) (V)
requity = rf + Bequity ( rm - rf )
©The McGraw-Hill Companies, Inc., 2000Irwin/McGraw Hill
9- 23
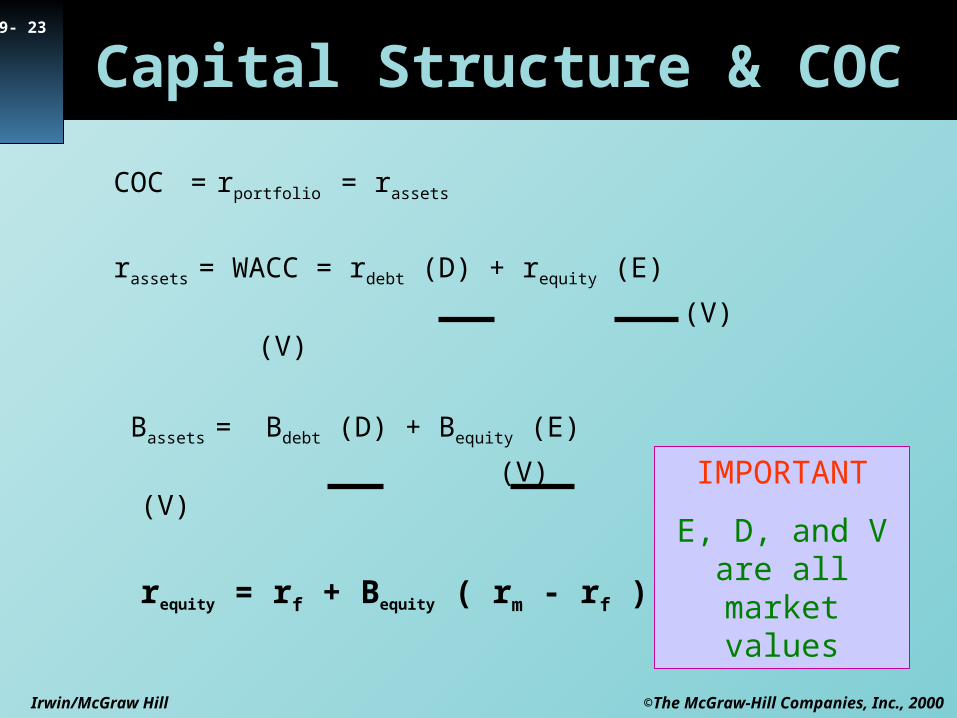
Capital Structure & COC
COC = rportfolio = rassets
rassets = WACC = rdebt (D) + requity (E)
(V) (V)
Bassets = Bdebt (D) + Bequity (E)
(V) (V)
requity = rf + Bequity ( rm - rf )
IMPORTANT
E, D, and V are all market values
©The McGraw-Hill Companies, Inc., 2000Irwin/McGraw Hill
9- 24
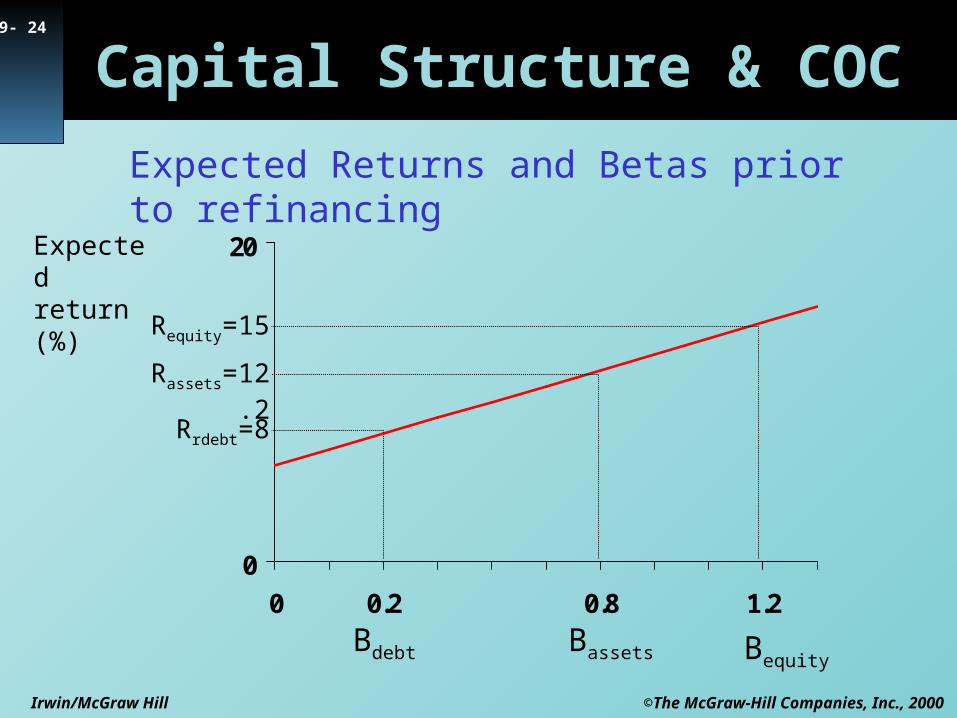
0
20
0 0.2 0.8 1.2
Capital Structure & COC
Expected return (%)
Bdebt Bassets Bequity
Rrdebt=8
Rassets=12.2
Requity=15
Expected Returns and Betas prior to refinancing
©The McGraw-Hill Companies, Inc., 2000Irwin/McGraw Hill
9- 25
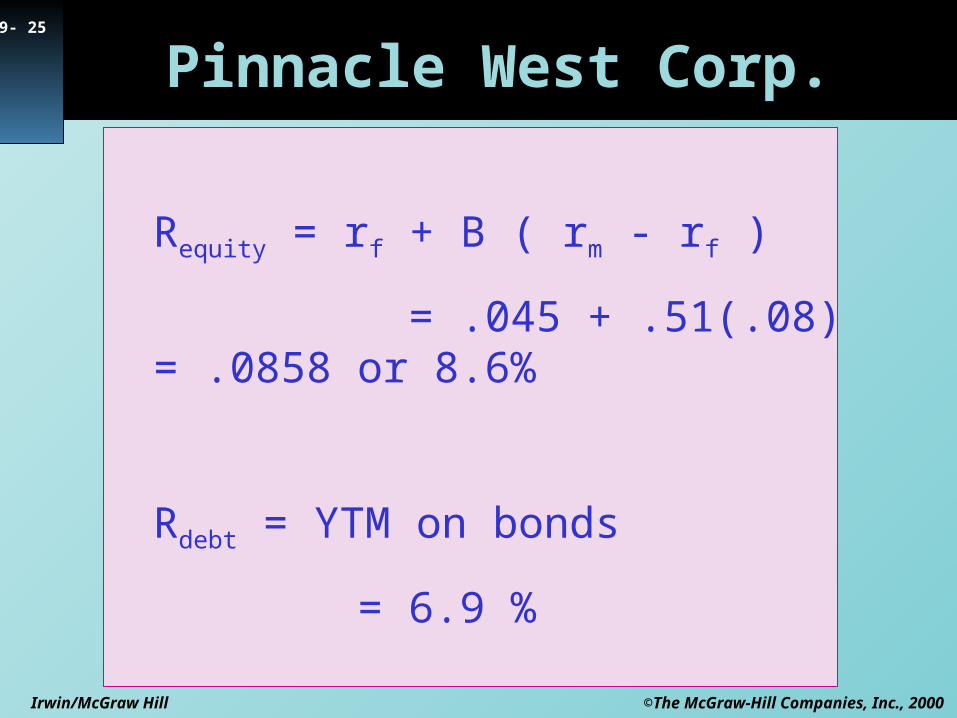
Pinnacle West Corp.
Requity = rf + B ( rm - rf )
= .045 + .51(.08) = .0858 or 8.6%
Rdebt = YTM on bonds
= 6.9 %
©The McGraw-Hill Companies, Inc., 2000Irwin/McGraw Hill
9- 26
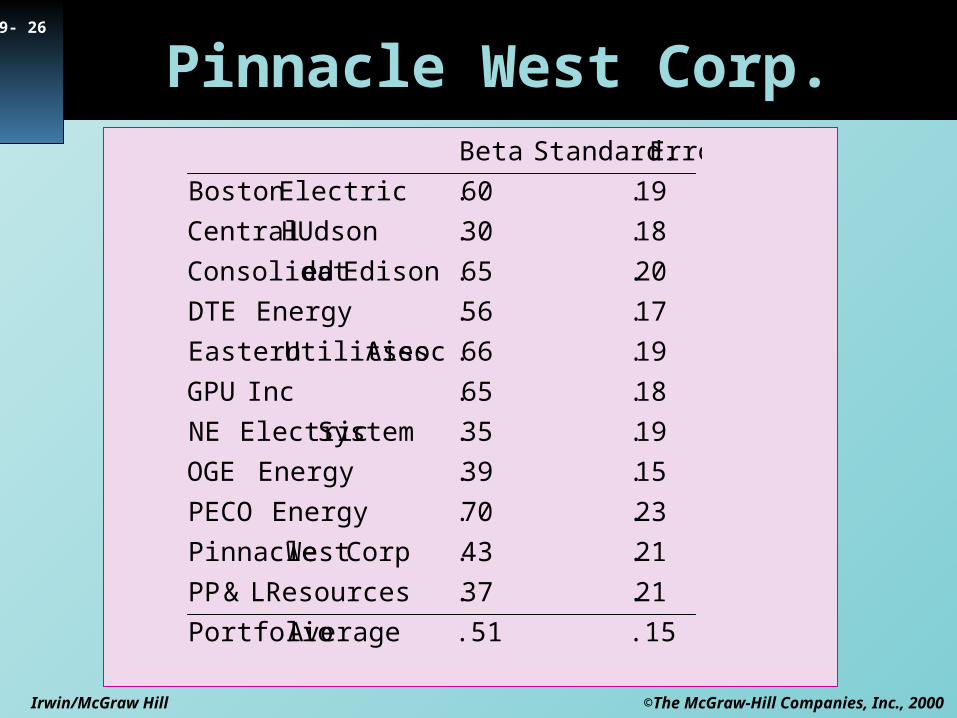
Pinnacle West Corp.
.15.51Average Portfolio
21.37.ResourcesL&PP
21.43.CorpWest Pinnacle
23.70. EnergyPECO
15.39. EnergyOGE
19.35.System ElectricNE
18.65.Inc GPU
19.66.Assoc UtilitiesEastern
17.56. EnergyDTE
20.65. EdisonedConsolidat
18.30. HUdsonCentral
19.60. ElectricBoston
ErrorStandard.Beta

©The McGraw-Hill Companies, Inc., 2000Irwin/McGraw Hill
9- 27
Pinnacle West Corp.
9.3%or .093
)10(.65.)08(.35.
equitydebtassets rV
Er
V
DrCOC
©The McGraw-Hill Companies, Inc., 2000Irwin/McGraw Hill
9- 28
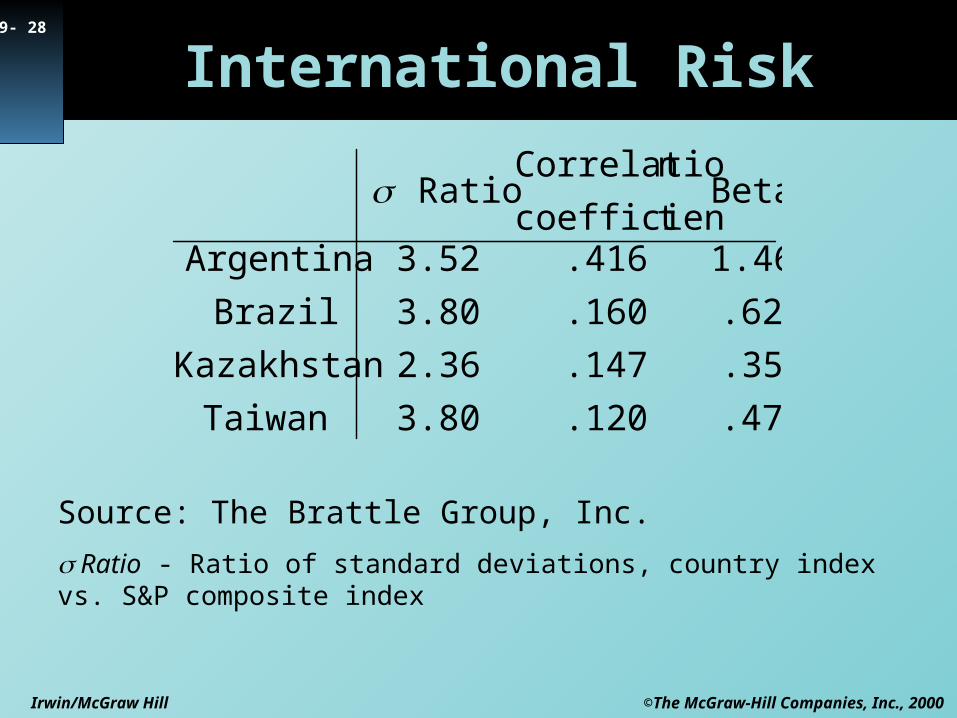
International Risk
.47.1203.80Taiwan
.35.1472.36Kazakhstan
.62.1603.80Brazil
1.46.4163.52Argentina
Betatcoefficien
nCorrelatio Ratio
Source: The Brattle Group, Inc.
Ratio - Ratio of standard deviations, country index vs. S&P composite index
©The McGraw-Hill Companies, Inc., 2000Irwin/McGraw Hill
9- 29
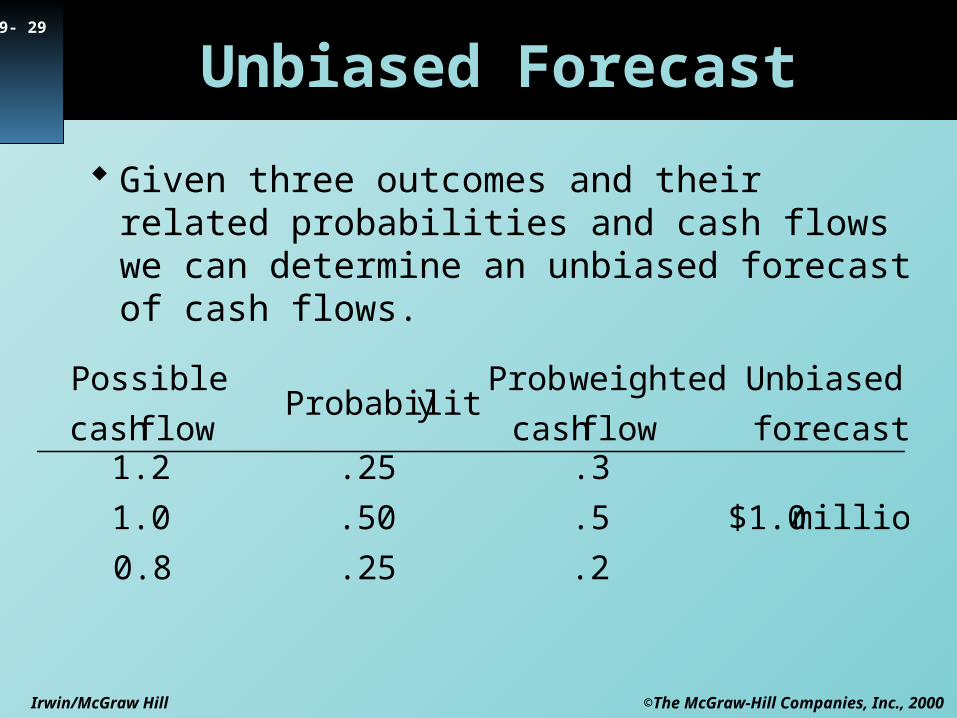
Unbiased Forecast
Given three outcomes and their related probabilities and cash flows we can determine an unbiased forecast of cash flows.
.2.250.8
million $1.0.5.501.0
.3.251.2forecast
Unbiased
flow cash
weightedProbyProbabilit
flow cash
Possible
©The McGraw-Hill Companies, Inc., 2000Irwin/McGraw Hill
9- 30
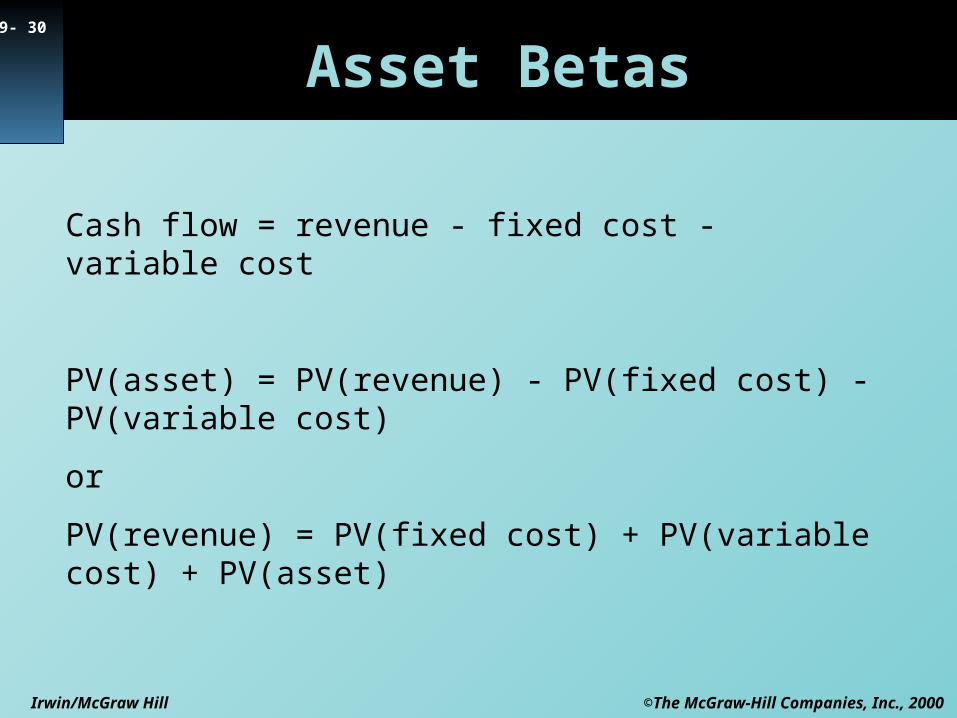
Asset Betas
Cash flow = revenue - fixed cost - variable cost
PV(asset) = PV(revenue) - PV(fixed cost) - PV(variable cost)
or
PV(revenue) = PV(fixed cost) + PV(variable cost) + PV(asset)
©The McGraw-Hill Companies, Inc., 2000Irwin/McGraw Hill
9- 31
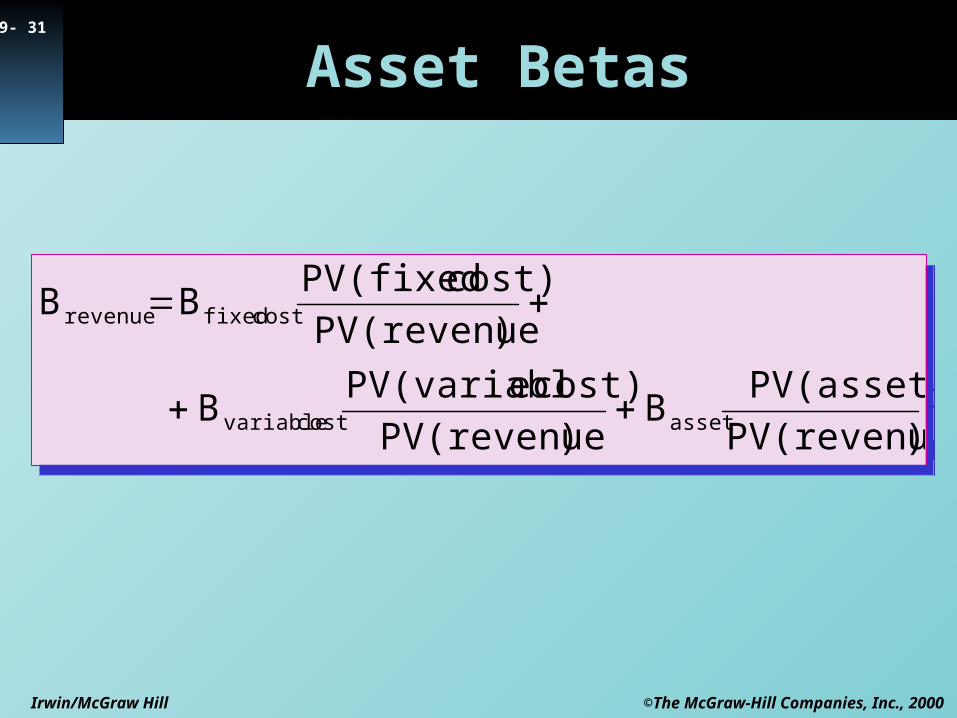
Asset Betas
)PV(revenue
PV(asset)B
)PV(revenue
cost) ePV(variablB
)PV(revenue
cost) PV(fixedBB
assetcost variable
cost fixedrevenue
)PV(revenue
PV(asset)B
)PV(revenue
cost) ePV(variablB
)PV(revenue
cost) PV(fixedBB
assetcost variable
cost fixedrevenue
©The McGraw-Hill Companies, Inc., 2000Irwin/McGraw Hill
9- 32
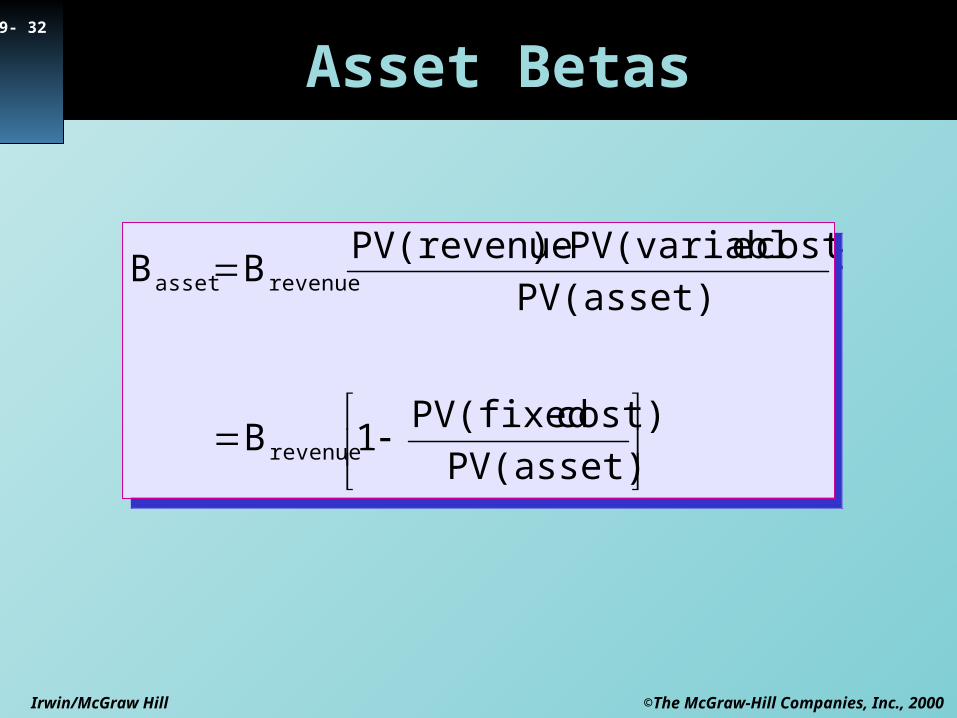
Asset Betas
PV(asset)
cost) PV(fixed1B
PV(asset)
cost) ePV(variabl-)PV(revenueBB
revenue
revenueasset
PV(asset)
cost) PV(fixed1B
PV(asset)
cost) ePV(variabl-)PV(revenueBB
revenue
revenueasset
©The McGraw-Hill Companies, Inc., 2000Irwin/McGraw Hill
9- 33
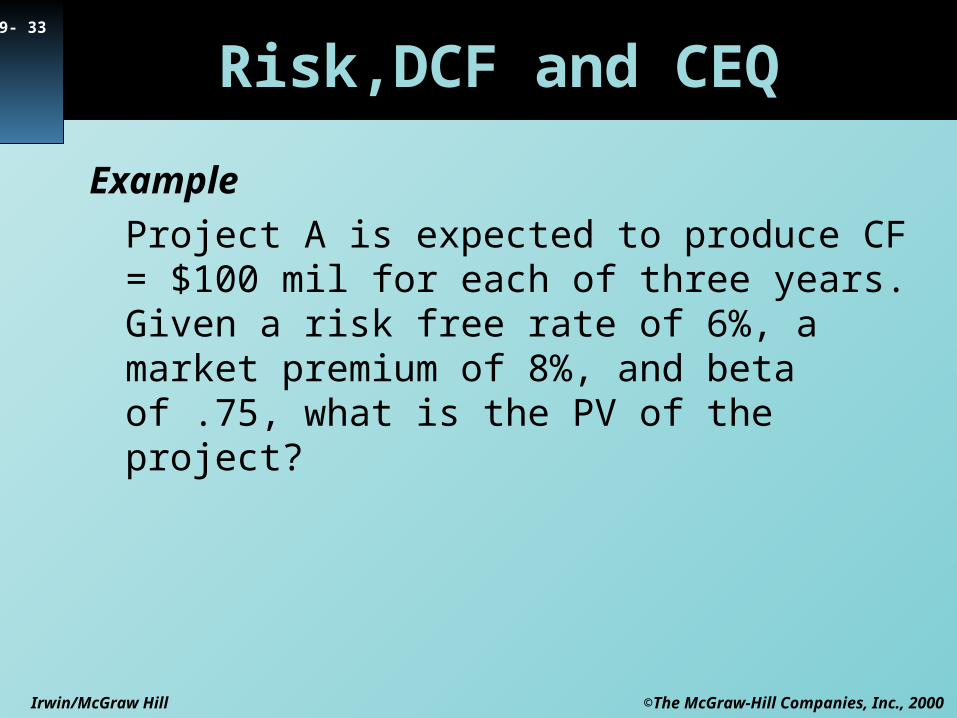
Risk,DCF and CEQ
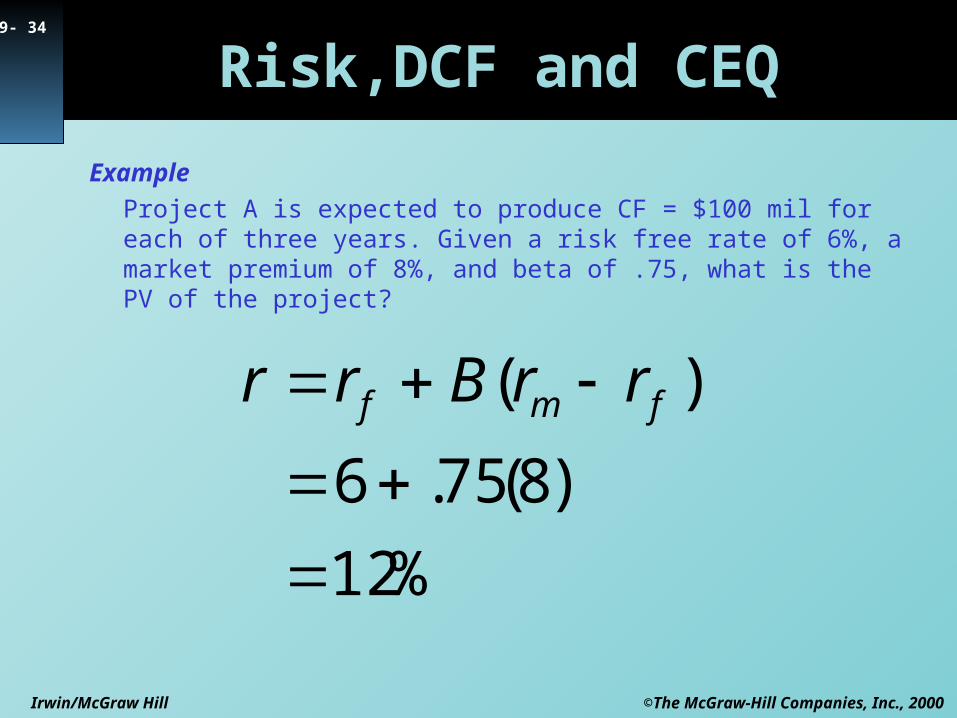
Example
Project A is expected to produce CF = $100 mil for each of three years. Given a risk free rate of 6%, a market premium of 8%, and beta of .75, what is the PV of the project?
©The McGraw-Hill Companies, Inc., 2000Irwin/McGraw Hill
9- 34
Risk,DCF and CEQ
Example
Project A is expected to produce CF = $100 mil for each of three years. Given a risk free rate of 6%, a market premium of 8%, and beta of .75, what is the PV of the project?
%12
)8(75.6
)(
fmf rrBrr
©The McGraw-Hill Companies, Inc., 2000Irwin/McGraw Hill
9- 35
Risk,DCF and CEQ
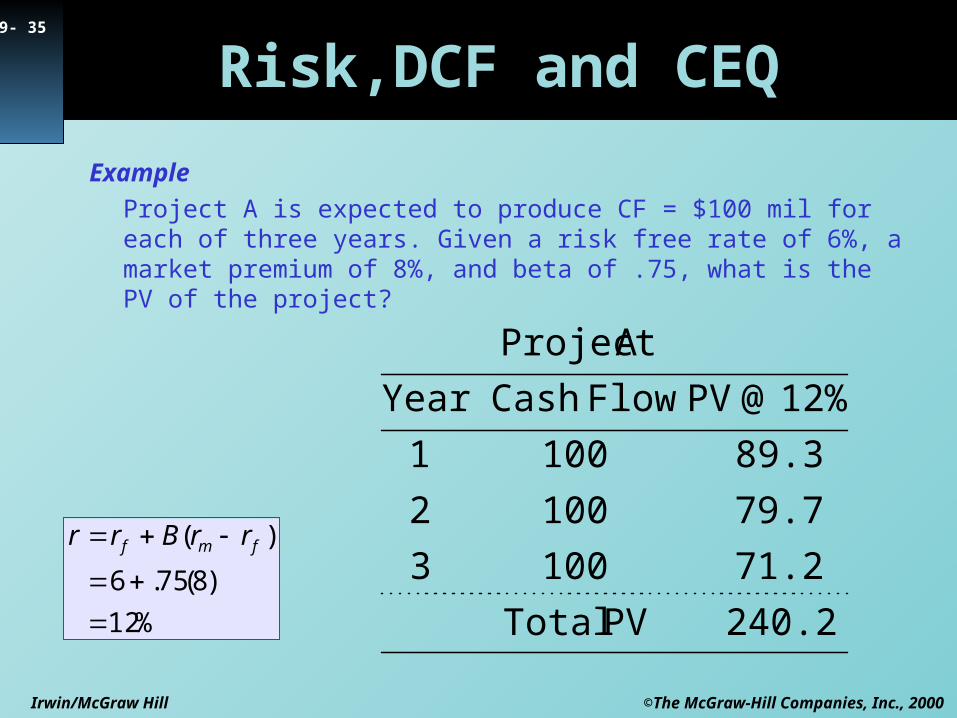
Example
Project A is expected to produce CF = $100 mil for each of three years. Given a risk free rate of 6%, a market premium of 8%, and beta of .75, what is the PV of the project?
%12
)8(75.6
)(
fmf rrBrr
240.2 PVTotal
71.21003
79.71002
89.31001
12% @ PV FlowCashYear
AProject
©The McGraw-Hill Companies, Inc., 2000Irwin/McGraw Hill
9- 36
Risk,DCF and CEQ
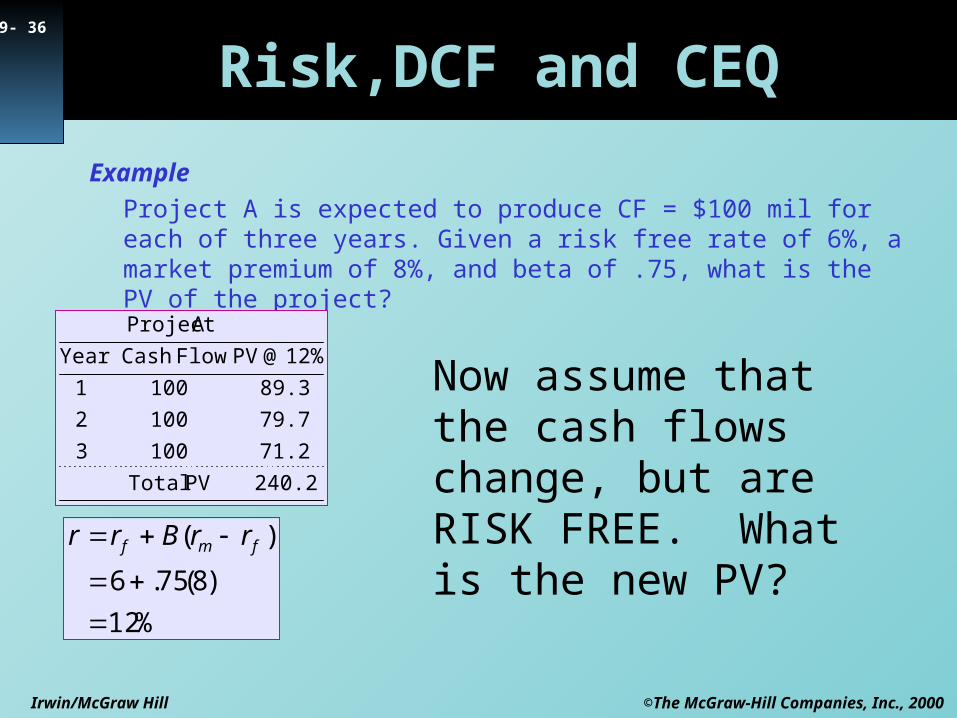
Example
Project A is expected to produce CF = $100 mil for each of three years. Given a risk free rate of 6%, a market premium of 8%, and beta of .75, what is the PV of the project?
%12
)8(75.6
)(
fmf rrBrr
240.2 PVTotal
71.21003
79.71002
89.31001
12% @ PV FlowCashYear
AProject
Now assume that the cash flows change, but are RISK FREE. What is the new PV?
©The McGraw-Hill Companies, Inc., 2000Irwin/McGraw Hill
9- 37
Risk,DCF and CEQ
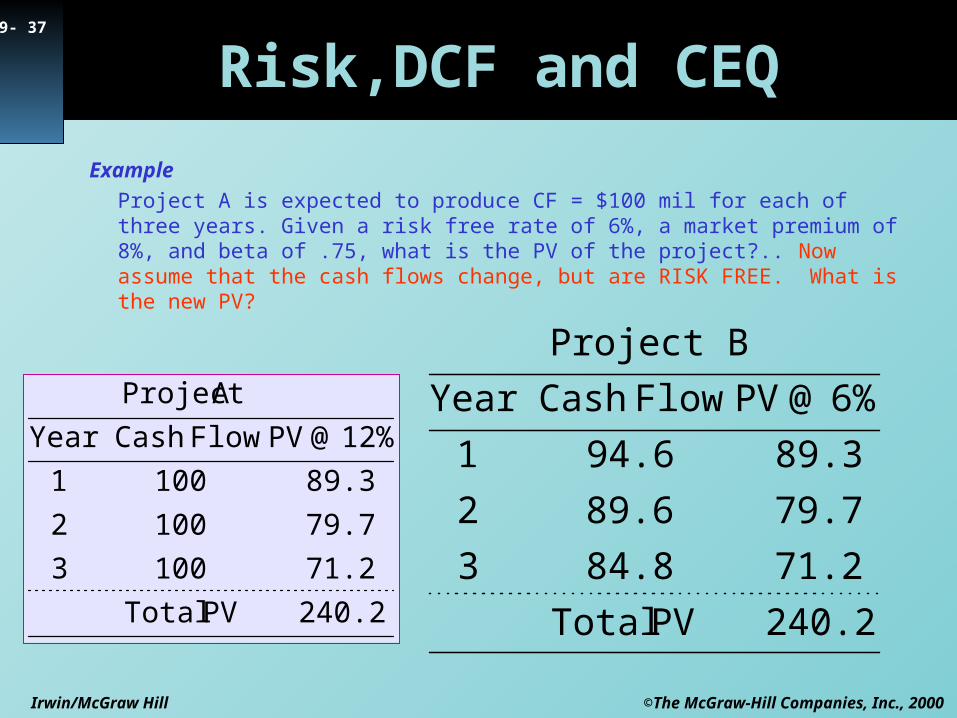
Example
Project A is expected to produce CF = $100 mil for each of three years. Given a risk free rate of 6%, a market premium of 8%, and beta of .75, what is the PV of the project?.. Now assume that the cash flows change, but are RISK FREE. What is the new PV?
240.2 PVTotal
71.284.83
79.789.62
89.394.61
6% @ PV FlowCashYear
Project B
240.2 PVTotal
71.21003
79.71002
89.31001
12% @ PV FlowCashYear
AProject
©The McGraw-Hill Companies, Inc., 2000Irwin/McGraw Hill
9- 38
Risk,DCF and CEQ
Example
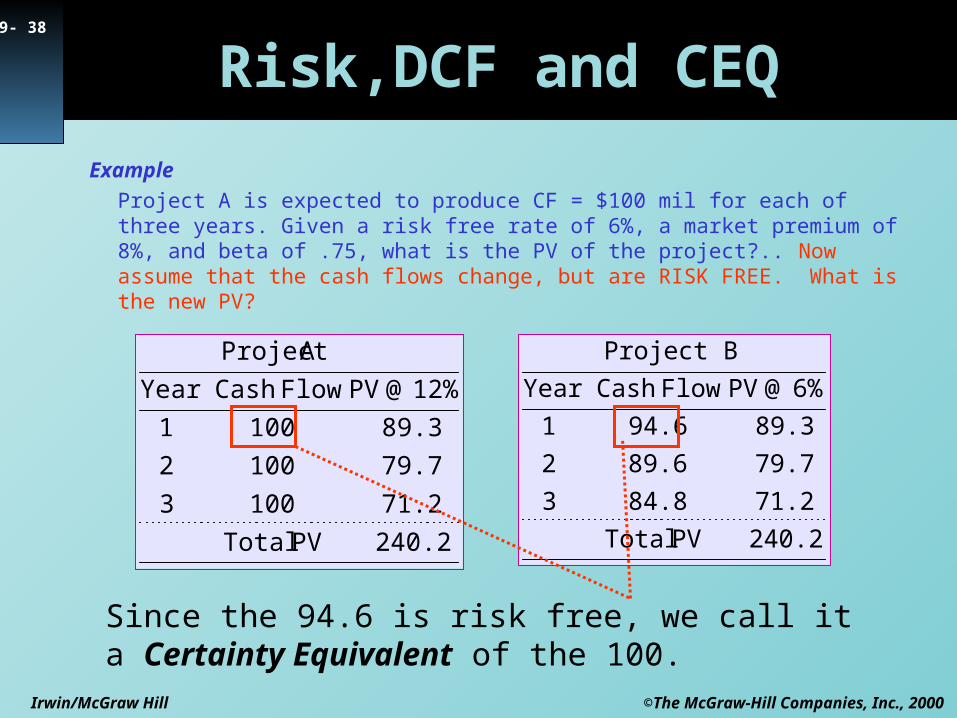
Project A is expected to produce CF = $100 mil for each of three years. Given a risk free rate of 6%, a market premium of 8%, and beta of .75, what is the PV of the project?.. Now assume that the cash flows change, but are RISK FREE. What is the new PV?
240.2 PVTotal
71.284.83
79.789.62
89.394.61
6% @ PV FlowCashYear
Project B
240.2 PVTotal
71.21003
79.71002
89.31001
12% @ PV FlowCashYear
AProject
Since the 94.6 is risk free, we call it a Certainty Equivalent of the 100.
©The McGraw-Hill Companies, Inc., 2000Irwin/McGraw Hill
9- 39
Risk,DCF and CEQ
Example
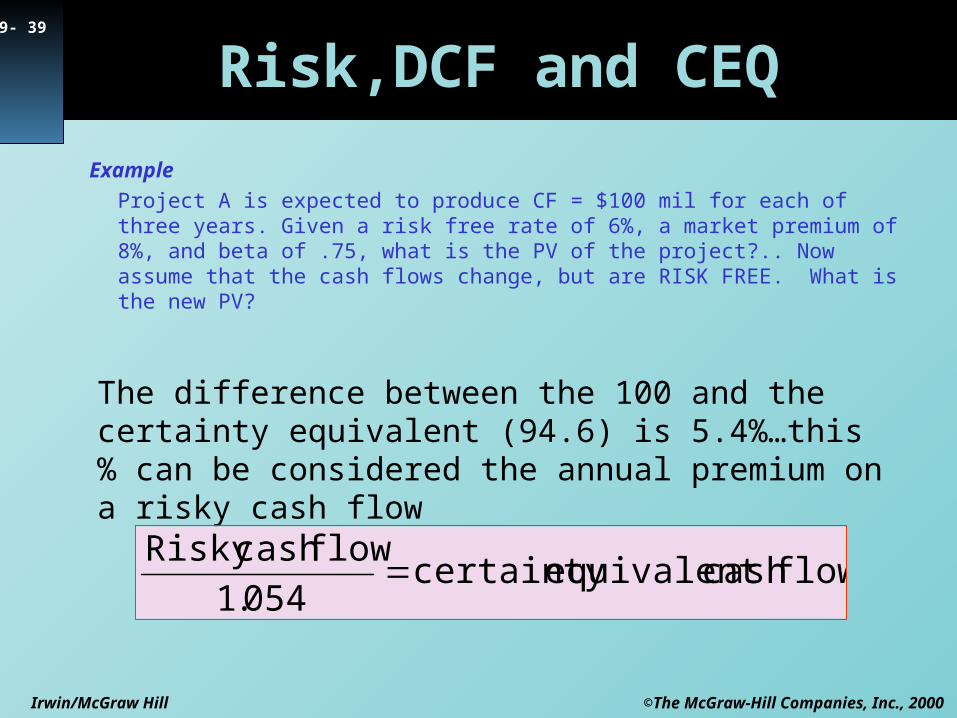
Project A is expected to produce CF = $100 mil for each of three years. Given a risk free rate of 6%, a market premium of 8%, and beta of .75, what is the PV of the project?.. Now assume that the cash flows change, but are RISK FREE. What is the new PV?
The difference between the 100 and the certainty equivalent (94.6) is 5.4%…this % can be considered the annual premium on a risky cash flow
flow cash equivalentcertainty 054.1
flow cashRisky
©The McGraw-Hill Companies, Inc., 2000Irwin/McGraw Hill
9- 40
Risk,DCF and CEQ
Example
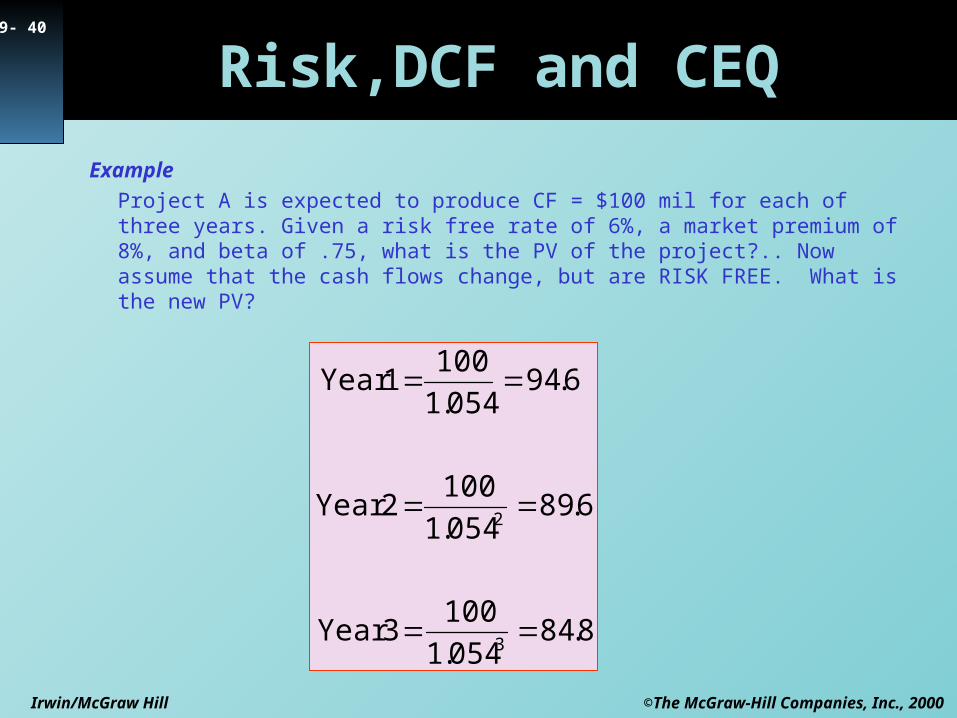
Project A is expected to produce CF = $100 mil for each of three years. Given a risk free rate of 6%, a market premium of 8%, and beta of .75, what is the PV of the project?.. Now assume that the cash flows change, but are RISK FREE. What is the new PV?
8.84054.1
100 3Year
6.89054.1
100 2Year
6.94054.1
100 1Year
3
2
©The McGraw-Hill Companies, Inc., 2000Irwin/McGraw Hill
9- 41
Risk,DCF and CEQ
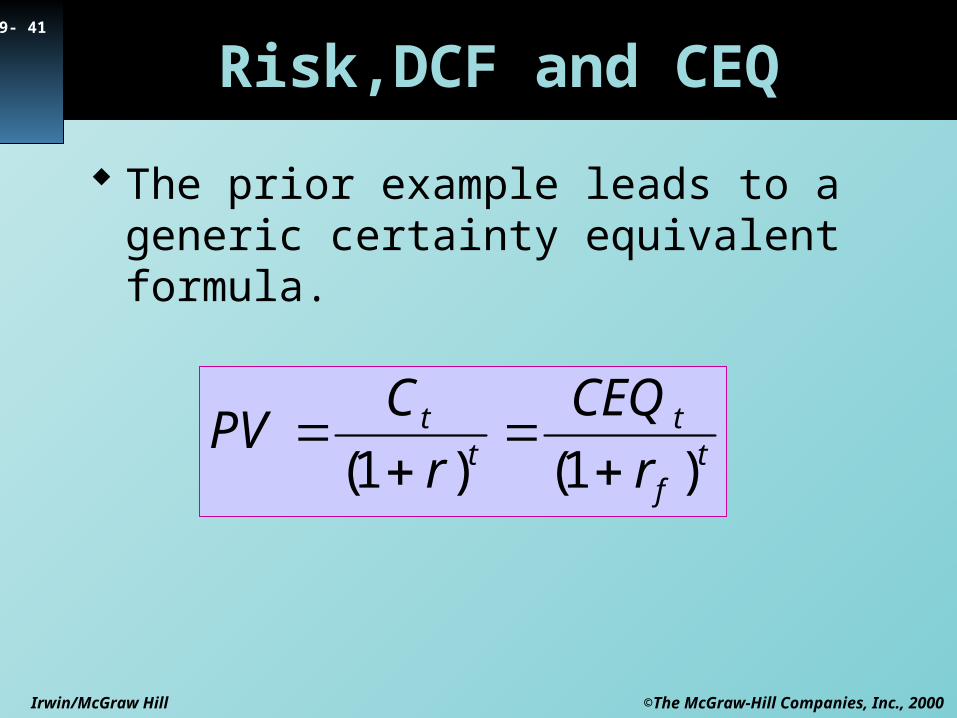
The prior example leads to a generic certainty equivalent formula.
tf
tt
t
r
CEQ
r
CPV
)1()1(