Embed Size (px)
Citation preview
Working With Financial Statements
P.V. Viswanath
For use with
Fundamentals of Corporate Finance
Brealey, Myers and Marcus, 4th ed.
P.V. Viswanath 2
Key Concepts and Skills
Know how to standardize financial statements for comparison purposes
Know how to compute and interpret important financial ratios
Know the determinants of a firm’s profitability and growth
Understand the problems and pitfalls in financial statement analysis
P.V. Viswanath 3
Chapter Outline
Standardized Financial Statements Ratio Analysis The Du Pont Identity Internal and Sustainable Growth Using Financial Statement Information
P.V. Viswanath 4
Standardized Financial Statements
Common-Size Balance Sheets Compute all accounts as a percent of total assets
Common-Size Income Statements Compute all line items as a percent of sales
Standardized statements make it easier to compare financial information, particularly as the company grows
They are also useful for comparing companies of different sizes, particularly within the same industry
P.V. Viswanath 5
Ratio Analysis
Ratios also allow for better comparison through time or between companies
As we look at each ratio, ask yourself what the ratio is trying to measure and why is that information important
Ratios are used both internally and externally
P.V. Viswanath 6
Categories of Financial Ratios
Liquidity ratios Short-term solvency or how easily the firm can lay its hands on
cash.
Financial leverage ratios Show long-term solvency; how heavily the firm is in debt.
Efficiency or turnover ratios Indicate how productively the firm is using its assets
Profitability ratios Used to measure the firm’s return on its investments
Market value ratios
P.V. Viswanath 7
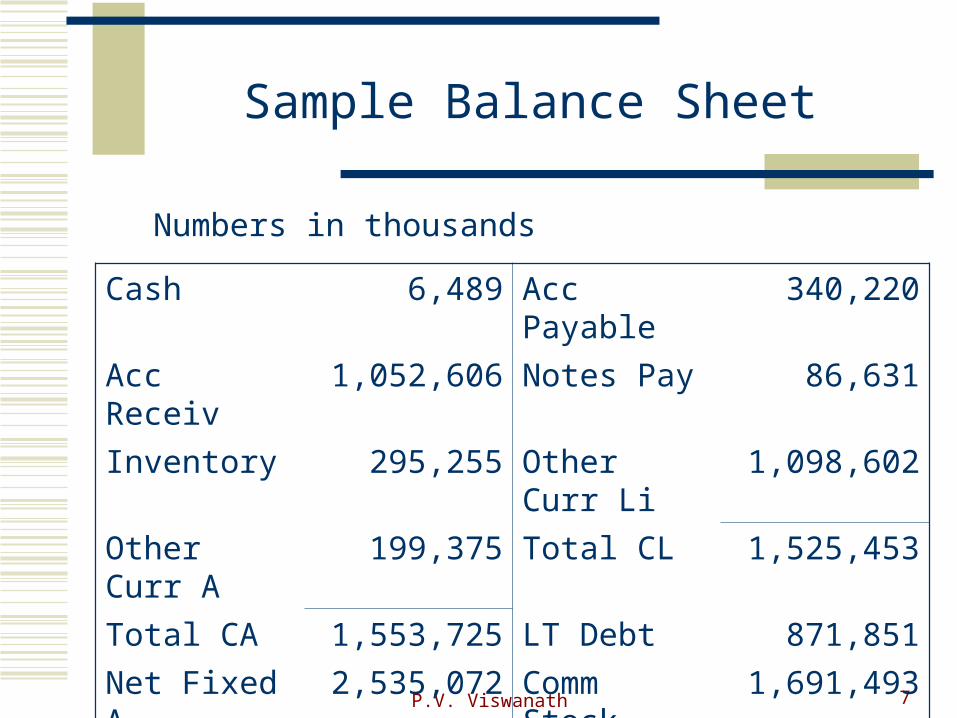
Sample Balance Sheet
Cash 6,489 Acc Payable 340,220
Acc Receiv 1,052,606 Notes Pay 86,631
Inventory 295,255 Other Curr Li 1,098,602
Other Curr A 199,375 Total CL 1,525,453
Total CA 1,553,725 LT Debt 871,851
Net Fixed A 2,535,072 Comm Stock 1,691,493
Total Assets 4,088,797 Tot Liab & Eq 4,088,797
Numbers in thousands
P.V. Viswanath 8
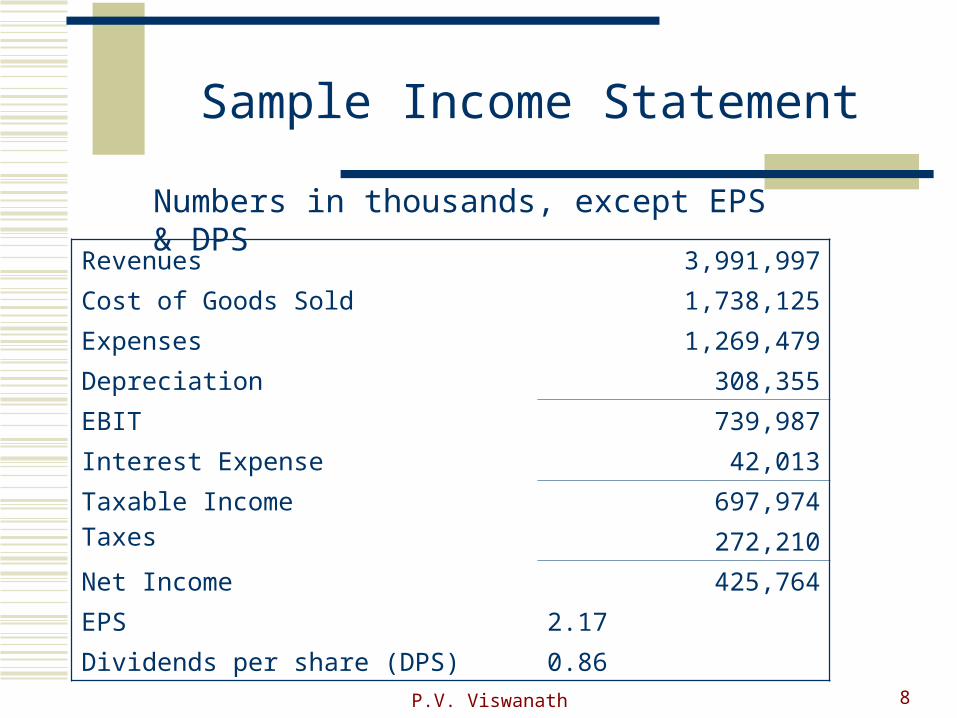
Sample Income Statement
Revenues 3,991,997
Cost of Goods Sold 1,738,125
Expenses 1,269,479
Depreciation 308,355
EBIT 739,987
Interest Expense 42,013
Taxable Income 697,974
Taxes 272,210
Net Income 425,764
EPS 2.17
Dividends per share (DPS) 0.86
Numbers in thousands, except EPS & DPS
P.V. Viswanath 9
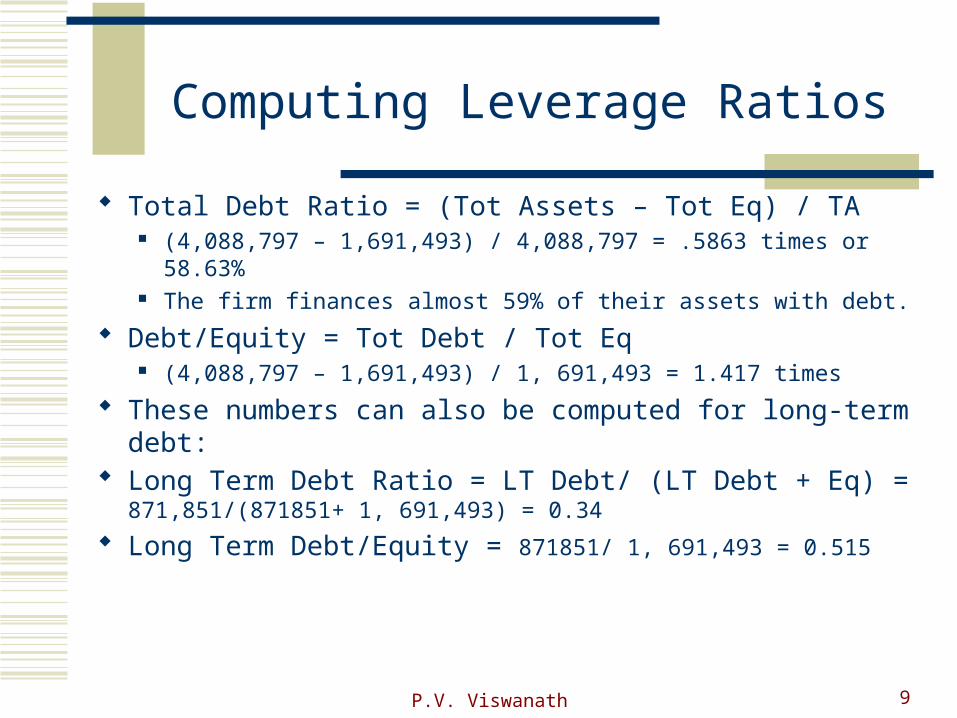
Computing Leverage Ratios
Total Debt Ratio = (Tot Assets – Tot Eq) / TA (4,088,797 – 1,691,493) / 4,088,797 = .5863 times or 58.63% The firm finances almost 59% of their assets with debt.
Debt/Equity = Tot Debt / Tot Eq (4,088,797 – 1,691,493) / 1, 691,493 = 1.417 times
These numbers can also be computed for long-term debt: Long Term Debt Ratio = LT Debt/ (LT Debt + Eq) =
871,851/(871851+ 1, 691,493) = 0.34
Long Term Debt/Equity = 871851/ 1, 691,493 = 0.515
P.V. Viswanath 10
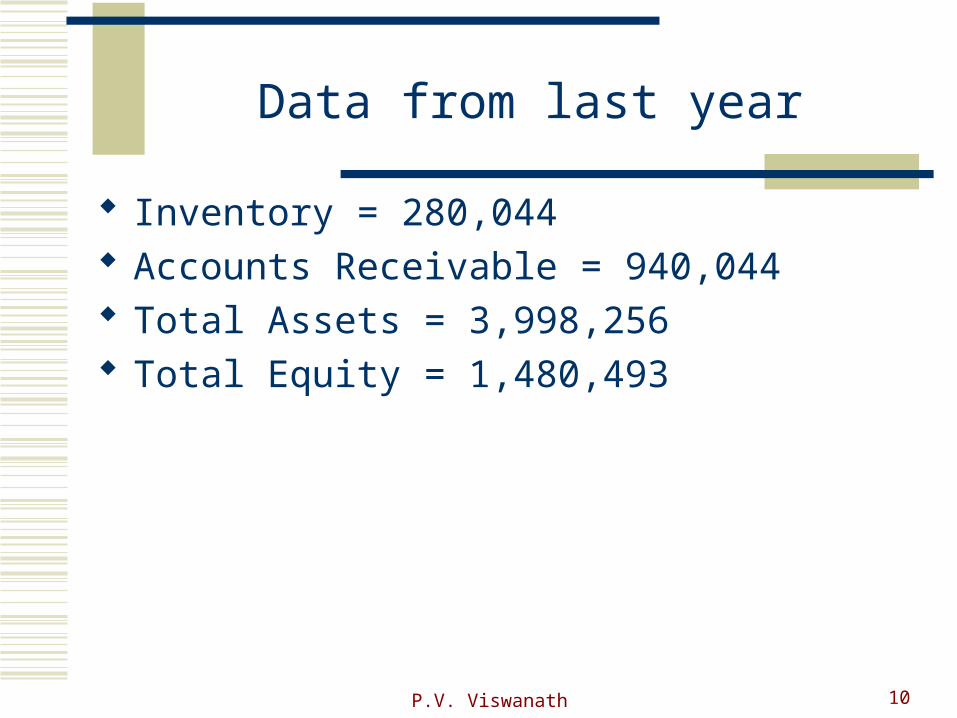
Data from last year
Inventory = 280,044 Accounts Receivable = 940,044 Total Assets = 3,998,256 Total Equity = 1,480,493
P.V. Viswanath 11
Computing Coverage Ratios
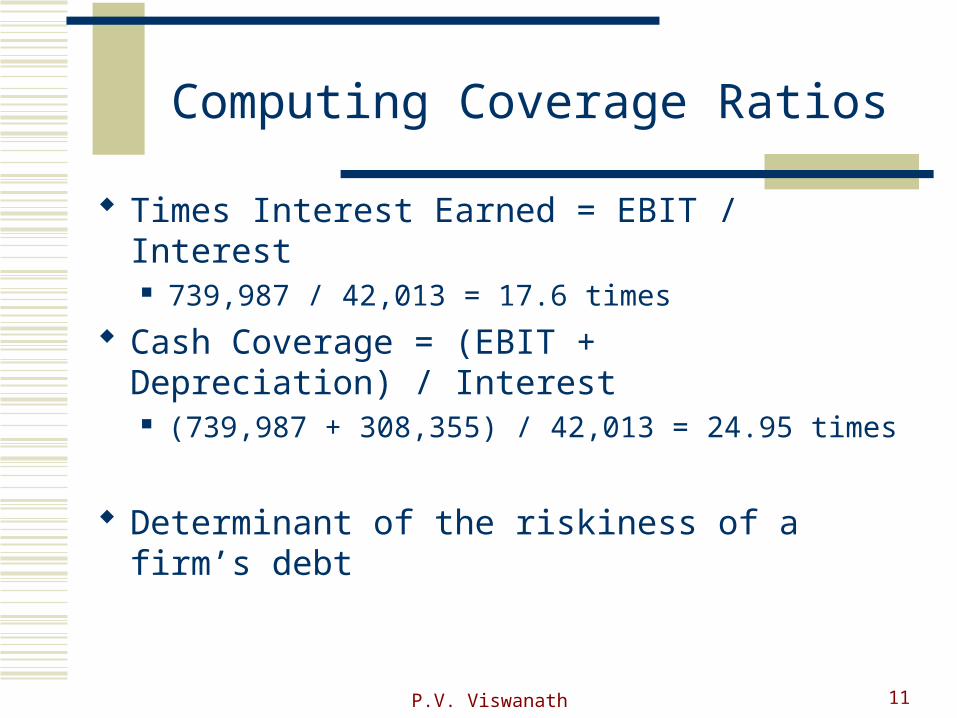
Times Interest Earned = EBIT / Interest 739,987 / 42,013 = 17.6 times
Cash Coverage = (EBIT + Depreciation) / Interest (739,987 + 308,355) / 42,013 = 24.95 times
Determinant of the riskiness of a firm’s debt
P.V. Viswanath 12
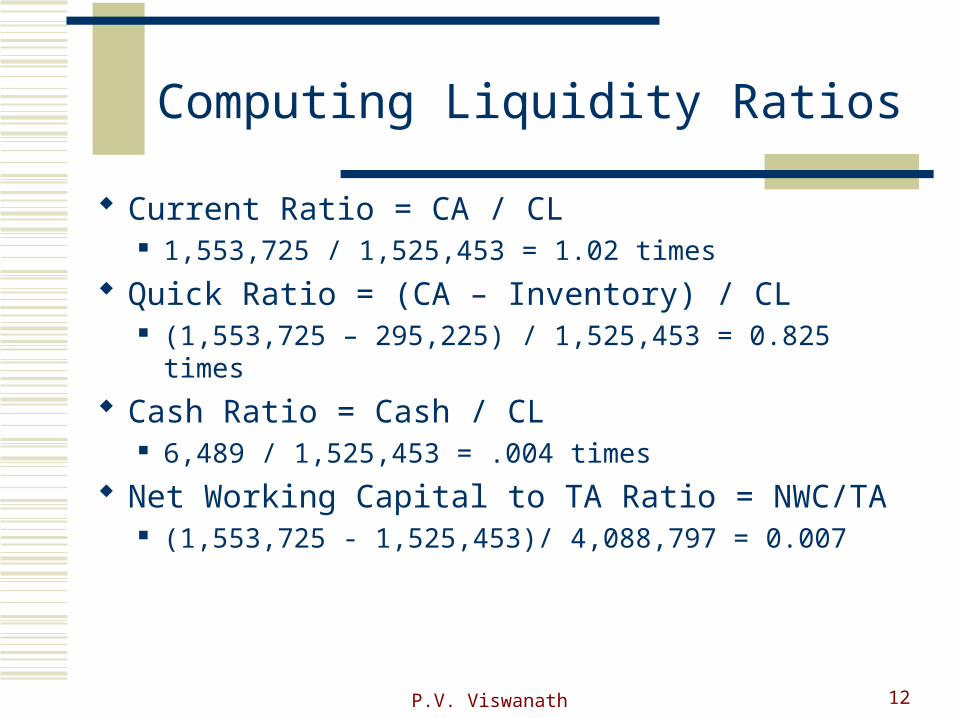
Computing Liquidity Ratios
Current Ratio = CA / CL 1,553,725 / 1,525,453 = 1.02 times
Quick Ratio = (CA – Inventory) / CL (1,553,725 – 295,225) / 1,525,453 = 0.825 times
Cash Ratio = Cash / CL 6,489 / 1,525,453 = .004 times
Net Working Capital to TA Ratio = NWC/TA (1,553,725 - 1,525,453)/ 4,088,797 = 0.007
P.V. Viswanath 13
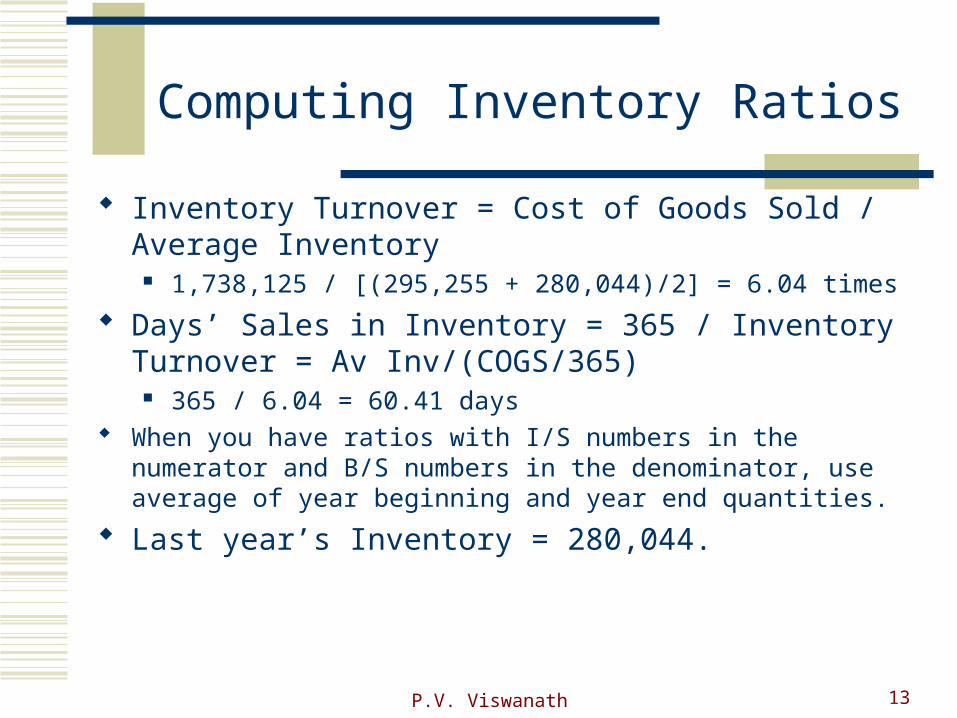
Computing Inventory Ratios
Inventory Turnover = Cost of Goods Sold / Average Inventory
1,738,125 / [(295,255 + 280,044)/2] = 6.04 times
Days’ Sales in Inventory = 365 / Inventory Turnover = Av Inv/(COGS/365)
365 / 6.04 = 60.41 days When you have ratios with I/S numbers in the numerator and B/S
numbers in the denominator, use average of year beginning and year end quantities.
Last year’s Inventory = 280,044.
P.V. Viswanath 14
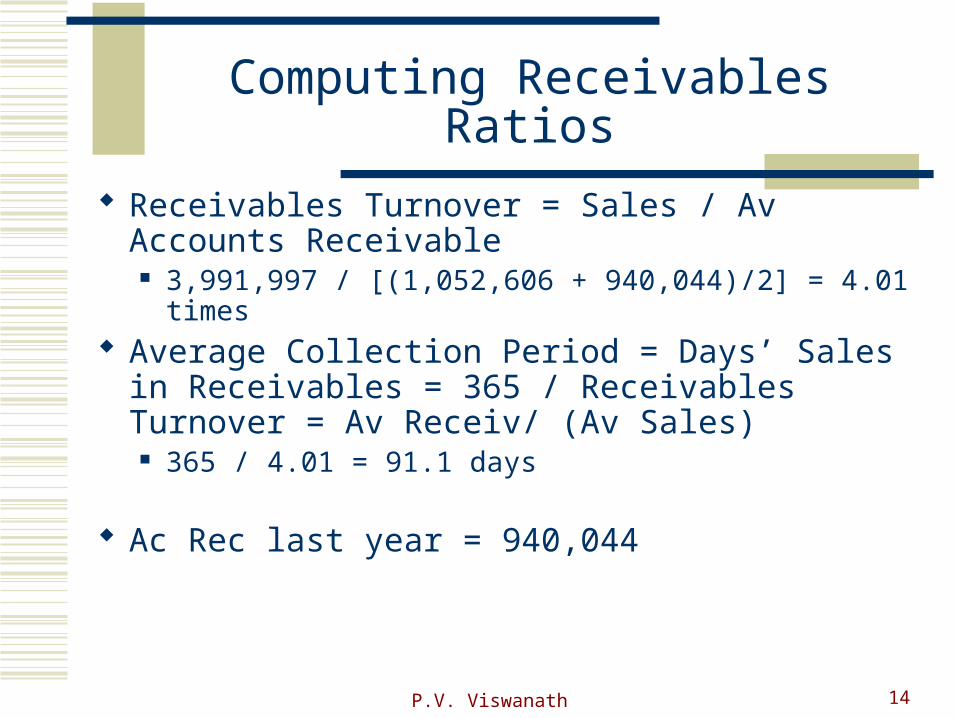
Computing Receivables Ratios
Receivables Turnover = Sales / Av Accounts Receivable 3,991,997 / [(1,052,606 + 940,044)/2] = 4.01 times
Average Collection Period = Days’ Sales in Receivables = 365 / Receivables Turnover = Av Receiv/ (Av Sales) 365 / 4.01 = 91.1 days
Ac Rec last year = 940,044
P.V. Viswanath 15
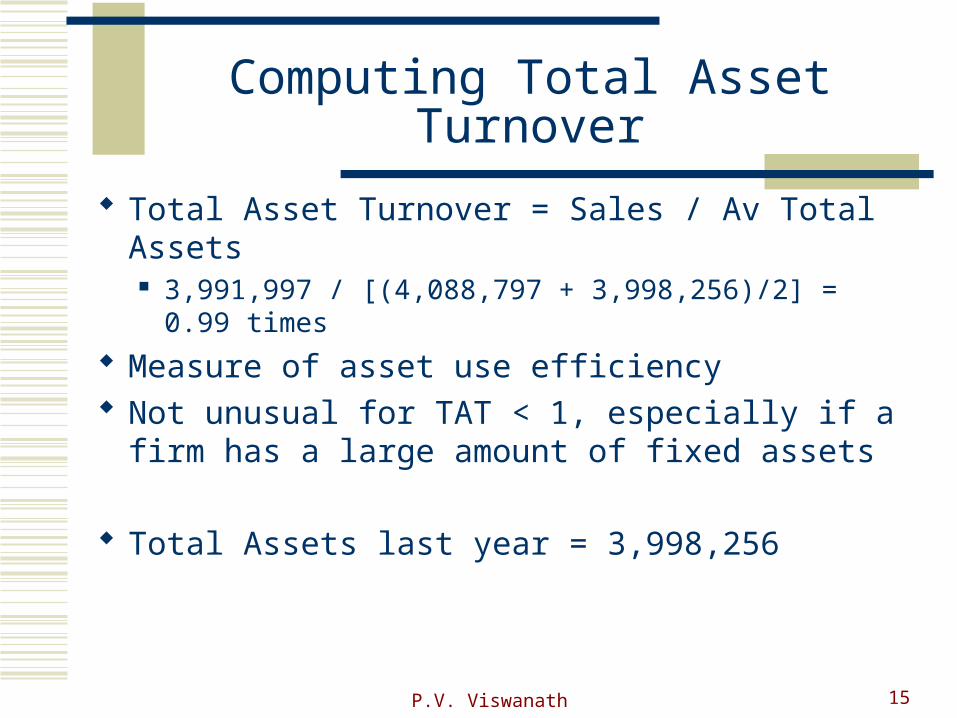
Computing Total Asset Turnover
Total Asset Turnover = Sales / Av Total Assets 3,991,997 / [(4,088,797 + 3,998,256)/2] = 0.99 times
Measure of asset use efficiency Not unusual for TAT < 1, especially if a firm has a
large amount of fixed assets
Total Assets last year = 3,998,256
P.V. Viswanath 16
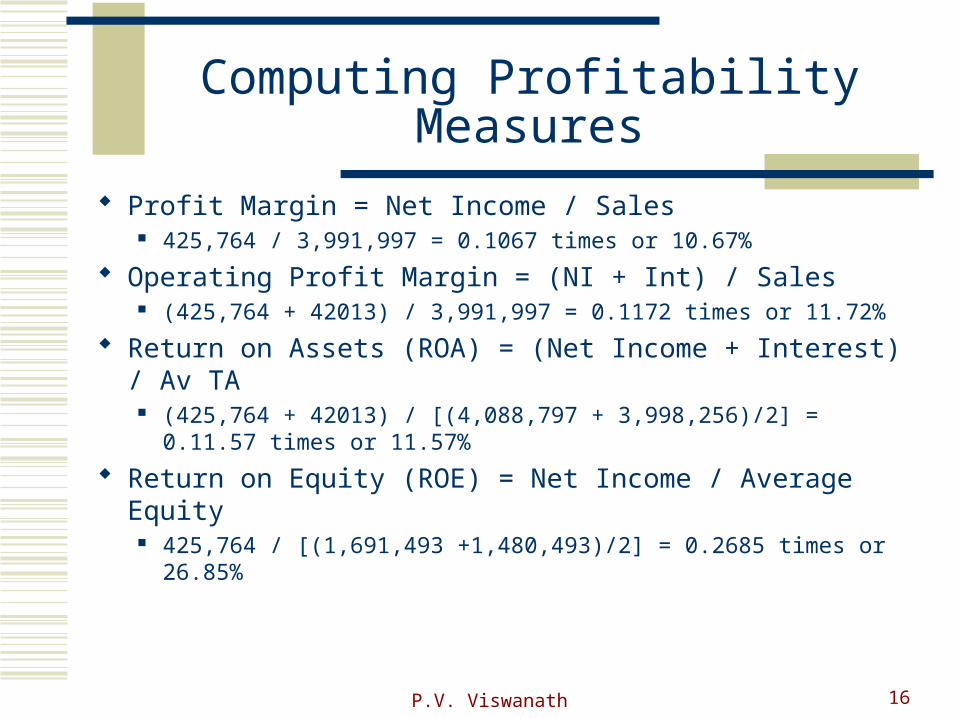
Computing Profitability Measures
Profit Margin = Net Income / Sales 425,764 / 3,991,997 = 0.1067 times or 10.67%
Operating Profit Margin = (NI + Int) / Sales (425,764 + 42013) / 3,991,997 = 0.1172 times or 11.72%
Return on Assets (ROA) = (Net Income + Interest) / Av TA (425,764 + 42013) / [(4,088,797 + 3,998,256)/2] = 0.11.57 times or
11.57%
Return on Equity (ROE) = Net Income / Average Equity 425,764 / [(1,691,493 +1,480,493)/2] = 0.2685 times or 26.85%
P.V. Viswanath 17
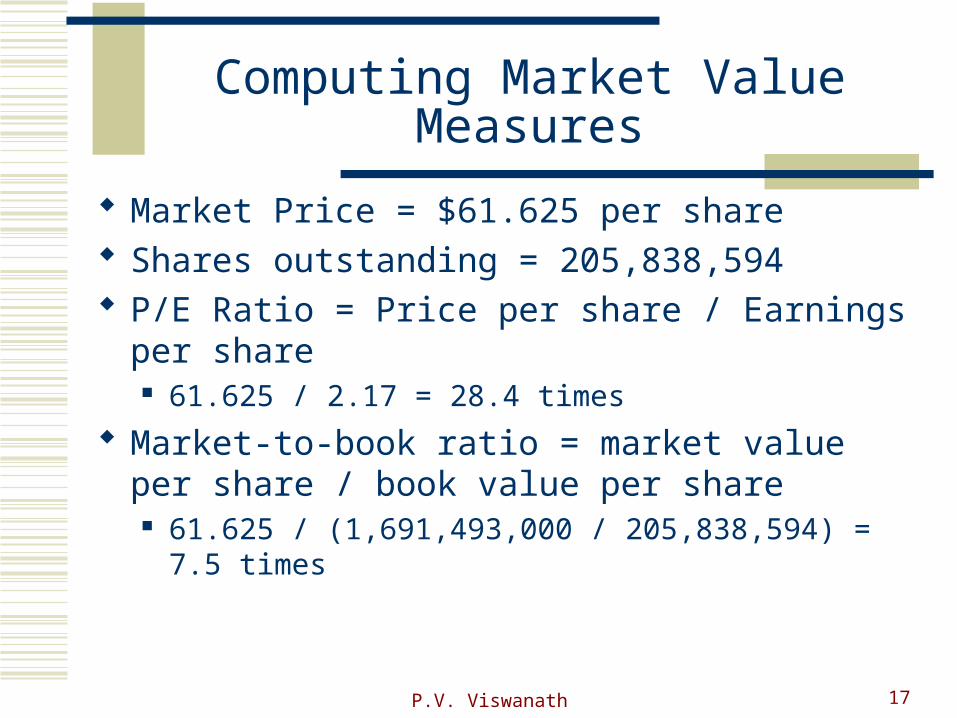
Computing Market Value Measures
Market Price = $61.625 per share Shares outstanding = 205,838,594 P/E Ratio = Price per share / Earnings per share
61.625 / 2.17 = 28.4 times
Market-to-book ratio = market value per share / book value per share 61.625 / (1,691,493,000 / 205,838,594) = 7.5 times
P.V. Viswanath 18
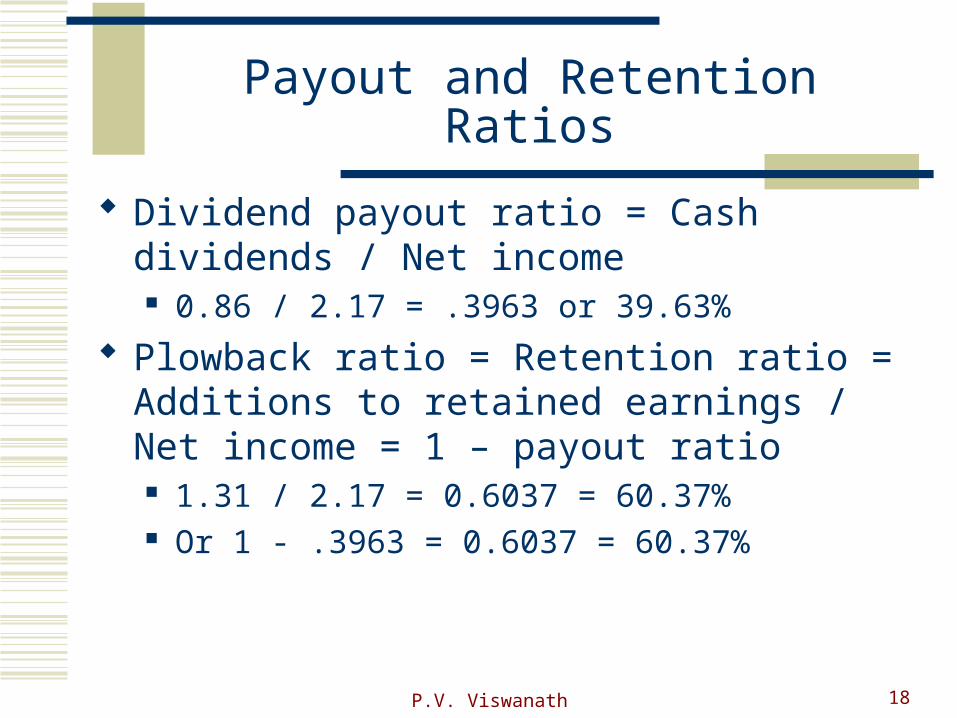
Payout and Retention Ratios
Dividend payout ratio = Cash dividends / Net income 0.86 / 2.17 = .3963 or 39.63%
Plowback ratio = Retention ratio = Additions to retained earnings / Net income = 1 – payout ratio 1.31 / 2.17 = 0.6037 = 60.37% Or 1 - .3963 = 0.6037 = 60.37%
P.V. Viswanath 19
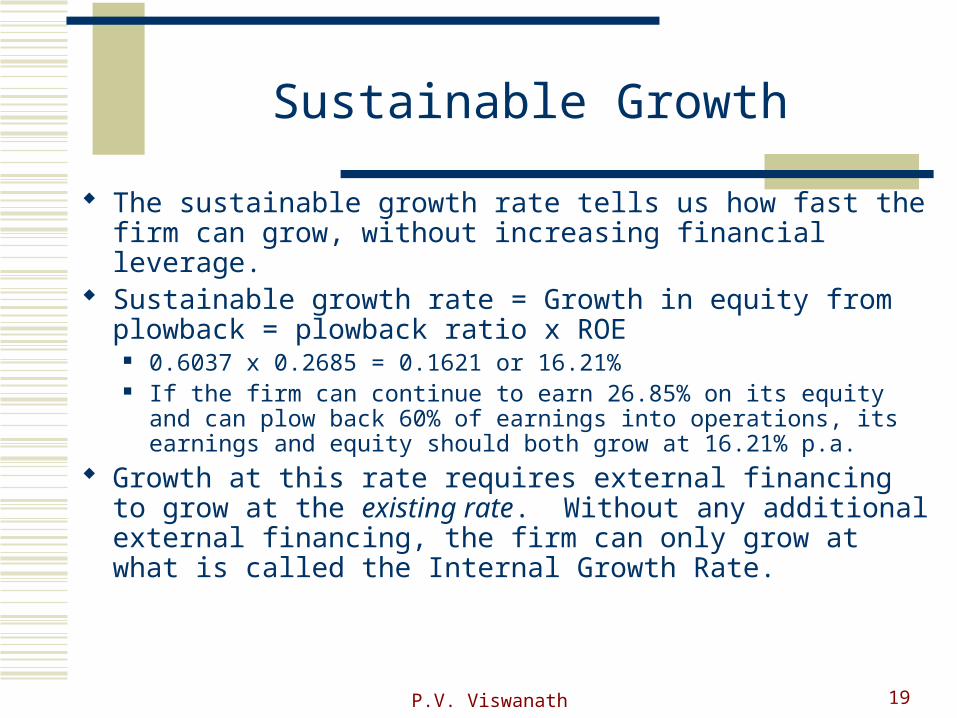
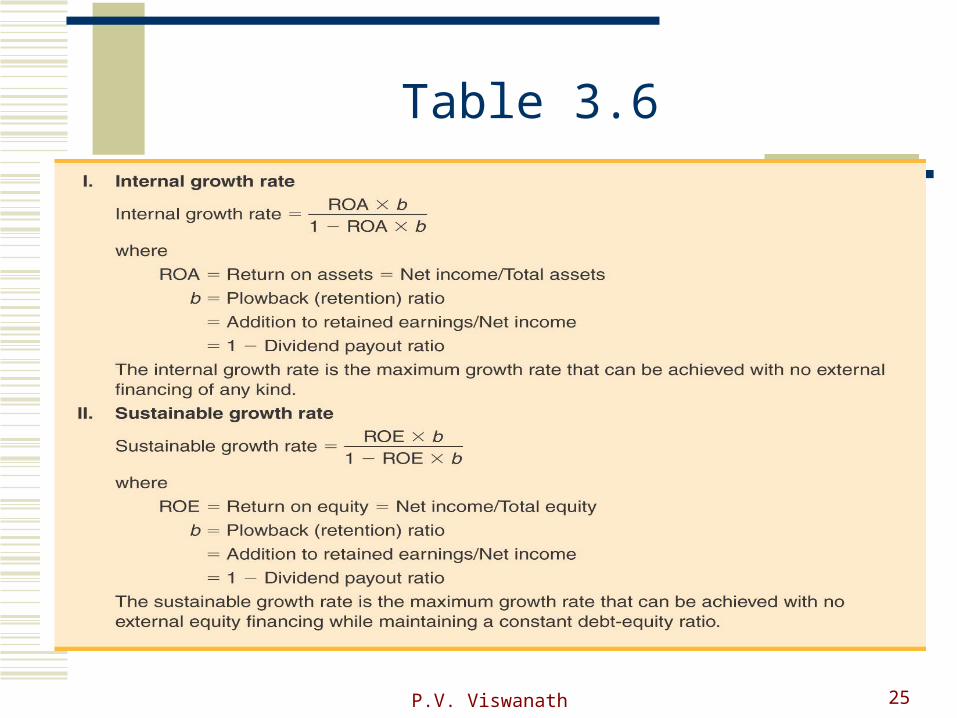
Sustainable Growth
The sustainable growth rate tells us how fast the firm can grow, without increasing financial leverage.
Sustainable growth rate = Growth in equity from plowback = plowback ratio x ROE
0.6037 x 0.2685 = 0.1621 or 16.21% If the firm can continue to earn 26.85% on its equity and can plow back
60% of earnings into operations, its earnings and equity should both grow at 16.21% p.a.
Growth at this rate requires external financing to grow at the existing rate. Without any additional external financing, the firm can only grow at what is called the Internal Growth Rate.
P.V. Viswanath 20
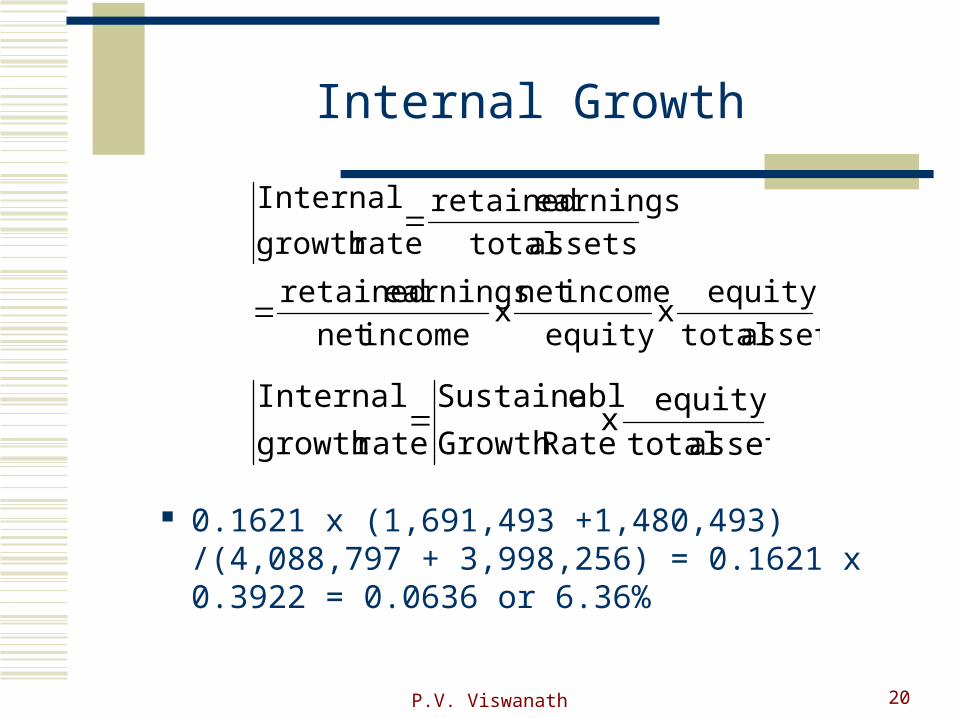
Internal Growth
0.1621 x (1,691,493 +1,480,493) /(4,088,797 + 3,998,256) = 0.1621 x 0.3922 = 0.0636 or 6.36%
assets total
equityx
equity
incomenet x
incomenet
earnings retained
assets total
earnings retained
rategrowth
Internal
assets total
equityx
RateGrowth
eSustainabl
rategrowth
Internal
P.V. Viswanath 21
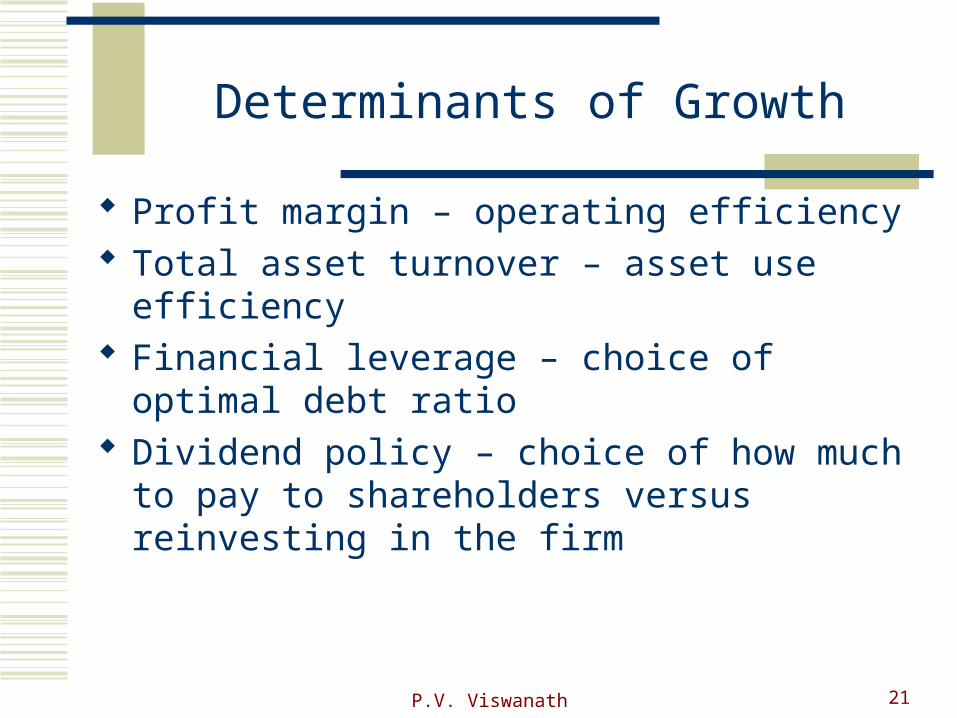
Determinants of Growth
Profit margin – operating efficiency Total asset turnover – asset use efficiency Financial leverage – choice of optimal debt ratio Dividend policy – choice of how much to pay to
shareholders versus reinvesting in the firm
P.V. Viswanath 22
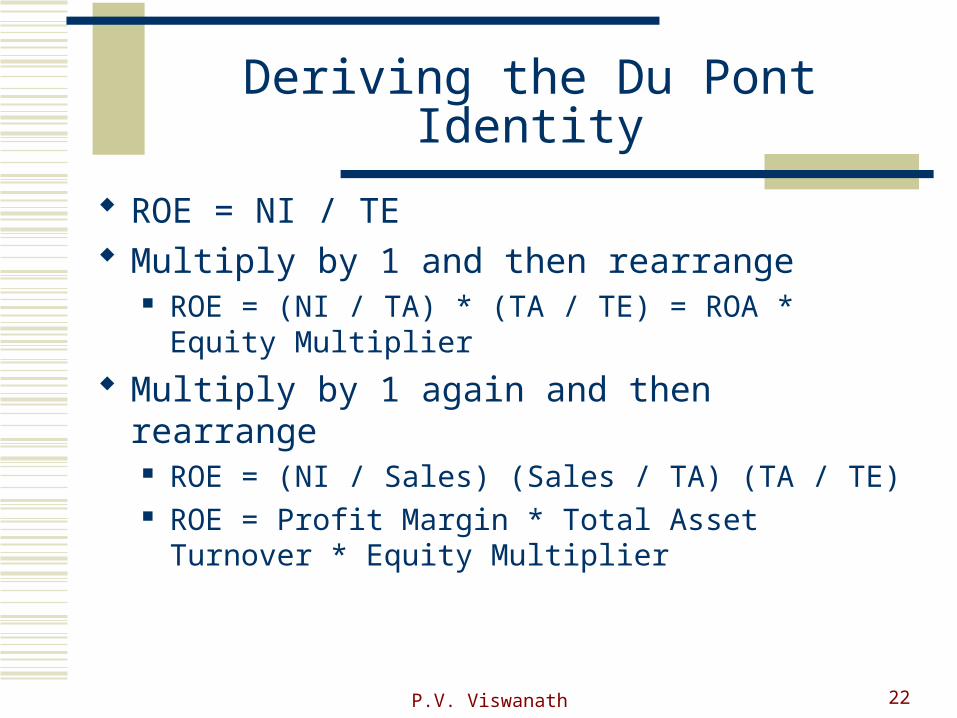
Deriving the Du Pont Identity
ROE = NI / TE Multiply by 1 and then rearrange
ROE = (NI / TA) * (TA / TE) = ROA * Equity Multiplier
Multiply by 1 again and then rearrange ROE = (NI / Sales) (Sales / TA) (TA / TE) ROE = Profit Margin * Total Asset Turnover * Equity
Multiplier
P.V. Viswanath 23
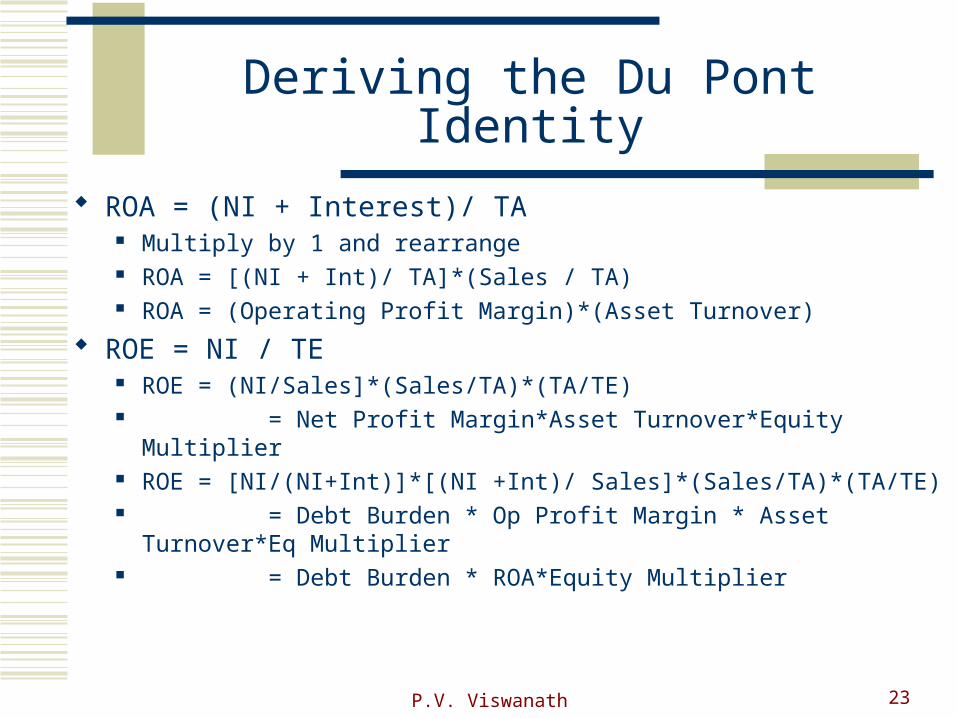
Deriving the Du Pont Identity
ROA = (NI + Interest)/ TA Multiply by 1 and rearrange ROA = [(NI + Int)/ TA]*(Sales / TA) ROA = (Operating Profit Margin)*(Asset Turnover)
ROE = NI / TE ROE = (NI/Sales]*(Sales/TA)*(TA/TE) = Net Profit Margin*Asset Turnover*Equity Multiplier ROE = [NI/(NI+Int)]*[(NI +Int)/ Sales]*(Sales/TA)*(TA/TE) = Debt Burden * Op Profit Margin * Asset Turnover*Eq Multiplier = Debt Burden * ROA*Equity Multiplier
P.V. Viswanath 24
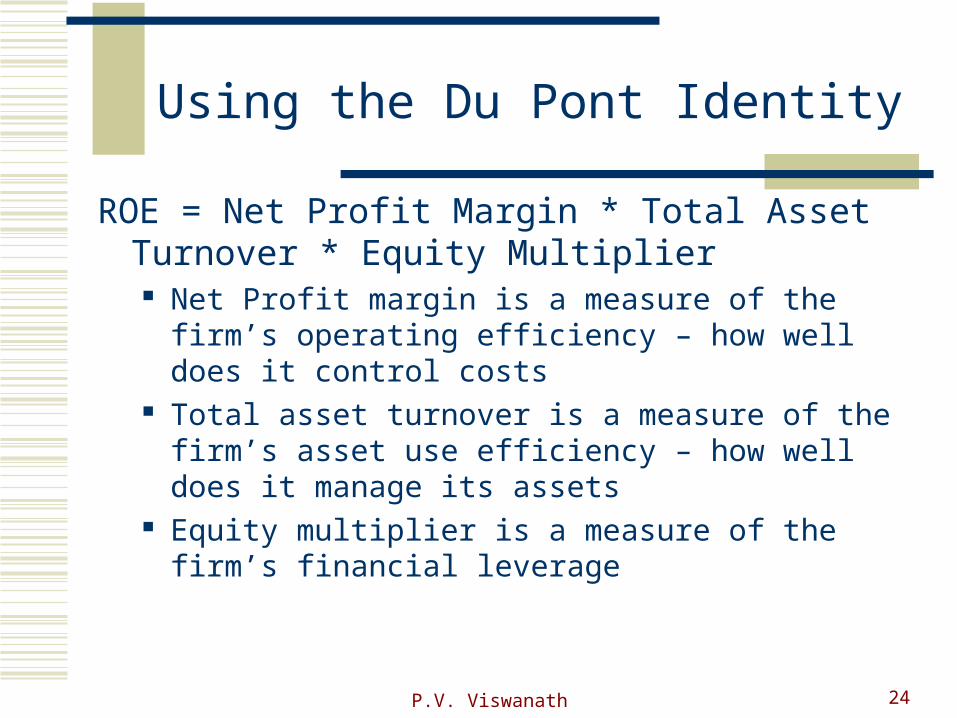
Using the Du Pont Identity
ROE = Net Profit Margin * Total Asset Turnover * Equity Multiplier Net Profit margin is a measure of the firm’s operating
efficiency – how well does it control costs Total asset turnover is a measure of the firm’s asset use
efficiency – how well does it manage its assets Equity multiplier is a measure of the firm’s financial
leverage
P.V. Viswanath 25
Table 3.6
P.V. Viswanath 26
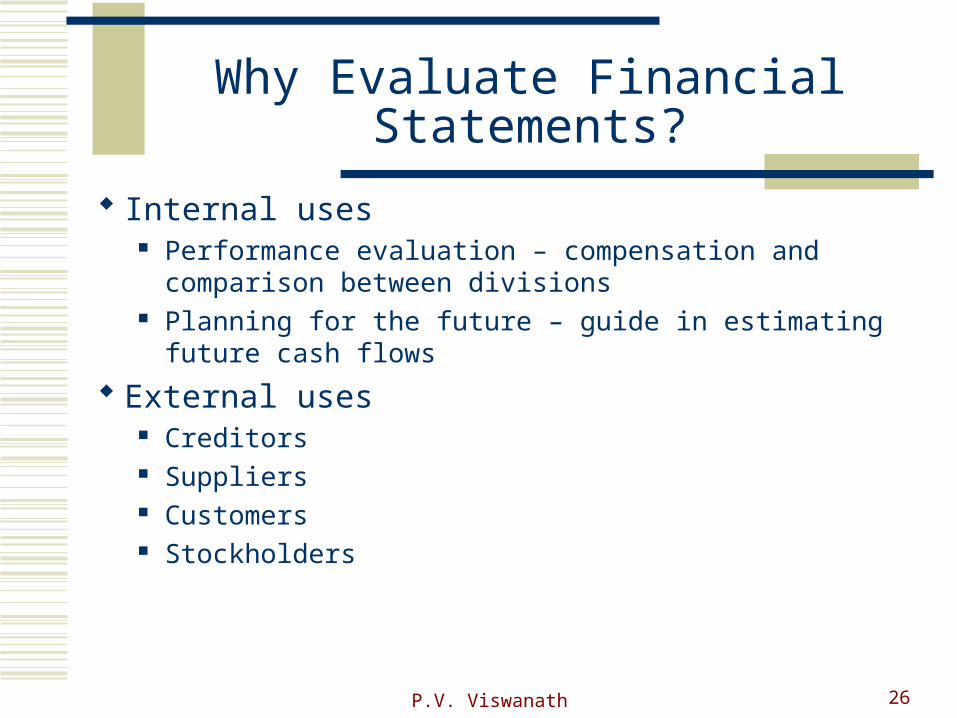
Why Evaluate Financial Statements?
Internal uses Performance evaluation – compensation and comparison between
divisions Planning for the future – guide in estimating future cash flows
External uses Creditors Suppliers Customers Stockholders
P.V. Viswanath 27
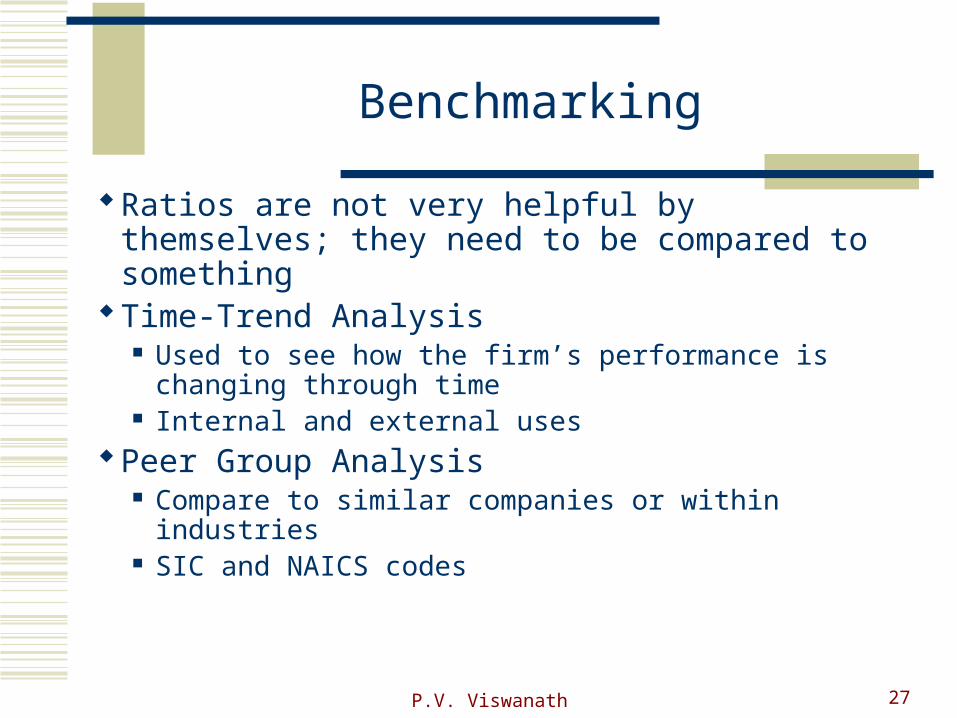
Benchmarking
Ratios are not very helpful by themselves; they need to be compared to something
Time-Trend Analysis Used to see how the firm’s performance is changing
through time Internal and external uses
Peer Group Analysis Compare to similar companies or within industries SIC and NAICS codes
P.V. Viswanath 28
Work the Web Example
The Internet makes ratio analysis much easier than it has been in the past
Go to Multex Investor (yahoo.multexinvestor.com) Choose a company and enter its ticker symbol
Click on Ratios and see what comparative information is available
P.V. Viswanath 29
Quick Quiz
How do you standardize balance sheets and income statements and why is standardization useful?
What are the major categories of ratios and how do you compute specific ratios within each category?
What are the major determinants of a firm’s growth potential?
What are some of the problems associated with financial statement analysis?