Embed Size (px)
Citation preview
Algebra 1 Unit Plan Unit 1: Quantitative Relationships, Graphs, and Functions September 9th – October 3rd
ORANGE PUBLIC SCHOOLS 2014 - 2015
OFFICE OF CURRICULUM AND INSTRUCTION
OFFICE OF MATHEMATICS

Algebra 1 Unit 1 September 9th – October 3rd
1
Contents Unit Overview ........................................................................................................................................................................ 2
Calendar ................................................................................................................................................................................. 4
Assessment Framework ......................................................................................................................................................... 5
Scope and Sequence .............................................................................................................................................................. 6
Ideal Math Block .................................................................................................................................................................. 37
Sample Lesson Plan .............................................................................................................................................................. 38
Supplemental Material ........................................................................................................................................................ 40
Multiple Representations .................................................................................................................................................... 41
Unit Authentic Assessment .................................................................................................................................................. 43
PARCC Sample Assessment Items ........................................................................................................................................ 44
Unit Assessment Question Bank .......................................................................................................................................... 46
Additional Resources ........................................................................................................................................................... 47
Appendix A – Acronyms ....................................................................................................................................................... 48

Algebra 1 Unit 1 September 9th – October 3rd
2
Unit Overview Unit 1: Quantitative Relationships, Graphs, and Functions
Essential Questions Ø In what ways can we manipulate an algebraic equation to find the value of an unknown quantity? Ø How do variables help you model real-‐world situations and solve equations? Ø How can you determine if something is a mathematical function? Ø How can we use mathematical models to describe physical relationships? Ø How can we use different tools and representations to solve problems? Ø How can the same linear relationship be represented in multiple ways?
Enduring Understandings Ø By applying mathematical properties, a linear equation can be manipulated to produce many
different but equivalent forms. These manipulations can lead to solution for the unknown value. Ø Units can be used to describe and explain steps and solutions of problems that model a real world
scenario. Ø Functions can be categorized into function families, each with their own algebraic and graphical
characteristics. Ø There are often two quantities that change in problem situations. One of these quantities depends
on the other, making it the dependent quantity and the other the independent quantity Ø A mathematical function is a relation between a set of inputs (values of the domain) and outputs
(values of the range) in which one element of the domain is assigned to exactly one element of the range.
Ø A linear relationship is one where the dependent quantity is changing at a constant rate per unit of the independent quantity.
Ø A Linear function can be represented in multiple ways and can be used to model and solve problems in a real world context.
Common Core State Standards 1) A.REI.1: Explain each step in solving a simple equation as following from the equality of numbers
asserted at the previous step, starting from the assumption that the original equation has a solution. Construct a viable argument to justify a solution method.
2) A.REI.3: Solve linear equations and inequalities in one variable, including equations with coefficients represented by letters.
3) F.IF.1: Understand that a function from one set (called the domain) to another set (called the range) assigns to each element of the domain exactly one element of the range. If f is a function and x is an element of its domain, then f(x) denotes the output of f corresponding to the input x. The graph of f is the graph of the equation y = f(x).
4) N.Q.1: Use units as a way to understand problems and to guide the solution of multi-‐step problems; choose and interpret units consistently in formulas; choose and interpret the scale and the origin in graphs and data displays.
5) N.Q.2: Define appropriate quantities for the purpose of descriptive modeling. 6) N.Q.3: Choose a level of accuracy appropriate to limitations on measurement when reporting
quantities. 7) A.REI.10: Understand that the graph of an equation in two variables is the set of all its solutions
plotted in the coordinate plane, often forming a curve (which could be a line). 8) A.CED.1: Create equations and inequalities in one variable and use them to solve problems. Include
equations arising from linear and quadratic functions, and simple rational and exponential functions.
9) A.CED.2: Create equations in two or more variables to represent relationships between quantities; graph equations on coordinate axes with labels and scales.
10) F.IF.2: Use function notation, evaluate functions for inputs in their domains, and interpret
Algebra 1 Unit 1 September 9th – October 3rd
3
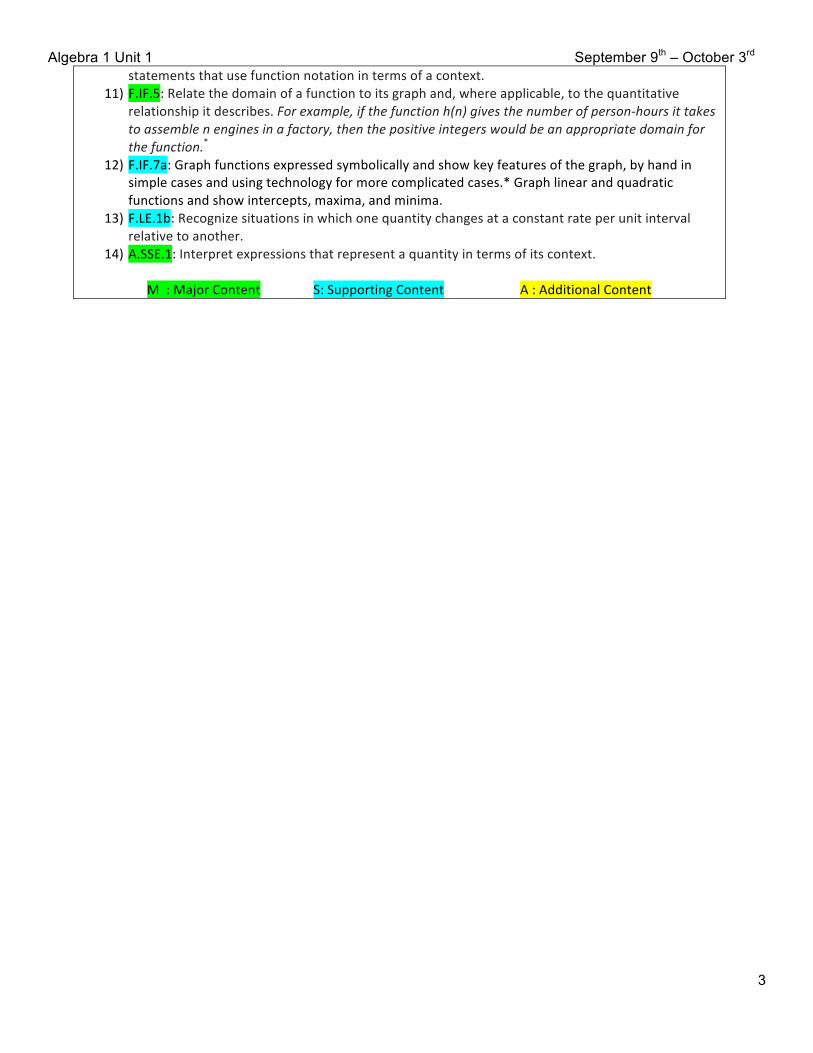
statements that use function notation in terms of a context. 11) F.IF.5: Relate the domain of a function to its graph and, where applicable, to the quantitative
relationship it describes. For example, if the function h(n) gives the number of person-‐hours it takes to assemble n engines in a factory, then the positive integers would be an appropriate domain for the function.*
12) F.IF.7a: Graph functions expressed symbolically and show key features of the graph, by hand in simple cases and using technology for more complicated cases.* Graph linear and quadratic functions and show intercepts, maxima, and minima.
13) F.LE.1b: Recognize situations in which one quantity changes at a constant rate per unit interval relative to another.
14) A.SSE.1: Interpret expressions that represent a quantity in terms of its context.
M : Major Content S: Supporting Content A : Additional Content

Algebra 1 Unit 1 September 9th – October 3rd
4
Calendar
September 2014
Sun Mon Tue Wed Thu Fri Sat 1 2 3 4 5 6
7 8 9 First day of school Using models for integer operations
10 Using models for integer operations Diagnostic assessment
11 Distributive property
12 Variables and expressions
13
14 15 Input – output tables / Intro to functions
16 Mathematical functions
17 Independent vs. dependent quantities
18 Domain/range and discrete/ continuous graphs
19 Function notation and recognizing function families Checkup #1
20
21 22 Solving linear equations
23 Modeling a linear situation
24 ½ day for students Modeling a linear situation
25 Analyzing linear functions
26 Analyzing linear functions
27
28 29 Solving linear inequalities Checkup #2
30 Performance task
1 Review
2 Unit 1 Exam
3 Flex day

Algebra 1 Unit 1 September 9th – October 3rd
5
Assessment Framework Assessment CCSS Estimated Time Date Format Graded
Diagnostic/Readiness Assessment CL Chapter 1 Pretest #’s 1-‐6 CL Chapter 2 Pretest #’s 1-‐5
A.CED.1, A.CED.2, A.REI.1, A.REI.3, F.IF.1, F.IF.2, N.Q.1, N.Q.2, F.IF.7, F.LE.1b
½ Block 9/10/14 or after Lesson 2
Individual No
Assessment Checkup #1 CL Chapter 1 End of Chapter Test #’s 1, 2, 5, 8, 10
F.IF.1, F.IF.2, N.Q.1, N.Q.2, F.IF.7, F.LE.1b
½ Block 9/19/14 or after Lesson 9
Individual Yes
Assessment Checkup #2 CL Chapter 2 End of Chapter Test #’s 1-‐6
A.CED.1, A.CED.2, A.REI.1, A.REI.3, F.IF.2, N.Q.1, N.Q.2
½ Block 9/29/14 or after Lesson 13
Individual Yes
Performance Task Ivy Smith Grows Up
N.Q.1, A.CED.1, A.CED.2, F.LE.1, A.REI.3
1 Block 9/30/14 Pair or Group Yes
Unit 1 Assessment A.SSE.1a, A.CED.1, A.CED.2, A.REI.1, A.REI.3, A.REI.10, F.IF.1, F.IF.2, F.IF.5, N.Q.1, N.Q.2, N.Q.3, F.IF.7, F.LE.1b
1 Block 10/2/14 Individual Yes
Assessment check points (exit tickets)
Varies by lesson 5-‐10 minutes Everyday Individual Varies

Algebra 1 Unit 1 September 9th – October 3rd
6
Scope and Sequence Overview
Lesson Topic Suggesting Pacing and Dates 1 Using models for integer operations (addition/subtraction) 1 day: 9/9/2014 2 Using models for integer operations (multiplication/division) 1 day: 9/10/2014 3 Variables and expressions 1 day: 9/11/2014 4 Distributive property 1 day: 9/12/2014 5 Input – output tables / Intro to functions 1 day: 9/15/2014 6 Mathematical functions 1 day: 9/16/2014 7 Independent vs. dependent quantities 1 day: 9/17/2014 8 Domain/range and discrete/continuous graphs 1 day: 9/18/2014 9 Function notation and recognizing function families 1 day: 9/19/2014 10 Solving linear equations (justifying with mathematical reason) 1 day: 9/22/2014 11 Modeling a linear situation 2 days: 9/23/2014 – 9/24/2014 12 Analyzing linear functions 2 days: 9/25/2014 – 9/26/2014 13 Solving linear inequalities 1 day: 9/29/2014 14 Performance task 1 day: 9/30/2014 15 Review 1 day: 10/1/2014 Summary:
15 days on new content (13 lessons/topics) 1 task day 1 review day 1 test day 1 flex day 19 days in Unit 1
Lessons
1 2 3 4 5 6 7 8 9 10 11a 11b 12a 12b 13
CCSS
A.SSE.1a x x x A.CED.1 x x x A.CED.2 x x x x A.REI.1 x x x A.REI.3 x x x x A.REI.10 x x x F.IF.1 x x x F.IF.2 x x x x F.IF.5 x x N.Q.1 x x x x x N.Q.2 x x N.Q.3 x F.IF.7 x F.LE.1b x x

Algebra 1 Unit 1 September 9th – October 3rd
7
Lesson 1: Using models for integer operation (addition/subtraction) Objectives
• Through the use of several mathematical models, students will be able to add and subtract integers fluently by correctly answering ___ out of ____ on a timed drill activity.
Focused Mathematical Practices • MP 2: Reason abstractly and quantitatively • MP 5: Use appropriate tools strategically (use the models provided) • MP 6: Attend to precision (use correct vocabulary and require students to do the same)
Vocabulary
• Opposite, zero pairs, absolute value, natural/counting numbers, whole numbers, integers, real numbers, subtraction, additive inverses
Common Misconceptions
• Students may struggle with the “new” definition of subtraction. Use numerical examples (i.e. 4 – 1 = 4 + -‐1) that they are familiar with to explain this new way of thinking about subtraction problems. Put parentheses around the second number (i.e. 4 – (1) = 4 + (-‐1)) or use the trick “keep-‐change-‐change” for students who need additional support.
Lesson Clarifications
• If time is an issue, only focus on the Opener and Consolidation Activity
CCSS Concepts What students will know
Skills What students will be able to do
Material/ Resource
Suggested Pacing
Assessment Check Point
7.NS.1: Apply and extend previous understandings of addition and subtraction to add and subtract rational numbers; represent addition and subtraction on a horizontal or vertical number line diagram.
Review • Adding a positive value makes a value bigger, adding a negative value makes a value smaller
• The sum of a pair of opposite numbers is zero. We can call these zero pairs.
New • Subtracting a number is the same as adding its opposite
• Number lines and algebra can be used to model the addition of integers
Review • Adding and subtracting integers
New • Rewriting a subtraction expression as an equivalent addition expression
AM 1.5 1 day AR 1.1

Algebra 1 Unit 1 September 9th – October 3rd
8
Lesson 2: Using models for integer operation (multiplication/division) Objectives
• By examining patterns in tables, students will be able to construct rules for multiplying signed numbers and multiply/divide integers fluently by correctly completing ___ out of ____ parts on a “cheat sheet.”
Focused Mathematical Practices • MP 2: Reason abstractly and quantitatively • MP 5: Use appropriate tools strategically (use the model provided) • MP 8: Look for and express regularity in repeated reasoning
Vocabulary
• Product Common Misconceptions
• Students may be able to complete tables and observe patterns, yet still struggle with constructing rules for products of signed numbers. Consider providing additional supports such as asking them to create their own table with new numbers, giving them sets of 4 multiplication problems (one of each kind) where they have to use the tables to find the answer, or pairing them with varied levels.
Lesson Clarifications
• Only focus on the Opener and Consolidation Activity • May need to supplement with additional examples/tables
CCSS Concepts What students will know
Skills What students will be able to do
Material/ Resource
Suggested Pacing
Assessment Check Point
7.NS.2: Apply and extend previous understandings of multiplication and division and of fractions to multiply and divide rational numbers.
Review • Knowing the resulting sign of any product
New • Using patterns in tables to explain the product of signed integers
• Constructing rules for multiplying signed numbers
Review • Multiplying integers New •
AM 2.4
1 day AR 2.1

Algebra 1 Unit 1 September 9th – October 3rd
9
Lesson 3: Variables and expressions Objectives
• Given pictorial and abstract representations of variable expressions, students will create, simplify, justify the equivalency of expressions with ___ out of ___ answered correctly on an exit ticket.
Focused Mathematical Practices • MP 2: Reason abstractly and quantitatively (use numerical examples to reason how combining like terms works
with variables) • MP 3: Construct viable arguments and critique the reasoning of others • MP 6: Attend to precision (use correct vocabulary and require students to do the same) • MP 7: Look for and make use of structure
Vocabulary
• Variable, combining like terms, algebraic expression, algebraic equation, term, evaluate, term Common Misconceptions
• Students will often think that 3x + 2 is equivalent to 5x. Anticipate this misconception and have students experiment with the validity of this statement by evaluating the two expressions using the same values as x, and comparing results. Also incorporate exercises where students have to critique work done by “other students” and provide reasoning as to whether or not it is correct (MP 2 and MP 3).
• Students may struggle with treating an expression such as x + 7 as a single entity. Have students use parentheses as needed. For example, if a problem asks a student to represent “take a number, add 5 to it, then multiply that by 2” as an algebraic expression, students may struggle with preserving the “n+5” as the first operation, and not see that they have to put that in parentheses before multiplying it by 2. Also, get students in the habit of evaluating expressions (when applicable) as a way to test if they think their expression is correct or not.
• Students often think that when they see an “x” by itself, that it equals 1. It does NOT EQUAL 1, because x can represent ANY VALUE; however it can be stated that x is being MULTIPLIED by 1.
Lesson Clarifications
• This lesson should only focus on expressions with variable at a time (there may be 2 variables for exercises in AM 3.3). Problems should stay relatively simple; see the AR 3.1 to determine the level of rigor that is expected.
• Suggested outline: o AM 3.1: #’s 2 and 3 in the Core Activity (slides 4-‐8). This introduces expressions and variables, and allows
students create expressions from written “directions.” o AM 3.3: #’s 1 and 2 in the Opener. This allows students to evaluate variable expressions based on given
values. This part will need to be supplemented with additional examples using actual variables and some follow up problems as a check for understanding.
o AM 3.4: #’s 1-‐6 in the Core Activity. This allows students to create expressions in a context, simplify them by collecting/combining like terms, and justify the equivalency of the expressions by testing numerical values. The majority of class time should be spent on this section.
• This lesson should also be supplemented with an exercise that asks the students to critique someone else’s and construct an argument for whether two expressions are equivalent or not (i.e. 3x + 2 and 5x, 6 + x and 7, 4(x – 1) and 4x – 1).
CCSS Concepts What students will know
Skills What students will be able to do
Material/ Resource
Suggested Pacing
Assessment Check Point
7.EE.1: Apply properties of operations as strategies to add, subtract, factor, and
Review • A variable represents an unknown value or a
Review • Create expressions based on a given real-‐world
AM 3.1 AM 3.3 AM 3.4
1 day AR 3.1

Algebra 1 Unit 1 September 9th – October 3rd
10
expand linear expressions with rational coefficients. 7.EE.4: Use variables to represent quantities in a real-‐world or mathematical problem, and construct simple equations and inequalities to solve problems by reasoning about the quantities.
value that can “var”y • An expression can be written in more than one way and still be equivalent, and sometimes in a simpler form
• 4x is equivalent to x+x+x+x and 2x+x+x+3x is equivalent 7x. Concrete examples can be used to prove this.
New • Parentheses can preserve the initial operation of an expression and can be used to make parts of an expression a single entity or quantity
• There is no mathematical property that states that something such as 4x+3 is equivalent to 7x. Concrete examples can be used to disprove this.
description • Evaluate expressions for given values
• Simplify expressions using combining like terms
New • Critique the accuracy of someone else’s work

Algebra 1 Unit 1 September 9th – October 3rd
11
Lesson 4: Distributive Property Objectives
• Through the use of concrete examples and the area model, students will be able to write equivalent expressions using the distributive property by correctly answering ___ out of ____ on an exit ticket.
Focused Mathematical Practices • MP 2: Reason abstractly and quantitatively (use numerical examples to reason how the distributive property
works with variables) • MP 5: Use appropriate tools strategically (use the model provided) • MP 7: Look for and make use of structure
Vocabulary
• Distributive property
Common Misconceptions • Students often think that 2(x – 7) is equivalent to 2x – 7. Anticipate this misconception and use it as a lesson
launch; refer back to it periodically throughout the lesson. • Students struggle with expressions involving subtraction or negative terms. Use the previous lesson and have
them rewrite all subtraction expressions as equivalent addition expressions. Also, be sure that students recognize that 2x + -‐7 is the same thing as 2x – 7.
Lesson Clarifications
CCSS Concepts What students will know
Skills What students will be able to do
Material/ Resource
Suggested Pacing
Assessment Check Point
7.EE.1: Apply properties of operations as strategies to add, subtract, factor, and expand linear expressions with rational coefficients.
Review • An expression can be written in more than one way and still be equivalent
• When a quantity is being multiplied to an expression in parentheses, that quantity must be multiplied to each term in the parentheses
New • The area model can be used to represent the distributive property
• Concrete examples can be used to explain why two expressions are equivalent, but look different
Review • Apply the distributive property to rewrite expressions given in the form a(b + c) or a(b – c) in a different but equivalent way
New • Apply the distributive property to rewrite expressions given in the form a·∙b + a·∙c or a·∙b -‐ a·∙c in a different but equivalent way
AM 3.2 1 day AR 4.1
Algebra 1 Unit 1 September 9th – October 3rd
12
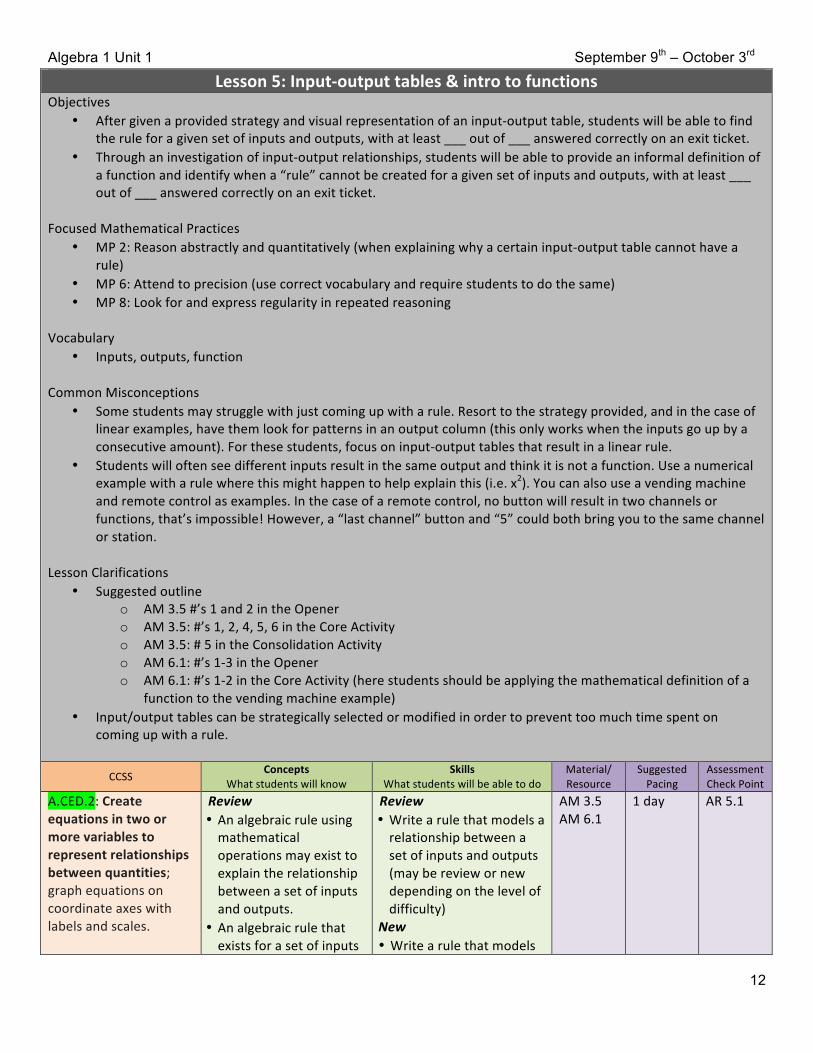
Lesson 5: Input-‐output tables & intro to functions Objectives
• After given a provided strategy and visual representation of an input-‐output table, students will be able to find the rule for a given set of inputs and outputs, with at least ___ out of ___ answered correctly on an exit ticket.
• Through an investigation of input-‐output relationships, students will be able to provide an informal definition of a function and identify when a “rule” cannot be created for a given set of inputs and outputs, with at least ___ out of ___ answered correctly on an exit ticket.
Focused Mathematical Practices • MP 2: Reason abstractly and quantitatively (when explaining why a certain input-‐output table cannot have a
rule) • MP 6: Attend to precision (use correct vocabulary and require students to do the same) • MP 8: Look for and express regularity in repeated reasoning
Vocabulary
• Inputs, outputs, function Common Misconceptions
• Some students may struggle with just coming up with a rule. Resort to the strategy provided, and in the case of linear examples, have them look for patterns in an output column (this only works when the inputs go up by a consecutive amount). For these students, focus on input-‐output tables that result in a linear rule.
• Students will often see different inputs result in the same output and think it is not a function. Use a numerical example with a rule where this might happen to help explain this (i.e. x2). You can also use a vending machine and remote control as examples. In the case of a remote control, no button will result in two channels or functions, that’s impossible! However, a “last channel” button and “5” could both bring you to the same channel or station.
Lesson Clarifications
• Suggested outline o AM 3.5 #’s 1 and 2 in the Opener o AM 3.5: #’s 1, 2, 4, 5, 6 in the Core Activity o AM 3.5: # 5 in the Consolidation Activity o AM 6.1: #’s 1-‐3 in the Opener o AM 6.1: #’s 1-‐2 in the Core Activity (here students should be applying the mathematical definition of a
function to the vending machine example) • Input/output tables can be strategically selected or modified in order to prevent too much time spent on
coming up with a rule.
CCSS Concepts What students will know
Skills What students will be able to do
Material/ Resource
Suggested Pacing
Assessment Check Point
A.CED.2: Create equations in two or more variables to represent relationships between quantities; graph equations on coordinate axes with labels and scales.
Review • An algebraic rule using mathematical operations may exist to explain the relationship between a set of inputs and outputs.
• An algebraic rule that exists for a set of inputs
Review • Write a rule that models a relationship between a set of inputs and outputs (may be review or new depending on the level of difficulty)
New • Write a rule that models
AM 3.5 AM 6.1
1 day AR 5.1

Algebra 1 Unit 1 September 9th – October 3rd
13
and outputs should work for each input-‐output pair. This rule can also be used to find additional input-‐output pairs.
New
a relationship between a set of inputs and outputs (may be review or new depending on the level of difficulty)
F.IF.1: Understand that a function from one set (called the domain) to another set (called the range) assigns to each element of the domain exactly one element of the range. If f is a function and x is an element of its domain, then f(x) denotes the output of f corresponding to the input x. The graph of f is the graph of the equation y = f(x).
Review • A set of inputs and outputs may or may not represent a mathematical function.
New • If a set of inputs and outputs represents a mathematical function, it is because each input value is assigned to exactly one output value.
Review • Determine whether something is a function or not
New • Explain why something is or is not a function

Algebra 1 Unit 1 September 9th – October 3rd
14
Lesson 6: Mathematical functions Objectives
• After discussion of a vending machine example, students will be able to explain why something is a function or not, with at least ___ out of ___ answered correctly on an exit ticket.
• Given a set of relations in multiple forms (table and graph), students will be able to describe how you can determine if something is a function specifically by looking at a table or a graph, with at least ___ out of ___ answered correctly on an exit ticket.
Focused Mathematical Practices • MP 2: Reason abstractly and quantitatively (when explaining why something is a function or not AND when
describing how to determine if something is a function from a table and graph) • MP 6: Attend to precision (use correct vocabulary and require students to do the same)
Vocabulary
• Inputs, outputs, function Common Misconceptions
• Students will often see different inputs result in the same output and think it is not a function. Use a numerical example with a rule where this might happen to help explain this (i.e. x2). You can also use a vending machine and remote control as examples. In the case of a remote control, no button will result in two channels or functions, that’s impossible! However, a “last channel” button and “5” could both bring you to the same channel or station.
• Some students may think that something is or is not a function for reasons unrelated to the definition of a function. For example, a student may think that there needs to be an obvious pattern/relationship to be a function (i.e. linear) or that it must form a straight line to be a function. Validate that their thinking is intuitively meaningful, but refer these students to the definition of a function, or provide them with an example that IS a function but does not align their reasoning.
Lesson Clarifications
• If time is an issue, only focus on the Core Activity of AM 6.1 (vending machine example). Strive to complete all of AM 6.2.
CCSS Concepts What students will know
Skills What students will be able to do
Material/ Resource
Suggested Pacing
Assessment Check Point
F.IF.1: Understand that a function from one set (called the domain) to another set (called the range) assigns to each element of the domain exactly one element of the range. If f is a function and x is an element of its domain, then f(x) denotes the output of f corresponding to the input x. The graph of f is the graph of the equation y = f(x).
Review • A set of inputs and outputs may or may not represent a mathematical function.
New • If a set of inputs and
outputs represents a mathematical function, it is because each input value (a value from the domain) is assigned to exactly one output value (a value in the range).
• By looking at a table,
Review • Determine whether something is a function or not
New • Use the mathematical language from the definition of a function to explain why something is or is not a function
• Generalize how to determine if something is a function or not based upon the information given (table or graph).
AM 6.1 AM 6.2
AR 6.1

Algebra 1 Unit 1 September 9th – October 3rd
15
you can see if something is a function by making sure each input is mapped to exactly one output.
• By looking at a graph, you can see if something is a function by making sure each x-‐value only corresponds to 1 y-‐value (a graph cannot exists in more than one location for any vertical line)

Algebra 1 Unit 1 September 9th – October 3rd
16
Lesson 7: Independent vs. dependent quantities Objectives
• Given a set of problem situation descriptions, students will be able to identify the independent and dependent quantities and units, and label them correctly on a coordinate plane with at least ____ out of ____ parts answered correctly on an exit ticket.
• Given a set of problem situation descriptions, students will be able to recognize how to represent something that is changing at a constant rate with at least ____ out of ____ parts answered correctly on an exit ticket.
Focused Mathematical Practices • MP 1: Make sense of problem and persevere in solving them • MP 4: Model with mathematics • MP 6: Attend to precision (use correct vocabulary and require students to do the same)
Vocabulary
• Independent quantity/variable, dependent quantity/variable, constant rate of change Common Misconceptions
• Some students may struggle with working through a problem situation. Provide students with structure for persevering (i.e. step #1 is to find the variable or changing quantities, step #2 is to determine which is dependent and independent).
• Some students may identify key information (i.e. “increases at a rate of 10 gallons per minute) as a variable quantity. Preemptively explain the difference between something that is constant and a quantity that is unknown/changing in a problem situation.
• For students who struggle with correctly identifying the independent/dependent quantities, try using one of these questions as a strategy.
o “Which quantity depends on the other? Does ____ depend on ____?” o “Which quantify would you input/choose in order to determine the outcome of the other?”
Lesson Clarifications
CCSS Concepts What students will know
Skills What students will be able to do
Material/ Resource
Suggested Pacing
Assessment Check Point
N.Q.1: Use units as a way to understand problems and to guide the solution of multi-‐step problems; choose and interpret units consistently in formulas; choose and interpret the scale and the origin in graphs and data displays. N.Q.2: Define appropriate quantities for the purpose of descriptive modeling.
Review • There are often two
quantities (each with their own units) that change in problem situations.
New • When one quantity depends on the other, it is said to be the dependent quantity, and is used to label the y-‐axis.
• When one quantity is used to affect the outcome of another, it
Review New • Identify variable quantities and units given a problem situation
• Identify which variable quantity is independent and which is dependent given a problem situation
• Label the x-‐axis of a coordinate plane with the independent quantity (including units) and the y-‐axis with the dependent quantity (including units)
CL ST 1.1 1 day CL SP 1.1 (#’s 2, 7, 15)

Algebra 1 Unit 1 September 9th – October 3rd
17
is said to be independent quantity, and is used to label the x-‐axis.
F.LE.1b: Recognize situations in which one quantity changes at a constant rate per unit interval relative to another.
Review • Graphs can be used to model problem situations.
• Some problem situations have quantities that change at a constant rate per unit. Graphs that model these situations are straight (linear) lines.
New •
Review • Correctly match graphs with their problem situations that model a constant rate of change (linear)
New •
CL ST 1.1

Algebra 1 Unit 1 September 9th – October 3rd
18
Lesson 8: Domain/ range and discrete/continuous graphs Objectives
• Given a set of continuous and discrete graphs and problem situations, students will be able to determine the domain of a function (with and without a context) by answering at least ___ out of ___ questions correctly on an exit ticket.
Focused Mathematical Practices • MP 3: Construct viable arguments and critique the reasoning of others (when determining the domain from a
problem situation) • MP 6: Attend to precision (use correct vocabulary and require students to do the same)
Vocabulary
• Relation, Vertical Line Test, continuous graph, discrete graph, function, domain, range Common Misconceptions
• If students struggle with understanding the concept of “domain”, try referring to it (in the beginning) as “allowable inputs”.
• For students who struggle with choosing a domain, provide contexts that are simple and ask them to think about which values would make sense. (i.e. “Does -‐5 make sense as an input when talking about the number of miles driven? Does 12.5 make sense when talking about how many t-‐shirts can be ordered?”)
Lesson Clarifications
• This lesson is significantly modified from how it was intended to be used in the Carnegie Learning Curriculum. Please refer to the Sample Lesson Plan in this Unit Plan for further information.
CCSS Concepts What students will know
Skills What students will be able to do
Material/ Resource
Suggested Pacing
Assessment Check Point
F.IF.1: Understand that a function from one set (called the domain) to another set (called the range) assigns to each element of the domain exactly one element of the range. If f is a function and x is an element of its domain, then f(x) denotes the output of f corresponding to the input x. The graph of f is the graph of the equation y = f(x).
Review • A relation is not a function if a vertical line can be placed anywhere on its graph and intersect in more than point.
New
Review • Apply the Vertical Line Test (or definition of a function) to determine whether something is a function or not
New
CL ST 1.2 AR 8.1
1 day AR 8.2
F.IF.5: Relate the domain of a function to its graph and, where applicable, to the quantitative relationship it
Review New • A function has a set of inputs which make up the domain, and a set of
Review New • Identify the domain of a function given graphically
• Describe the domain of a

Algebra 1 Unit 1 September 9th – October 3rd
19
describes. For example, if the function h(n) gives the number of person-‐hours it takes to assemble n engines in a factory, then the positive integers would be an appropriate domain for the function.*
outputs that make up the range.
• The domain can be determined from, and used to describe a function’s graph.
• There is a domain that relates to the quantitative relationship that is modeled and described by its function
function given a problem situation

Algebra 1 Unit 1 September 9th – October 3rd
20
Lesson 9: Function notation and recognizing function families Objectives
• After a mini-‐lesson introducing function notation, students will be able to write functions using the correct notation given the input and output quantities with at least ___ out of ___ parts answered correctly on an exit ticket
• Using technology and a set of functions given symbolically, students will be able to identify sketches of graphs for 4 different function families with at least ___ out of ___ parts answered correctly on an exit ticket
Focused Mathematical Practices • MP 5: Use appropriate tools strategically (use graphing calculator to “sketch” functions) • MP 6: Attend to precision (use correct vocabulary and require students to do the same) • MP 8: Look for and express regularity in repeated reasoning (when identifying/generalizing characteristics of
function families)
Vocabulary • Function notation, linear function, quadratic function, exponential function, absolute value function,
increasing/decreasing/constant function, function family, absolute minimum/maximum Common Misconceptions
• Some students make mistakes with writing the correct input variable in function notation. Preemptively address this mistake in a quick exercise asking them to find the mistake and correct it (i.e. “What is wrong with f(x) = -‐4d + 10”)
• Some students don’t understand right away that “f(x)” is the output value. Preemptively address this misconception by explaining it is like your “y” and that it is “f of x” and NOT “f times x.”
Lesson Clarifications
• Do NOT include Problem 4 on page 42 in this lesson (piecewise functions will not be taught in this unit). Also, students can explore linear absolute value functions. However, emphasize that the focus of this year will be on linear, quadratic, and exponential functions.
• You will need to provide additional problems/checks for understanding after Problem 1 on page 36 so students can practice writing a function in correct function notation.
CCSS Concepts What students will know
Skills What students will be able to do
Material/ Resource
Suggested Pacing
Assessment Check Point
F.IF.2: Use function notation, evaluate functions for inputs in their domains, and interpret statements that use function notation in terms of a context.
Review New • The function notation
f(x) indicates that “f is a function of (depends on) x”, and that x is the independent/input variable.
Review New • Write a function in correct function notation
CL ST 1.3 1 day CL SP 1.3 (#’s 2, 5, 7, 8, 25, 26, 28)
F.IF.7a: Graph functions expressed symbolically and show key features of the graph, by hand in simple cases and using technology for more complicated cases.*
Review • The family of linear
functions includes functions of the form f(x) = m x + b, where m and b are real numbers and m is not equal to 0.
Review • Sketch a linear graph (intercepts and general behavior)
New • Sketch an exponential, quadratic, and linear

Algebra 1 Unit 1 September 9th – October 3rd
21
Graph linear and quadratic functions and show intercepts, maxima, and minima.
New • The family of
exponential functions includes functions of the form f(x) = a ·∙ bx, where a and b are real numbers and b is greater than 0 but not equal to 1.
• The family of quadratic functions includes functions of the form f(x) = ax2 + bx + c, where a, b, and c are real numbers, and a is not equal to 0.
absolute value graph (intercepts, general behavior, absolute min and max)

Algebra 1 Unit 1 September 9th – October 3rd
22
Lesson 10: Solving linear equations Objectives
• After reviewing and applying mathematical properties, students will be able to solve a linear equation and provide a justification in each step and for the solution with ___ out of ___ answered correctly on an exit ticket.
Focused Mathematical Practices • MP 1: Make sense of problems and persevere in solving them (persevere through solving lengthy or complex
equations) • MP 2: Reason abstractly and quantitatively (when providing justifications for each step in solving an equation
AND when justifying a solution) • MP 3: Construct viable arguments and critique the reasoning of others (students can critique the justifications
provided by other students) • MP 6: Attend to precision (use correct vocabulary and require students to do the same)
Vocabulary
• Equation, solution to an equation in 1 variable, properties of equality, combining like terms, distributive property
Common Misconceptions
• For students who struggle with complex/multi-‐step problems, provide a step by step structure (i.e. step #1 is to simplify both sides using distributive property and combining like terms, step #2 is to use inverse operations and properties of equality to isolate the variable).
• For students who struggle with showing work, provide blank templates for them to show EACH step, provide a justification for EACH step, and check their answer.
Lesson Clarifications
• In AM 13.5, only focus on the Opener and Core Activity
CCSS Concepts What students will know
Skills What students will be able to do
Material/ Resource
Suggested Pacing
Assessment Check Point
A.REI.1: Explain each step in solving a simple equation as following from the equality of numbers asserted at the previous step, starting from the assumption that the original equation has a solution. Construct a viable argument to justify a solution method. A.REI.3: Solve linear equations and inequalities in one variable, including equations with coefficients represented by letters.
Review • Inverse operations can be used to isolate a variable in a linear equation. The distributive property, combining like terms, and other mathematical properties can be used to manipulate equations to make them easier to solve.
New • Each step to solving a linear equation can be justified with a mathematical property or reason.
Review • Find and justify the solution to a linear equation in 1 variable
• Show each step in the process of solving a linear equation in 1 variable
New • Justify each step in the process of solving a linear equation in 1 variable with a mathematical reason or property
AM 13.5 AM 13.6
1 day AR 10.1

Algebra 1 Unit 1 September 9th – October 3rd
23
Lesson 11: Modeling a linear situation (Day 1) Objectives
• After investigating a problem situation, students will be able to create a model for a linear relationship in a real world context by earning ___/___ points on an open-‐ended task
Focused Mathematical Practices • MP 1: Make sense of problems and persevere in solving them • MP 4: Model with mathematics
Vocabulary
• First differences Common Misconceptions
• Be prepared to provide additional context for problem situations that aren’t as accessible to our students. • If students struggle with #6 on page 75, require them to show their work in #5 so that they can see that they are
multiplying the independent quantity by a constant 1800. • Anticipate students struggling with explaining the contextual meaning of “1800t” and how it differs from 1800
and t by itself. Use numerical examples to help explain this. Lesson Clarifications
• This day includes pages 74-‐79. If time permits, you can also include pages 80-‐81. • #13 on page 77 is optional. • #4 on page 79 can be modified to provide students additional supports for identifying the slope and x & y-‐
intercepts. This part of the lesson is not about identifying the slope and intercepts, it is focused on interpreting what they mean in a context. Therefore, more time should be spent on explaining what these key features mean as opposed to identifying them.
CCSS Concepts What students will know
Skills What students will be able to do
Material/ Resource
Suggested Pacing
Assessment Check Point
A.CED.2: Create equations in two or more variables to represent relationships between quantities; graph equations on coordinate axes with labels and scales.
Review • Multiple
representations such as tables, graphs, and equations (functions) are used to model linear situations.
New •
Review New • Create equation/function that models a given problem situation
• Graph a linear equation/function on a coordinate plane and provide axis labels and units
CL ST 2.1
1 day CL SA 2.1 (#’s 1 and 2)
N.Q.1: Use units as a way to understand problems and to guide the solution of multi-‐step problems; choose and interpret units consistently in formulas; choose and interpret the scale and the origin in graphs and data
Review • There are often two
quantities (each with their own units) that change in problem situations.
• When one quantity depends on the other, it is said to be the dependent quantity,
Review • Identify the independent and dependent quantities given a problem situation
• Use units when reporting answers to problems in a context
New

Algebra 1 Unit 1 September 9th – October 3rd
24
displays. N.Q.2: Define appropriate quantities for the purpose of descriptive modeling.
and is used to label the y-‐axis.
• When one quantity is used to affect the outcome of another, it is said to be independent quantity, and is used to label the x-‐axis.
New
F.LE.1b: Recognize situations in which one quantity changes at a constant rate per unit interval relative to another.
Review • Situations that represent a constant rate of change are linear. The graphs that model these situations are straight lines.
New • Functions are linear if the dependent quantity is changing at a constant rate per unit interval relative to the independent quantity.
Review • Recognize a problem situation that can be modeled by linear function
New • Use the rate of change to explain why something is a linear function
A.SSE.1: Interpret expressions that represent a quantity in terms of its context.
Review New • For a function that models a problem situation, the variables, coefficients, expressions, and constants within that function all represent something specific relating to the problem situation.
Review New • Explain what each part of a linear function represents in terms of the problem situation it is modeling

Algebra 1 Unit 1 September 9th – October 3rd
25
Lesson 11: Modeling a linear situation (Day 2) Objectives
• After investigating a problem situation, students will be able to create a model for a linear relationship in a real world context by earning ___/___ points on an open-‐ended task
Focused Mathematical Practices • MP 1: Make sense of problems and persevere in solving them • MP 4: Model with mathematics
Vocabulary
• Solution to a linear equation, intersection point Common Misconceptions Lesson Clarifications
• This day includes pages 80-‐85. • You will need to add an opportunity/question in this lesson to discuss the domain of the problem situation. This
could occur after #6 on page 80. Also add in a similar question on the Assessment Check Point. • If time is an issue, skip #1-‐3 on page 84.
CCSS Concepts What students will know
Skills What students will be able to do
Material/ Resource
Suggested Pacing
Assessment Check Point
F.IF.2: Use function notation, evaluate functions for inputs in their domains, and interpret statements that use function notation in terms of a context. A.CED.1: Create equations and inequalities in one variable and use them to solve problems. Include equations arising from linear and quadratic functions, and simple rational and exponential functions.
Review • The function notation
f(x) indicates that “f is a function of (depends on) x”, and that x is the independent/input variable.
New • For a function that
models a problem situation, equations can be created to solve unknown input or output values. Solutions can be written in function notation and interpreted in the context of the problem.
Review • Given a description, create an equation in one variable that can be used to solve a problem in a context
New • Use function notation evaluate functions
• Interpret statements that use function notation in terms of a context
CL ST 2.1
1 day CL SA 2.1 (#’s 3 and 4)
F.IF.5: Relate the domain of a function to its graph and, where applicable, to the quantitative relationship it describes. For example, if the function h(n) gives the number of person-‐
Review • There is a domain that
relates to the quantitative relationship that is modeled and described by its function
New
Review • Describe the domain of a function given a problem situation
New

Algebra 1 Unit 1 September 9th – October 3rd
26
hours it takes to assemble n engines in a factory, then the positive integers would be an appropriate domain for the function.* A.REI.1: Explain each step in solving a simple equation as following from the equality of numbers asserted at the previous step, starting from the assumption that the original equation has a solution. Construct a viable argument to justify a solution method. A.REI.3: Solve linear equations and inequalities in one variable, including equations with coefficients represented by letters.
Review • Inverse operations can be used to isolate a variable in a linear equation. The distributive property, combining like terms, and other mathematical properties can be used to manipulate equations to make them easier to solve.
• Each step to solving a linear equation can be justified with a mathematical property or reason.
New • Solutions to linear
functions are determined both graphically and algebraically.
• Intersection points are used to determine solutions to linear functions.
Review • Find and justify a solution to a linear equation in 1 variable
• Justify each step in the process of solving a linear equation in 1 variable with a mathematical reason or property
New
A.REI.10: Understand that the graph of an equation in two variables is the set of all its solutions plotted in the coordinate plane, often forming a curve (which could be a line).
Review New • A graph of a function represents all its solutions. Each coordinate point located on the graph will make the function true.
Review New • Use a graph to find the solution to a linear equation in 1 variable
N.Q.1: Use units as a way to understand problems and to guide the solution of multi-‐step problems; choose
Review • Appropriate units should be used when solving and reporting solutions to problems
Review • Use units when reporting answers to problems in a context
New

Algebra 1 Unit 1 September 9th – October 3rd
27
and interpret units consistently in formulas; choose and interpret the scale and the origin in graphs and data displays.
situations. This provides context and insight to the situation it describes.
New

Algebra 1 Unit 1 September 9th – October 3rd
28
Lesson 12: Analyzing a linear function (Day 1) Objectives
• After investigating a problem situation, students will be able to analyze and interpret features a linear function by earning ___/___ points on an open-‐ended task
Focused Mathematical Practices • MP 1: Make sense of problems and persevere in solving them • MP 4: Model with mathematics
Vocabulary Common Misconceptions
Lesson Clarifications
• This day includes pages 88-‐92. • If time is an issue, skip #9 on page 92.
CCSS Concepts What students will know
Skills What students will be able to do
Material/ Resource
Suggested Pacing
Assessment Check Point
A.CED.2: Create equations in two or more variables to represent relationships between quantities; graph equations on coordinate axes with labels and scales.
Review • Multiple
representations such as tables, graphs, and equations (functions) are used to model linear situations.
New •
Review • Create equation/function that models a given problem situation
• Graph a linear function equation/function on a coordinate plane and provide axis labels and units
New
CL ST 2.2
1 day CL SA 2.2
A.SSE.1: Interpret expressions that represent a quantity in terms of its context.
Review • For a function that
models a problem situation, the variables, coefficients, expressions, and constants within that function all represent something specific relating to the problem situation.
New •
Review • Explain what each part of a linear function represents in terms of the problem situation it is modeling
New
F.IF.2: Use function notation, evaluate functions for inputs in their domains, and interpret statements that use function
Review • The function notation
f(x) indicates that “f is a function of (depends on) x”, and that x is the independent/input
Review • Given a description, create an equation in one variable that can be used to solve a problem in a context

Algebra 1 Unit 1 September 9th – October 3rd
29
notation in terms of a context. A.CED.1: Create equations and inequalities in one variable and use them to solve problems. Include equations arising from linear and quadratic functions, and simple rational and exponential functions.
variable. • For a function that
models a problem situation, equations can be created to solve unknown input or output values. Solutions can be written in function notation and interpreted in the context of the problem.
New
• Use function notation evaluate functions
• Interpret statements that use function notation in terms of a context
New
A.REI.10: Understand that the graph of an equation in two variables is the set of all its solutions plotted in the coordinate plane, often forming a curve (which could be a line).
Review • A graph of a function
represents all its solutions. Each coordinate point located on the graph will make the function true.
New
Review • Use a graph to find the solution to a linear equation in 1 variable
New
N.Q.1: Use units as a way to understand problems and to guide the solution of multi-‐step problems; choose and interpret units consistently in formulas; choose and interpret the scale and the origin in graphs and data displays.
Review • Appropriate units should be used when solving and reporting solutions to problems situations. This provides context and insight to the situation it describes.
New
Review • Use units when reporting answers to problems in a context
New

Algebra 1 Unit 1 September 9th – October 3rd
30
Lesson 12: Analyzing a linear function (Day 2) Objectives
• After investigating a problem situation, students will be able to analyze and interpret features a linear function by earning ___/___ points on an open-‐ended task
Focused Mathematical Practices • MP 1: Make sense of problems and persevere in solving them • MP 4: Model with mathematics • MP 5: Use appropriate tools strategically (using graphing calculator to solve equations)
Vocabulary Common Misconceptions
• Be prepared to provide additional context to students who find this problem situation difficult to understand. Lesson Clarifications
• This day includes pages 93-‐100. • If time is an issue, skip #4 on page 100 • #2-‐3 on page 93 can be modified to provide students additional supports for identifying the slope and x & y-‐
intercepts. This part of the lesson is not about identifying the slope and intercepts, it is focused on interpreting what they mean in a context. Therefore, more time should be spent on explaining what these key features mean as opposed to identifying them.
CCSS Concepts What students will know
Skills What students will be able to do
Material/ Resource
Suggested Pacing
Assessment Check Point
A.CED.2: Create equations in two or more variables to represent relationships between quantities; graph equations on coordinate axes with labels and scales.
Review • Multiple
representations such as tables, graphs, and equations (functions) are used to model linear situations.
New •
Review • Create equation/function that models a given problem situation
• Graph a linear function equation/function on a coordinate plane and provide axis labels and units
New
CL ST 2.2
1 day CL SP 2.2 (#’s 14, 16, 20)
A.SSE.1: Interpret expressions that represent a quantity in terms of its context.
Review • For a linear function
that models a problem situation, the slope and intercepts within that function all represent something specific relating to the problem situation.
New •
Review • Explain what each part of a linear function represents in terms of the problem situation it is modeling
New
N.Q.3: Choose a level of accuracy appropriate to limitations on
Review New
Review New

Algebra 1 Unit 1 September 9th – October 3rd
31
measurement when reporting
• When solving problems that model a problem situation, there is an appropriate level of accuracy with which the final answer should be reported.
• Determine the level of accuracy an answered should be reported with
• Explain why an answer to a problem should have a certain level of accuracy
F.IF.2: Use function notation, evaluate functions for inputs in their domains, and interpret statements that use function notation in terms of a context. A.CED.1: Create equations and inequalities in one variable and use them to solve problems. Include equations arising from linear and quadratic functions, and simple rational and exponential functions.
Review • The function notation
f(x) indicates that “f is a function of (depends on) x”, and that x is the independent/input variable.
• For a function that models a problem situation, equations can be created to solve unknown input or output values. Solutions can be written in function notation and interpreted in the context of the problem.
New
Review • Given a description, create an equation in one variable that can be used to solve a problem in a context
• Use function notation evaluate functions
• Interpret statements that use function notation in terms of a context
New
A.REI.3: Solve linear equations and inequalities in one variable, including equations with coefficients represented by letters.
Review • Solutions to linear
functions are determined both graphically and algebraically.
• Intersection points are used to determine solutions to linear functions.
New • The graphing calculator
functions such as table, table set, value, and intersection are used to solve for unknowns.
Review • Use a graph to find the solution to a linear equation in 1 variable
New • Use graphing calculator functions to determine the solution to an equation
A.REI.10: Understand that the graph of an equation in two variables is the set of all its solutions plotted in the coordinate plane, often forming a curve (which could be a line).
Review • A graph of a function
represents all its solutions. Each coordinate point located on the graph will make the function true.
Review • Use a graph to find the solution to a linear equation in 1 variable
New

Algebra 1 Unit 1 September 9th – October 3rd
32
New
N.Q.1: Use units as a way to understand problems and to guide the solution of multi-‐step problems; choose and interpret units consistently in formulas; choose and interpret the scale and the origin in graphs and data displays.
Review • Appropriate units should be used when solving and reporting solutions to problems situations. This provides context and insight to the situation it describes.
New
Review • Use units when reporting answers to problems in a context
New

Algebra 1 Unit 1 September 9th – October 3rd
33
Lesson 13: Solving linear inequalities Objectives
• By applying the concept of solving equations, students will be able to create and solve a linear inequality in one variable with at least ___ out of ___ answered correctly on an exit ticket.
Focused Mathematical Practices • MP 4: Model with mathematics (when creating linear inequalities in 1 variable to model a problem situation) • MP 7: Look for and make use of structure (when making connections between linear equations and linear
inequalities)
Vocabulary • Inequality, solution to an inequality
Common Misconceptions
Lesson Clarifications
• The main purpose of this lesson is to create linear inequalities (in 1 variable) in a context and use them to solve problems. The Student Text provides a lot of opportunities to review concepts and skills taught in previous lessons, allowing students to reinforce their understanding and make connections between different topics in Algebra. However, this lesson may be modified in order contain more practice on solving linear inequalities and fewer “analyze” problems.
• Students will not be assessed on graphing inequalities (in 1 variable) on a number line.
CCSS Concepts What students will know
Skills What students will be able to do
Material/ Resource
Suggested Pacing
Assessment Check Point
A.REI.3: Solve linear equations and inequalities in one variable, including equations with coefficients represented by letters.
Review • Properties of solving
linear equations in 1 variable can be applied to solve linear inequalities in 1 variable.
• The solution to a linear inequality is often a range of values. Solutions to linear inequalities are best represented graphically.
New • Solutions to linear
inequalities are determined both graphically and algebraically.
Review • Solve a linear inequality (in 1 variable)
New
CL ST 2.4 1 day CL SP 2.3 (#’s 14, 16)
A.CED.1: Create equations and inequalities in one variable and use them to solve problems.
Review New • For a function that
models a problem
Review • Create linear inequalities (in 1 variable) that can be used to solve a problem in a context

Algebra 1 Unit 1 September 9th – October 3rd
34
Include equations arising from linear and quadratic functions, and simple rational and exponential functions.
situation, inequalities can be created to solve unknown input or output values. Solutions can be written in function notation and interpreted in the context of the problem.
New

Algebra 1 Unit 1 September 9th – October 3rd
35
Performance Task Objectives
• By applying concepts of linear functions, students will model a problem situation by achieving at least ___ out of ___ points on a rubric scored performance task.
Focused Mathematical Practices • MP 1: Make sense of problems and persevere in solving them • MP 2: Reason abstractly and quantitatively • MP 4: Model with mathematics • MP 5: Use appropriate tools strategically • MP 6: Attend to precision
Vocabulary
• Unit conversion Common Misconceptions
Lesson Clarifications • Task may be done in pairs. • Provide a mini lesson or Do Now on unit conversions. • Provide problem solving strategies for students to make sense of the problem. Provide additional context and
scaffolds (only if necessary) for students still struggling to start the problem. • Inform students that they have tools readily available to them (i.e. extra paper, graph paper, rules, graphing
calculators). Provide scaffolds for students who struggle to figure out when to use what tools. For example, it may be helpful for students to create their own table and/or graph on a separate piece of paper.
• Assist students in the last part of the task that requires students to read the percentile chart. • Task may be modified to include additional questions that cover other standards (i.e. questions using function
notation, domain, etc)
CCSS Concepts What students will know
Skills What students will be able to do
Material/ Resource
Suggested Pacing
Assessment Check Point
A.CED.2: Create equations in two or more variables to represent relationships between quantities; graph equations on coordinate axes with labels and scales. F.LE.1b: Recognize situations in which one quantity changes at a constant rate per unit interval relative to another.
Review • For a linear relationship,
there is equal change over equal intervals
• Linear models can be represented as a function and as a graph.
New • Linear models can be
created given a pair of points
Review • Create a linear model for a problem situation.
• Represent a linear model as a graph.
New
Unit 1 AA 1 day Use rubric to grade task
A.CED.1: Create equations and inequalities in one variable and use them
Review • Linear equations can be
created and solved to model a problem
Review • Create equations in one variable that model a scenario and use them to

Algebra 1 Unit 1 September 9th – October 3rd
36
to solve problems. Include equations arising from linear and quadratic functions, and simple rational and exponential functions. A.REI.3: Solve linear equations and inequalities in one variable, including equations with coefficients represented by letters.
situation. New •
solve problems. New
N.Q.1: Use units as a way to understand problems and to guide the solution of multi-‐step problems; choose and interpret units consistently in formulas; choose and interpret the scale and the origin in graphs and data displays.
Review • Units can be used to
describe and explain steps and solutions to problem in a real world context.
New •
Review • Use units in the steps and solutions of solving problems.
New • Convert units

Algebra 1 Unit 1 September 9th – October 3rd
37
Ideal Math Block The following outline is the department approved ideal math block for grades 9-‐12.
1) Do Now (7-‐10 min) a. Serves as review from last class’ or of prerequisite material b. Provides multiple entry points so that it is accessible by all students and quickly scaffolds up
2) Starter/Launch (5 min)
a. Designed to introduce the lesson b. Uses concrete or pictorial examples c. Attempts to bridge the gap between grade level deficits and rigorous, on grade level content d. Provides multiple entry points so that it is accessible by all students and quickly scaffolds up
3) Mini-‐Lesson (15-‐20 min)
a. Design varies based on content b. May include an investigative approach, direct instruction approach, whole class discussion led approach,
etc. c. Includes CFU’s d. Anticipates misconceptions and addresses common mistakes
4) Class Activity (25-‐30 min)
a. Design varies based on content b. May include partner work, group work/project, experiments, investigations, game based activities, etc.
5) Independent Practice (7-‐10 min)
a. Provides students an opportunity to work/think independently
6) Closure (5-‐10 min) a. Connects lesson/activities to big ideas b. Allows students to reflect and summarize what they have learned c. May occur after the activity or independent practice depending on the content and objective
7) DOL (5 min)
a. Exit ticket

Algebra 1 Unit 1 September 9th – October 3rd
38
Sample Lesson Plan Lesson Lesson 8: Continuous/discrete graphs and domain/range
(CL ST 1.2) Days 1
Objective Given a set of continuous and discrete graphs and problem situations, students will be able to determine the domain of a function (with and without a context) by answering at least ___ out of ___ questions correctly on an exit ticket.
CCSS F.IF.1, F.IF.5 MP 3, MP 6
Learning activities/strategies
Do Now: • Students will cut out all of the graphs on pages 19-‐25 • Students will pick out the ones that do NOT represent functions. • Students will write an explanation for how they chose these graphs. • Teacher scans room to see if students can correctly identify non-‐functions AND if their
explanation is reasonable and uses vocabulary and the definition of a function (an explanation of “because they fail the Vertical Line Test” is not acceptable)
Starter/Launch:
• In this lesson, the Do Now can also serve as the launch. It reviews material from the previous lesson but also introduces today’s lesson.
Mini lesson: • Teacher directs students to page 32 and introduces the definition of a relation, domain,
and range. • Teacher asks students do a word sorting activity (slide 4) • Teacher introduces/reinforces the Vertical Line Test (this may have been introduced in
the prior lesson). • Teacher has student volunteers explain how the Vertical Line Test can be applied to
graphs of functions AND how it relates to the definition of a function (for example, “You can use the Vertical Line Test by seeing if a vertical line will intersect the graph in more than one point. If this is the case, then that means for the same input, or x-‐value, there are multiple outputs, or y-‐values”)
• Depending on results from Do Now, teacher quickly draws 3-‐4 graphs on the SMART board and asks students to write whether or not it is a function (include discrete graphs as well).
• Teacher directs students to #1 on page 28 and students work on it independently • Teacher introduces continuous and discrete graphs. • Teacher makes connections between the domain of a function, and how it looks
graphically. • Students work in pairs to complete #3 on page 33. Teacher does individual check and
reviews answers if necessary. • Teacher explains that domain can be determined from a problem situation as well.
Teacher also explains that a domain can sometimes be more specific than just “all integers” based on the problem situation it is modeling. Sometimes, a graph may be represented as continuous data out of convenience (or vice versa) when really it should be discrete.
• Teacher directs students to #3 on page 5. Students work in pairs to determine the domain for Something’s Fishy and Music Club. Students also fix (if necessary) the graph of the situation to reflect the correct domain.
Algebra 1 Unit 1 September 9th – October 3rd
39
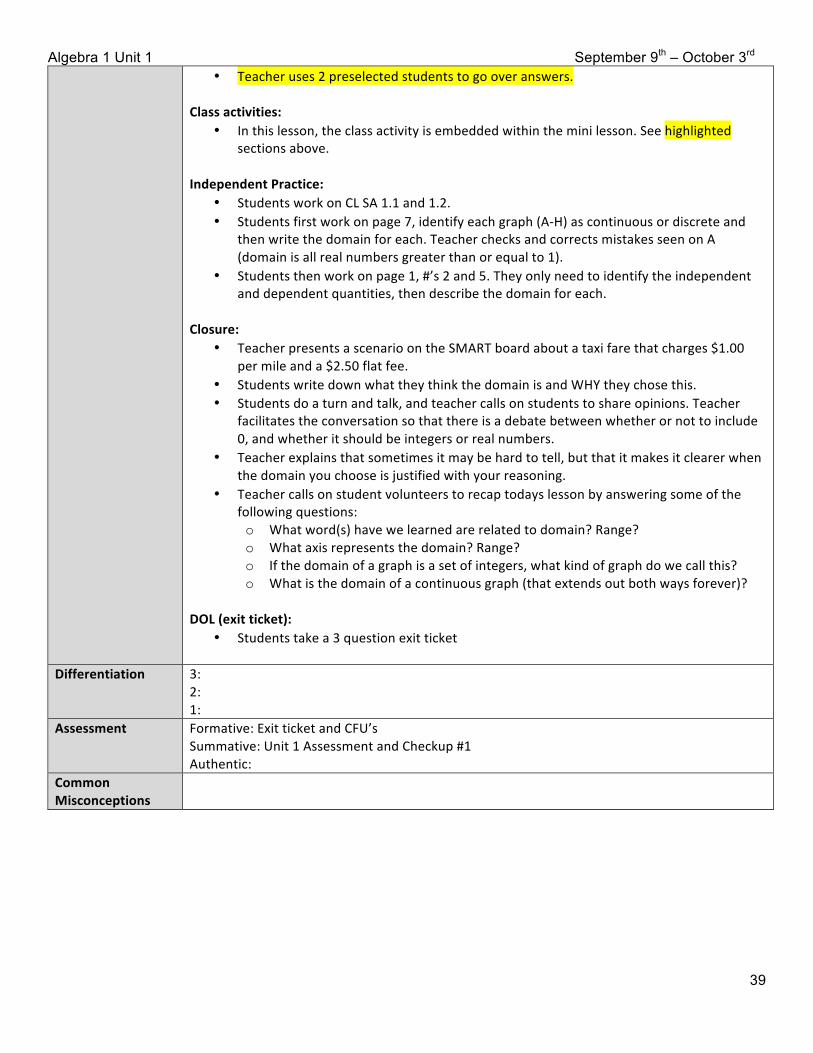
• Teacher uses 2 preselected students to go over answers. Class activities:
• In this lesson, the class activity is embedded within the mini lesson. See highlighted sections above.
Independent Practice:
• Students work on CL SA 1.1 and 1.2. • Students first work on page 7, identify each graph (A-‐H) as continuous or discrete and
then write the domain for each. Teacher checks and corrects mistakes seen on A (domain is all real numbers greater than or equal to 1).
• Students then work on page 1, #’s 2 and 5. They only need to identify the independent and dependent quantities, then describe the domain for each.
Closure:
• Teacher presents a scenario on the SMART board about a taxi fare that charges $1.00 per mile and a $2.50 flat fee.
• Students write down what they think the domain is and WHY they chose this. • Students do a turn and talk, and teacher calls on students to share opinions. Teacher
facilitates the conversation so that there is a debate between whether or not to include 0, and whether it should be integers or real numbers.
• Teacher explains that sometimes it may be hard to tell, but that it makes it clearer when the domain you choose is justified with your reasoning.
• Teacher calls on student volunteers to recap todays lesson by answering some of the following questions: o What word(s) have we learned are related to domain? Range? o What axis represents the domain? Range? o If the domain of a graph is a set of integers, what kind of graph do we call this? o What is the domain of a continuous graph (that extends out both ways forever)?
DOL (exit ticket):
• Students take a 3 question exit ticket
Differentiation 3: 2: 1:
Assessment Formative: Exit ticket and CFU’s Summative: Unit 1 Assessment and Checkup #1 Authentic:
Common Misconceptions

Algebra 1 Unit 1 September 9th – October 3rd
40
Supplemental Material Tasks
CCSS SMP Dropbox location and filename Link (original task and answer key)
A.SSE.1 MP 4 MP 7
Orange 9-‐12 Math > Algebra 1 > Unit 1 > Supplemental Material > Mixing Candies task
https://www.illustrativemathematics.org/illustrations/389
A.CED.1 N.Q.1
Orange 9-‐12 Math > Algebra 1 > Unit 1 > Supplemental Material > Planes and Wheat task
https://www.illustrativemathematics.org/illustrations/580
A.CED.1 A.CED.2 N.Q.1
MP 4 Orange 9-‐12 Math > Algebra 1 > Unit 1 > Supplemental Material > Paying the Rent task
https://www.illustrativemathematics.org/illustrations/581
A.REI.1 A.REI.3 MP 3
Orange 9-‐12 Math > Algebra 1 > Unit 1 > Supplemental Material > Reasoning with Linear Inequalities task
https://www.illustrativemathematics.org/illustrations/807
A.REI.10 F.LE.1a A.SSE.1
MP 4 MP 7
Orange 9-‐12 Math > Algebra 1 > Unit 1 > Supplemental Material > Taxi task https://www.illustrativemathematics.org/illustrations/243
F.IF.1 N.Q.1 N.Q.2
MP 2 MP 3
Orange 9-‐12 Math > Algebra 1 > Unit 1 > Supplemental Material > The Parking Lot task
https://www.illustrativemathematics.org/illustrations/588
F.IF.2 MP 2 Orange 9-‐12 Math > Algebra 1 > Unit 1 > Supplemental Material > Cell Phones task
https://www.illustrativemathematics.org/illustrations/634
F.IF.5 Orange 9-‐12 Math > Algebra 1 > Unit 1 > Supplemental Material > Oakland Coliseum task
https://www.illustrativemathematics.org/illustrations/631
Collaborative Activities CCSS SMP Dropbox location and filename Link
A.REI.1 A.REI.3
MP 2 MP 3 MP 8
Orange 9-‐12 Math > Algebra 1 > Unit 1 > Supplemental Material > Building and Solving Equations activity (starts on page 8)
http://map.mathshell.org.uk/materials/download.php?fileid=1466 (teacher’s guide) http://map.mathshell.org.uk/materials/lessons.php?taskid=554#task554 (other resources)
A.REI.1 A.REI.3
MP 3 MP 7
Orange 9-‐12 Math > Algebra 1 > Unit 1 > Supplemental Material > Sorting Equations and Identities activity (starts on page 6)
http://map.mathshell.org.uk/materials/download.php?fileid=688 (teacher’s guide) http://map.mathshell.org.uk/materials/lessons.php?taskid=218#task218 (other resources)
F.IF.7 F.IF.5 F.LE.1
MP 1 MP 2 MP 4
Orange 9-‐12 Math > Algebra 1 > Unit 1 > Supplemental Material > Matching Situations and Graphs activity (starts on page 6)
http://map.mathshell.org.uk/materials/download.php?fileid=1259 (teacher’s guide) http://map.mathshell.org.uk/materials/lessons.php?taskid=430#task430 (other resources)

Algebra 1 Unit 1 September 9th – October 3rd
41
Multiple Representations Functions
Concrete
!
"#$%&!!'!()*%+,)-.#(/!*)-#+!0!
Pictorial/verbal description
Table Graph Mapping Diagram
Verbal 2 times a number minus 3
Abstract
Function(Graph ) Set Notation (table & Mapping Diagram) (x) = 2x + 3 Domain Domain: Range: Range:
Slope/Linear change
Concrete
Pictorial/verbal description
Table Graph
!" #"$%" $&"'" $("%" (")" &"*" +"
"
,%"
,%",%"
,%"
,%",%"
,%",%"
Abstract
Slope between (2, 1) and (4, 3) = = = = 1
August 02, 2014
Input Output
0 -3
2 1
4 5
10 17
15 27
August 02, 2014
2 4 6 8-2-4-6
2
4
6
-2
-4
-6
August 02, 2014
Input Output
0
2
4
1015
-13
1517
27

Algebra 1 Unit 1 September 9th – October 3rd
42
Linear Models
Concrete
Pictorial/verbal description
Table Graph
Verbal Medium cheese pizzas cost $7.00. What is the relationship between the number of pizzas you order and the total cost of your order?
Abstract f(x) = 7x where x represents the number of pizzas and f(x) represents the total cost (in dollars)
Algebra 1 Unit 1 September 9th – October 3rd
43
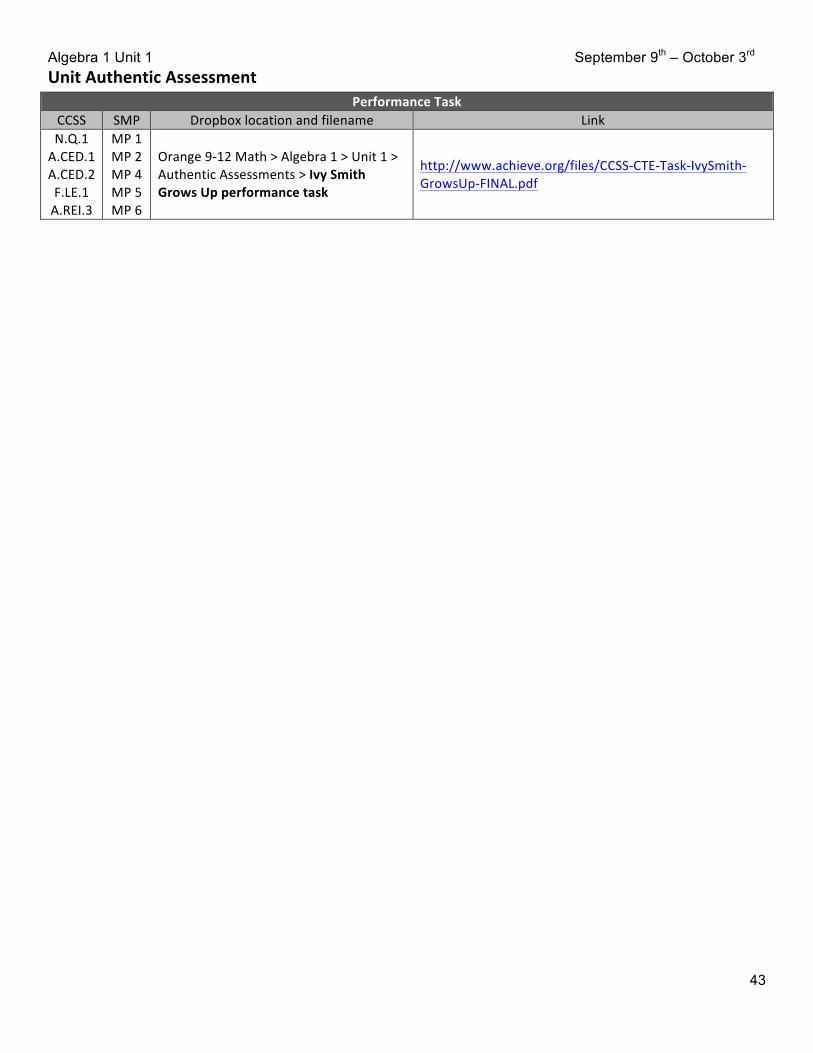
Unit Authentic Assessment Performance Task
CCSS SMP Dropbox location and filename Link N.Q.1 A.CED.1 A.CED.2 F.LE.1 A.REI.3
MP 1 MP 2 MP 4 MP 5 MP 6
Orange 9-‐12 Math > Algebra 1 > Unit 1 > Authentic Assessments > Ivy Smith Grows Up performance task
http://www.achieve.org/files/CCSS-‐CTE-‐Task-‐IvySmith-‐GrowsUp-‐FINAL.pdf

Algebra 1 Unit 1 September 9th – October 3rd
44
PARCC Sample Assessment Items Myla’s Swimming Pool – Task Type 1
CCSS SMP Dropbox location and filename Evidence statement (from Algebra 1 EOY) F.LE
A.CED.1 A.SSE.3 F.IF.B F.IF.7
MP 2 MP 4 MP 8
Orange 9-‐12 Math > Algebra 1 > Unit 1 > PARCC Sample Assessment Items > Myla’s Swimming Pool PARCC task type 1
HS-‐Int.3-‐2: Solve multi-‐step contextual word problems with degree of difficulty appropriate to the course, requiring application of course-‐level knowledge and skills articulated in F-‐LE, A-‐CED.1, A-‐SSE.3, F-‐IF.B, F-‐IF.7, limited to linear and quadratic functions.
Algebra 1 Unit 1 September 9th – October 3rd
45
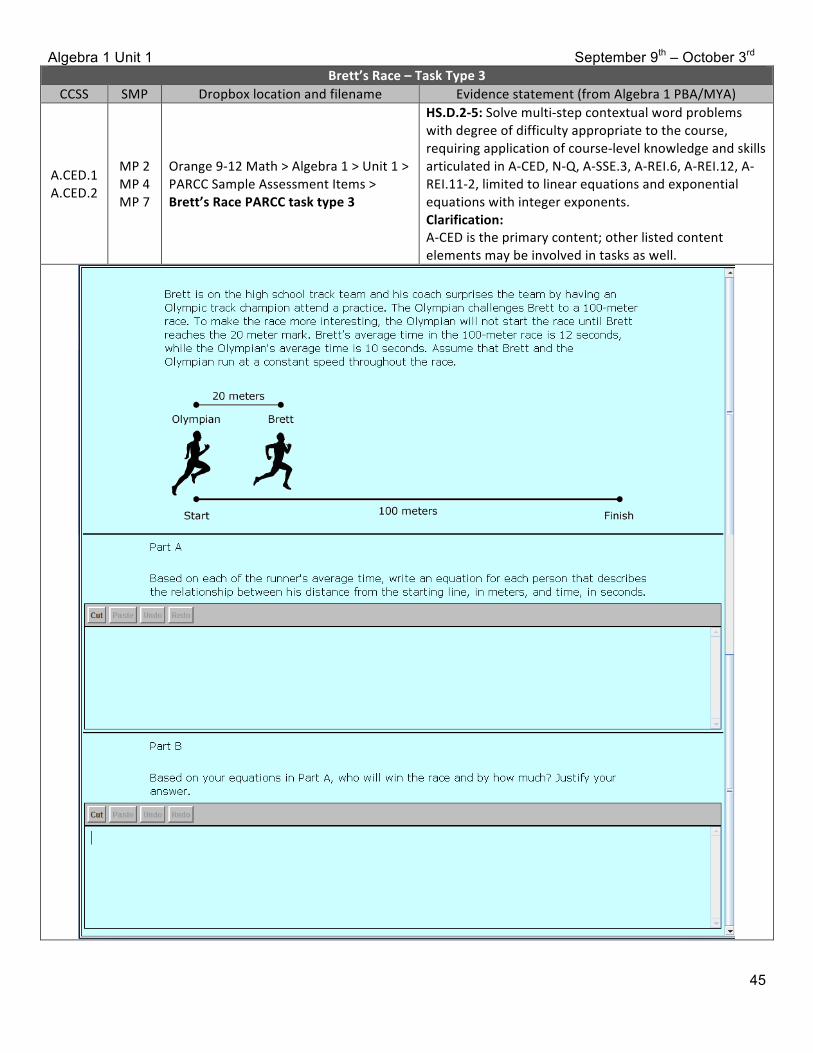
Brett’s Race – Task Type 3 CCSS SMP Dropbox location and filename Evidence statement (from Algebra 1 PBA/MYA)
A.CED.1 A.CED.2
MP 2 MP 4 MP 7
Orange 9-‐12 Math > Algebra 1 > Unit 1 > PARCC Sample Assessment Items > Brett’s Race PARCC task type 3
HS.D.2-‐5: Solve multi-‐step contextual word problems with degree of difficulty appropriate to the course, requiring application of course-‐level knowledge and skills articulated in A-‐CED, N-‐Q, A-‐SSE.3, A-‐REI.6, A-‐REI.12, A-‐REI.11-‐2, limited to linear equations and exponential equations with integer exponents. Clarification: A-‐CED is the primary content; other listed content elements may be involved in tasks as well.

Algebra 1 Unit 1 September 9th – October 3rd
46
Unit Assessment Question Bank Overview of question/task directory
# Dropbox location and filename Task Type CCSS SMP
1 Orange 9-‐12 Math > Algebra 1 > Unit 1 > Assessment Question Bank > Task 1.1
I (1 pt) F.IF.1 MP 3, 6
2 Orange 9-‐12 Math > Algebra 1 > Unit 1 > Assessment Question Bank > Task 1.2
I (1 pt) A.REI.3 MP 1
3 Orange 9-‐12 Math > Algebra 1 > Unit 1 > Assessment Question Bank > Task 1.3
I (1 pt) A.SSE.1 MP 1, 7
4 Orange 9-‐12 Math > Algebra 1 > Unit 1 > Assessment Question Bank > Task 1.4
I (1 pt) F.IF.2 MP 2
5 Orange 9-‐12 Math > Algebra 1 > Unit 1 > Assessment Question Bank > Task 1.5
I (2 pts) F.IF.7a, 5 MP 1, 5
6 Orange 9-‐12 Math > Algebra 1 > Unit 1 > Assessment Question Bank > Task 1.6
I (2 pts) F.IF.1 MP 2
7 Orange 9-‐12 Math > Algebra 1 > Unit 1 > Assessment Question Bank > Task 1.7
I (2 pts) F.IF.2, 5 MP 1
8 Orange 9-‐12 Math > Algebra 1 > Unit 1 > Assessment Question Bank > Task 1.8
I (4 pts) A.CED.1, 2, N.Q.1, 2 MP 1, 4
9 Orange 9-‐12 Math > Algebra 1 > Unit 1 > Assessment Question Bank > Task 1.9
II (3 pts) F.LE.1, A.REI.10 MP 3, 6
10 Orange 9-‐12 Math > Algebra 1 > Unit 1 > Assessment Question Bank > Task 1.10
II (4 pts) A.REI.1, 3 MP 3, 6
11 Orange 9-‐12 Math > Algebra 1 > Unit 1 > Assessment Question Bank > Task 1.11
III (3 pts) A.CED.2, F.LE.1, N.Q.3 MP 1, 2, 4
12 Orange 9-‐12 Math > Algebra 1 > Unit 1 > Assessment Question Bank > Task 1.12
III (6 pts) A.CED.1, 2, N.Q.1, 2 MP 1, 2, 4
Overview of task types
Task type Description of task type Scoring I. Tasks assessing concepts,
skills and procedures • Balance of conceptual understanding, fluency, and application • Can involve any or all mathematical practice standards • Machine scorable including innovative, computer-‐based formats • Will appear on the PARCC End of Year and Performance Based
Assessment components • Performance Level Descriptors (PLD) under Sub-‐claim A, B and E
4 points, 2 points, or 1 point
II. Tasks assessing expressing mathematical reasoning
• Each task calls for written arguments / justifications, critique of reasoning, or precision in mathematical statements (MP.3, 6).
• Can involve other mathematical practice standards • May include a mix of machine scored and hand scored responses • Included on the PARCC Performance Based Assessment component • Performance Level Descriptors (PLD) under Sub-‐claim C
4 points or 3 points
III. Tasks assessing modeling /applications
• Each task calls for modeling/application in a real-‐world context or scenario (MP.4)
• Can involve other mathematical practice standards • May include a mix of machine scored and hand scored responses • Included on the PARCC Performance Based Assessment component • Performance Level Descriptors (PLD) under Sub-‐claim D
6 points or 3 points

Algebra 1 Unit 1 September 9th – October 3rd
47
Additional Resources Lesson # Dropbox location and filename Description
1 Orange 9-‐12 Math > Algebra 1 > Unit 1 > Additional Resources > AR 1.1
Timed drill worksheet on adding & subtracting integers w/ answer key
2 Orange 9-‐12 Math > Algebra 1 > Unit 1 > Additional Resources > AR 2.1
“Cheat sheet” template on multiplying signed integers that students can use as a future reference page
3 Orange 9-‐12 Math > Algebra 1 > Unit 1 > Additional Resources > AR 3.1 Exit ticket on expressions and combining like terms
4 Orange 9-‐12 Math > Algebra 1 > Unit 1 > Additional Resources > AR 4.1 Exit ticket on the distributive property
5 Orange 9-‐12 Math > Algebra 1 > Unit 1 > Additional Resources > AR 5.1 Exit ticket on input-‐output tables and intro to functions
6 Orange 9-‐12 Math > Algebra 1 > Unit 1 > Additional Resources > AR 6.1 Exit ticket on mathematical functions
8 Orange 9-‐12 Math > Algebra 1 > Unit 1 > Additional Resources > AR 8.1 SMART board slides to assist in the modified lesson
8 Orange 9-‐12 Math > Algebra 1 > Unit 1 > Additional Resources > AR 8.2 Exit ticket on domain and range
10 Orange 9-‐12 Math > Algebra 1 > Unit 1 > Additional Resources > AR 10.1
Exit ticket on solving equations and justifying each step in the process

Algebra 1 Unit 1 September 9th – October 3rd
48
Appendix A – Acronyms # Acronym Meaning 1 AA Authentic Assessment 2 AM Agile Minds 3 AR Additional Resources 4 CCSS Common Core State Standards 5 CFU Check for understanding 6 CL Carnegie Learning 7 CL SA Carnegie Learning Student Assignments 8 CL SP Carnegie Learning Skills Practice 9 CL ST Carnegie Learning Student Text 10 EOY End of Year (assessment) 11 MP Math Practice 12 MYA Mid-‐Year Assessment (same as PBA) 13 PBA Problem Based Assessment (same as MYA) 14 PLD Performance Level Descriptors 15 SMP Standards for Mathematical Practice