Embed Size (px)
Citation preview
Association for Information SystemsAIS Electronic Library (AISeL)
ECIS 2015 Completed Research Papers ECIS 2015 Proceedings
Spring 5-29-2015
selfsurvey.org: A Platform for Prediction-BasedBenchmarking and Feedback-Enabled SurveyResearchTill J. WinklerCopenhagen Business School, [email protected]
Marko SarstedtOtto-von-Guericke-University Magdeburg, [email protected]
Marian KeilHumboldt-Universität zu Berlin, [email protected]
Paul RostHumboldt-Universität zu Berlin, [email protected]
Follow this and additional works at: http://aisel.aisnet.org/ecis2015_cr
This material is brought to you by the ECIS 2015 Proceedings at AIS Electronic Library (AISeL). It has been accepted for inclusion in ECIS 2015Completed Research Papers by an authorized administrator of AIS Electronic Library (AISeL). For more information, please [email protected].
Recommended CitationWinkler, Till J.; Sarstedt, Marko; Keil, Marian; and Rost, Paul, "selfsurvey.org: A Platform for Prediction-Based Benchmarking andFeedback-Enabled Survey Research" (2015). ECIS 2015 Completed Research Papers. Paper 204.ISBN 978-3-00-050284-2http://aisel.aisnet.org/ecis2015_cr/204

Twenty-Third European Conference on Information Systems (ECIS), Münster, Germany, 2015 1
SELFSURVEY.ORG: A PLATFORM FOR PREDICTION-
BASED BENCHMARKING AND FEEDBACK-ENABLED
SURVEY RESEARCH
Complete Research
Till J. Winkler, Copenhagen Business School, Denmark, [email protected]
Marko Sarstedt, Otto-von-Guericke-University Magdeburg, Germany, and University of
Newcastle, Australia, [email protected]
Marian Keil, Humboldt-Universität zu Berlin, Germany, [email protected]
Paul Rost, Humboldt-Universität zu Berlin, Germany, [email protected]
Abstract
This design research builds on the idea to combine the strengths of traditional survey research with a
more practice-oriented benchmarking approach. We present selfsurvey.org, an online survey platform
that allows providing instant and respondent-specific feedback based on a scientifically grounded
research model and a structural equation model-based prediction technique. Based on the partial
least squares analysis results of a training dataset, selfsurvey employs a scoring algorithm to derive
respondent-specific predicted scores, compares these with the observed scores, and provides visual-
ized and text-based outputs. Our evaluation of selfsurvey in the context of a maturity benchmarking
study provides an indication for the perceived usefulness of this artifact and its underlying scoring
algorithm. We argue that this prediction-based approach, which goes far beyond the functionality of
common univariate benchmarking tools, can be used for a wide range of survey studies and help in-
crease the perceived relevance of academic survey studies to practice.
Keywords: Survey research, Structural equation models, Partial least squares, Multivariate predic-
tion, Benchmarking, Design research
1 Introduction
The debate about rigor and relevance continues to concern the Information Systems (IS) field and its
neighboring management disciplines alike (e.g., Benbasat and Zmud, 1999, Boyer, 1996, Straub and
Ang, 2011, Van De Ven and Johnson, 2006). Especially survey research is frequently charged with the
claim to produce results that are somewhat detached from practice and response rates in academic
surveys have been declining for years (Anseel et al., 2010). Survey research is different from case
research in the sense that it normally aims to test a-priori hypothesized relationships between a set of
variables (the research model) across a broad range of different settings (Benbasat et al., 1987). Practi-
tioners, however, usually desire rich prescriptions to be applied in their specific organizational settings
(Benbasat and Zmud, 1999). Given that results from survey studies are typically published on the ag-
gregate level only and rarely find their way back to the respondents, survey research can easily be
regarded as a ‘one-way’ approach that feeds observations from the real-world environment to the
knowledge base, without sufficiently closing a cycle of ‘rigor and relevance’ (Hevner et al., 2004).
At the same time, some researchers have also long highlighted the importance of more practitioner-
oriented benchmarking studies that enable firms to compare themselves with others. Even if these
studies are often “actually a by-product rather than the primary outcome of […] academic research”,

selfsurvey.org: A Prediction-Enabled Survey Platform
Twenty-Third European Conference on Information Systems (ECIS), Münster, Germany, 2015 2
they “tend to be of great interest to practice” since “there is understandably a desire to evaluate your-
self against your peers” (Benbasat and Zmud, 1999, p. 11). Common benchmarking approaches, how-
ever, typically base their feedback merely on univariate score aggregation and thus lack the scientific
foundation of the variables and their theoretical relationships in a research model (e.g., IBM, 2014,
iGrafx, 2014, NSAfR, 2014). Therefore, the question arises: how can we provide participants with
timely and relevant feedback that still leverages the a-priori knowledge encoded in a multivariate re-
search model hypothesized by the researcher?
Following a design research approach, we developed selfsurvey.org, an online survey platform that
upon completion of a questionnaire can provide instant feedback to participants based on a specified
research model and a multivariate prediction technique. Using training data and a conceptual model
specified by the researcher, selfsurvey derives respondent-specific predicted scores and compares these
with observed scores as provided by the respondents. This comparison allows respondents to assess
the extent to which their answers differ from what a research model suggests. The use case diagram in
Figure 1 illustrates the two main user groups addressed by our artifact and exemplifies how selfsurvey
intends to facilitate their knowledge exchange in an IS research cycle.
Figure 1. Use case diagram (inspired by Hevner et al. (2004))
The development of the selfsurvey platform considered the following four design requirements:
(1) relevance to participants by providing them with timely and meaningful feedback, (2) rigor by
applying state-of-the-art prediction methods, (3) usability by implementing an easy-to-use web appli-
cation, and (4) generalizability by being applicable in different research domains. As a proof-of-
concept, we evaluated selfsurvey in a maturity study in the context of IT service management, where
predicted variable scores derived from training data were interpreted as ‘benchmarks’ of maturity and
observed scores as ‘as-is’ levels. Survey respondents had the possibility to provide short qualitative
statements (positive/negative), which provide descriptive evidence for the usefulness of selfsurvey and
its underlying prediction and feedback mechanisms.
In the remainder, we first explain the methodological foundations that are crucial to understand the
scoring algorithm implemented to our artifact. We then explain the design approach, expose details
about the selfsurvey implementation, and show the results of its evaluation. Finally, we offer a brief
review of related projects and a conclusion.
2 Foundations: Structural Equation Models in Survey Research
Selfsurvey builds on the principles of structural equation modeling (SEM) to provide a state-of-the-art
multivariate prediction mechanism. SEM has become a quasi-standard in IS and other disciplines as it
allows researchers to analyze series of interrelated dependence relationships between (unobserved)
conceptual variables, measured by sets of indicator variables, while simultaneously accounting for
measurement error (Ringle et al., 2012).
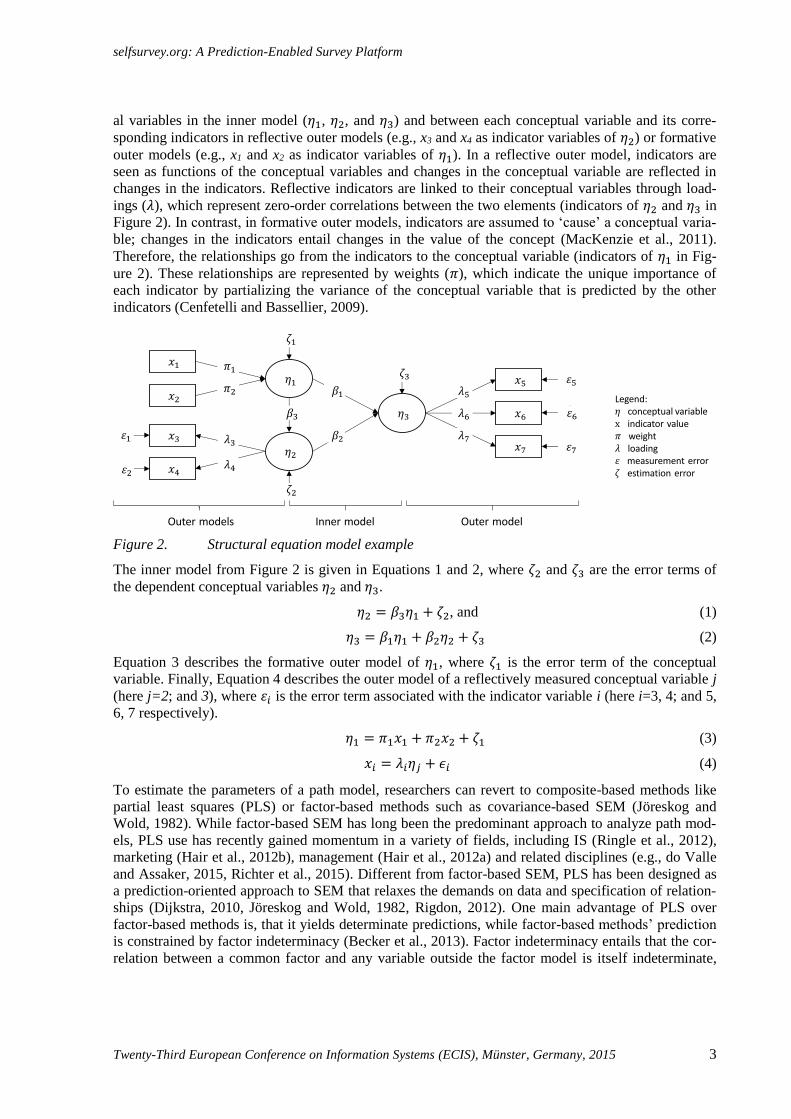
Consider Figure 2 for a sample path model, which illustrates the relationships between three conceptu-
SelfSurvey Platform
Respondent Researcher
2. Paticipate in survey
5. Obtain feedback
1. Launch a survey
3. Obtain data
4. Update model
Empirical data for rigorous analysis
Relevant and timely feedback
selfsurvey.org: A Prediction-Enabled Survey Platform
Twenty-Third European Conference on Information Systems (ECIS), Münster, Germany, 2015 3
al variables in the inner model (휂1, 휂2, and 휂3) and between each conceptual variable and its corre-
sponding indicators in reflective outer models (e.g., x3 and x4 as indicator variables of 휂2) or formative
outer models (e.g., x1 and x2 as indicator variables of 휂1). In a reflective outer model, indicators are
seen as functions of the conceptual variables and changes in the conceptual variable are reflected in
changes in the indicators. Reflective indicators are linked to their conceptual variables through load-
ings (𝜆), which represent zero-order correlations between the two elements (indicators of 휂2 and 휂3 in
Figure 2). In contrast, in formative outer models, indicators are assumed to ‘cause’ a conceptual varia-
ble; changes in the indicators entail changes in the value of the concept (MacKenzie et al., 2011).
Therefore, the relationships go from the indicators to the conceptual variable (indicators of 휂1 in Fig-
ure 2). These relationships are represented by weights (𝜋), which indicate the unique importance of
each indicator by partializing the variance of the conceptual variable that is predicted by the other
indicators (Cenfetelli and Bassellier, 2009).
Figure 2. Structural equation model example
The inner model from Figure 2 is given in Equations 1 and 2, where 휁2 and 휁3 are the error terms of
the dependent conceptual variables 휂2 and 휂3.
휂2 = 𝛽3휂1 + 휁2, and (1)
휂3 = 𝛽1휂1 + 𝛽2휂2 + 휁3 (2)
Equation 3 describes the formative outer model of 휂1, where 휁1 is the error term of the conceptual
variable. Finally, Equation 4 describes the outer model of a reflectively measured conceptual variable j
(here j=2; and 3), where 휀𝑖 is the error term associated with the indicator variable i (here i=3, 4; and 5,
6, 7 respectively).
휂1 = 𝜋1𝑥1 + 𝜋2𝑥2 + 휁1 (3)
𝑥𝑖 = 𝜆𝑖휂𝑗 + 𝜖𝑖 (4)
To estimate the parameters of a path model, researchers can revert to composite-based methods like
partial least squares (PLS) or factor-based methods such as covariance-based SEM (Jöreskog and
Wold, 1982). While factor-based SEM has long been the predominant approach to analyze path mod-
els, PLS use has recently gained momentum in a variety of fields, including IS (Ringle et al., 2012),
marketing (Hair et al., 2012b), management (Hair et al., 2012a) and related disciplines (e.g., do Valle
and Assaker, 2015, Richter et al., 2015). Different from factor-based SEM, PLS has been designed as
a prediction-oriented approach to SEM that relaxes the demands on data and specification of relation-
ships (Dijkstra, 2010, Jöreskog and Wold, 1982, Rigdon, 2012). One main advantage of PLS over
factor-based methods is, that it yields determinate predictions, while factor-based methods’ prediction
is constrained by factor indeterminacy (Becker et al., 2013). Factor indeterminacy entails that the cor-
relation between a common factor and any variable outside the factor model is itself indeterminate,
Outer models Outer modelInner model
Legend:conceptual variableindicator valueweightloadingmeasurement errorestimation error

selfsurvey.org: A Prediction-Enabled Survey Platform
Twenty-Third European Conference on Information Systems (ECIS), Münster, Germany, 2015 4
which makes factor-based SEM grossly unsuitable for prediction (Becker et al., 2013, Rigdon, 2012).
In contrast, PLS produces determinate scores for each conceptual variable based on linear combina-
tions of the indicators and their weights. More precisely, PLS constructs proxies of the conceptual
variables in the form of linear composites by means of “a sequence of alternating least squares algo-
rithms, each time solving a local, linear problem, with the aim to extract the predictive information in
the sample” (Dijkstra, 2010). Evermann and Tate’s (2014) recent simulation study underlines PLS’s
superior predictive ability compared to factor-based SEM and simple regression methods.
An important feature of PLS, reproduced by selfsurvey is the computation of the scores of conceptual
variables in the PLS algorithm (for a detailed description of the PLS algorithm see Tenenhaus et al.,
2005). Initially, in the ‘inner approximation,’ PLS creates inner proxies of each conceptual variable,
which form the foundation for the estimation of the model parameters (i.e., loadings, weights, and path
coefficients). The inner proxy of a conceptual variable is a type of weighted sum of the scores of other
conceptual variables in the model depending on the inner weighting scheme. These inner proxies are
then updated in the ‘outer approximation’ by means of linear combinations of indicator scores and
proxies of the indicator weights. The indicator weights are an important element in that they are used
to form the inner proxies, regardless of whether the outer model is reflective or formative. The inner
and outer approximation run iteratively until the indicator weight estimates converge (e.g., Tenenhaus
et al., 2005). Based on this concept, selfsurvey computes respondent-specific scores of the dependent
conceptual variables from its indicator variables (observed scores) and compares these to the scores
computed from its antecedent conceptual variables, based on a given model and parameter estimates
from a training dataset (see Section Scoring Algorithm).
3 Design Approach and Artifact Development
The development of selfsurvey follows a design science paradigm. Design science provides a method-
ological frame for constructive research in IS that “focuses on creating and evaluating innovative IT
artifacts that enable organizations to address important information-related tasks” (Hevner et al., 2004,
p. 98). Hevner et al. provide seven guidelines for effective design research that we address at different
stages of our research. These guidelines relate to (1) design of the artifact, (2) problem relevance,
(3) evaluation, (4) research contribution, (5) research rigor, (6) design as a search process, as well as
(7) communication of the research. We formulated four design requirements for the development of
our artifact that relate to these guidelines:
Relevance: The artifact should provide timely and useful feedback to survey participants after
completion of a questionnaire, including dynamically generated graphical textual outputs.
Rigor: Feedback provided by the artifact should—beyond descriptive statistics—be based on state-
of-the-art multivariate inference methods (e.g., SEM-based prediction), and be able to
o handle the use of continuous and discrete variables, and
o operationalize academic theory for a practitioner audience.
Usability: The artifact should have the look and feel of a modern web application, including easy
navigation and multi-language support.
Generalizability: The principles applied in this artifact should be applicable across a wide range of
contexts and the artifact should be easy to reuse for different survey studies.
Regarding guideline 6, the design process was iterative, comprising several periods with different
developers working on the artifact at different times, and entailed principles of user-centered design.
In 2011, we started building this artifact without drawing on existing survey tools to make this proof-
of-concept independent from other third-party software. A first version of selfsurvey, which was fin-
ished early 2012, focused on the platform front-end including the creation of different survey question
types as HTML elements. A second version then focused on the re-usability by rendering question-
naires from independent XML file inputs and, amongst others, also improved the prediction function-
ality. This version was live tested early 2013 in a think-aloud meeting with a CIO, who filled out an
selfsurvey.org: A Prediction-Enabled Survey Platform
Twenty-Third European Conference on Information Systems (ECIS), Münster, Germany, 2015 5
example questionnaire (different from the one that the evaluation in this paper is based on) and re-
viewed the feedback page. Based on this preliminary evaluation, a third version was built that shifted
some of the application logic to the client side (using JavaScript) and introduced asynchronous web
techniques (AJAX) for a more seamless user experience when navigating in a survey. The fourth and
final version, which this paper is based on, made significant improvements foremost in the visualiza-
tion of feedback results on the conceptual variable as well as on the indicator levels. For this purpose,
interviews with three IT professionals were conducted early 2014 to improve the visualization capabil-
ities and finalize the work.
Addressing guideline 3, the main evaluation of the artifact was performed in the course of a field
study on a specific maturity phenomenon. First, this evaluation should demonstrate if and how the
artifact can be applied in a concrete survey project. Second, under the assumption that the perceived
relevance of this specific selfsurvey project would be reflected in the respondents’ overall user experi-
ence with this survey tool, we added an additional (but optional) questionnaire page, where survey
respondents were encouraged to provide short statements. The details and results of this proof-of-
concept and qualitative user evaluation are presented in Section Evaluation.
4 Artifact: Selfsurvey Platform and Algorithm
In this section, we first describe selfsurvey’s technical architecture in which the SEM scoring algo-
rithm is embedded, before explaining the algorithm as such more formally.
4.1 Technical Architecture
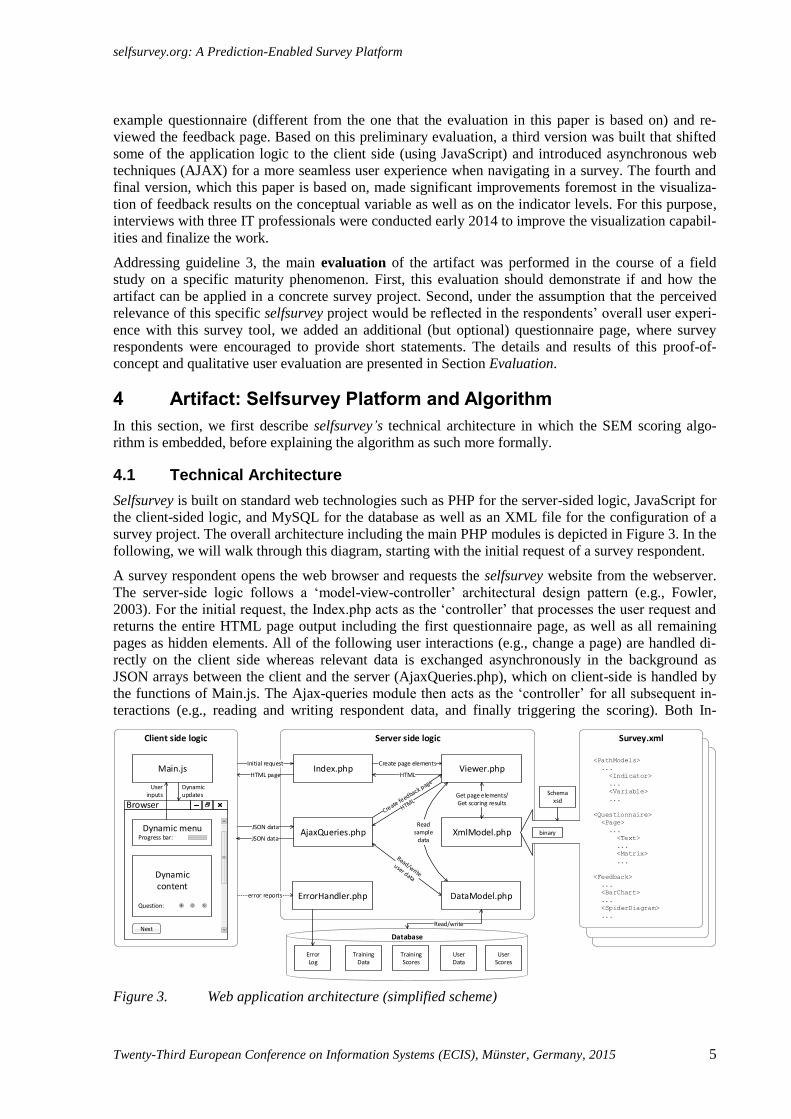
Selfsurvey is built on standard web technologies such as PHP for the server-sided logic, JavaScript for
the client-sided logic, and MySQL for the database as well as an XML file for the configuration of a
survey project. The overall architecture including the main PHP modules is depicted in Figure 3. In the
following, we will walk through this diagram, starting with the initial request of a survey respondent.
A survey respondent opens the web browser and requests the selfsurvey website from the webserver.
The server-side logic follows a ‘model-view-controller’ architectural design pattern (e.g., Fowler,
2003). For the initial request, the Index.php acts as the ‘controller’ that processes the user request and
returns the entire HTML page output including the first questionnaire page, as well as all remaining
pages as hidden elements. All of the following user interactions (e.g., change a page) are handled di-
rectly on the client side whereas relevant data is exchanged asynchronously in the background as
JSON arrays between the client and the server (AjaxQueries.php), which on client-side is handled by
the functions of Main.js. The Ajax-queries module then acts as the ‘controller’ for all subsequent in-
teractions (e.g., reading and writing respondent data, and finally triggering the scoring). Both In-
Database
Client side logic
Main.js
Browser
Next
Dynamic menu
Dynamic content
Question:
Server side logic
Progress bar:
Index.php
AjaxQueries.php
ErrorHandler.php
HTML page
JSON data
JSON data
error reports
ErrorLog
Training Data
Training Scores
User Data
User Scores
Survey.xml
XmlModel.php
Viewer.php
Schema xsd
<PathModels>
...
<Indicator>
...
<Variable>
...
<Questionnaire>
<Page>
...
<Text>
...
<Matrix>
...
<Feedback>
...
<BarChart>
...
<SpiderDiagram>
...
HTML
Initial request Create page elements
Get page elements/Get scoring results
Read sample
databinary
DataModel.php
Read/write
User inputs
Dynamic updates
Figure 3. Web application architecture (simplified scheme)
selfsurvey.org: A Prediction-Enabled Survey Platform
Twenty-Third European Conference on Information Systems (ECIS), Münster, Germany, 2015 6
dex.php and AjaxQueries.php make use of the functions of Viewer.php for creating HTML output,
including the different questions that populate the questionnaire page (needed initially by Index.php)
as well as the feedback page that is created dynamically after filling out the survey (transmitted by
AjaxQueries.php). Thus, the appearance of the website is determined by Viewer.php (plus additional
CSS style definitions).
The web application behavior (the ‘model’) for a specific survey project is configured in a Survey.xml
file. It contains three major sections: the configuration of the path model, the questionnaire, and the
feedback page. The path model section defines the variables, their indicators and relationships includ-
ing weights and loadings as specified by the researcher. It can also handle multiple parallel path mod-
els in case a research model contains a categorical moderator and has been estimated for multiple
training sets (e.g., different path models for male and female participants). The chosen path model
then depends on the respondent’s input. The questionnaire section defines the actual flow of questions,
texts and page breaks, mapping each of the input questions to relevant indicators of the path model.
Different question types are currently available, such as one-way matrix (e.g., for Likert items), two-
way matrix (for bipolar items), vertical radio buttons, check boxes as well as numerical inputs and text
inputs. All texts can be specified in different languages. The feedback section of the Survey.xml file
defines how individual scoring results are presented to the respondent after filling out a survey. This
feedback can include different types of bar charts and spider diagrams for dependent variable scores
and indicator level values (both realized using third party APIs). Additional text elements can be spec-
ified here that help to interpret the visual results.
To avail a specific survey configuration at run-time, the survey’s XML is first validated syntactically
through an XML schema definition (XSD) once a new project is initialized, then parsed into a global
configuration object and finally serialized into a binary file that can be quickly reloaded every time a
new survey respondent starts a session. This global object, which is provided by XmlModel.php, also
implements the routines of the scoring algorithm, which start from the dependent variable and recur-
sively calculate the scores of the path model variables (see next Section). The persistent data for this
web application is stored in a relational database that comprises the user input data as well as the train-
ing data that the path models are based on. Standardized indicator values and variable for both, user
data and training data are stored in separate tables. All read/write operations to the data model (i.e., all
SQL queries) are encapsulated by DataModel.php; with one minor exception: The web application
also catches potential JavaScript runtime errors at client-side through an error handler that logs these
directly in a separate database table.
4.2 Scoring Algorithm
The working principle of the scoring algorithm, which is at the core of selfsurvey, builds on the PLS
algorithm and follows a five-step procedure: (1) Calculation of observed conceptual variable scores,
(2) calculation of predicted conceptual variable scores, (3) calculation of predicted indicator values,
(4) transformation to original scales, and (5) comparisons. The variables for our path model example
and the five-step algorithm are depicted in Figure 4.1
Prerequisite (Step 0) for this procedure is that the standard PLS algorithm has previously been run on a
training dataset to obtain weight, loading, and path coefficient estimates.2 This training dataset may
stem from a pre-test or from a prior study and needs to fulfill standard sample size requirements (e.g.,
1 Note that Figure 4 includes both, indicator loadings and weights as both elements are used in the course of the ‘outer ap-
proximation’ stage of the PLS algorithm. The interpretation of model estimates, however, primarily focuses on indicator
loadings for reflective measures and indicator weights for formative measures (Hair et al. 2014).
2 Several software tools are available to estimate the path model (Step 0); for an early overview, see Temme et al. (2010).

selfsurvey.org: A Prediction-Enabled Survey Platform
Twenty-Third European Conference on Information Systems (ECIS), Münster, Germany, 2015 7
Hair et al., 2014). Furthermore, model estimates must exhibit sufficient levels of reliability and validi-
ty (e.g., Hair et al., 2012b).3 Using these estimates, Steps 1-4 of the scoring algorithm calculate indi-
vidual case values for each respondent.
In Step 1, analogous to the ‘outer approximation’ in the PLS algorithm (Tenenhaus et al., 2005), ob-
served conceptual variable scores are calculated as linear combinations of the associated (standard-
ized) observed indicators (𝑥′𝑖) and their weights as obtained from step 0.4 As the computation of con-
ceptual variable scores in PLS builds on indicator weights, regardless of the outer model specification
(Tenenhaus et al. 2005), Step 1 universally applies to reflective and formative outer models. For this
purpose, all indicator variable values are initially transformed to z-values using the means �̅�𝑖 and
standard deviations 𝑠𝑖 from the training set:
𝑧′𝑖 = 𝑥′𝑖− �̅�𝑖
𝑠𝑖 (5)
The observed conceptual variable scores are then given by:
휂′𝑗 = ∑ 𝜋𝑖𝑧′𝑖𝑖 ∀ indicators 𝑖 of conceptual variable 𝑗 (6)
Step 2 involves the calculation of the predicted scores 휂̂ for each conceptual variable. The algorithm
starts with the independent conceptual variables whose predicted scores are identical to the observed
scores as obtained in Step 1. Thus, for the model in Figure 4, the following holds:
휂̂1 = 휂′1 (7)
For the dependent conceptual variables, the algorithm recursively iterates through the antecedent vari-
ables. More precisely, the predicted scores are given as a linear combination of the (predicted) ante-
3 In case such training data is not available at the time of executing an initial survey, selfsurvey also provides the possibility
to first conduct a survey and then provide the scoring results at a later point in time, for example, after updating the research
model and sending an email notification (see Figure 1).
4 The prime symbol (𝑥′) indicates that the values are observed for a specific respondent.
Figure 4. SEM scoring algorithm example
1. Calculation of observed conceptual variable scores 2. Calculation of predicted conceptual variable scores
3. Calculation of predicted indicator values 4. Transformation to original scales, and 5. comparisons
Legend: Observed indicator value (scaled)Predicted indicator value (scaled)Observed conceptual variable score (scaled)Predicted conceptual variable score (scaled)
Observed indicator value (standardized)Predicted indicator value (standardized)Observed conceptual variable scorePredicted conceptual variable score
0. PrerequisiteStandard PLS algorithm previously run to obtain weights , loadings , and path coefficients
selfsurvey.org: A Prediction-Enabled Survey Platform
Twenty-Third European Conference on Information Systems (ECIS), Münster, Germany, 2015 8
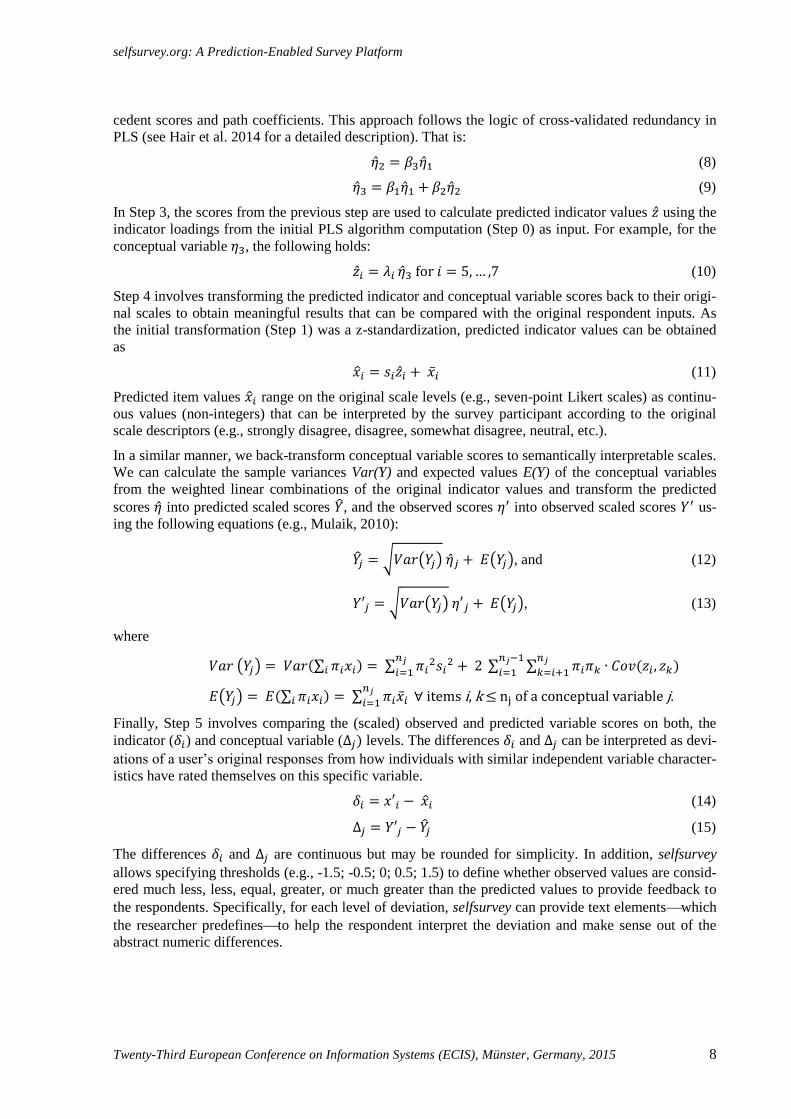
cedent scores and path coefficients. This approach follows the logic of cross-validated redundancy in
PLS (see Hair et al. 2014 for a detailed description). That is:
휂̂2 = 𝛽3휂̂1 (8)
휂̂3 = 𝛽1휂̂1 + 𝛽2휂̂2 (9)
In Step 3, the scores from the previous step are used to calculate predicted indicator values �̂� using the
indicator loadings from the initial PLS algorithm computation (Step 0) as input. For example, for the
conceptual variable 휂3, the following holds:
�̂�𝑖 = 𝜆𝑖 휂̂3 for 𝑖 = 5, … ,7 (10)
Step 4 involves transforming the predicted indicator and conceptual variable scores back to their origi-
nal scales to obtain meaningful results that can be compared with the original respondent inputs. As
the initial transformation (Step 1) was a z-standardization, predicted indicator values can be obtained
as
𝑥𝑖 = 𝑠𝑖�̂�𝑖 + �̅�𝑖 (11)
Predicted item values 𝑥𝑖 range on the original scale levels (e.g., seven-point Likert scales) as continu-
ous values (non-integers) that can be interpreted by the survey participant according to the original
scale descriptors (e.g., strongly disagree, disagree, somewhat disagree, neutral, etc.).
In a similar manner, we back-transform conceptual variable scores to semantically interpretable scales.
We can calculate the sample variances Var(Y) and expected values E(Y) of the conceptual variables
from the weighted linear combinations of the original indicator values and transform the predicted
scores 휂̂ into predicted scaled scores �̂�, and the observed scores 휂′ into observed scaled scores 𝑌′ us-
ing the following equations (e.g., Mulaik, 2010):
�̂�𝑗 = √𝑉𝑎𝑟(𝑌𝑗) 휂̂𝑗 + 𝐸(𝑌𝑗), and (12)
𝑌′𝑗 = √𝑉𝑎𝑟(𝑌𝑗) 휂′𝑗 + 𝐸(𝑌𝑗), (13)
where
𝑉𝑎𝑟 (𝑌𝑗) = 𝑉𝑎𝑟(∑ 𝜋𝑖𝑥𝑖𝑖 ) = ∑ 𝜋𝑖2𝑠𝑖
2 + 2 ∑ ∑ 𝜋𝑖𝜋𝑘 ∙ 𝐶𝑜𝑣(𝑧𝑖 , 𝑧𝑘)𝑛𝑗
𝑘=𝑖+1
𝑛𝑗−1
𝑖=1
𝑛𝑗
𝑖=1
𝐸(𝑌𝑗) = 𝐸(∑ 𝜋𝑖𝑥𝑖𝑖 ) = ∑ 𝜋𝑖�̅�𝑖𝑛𝑗
𝑖=1 ∀ items i, k ≤ nj of a conceptual variable j.
Finally, Step 5 involves comparing the (scaled) observed and predicted variable scores on both, the
indicator (𝛿𝑖) and conceptual variable (Δ𝑗) levels. The differences 𝛿𝑖 and Δ𝑗 can be interpreted as devi-
ations of a user’s original responses from how individuals with similar independent variable character-
istics have rated themselves on this specific variable.
𝛿𝑖 = 𝑥′𝑖 − 𝑥𝑖 (14)
Δ𝑗 = 𝑌′𝑗 − �̂�𝑗 (15)
The differences 𝛿𝑖 and Δ𝑗 are continuous but may be rounded for simplicity. In addition, selfsurvey
allows specifying thresholds (e.g., -1.5; -0.5; 0; 0.5; 1.5) to define whether observed values are consid-
ered much less, less, equal, greater, or much greater than the predicted values to provide feedback to
the respondents. Specifically, for each level of deviation, selfsurvey can provide text elementswhich
the researcher predefinesto help the respondent interpret the deviation and make sense out of the
abstract numeric differences.
selfsurvey.org: A Prediction-Enabled Survey Platform
Twenty-Third European Conference on Information Systems (ECIS), Münster, Germany, 2015 9
5 Evaluation: Using Selfsurvey to Study Maturity Phenomena
We evaluated selfsurvey in the context of a larger study on maturity of IT service management (ITSM)
processes. For reasons of brevity, in this section we only briefly explain the study background and the
survey’s key variables. Instead, we focus on how the training dataset was collected and how the
selfsurvey scoring algorithm facilitated the provision of feedback to the survey participants.5 Finally,
we present the results of the participants’ qualitative evaluation of selfsurvey.
5.1 Study Background and Survey Design
The concept of maturity has high relevance to IS practice and is also becoming an increasingly im-
portant subject of IS research (Becker et al., 2010). Maturity can generally be understood as “as a
measure to evaluate the capabilities of an organization in regards to a certain discipline” (Rosemann
and de Bruin, 2005). Maturity models have been proposed within different areas of application, for
example, for software engineering (Paulk et al., 1993), business process management (Rosemann and
de Bruin, 2005), e-government (Andersen and Henriksen, 2006), and ITSM (CMMI-SVC, 2010). Es-
pecially research on ITSM is still in its early development stage with mostly descriptive works on
common ITSM frameworks and few case studies on benefits and challenges of ITSM implementations
(Marrone and Kolbe, 2011).
The study used to evaluate and illustrate the capabilities of selfsurvey addresses this gap in research by
investigating the impact of antecedents of ITSM process maturity. ITSM process maturity is conceptu-
alized as the maturity of “a set of specialized organizational capabilities for providing value to cus-
tomers […] in the form of functions and processes for managing services over a lifecycle” (OGC,
2011). Specifically, the study builds on the IT Infrastructure Library (ITIL), which is the most widely
applied framework for ITSM (Marrone and Kolbe, 2011), and measures ITSM process maturity in
each of ITIL’s four main lifecycle areas (service strategy, service design, service transition, and ser-
vice operation) as separate variables, based on the maturity of their 26 constituting processes (6, 8, 7,
and 5 processes, respectively). The maturity of each of these processes (e.g., incident management,
problem management, and change management) is measured on six-point scales with the descriptors
‘none,’ ‘initial,’ ‘repeatable,’ ‘defined,’ ‘managed,’ and ‘optimized’ used in the well-known Capability
Maturity Model (CMM, Paulk et al., 1993). The survey explains each scale level to the respondent by
detailed descriptors which have been derived from CMM-based frameworks that fit this study’s ITSM
context (e.g., CMMI-SVC, 2010).
Independent variables that potentially predict the maturity of the ITSM processes in each of the ITIL
stages have been derived from prior literature and were operationalized using established measures.
These predictors relate to both properties of the organization, such as organization size (measured by
common logarithm of the number of employees), industry type (manufacturing vs. service) and IT
strategy (innovative vs. conservative), as well as properties of the IT services provided, such as their
business criticality (high vs. low) and expected service levels (high vs. low). Each of these variables is
hypothesized to have relationships to the dependent variables. For example, larger organizations are
expected to exhibit a greater maturity in their ITSM processes. In addition, respondents have to indi-
cate the relevant type of IT service provider (internal IT unit, shared service IT unit, or external service
provider). The service provider type acts as a categorical moderator in the model as antecedent-to-
dependent variable relationships may differ for different types of IT service providers.
5 For more details on the study including the measures of the dependent variable we refer to Wulf et al. (2015).
selfsurvey.org: A Prediction-Enabled Survey Platform
Twenty-Third European Conference on Information Systems (ECIS), Münster, Germany, 2015 10
5.2 Training Dataset and SEM Scoring
The training dataset, whose model estimates facilitate calibrating the feedback on predicted levels of
ITSM process maturity, was collected mid 2013 from IT professionals (IT managers, IT service man-
agement experts, consultants) using a standard survey platform. This initial study (the pretest of the
actual survey) yielded n1=24 usable responses, which were used to estimate a baseline model with a
reduced number of independent variables and no use of the categorical moderator ‘type of service
provider.’ Despite the comparably low sample size in relation to the model complexity, all model
evaluation criteria were met (e.g., Hair et al., 2012b) and path coefficients were plausible in magnitude
and sign. Therefore, the results of the baseline model analysis offer a sound basis for providing the
users with preliminary feedback.
In the follow-up study during late 2013, we collaborated with a leading professional association and
invited ITSM practitioners from Germany, Denmark, and Switzerland to participate in our research.
The follow-up study relied on the third version of selfsurvey (see section Design Approach) and pro-
vided users with preliminary feedback based on the baseline model estimates. In light of the sample
size restrictions in the initial study, we pointed out the preliminary nature of the results, announcing
that further results based on a broader empirical basis will be provided. This second stage yielded
n2=130 usable responses, which were subsequently used to estimate an updated model with two addi-
tional independent variables and separate models for internal IT units (n2a=60), shared service IT units
(n2b=41), and external service providers (n2c=29). Table 1 illustrates the key differences between the
baseline model and updated model version of the ITSM selfsurvey project.
In line with the scoring algorithm, ‘as-is’ (i.e., observed) levels result directly from the user assess-
ment of current ITSM process maturity levels. Benchmark (i.e., predicted) levels result from the user
inputs on the independent variables (such as organization size, industry, IT strategy, and expected IT
service levels) and can be interpreted as average levels of process maturity of organizations with simi-
lar characteristics regarding the aforementioned predictors. The analysis of deviations between ob-
served and predicted scores and indicator values was labelled a ‘gap analysis’ and included explana-
tions of the method for the practitioner audience. Furthermore, the descriptions stressed that the
benchmark scores do not necessarily represent ‘optimal’ levels.
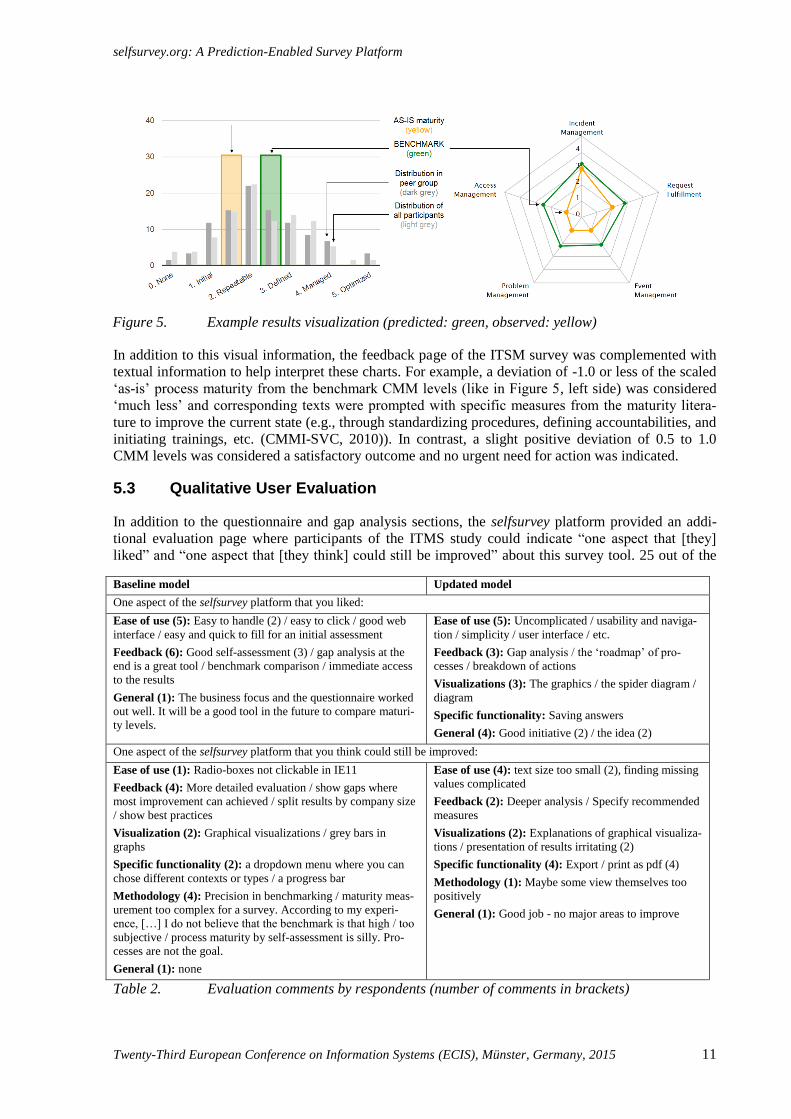
Figure 5 displays two visualizations generated by selfsurvey: A bar chart to display scaled conceptual
variable scores (here: ITSM process maturity in the service operation area, binned into 0.5 point inter-
vals), and a spider diagram to display scaled indicator values (here: the maturity of each of the pro-
cesses in the ITSM service operation area in continuous values). For the binned conceptual variable
scores, selfsurvey additionally displayed the relative distributions of the training data scores (1) of
responses in the same category (here: the same service provider type, termed ‘peer group’), and (2) of
all responses (grey bars in Figure 5).
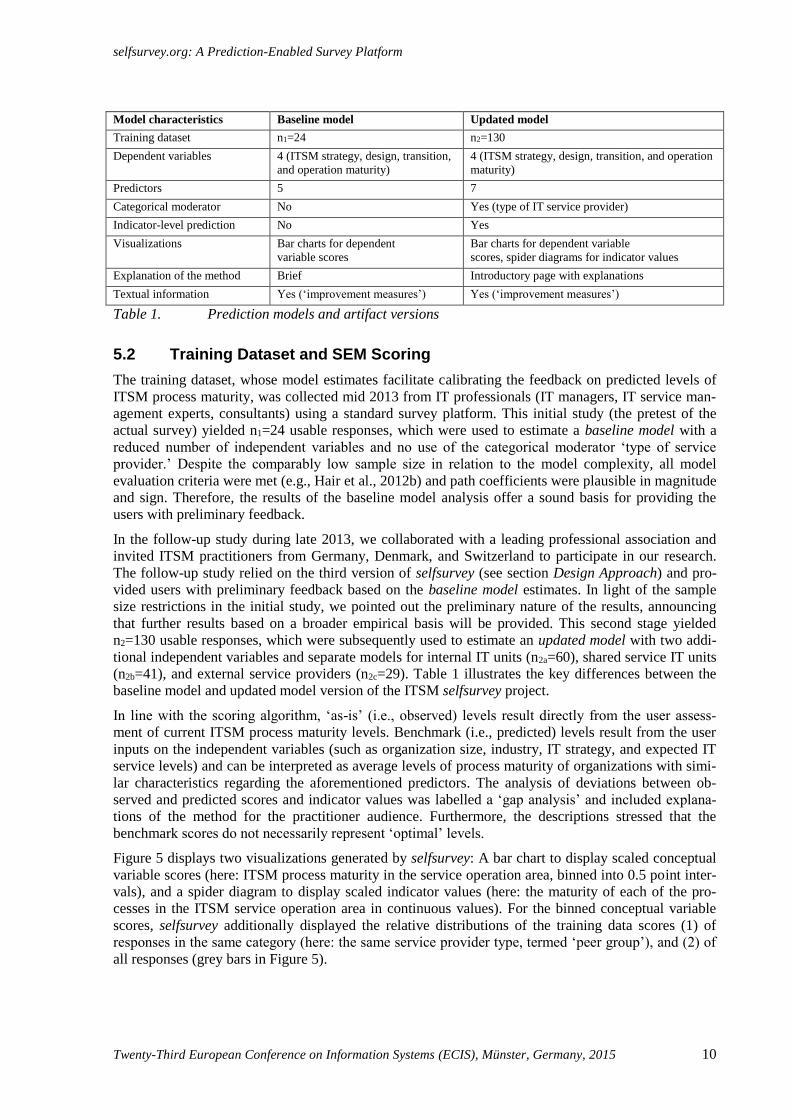
Model characteristics Baseline model Updated model
Training dataset n1=24 n2=130
Dependent variables 4 (ITSM strategy, design, transition,
and operation maturity)
4 (ITSM strategy, design, transition, and operation
maturity)
Predictors 5 7
Categorical moderator No Yes (type of IT service provider)
Indicator-level prediction No Yes
Visualizations Bar charts for dependent
variable scores
Bar charts for dependent variable
scores, spider diagrams for indicator values
Explanation of the method Brief Introductory page with explanations
Textual information Yes (‘improvement measures’) Yes (‘improvement measures’)
Table 1. Prediction models and artifact versions
selfsurvey.org: A Prediction-Enabled Survey Platform
Twenty-Third European Conference on Information Systems (ECIS), Münster, Germany, 2015 11
In addition to this visual information, the feedback page of the ITSM survey was complemented with
textual information to help interpret these charts. For example, a deviation of -1.0 or less of the scaled
‘as-is’ process maturity from the benchmark CMM levels (like in Figure 5, left side) was considered
‘much less’ and corresponding texts were prompted with specific measures from the maturity litera-
ture to improve the current state (e.g., through standardizing procedures, defining accountabilities, and
initiating trainings, etc. (CMMI-SVC, 2010)). In contrast, a slight positive deviation of 0.5 to 1.0
CMM levels was considered a satisfactory outcome and no urgent need for action was indicated.
5.3 Qualitative User Evaluation
In addition to the questionnaire and gap analysis sections, the selfsurvey platform provided an addi-
tional evaluation page where participants of the ITMS study could indicate “one aspect that [they]
liked” and “one aspect that [they think] could still be improved” about this survey tool. 25 out of the
Baseline model Updated model
One aspect of the selfsurvey platform that you liked:
Ease of use (5): Easy to handle (2) / easy to click / good web
interface / easy and quick to fill for an initial assessment
Feedback (6): Good self-assessment (3) / gap analysis at the
end is a great tool / benchmark comparison / immediate access
to the results
General (1): The business focus and the questionnaire worked
out well. It will be a good tool in the future to compare maturi-
ty levels.
Ease of use (5): Uncomplicated / usability and naviga-
tion / simplicity / user interface / etc.
Feedback (3): Gap analysis / the ‘roadmap’ of pro-
cesses / breakdown of actions
Visualizations (3): The graphics / the spider diagram /
diagram
Specific functionality: Saving answers
General (4): Good initiative (2) / the idea (2)
One aspect of the selfsurvey platform that you think could still be improved:
Ease of use (1): Radio-boxes not clickable in IE11
Feedback (4): More detailed evaluation / show gaps where
most improvement can achieved / split results by company size
/ show best practices
Visualization (2): Graphical visualizations / grey bars in
graphs
Specific functionality (2): a dropdown menu where you can
chose different contexts or types / a progress bar
Methodology (4): Precision in benchmarking / maturity meas-
urement too complex for a survey. According to my experi-
ence, […] I do not believe that the benchmark is that high / too
subjective / process maturity by self-assessment is silly. Pro-
cesses are not the goal.
General (1): none
Ease of use (4): text size too small (2), finding missing
values complicated
Feedback (2): Deeper analysis / Specify recommended
measures
Visualizations (2): Explanations of graphical visualiza-
tions / presentation of results irritating (2)
Specific functionality (4): Export / print as pdf (4)
Methodology (1): Maybe some view themselves too
positively
General (1): Good job - no major areas to improve
Table 2. Evaluation comments by respondents (number of comments in brackets)
Figure 5. Example results visualization (predicted: green, observed: yellow)

selfsurvey.org: A Prediction-Enabled Survey Platform
Twenty-Third European Conference on Information Systems (ECIS), Münster, Germany, 2015 12
130 respondents from the first stage (baseline model version) of the ITSM study made use of this pos-
sibility and provided short statements. After we updated the prediction model and implemented the
updated model improvements (described in Table 1), we received further evaluation statements from a
different set of 22 respondents. We sorted these statements into nine emergent categories as statements
about the survey content, survey clarity, and survey length; as well as those about ease of use, feed-
back functionality, visualizations, the methodology as such, and general comments about the tool.
Table 3 displays the comments referring to the tool before and after the model update, given that these
are of higher interest for the purpose of evaluation (and not those about the survey as such).
Although descriptive in nature, we believe one can see a tendency in these results, which asked equal-
ly for positive aspects and areas of improvement. First, the comments on the positive (upper) side pro-
vide a clear indication that the tool is perceived both as easy to use and as useful. The opportunity of
receiving instant feedback is acknowledged positively by a majority of those who provided tool-
related feedback. While many of the ‘improvement potentials’ (lower side) also have a positive tone,
we also can see differences here between the baseline version and the updated version: While some
users of the baseline model version are skeptical about the methodology and demand more sophisticat-
ed feedback mechanisms, these issues seem to have been successfully addressed in the updated model
version. For the updated model version, remaining improvement potentials mainly revolve around
advanced user wishes for specific functionality to print the assessment results—which, in turn, can
again be viewed as an indication of perceived usefulness and perceived relevance of the feedback re-
sults to the study participants.
6 Related Projects
The idea of providing online self-assessment and benchmarking tools is not entirely new. Several
websites are available by commercial providers that address, for example, business process manage-
ment capabilities (iGrafx, 2014), online analytics maturity (CardinalPath, 2014), scientific innovation
maturity (Accelrys, 2014), manufacturing excellence (EUBIZZ, 2014), retail business capabilities
(NSAfR, 2014), or workforce and customer experience (IBM, 2014). The vast majority of these tools
rely on simple score aggregations as univariate measures, sometimes complemented by certain indus-
try or company size categories. In addition, some academics have used their data and models to pro-
vide online tools that let practitioners benefit from their research. Examples are the World Manage-
ment Survey (WMS, 2014), the Organizational Culture Assessment Instrument (e.g., OCAI, 2014),
and Hofstede et al.’s ‘Culture Compass’ (Hofstede, 2014).
Selfsurvey differs from these commercial as well as academic initiatives in at least two important
ways. First, benchmarks provided by selfsurvey rely on predictions based on a validated path model
that can be used in a far more context-specific way than the mere aggregation of empirical scores.
Second, selfsurvey is designed as a multi-purpose platform that allows for great flexibility when speci-
fying different survey projects by using separate XML configuration. This flexibility makes selfsurvey
different from those academic tools that are solely designed for the specific purpose of a singular
model. To the best of our knowledge, there is currently no other benchmarking platform that
(1) implements SEM-based prediction, (2) allows researchers to flexibly specify different conceptual
models, and (3) provides participants with instant feedback.
7 Conclusion
The potentials of combining state-of-the-art survey research methods with a more practitioner-oriented
benchmarking approach motivated our development of selfsurvey.org, an online survey platform that
can provide instant feedback to survey respondents based on scientifically grounded research models
and a multivariate prediction technique. Based on the PLS analysis of a training dataset, selfsurvey
derives respondent-specific predicted (benchmark) scores and compares these with observed scores of
a respondent, thus allowing survey participants to assess the extent to which they deviate from what a
selfsurvey.org: A Prediction-Enabled Survey Platform
Twenty-Third European Conference on Information Systems (ECIS), Münster, Germany, 2015 13
theoretically grounded path model suggests. We argued that the prediction and feedback mechanisms
implemented in selfsurvey, which go far beyond commonly applied univariate comparisons, can lever-
age theoretical models specified by the researcher and generate meaningful information to practition-
ers, provided that the survey principally addresses a problem domain of their interest.
We demonstrated the use of selfsurvey in the context of a recent study in the domain of ITSM process
maturity. The qualitative evaluation results indicate that respondents generally perceived selfsurvey as
easy to use and that its feedback option was a useful functionality to them. It also suggests that the
improvements made to the survey in the final update (i.e., increased training data, more sophisticated
prediction model, detailed visualizations, more textual information) helped to address some of the
prior shortcomings so that users of the updated model version see an even greater value in the survey’s
feedback results (and want these to be printed or exported). Although our user evaluation did not con-
sider whether the feedback results were ultimately of use in the respondents’ specific organizational
settings, the feedback mechanism can still be deemed a necessary condition to increase the potential
practical relevance of a survey. Compared to traditional ‘one-way’ studies, we therefore believe that
the prediction and feedback mechanisms underlying selfsurvey can facilitate the knowledge exchange
of researchers and survey respondents in an IS research cycle (Hevner et al., 2004) as well as other
disciplines.
We argue that the final artifact satisfies the four initially set design requirements: (1) selfsurvey sup-
ports relevance to survey participants since it is able to provide comprehensive feedback including
graphical visualizations (e.g., Figure 5) and case-specific textual information depending on the extent
of observed deviation. (2) To provide the respondents with feedback, selfsurvey applies PLS, a rigor-
ous and widely used method for prediction-oriented SEM. Selfsurvey can handle continuous variables
as antecedents as well as categorical variables as moderators of antecedent relationships, and is there-
fore applicable to a broad range of theoretical models. (3) Selfsurvey matches the usability characteris-
tics of modern web applications. (4) Finally, there are two levels of generalization that emanate from
this research: On a conceptual level, other researchers may apply the SEM-based scoring algorithm in
their own survey projects. On a practical level, we invite other researchers to use selfsurvey as a plat-
form to make their own research accessible and experienceable for practitioners.
An important question is to which extent SEM-based prediction will be perceived relevant in other
domains than for the maturity benchmarking that was the context for our evaluation. For example, in
technology acceptance research it might be less relevant for a survey participant to learn about his/her
predicted intention to use based on certain independent variables. As a simple guideline, we contend
that SEM-based prediction may be most useful in research where the dependent variable represents a
criterion from which a concrete ‘need for action’ emerges from the deviation between observed and
predicted scores. However, since the question whether a model is relevant for practice is ultimately
also a question of its theoretical underpinnings, we also concur with Benbasat and Zmud (1999, p. 6)
when they stress that IS research should “develop and assess strong theoretical models such that pre-
scriptive actions can confidently be suggested for practice.”
Limitations and future research relate to both the selfsurvey artifact and its evaluation. Selfsurvey, in
its current version, supports continuous antecedent variables and categorical moderators. A future
version might also address more complex interaction effects such as moderation between two continu-
ous variables and quadratic effects. In light of recent research on the predictive capabilities of the PLS
methodology (Becker et al., 2013), a future version of selfsurvey might also implement different
modes for estimating conceptual variable scores (i.e., Mode A vs. Mode B model estimation, Henseler
and Sarstedt, 2013), depending on the sample size, population R2 and degrees of multicollinearity in
the path model. Finally, by introducing selfsurvey to a broader base of researchers, we hope to facili-
tate the evaluation of selfsurvey in other research settings that allow deriving further recommendations
on how to improve the platform and the underlying prediction mechanisms.

selfsurvey.org: A Prediction-Enabled Survey Platform
Twenty-Third European Conference on Information Systems (ECIS), Münster, Germany, 2015 14
References
Accelrys (2014). Scientific maturity model. Accelrys Inc. URL: http://maturity.accelrys.com/ (visited
on 20/03/2015).
Andersen, K. and H. Henriksen (2006). “E-government maturity models: Extension of the Layne and
Lee model.” Government Information Quarterly 23 (2), 236-248.
Anseel, F., F. Lievens, E. Schollaert and B. Choragwicka (2010). “Response rates in organizational
science, 1995–2008: A meta-analytic review and guidelines for survey researchers.” Journal of
Business and Psychology 25 (3), 335-349.
Becker, J.-M., A. Rai and E. Rigdon (2013). “Predictive validity and formative measurement in
structural equation modeling: Embracing practical relevance.” In: Proceedings of the International
Conference on Information Systems (ICIS 2013). Milan, Italy.
Becker, J., B. Niehaves, J. Poeppelbuss and A. Simons (2010). “Maturity models in IS research.” In:
Proceedings of the 18th European Conference on Information Systems (ECIS 2010). Pretoria,
South Africa. Paper 42.
Benbasat, I., D. Goldstein and M. Mead (1987). “The case research strategy in studies of Information
Systems.” MIS Quarterly 11 (3), 369-386.
Benbasat, I. and R. Zmud (1999). “Empirical research in Information Systems: The practice of
relevance.” MIS Quarterly 23 (1), 3-16.
Boyer, E. (1996). “The scholarship of engagement.” Bulletin of the American Academy of Arts and
Sciences 49 (7), 11-20.
CardinalPath (2014). Online analytics maturity self-assessment tool. URL:
http://www.cardinalpath.com/services/online-analytics-maturity-model/assessment/#oamm_step2
(visited on 20/03/2015).
Cenfetelli, R. and G. Bassellier (2009). “Interpretation of formative measurement in Information
Systems research.” MIS Quarterly 33 (4), 689-706.
CMMI-SVC (2010). "CMMI for services, version 1.3." CMMI Product Team, Software Engineering
Institute, Carnegie Mellon.
Dijkstra, T. (2010). "Latent variables and indices: Herman Wold’s basic design and partial least
squares." In: Handbook of partial least squares. Springer. pp. 22-46.
do Valle, P. O. and G. Assaker (2015). “Using partial least squares structural equation modeling in
tourism research. A review of past research and recommendations for future applications.” Journal
of Travel Research, forthcoming.
EUBIZZ (2014). Self assessment tool. European Business Support Network (EUBIZZ). URL:
http://www.european-business-support-network.eu/trainings-coaching/self-assessment-tool (visited
on 20/03/2015).
Evermann, J. and M. Tate (2014). “Comparing out-of-sample predictive ability of PLS, covariance,
and regression models.” In: Proceedings of the 2014 International Conference on Information
Systems (ICIS 2012), Auckland, Australia.
Fowler, M. (2003). Patterns of enterprise application architecture. Addison-Wesley Professional.
Hair, J., Hult, C. Ringle and M. Sarstedt (2014). A primer on partial least squares structural equation
modeling (PLS-SEM). SAGE Publications, Incorporated.
Hair, J., M. Sarstedt, T. Pieper and C. Ringle (2012a). “The use of partial least squares structural
equation modeling in strategic management research: A review of past practices and
recommendations for future applications.” Long Range Planning 45 (5), 320-340.
Hair, J., M. Sarstedt, C. Ringle and J. Mena (2012b). “An assessment of the use of partial least squares
structural equation modeling in marketing research.” Journal of the Academy of Marketing Science
40 (3), 414-433.
Henseler, J. and M. Sarstedt (2013). “Goodness-of-fit indices for partial least squares path modeling.”
Computational Statistics 28 (2), 565-580.
selfsurvey.org: A Prediction-Enabled Survey Platform
Twenty-Third European Conference on Information Systems (ECIS), Münster, Germany, 2015 15
Hevner, A., S. March, J. Park and S. Ram (2004). “Design science in Information Systems research.”
MIS Quarterly 28 (1), 75-105.
Hofstede, G. (2014). Culture compass. The Hofstede Centre. URL: http://geert-hofstede.com/cultural-
survey.html (visited on 20/03/2015).
IBM (2014). Workforce and customer experience assessment. IBM. URL:
http://ibmtvdemo.edgesuite.net/software/collaboration/workforce-and-custexp-assessment/ (visited
on 20/03/2015).
iGrafx (2014). Elevate your BPM program - what steps are necessary for your organization? iGrafx.
URL: http://igrafx.capability-benchmark.com/assessment.php (visited on 20/03/2015).
Jöreskog, K. and H. Wold (1982). Systems under indirect observation: Causality, structure,
prediction. North Holland.
MacKenzie, S., P. Podsakoff and N. Podsakoff (2011). “Construct measurement and validation
procedures in mis and behavioral research: Integrating new and existing techniques.” MIS
Quarterly 35 (2), 293-334.
Marrone, M. and L. M. Kolbe (2011). “Impact of it service management frameworks on the IT
organization.” Business & Information Systems Engineering 3 (1), 5-18.
Mulaik, S. A. (2010). The foundations of factor analysis (2nd ed.). Boca Raton FL, CRC Press, Taylor
and Francis Group.
NSAfR (2014). Benchmark index retail: Seven steps to business success. National Skills Academy for
Retail. URL: http://retail.virtual-adviser.com/login.php (visited on 20/03/2015).
OCAI (2014). Organizational culture assessment instrument online. Bremer, M., Lamers, M. URL:
http://www.ocai-online.com/ (visited on 20/03/2015).
OGC (2011). ITIL service strategy/ service design/ service transition/ service operation/ continual
service improvement. The Stationary Office for the Office of Government Commerce (OGC).
London.
Paulk, M. C., C. V. Weber, S. M. Garcia, M. B. C. Chrissis and M. Bush (1993). "Key practices of the
capability maturity model version 1.1." Software Engineering Institute, Carnegie Mellon
University, Pittsburgh, Pennsylvania.
Richter, N. F., R. R. Sinkovics, C. M. Ringle and C. Schlaegl (2015). “A critical look at the use of
SEM in international business research.” International Marketing Review, forthcoming.
Rigdon, E. E. (2012). “Rethinking partial least squares path modeling: In praise of simple methods.”
Long Range Planning 45 (5), 341-358.
Ringle, C., M. Sarstedt and D. Straub (2012). “Editor's comments: A critical look at the use of PLS-
SEM in MIS Quarterly.” MIS Quarterly 36 (1), iii-xiv.
Rosemann, M. and T. de Bruin (2005). “Towards a business process management maturity model.” In:
Proceedings of the Thirteenth European Conference on Information Systems (ECIS 2005).
Regensburg, Germany.
Straub, D. and S. Ang (2011). “Editor's comments: Rigor and relevance in IS research: Redefining the
debate and a call for future research.” MIS Quarterly 35 (1), iii-xi.
Temme, D., H. Kreis and L. Hildebrandt (2010). "A comparison of current PLS path modeling
software: Features, ease-of-use, and performance." In: Handbook of partial least squares. Springer.
pp. 737-756.
Tenenhaus, M., V. Vinzi, Y.-M. Chatelin and C. Lauro (2005). “PLS path modeling.” Computational
Statistics & Data Analysis 48 (1), 159-205.
Van De Ven, A. and P. Johnson (2006). “Knowledge for theory and practice.” Academy of
Management Review 31 (4), 802-821.
WMS (2014). World management survey. Bloom, N., Sadun, R., Van Reenen, J. URL:
http://worldmanagementsurvey.org/ (visited on 20/03/2015).
Wulf, J., T. J. Winkler and W. Brenner (2015). “Measuring IT service management capability: Scale
development and empirical validation.” In: Wirtschaftsinformatik (WI 2015) Proceedings.
Osnabrück, Germany. pp. 630-644.