Embed Size (px)
Citation preview

2019 State of the SOX/Internal Controls Market Survey
© 2019 SOX & Internal Controls Professionals Group

TABLE OF CONTENTS
Introduction .................................................................................................................................. 3
Executive Summary ...................................................................................................................... 4
Survey Demographics .................................................................................................................. 5
Complexity of the Process ............................................................................................................ 6
Control Failures ............................................................................................................................ 9
Role of Technology ......................................................................................................................11
Involvement of Internal Audit ........................................................................................................12
Cost of Compliance .....................................................................................................................14
Challenges and Priorities .............................................................................................................16
About Our Survey Sponsors ........................................................................................................18
© 2019 SOX & Internal Controls Professionals Group

2019 State of the SOX/Internal Controls Market Survey 3© 2019 SOX & Internal Controls Professionals Group
Dear Colleagues,
This is the fourth year that the SOX & Internal Controls Professionals Group and Workiva have surveyed the market to assess how companies are managing their Sarbanes-Oxley (SOX) compliance function. Four years ago, our goal was to develop a resource for SOX professionals to benchmark their costs, staffing, and processes. Since then, the State of the SOX/Internal Controls Market Survey has evolved into a leading indicator of best practices and technology trends for the industry.
This year’s survey confirms what we see in the marketplace and hear from SOX professionals every day: they spend an excessive amount of time managing information. The SOX function is complex and inefficient, costs continue to increase, and the tools that the majority of SOX professionals use are tethered to their desktops—spreadsheets, documents, and presentations saved locally to individuals’ computers.
We are also seeing SOX professionals seek out new business intelligence and visualization tools to make SOX management more efficient, accurate, and agile. The number of professionals who report using data analytics and visualization software has doubled, and a small portion of the market has adopted automated controls monitoring. In companies where internal audit manages SOX activities, there is growing demand for SOX compliance management tools that include audit management capabilities.
Manual processes are still a barrier to efficiency. More and more task-specific technologies are converging on desktop computers, but they are not connected. Any gains in efficiency are lost to the manual labor it takes
to reconcile data and information across the entire SOX process. And, while advanced business technology tools are powerful, the benefits only materialize when data and information are connected.
The alternative to a desktop cluttered with individual business application software programs is a centralized, cloud-based platform that connects data, reporting, and compliance; produces documents, spreadsheets, and presentations; automates repeatable processes; and enables simultaneous collaboration. By consolidating information on a single platform, previously disconnected and siloed SOX teams can share data and move at exponential speed with unparalleled clarity.
For internal auditors who also manage the second line of risk management defense—control monitoring and oversight—centralizing data and reporting on a single platform offers additional benefits. It opens the door to tighter coordination and communication with other vital financial areas around the company, including SEC reporting, management reporting, accounting, and others.
The SOX and internal controls market faces the challenges and opportunities of business process transformation and technology disruption. The SOX professional who can meet these challenges will create new opportunities for efficiency, speed, accuracy, and most of all, value across the entire organization.
Sincerely,Hillary Eckert Vice President of Product Marketing Workiva Inc.
INTRODUCTION

2019 State of the SOX/Internal Controls Market Survey 4
For the fourth consecutive year, the SOX & Internal Controls Professionals Group and Workiva surveyed the market for insights about the costs, execution, challenges and priorities of complying with Sarbanes-Oxley.
More than 475 SOX professionals responded to the survey, which was conducted online in the second quarter of 2019. Survey respondents are primarily located in the United States and represent companies in a wide range of industries and sizes, from less than $75 million in annual revenue to more than $5 billion in annual revenue.
This large and diverse group of survey contributors represents various levels of process maturity and complexity and presents a balanced perspective of the current state of SOX and internal controls management.
Due to rounding, numbers presented throughout this document may not add up precisely to totals or percentages provided.
1. SOX professionals continue to rely on desktop software as their primary tool, but it’s not the only technology they use to support SOX compliance. Three-quarters of respondents report that desktop software is the primary technology they use to support the SOX and internal controls process in their organizations. However, more than one-third report the additional use of a SOX-specific tool, which has more than doubled since last year’s survey.
2. Interest in and use of advanced technology in the SOX function has increased. The use of data analytics in the SOX function doubled from last year and more than half of survey respondents are considering the use of continuous controls monitoring (CCM), which automates the monitoring and testing of internal controls.
3. Internal audit’s involvement in SOX and internal controls (SOX/IC) has expanded. In the continuation of a trend, internal audit’s ownership of the SOX/IC compliance function increased. One-third of survey respondents
report that internal audit spends more than half its time on SOX processes.
4. The overall cost of SOX/IC compliance continues to increase. On average, SOX compliance costs rose slightly, and more than half of survey respondents report an increase in external audit fees. Additional PCAOB requirements of public auditors, the adoption of new accounting standards and the demand for internal controls around IT and cybersecurity are among the drivers of external audit fee increases.
5. Cybersecurity and IT controls lead the list of priorities. Cybersecurity and IT controls now lead the list of challenges and priorities identified by survey respondents.
EXECUTIVE SUMMARY
Key findings from the 2019 State of the SOX/Internal Controls Market Survey
© 2019 SOX & Internal Controls Professionals Group

2019 State of the SOX/Internal Controls Market Survey 5
The total number of respondents to the 2019 State of the SOX/Internal Controls Market Survey is 475. The number of respondents who work in organizations that reported more than $2 billion in annual revenue increased to 44% from 35% last year, while 16% of respondents work in organizations that reported less than $75 million in revenue, which declined from 21% last year.
Three-quarters of survey respondents occupy a role that includes the planning and execution of SOX and internal control functions. More than half of the survey respondents identified their title as manager or director, and an additional 14% hold a corporate officer title of vice president or above.
A broad range of industries is represented in the 2019 survey. The most represented industries are financial services and manufacturing.
Survey respondents were polled on which external audit firms their companies use. The Big Four, with their resources, technology, and expertise, dominate this year’s list of external auditors. Additionally, 78% of this year’s respondents were audited by the Big Four.
5% 2%
22%
16%21%
19%
14%
Ernst & Young
KPMG
PwC
Other
Deloitte
Grant Thornton
BDO
What is your organization's last fiscal year revenue?
SURVEY DEMOGRAPHICS
16%
18%
19%
22%
26%
<$75M
$75–$700M
$701M–$2B
$2.1B–$5B
>$5B
What is your organization's last fiscal year revenue?What is your organization’s last fiscal year revenue?
0% 10% 20% 30% 40%
Manager
Director
Staff
Vice president
C-suite (CFO, CCO, etc.)
Contract/in-house
36%
24%
23%
9%
5%
3%
How would you describe your role?How would you describe your role?
Finance, insurance22%
Other14%
Utilities6%
– Public administration
5%
Real estate, rental, leasing –
3%
Wholesale - trade
.6%
- Waste management
.4%
Manufacturing19%
4% - Health care
4% - Mining, quarrying, oil gas
3% - Education
1% - Public administration
3%Transporation, -warehousing
2%Retail trade -
1% - Agriculture, forestry, fishing, hunting
2% - Construction
- Accommodation, food service
2%
4%
Information-
2%
Arts,entertainment,
recreation
-Management of -
companies 1%
In which industry does your company best fit?In which industry does your company best fit?
© 2019 SOX & Internal Controls Professionals Group
2019 State of the SOX/Internal Controls Market Survey 6
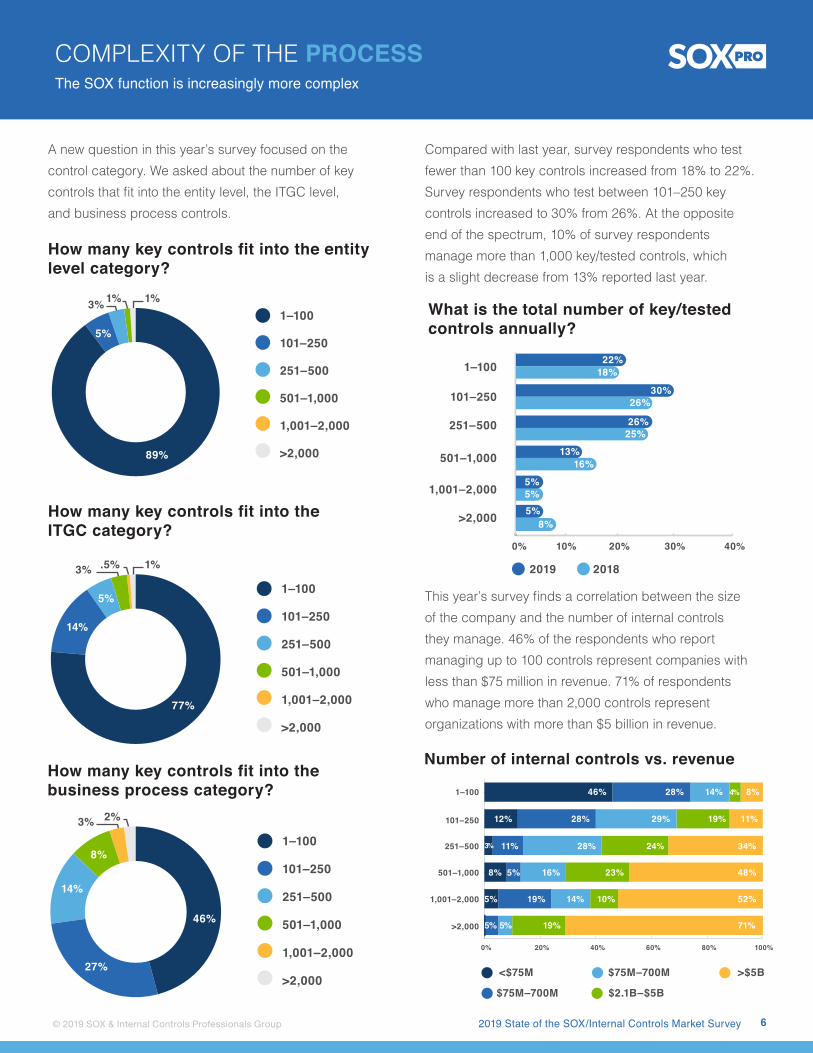
A new question in this year’s survey focused on the control category. We asked about the number of key controls that fit into the entity level, the ITGC level, and business process controls.
Compared with last year, survey respondents who test fewer than 100 key controls increased from 18% to 22%. Survey respondents who test between 101–250 key controls increased to 30% from 26%. At the opposite end of the spectrum, 10% of survey respondents manage more than 1,000 key/tested controls, which is a slight decrease from 13% reported last year.
This year’s survey finds a correlation between the size of the company and the number of internal controls they manage. 46% of the respondents who report managing up to 100 controls represent companies with less than $75 million in revenue. 71% of respondents who manage more than 2,000 controls represent organizations with more than $5 billion in revenue.
COMPLEXITY OF THE PROCESSThe SOX function is increasingly more complex
0% 10% 20% 30% 40%
1–100
101–250
251–500
501–1,000
1,001–2,000
>2,000
22%18%
30%26%
26%25%
13%16%
5%
5%8%
5%
2019 2018
What is the total number of key/tested controls annually? What is the total number of key/tested controls annually?
89%
5%1–100
101–250
251–500
501–1,000
1,001–2,000
>2,000
3% 1% 1%
How many key controls fit into the entity level category?How many key controls fit into the entity level category?
77%
14%
5%1–100
101–250
251–500
501–1,000
1,001–2,000
>2,000
3% .5% 1%
How many key controls fit into the ITGC category?How many key controls fit into the ITGC category?
46%
27%
14%
8%1–100
101–250
251–500
501–1,000
1,001–2,000
>2,000
3% 2%
How many key controls fit into the business process category?How many key controls fit into the business process category?
251–500
101–250
1–100
501–1,000
1,001–2,000
>2,000
<$75M
0% 20% 40% 60% 80% 100%
46%
12% 28% 29% 19% 11%
3% 28%11%
8%
5%
5% 5% 19% 71%
19% 14% 10% 52%
5% 16% 23% 48%
24% 34%
28% 14% 4% 8%
$75M–700M
$75M–700M
$2.1B–$5B
>$5B
Number of internal controls vs. revenueNumber of internal controls vs. revenue
© 2019 SOX & Internal Controls Professionals Group

2019 State of the SOX/Internal Controls Market Survey 7
New in 2019, this year’s survey also focused on control category. We asked respondents about the number of key controls that fit into the entity level, the ITGC level, and business process controls.
The largest correlation between controls and number of locations is in the 2–10 locations category: 44% of survey respondents manage 1–100 controls in 2–10 locations. 48% of survey respondents manage 101–250 controls in 2–10 locations. 41% of survey respondents manage 251–500 controls in 2–10 locations. 39% of survey respondents manage 501–1,000 controls in 2–10 locations. 35% of survey respondents manage 1,001–2,000 controls in 2–10 locations.
Half of survey respondents report an in-house SOX compliance model. 29% of respondents rely on a co-source model, and 5% outsource SOX compliance.
When asked about the in-scope locations, more than half of the respondents reported multiple in-scope locations, both in the United States and internationally. Fewer than 20% of respondents reported a single in-scope location.
Half of all survey respondents reported fewer than 5 people on their SOX testing and validation team. 27% report between 5 and 10 people and 12% report between 11 and 20. 11% of survey respondents report more than 21 people on their SOX testing and validation team.16%
5%
29%
50%
In-house
Co-sourced
N/A–No formal internal audit function
Outsourced
What is your SOX compliance model?What is your SOX compliance model?
COMPLEXITY OF THE PROCESSThe SOX function is increasingly more complex
1–100
101–250
251–500
Con
trol
s
501–1,000
1,001–2,000
>2,000
0% 20% 40% 60% 80% 100%
10% 8% 6%4%28% 44%
15%14% 7%6%10% 48%
17% 10%11%41% 18%
10% 21% 20%10%38%
15% 15%
14% 14%
10% 25%35%
33%10% 24%
3%
5%
2%
Locations
Number of internal controls vs. number of locations
1
2–10
2–10
11–20
51–100
>100
Number of internal controls vs. number of locations
19%
30%
51%
Multiple locations United States and international
Multiple locations United States only
Single location United States only
What are your in-scope locations?What are your in-scope locations?
50%
27%
12%
7%4% <5
5–10
11–20
21–50
>50
What is the size of your SOX testing/validation team?What is the size of your SOX testing/validation team?
© 2019 SOX & Internal Controls Professionals Group

2019 State of the SOX/Internal Controls Market Survey 8
When asked about the number of SOX process and control owners in the organization, there was a fairly even distribution across the ranges provided in the survey. Of those surveyed, 43% report 25 or fewer process and control owners, while 20% report 50–100 process and control owners. 18% report more than 100 process and control owners.
20%
20%23%
19%
18%<10
10–25
26–50
51–100
>100
How many process/control owners are in your organization?How many process and control owners are in your organization?
COMPLEXITY OF THE PROCESSThe SOX function is increasingly more complex
© 2019 SOX & Internal Controls Professionals Group

2019 State of the SOX/Internal Controls Market Survey 9
Overall control deficiencies have not changed since the 2018 State of the SOX/Internal Controls Market Survey. 61% of survey respondents experienced control issues that led to deficiencies, significant deficiencies, or material weaknesses.
48% of survey respondents report identifying more than 25 control deficiencies compared with 2% who reported zero control deficiencies. 34% of survey respondents report between 1–10 control deficiencies, and 16% report between 11–25 deficiencies.
More than half of survey respondents report zero significant deficiencies. 22% report identifying one significant deficiency, 11% report two significant deficiencies, and 14% report three or more significant deficiencies.
CONTROL FAILURESControl deficiencies persist
39%
61%
In the past fiscal year, did you experience any control issues that led to deficiencies, significant deficiencies, or material weaknesses?
Yes
No
In the past fiscal year, did you experience any control issues that led to deficiencies, significant deficiencies, or material weaknesses?
0% 20% 40% 60% 80% 100%
2019 61% yes
2018 61% yes
2017 84% yes
2016 75% yes
Annual ComparisonAnnual comparison of control deficiencies
34%
2%
48%
16%
0
1–10
11–25
25+
How many deficiences were identified?How many deficiencies were identified?
53%
14%
22%
11%
0
1
2
3+
How many significant deficiences were identified?How many significant deficiencies were identified?
© 2019 SOX & Internal Controls Professionals Group

2019 State of the SOX/Internal Controls Market Survey 10
78% of survey respondents report zero material weaknesses. This is in contrast to 18% who report between one and five material weaknesses and 4% who report identifying more than five material weaknesses.
Control deficiencies are costly, both financially and reputationally. Almost one-third of survey respondents report more than $1 million in cumulative dollar impact as a result of control deficiencies. 69% of total survey respondents reported a cumulative financial impact of less than $1 million.
The root causes of control failure are unchanged from the results reported in previous surveys. Improperly performed, enforced, or monitored controls is the leading source of control failure according to 86% of survey respondents. Human error is identified by 61% of survey respondents, and poorly designed controls is cited by 49% as the source of control failure.
78%
4%
18%
0
1–5
5+
How many material weaknesses were identified?How many material weaknesses were identified?
0% 20% 40% 60% 80%
<$1M
$1–5M
$5–10M
>$10M
69%
15%
8%
8%
What was the cumulative dollar impact of the deficiencies?What was the cumulative dollar impact of the deficiencies?
0% 20% 40% 60% 80% 100%
Control not properlyperformed, enforced,
or monitored
Human error
Poor control design
Control was overriddenor circumvented
Unforeseencircumstance
Other
86%
61%
49%
16%
16%
10%
What were some of the causes for control(s) failure?What were some of the causes for control(s) failure?
CONTROL FAILURESControl deficiencies persist
© 2019 SOX & Internal Controls Professionals Group

2019 State of the SOX/Internal Controls Market Survey 11
Oracle, PeopleSoft, and Hyperion are registered trademarks of Oracle and/or its affiliates. SAP is the registered trademark of SAP SE in Germany and in several other countries.
Microsoft Excel and Word are registered trademarks of Microsoft Corporation in the United States and/or other countries.
SOX professionals continue to rely on desktop software as their primary tool, but it is not the only technology they use to support SOX compliance.
73% of survey respondents report using desktop software as a primary tool to support their SOX process. Additionally, the use of SOX-specific software doubled to 34% from 17% of last year’s survey responses. The use of data analytics also doubled to 21% from 10% last year.
The use of GRC-specific software increased to 25% from 14% a year ago, and homegrown systems increased slightly to 11% from 7% last year.
Similarly, some respondents indicated a single ERP system while others use multiple ERP systems. The most common providers are Oracle and SAP.
More than half of survey respondents are considering continuous control monitoring (CCM) for their SOX program to automate compliance and business processes monitoring for errors or fraud. 11% of survey respondents report implementing CCM compared with 5% in last year’s survey.
ROLE OF TECHNOLOGYThe SOX function continues to revolve around desktop software
0% 20% 40% 60% 80%
Desktop tools such as Microsoft Excel®, Word®, etc.
SOX-specificsoftware tool
GRC softwaresolution
Data analytics tool
Homegrownsystem/application
Other
73%
34%
25%
21%
11%
7%
What is the primary technology tool(s) that you utilize to support your SOX/IC process?
What is the primary technology tool(s) that you utilize to support your SOX/IC process?
0% 10% 20% 30% 40%
Oracle®
Other
SAP®
Hyperion®
PeopleSoft®
37%
36%
31%
18%
16%
What ERP systems(s) do you currently use? What ERP system(s) do you
currently use?
0% 20% 40% 60%
No, but we areconsidering it
No, I don’t knowwhat CCM is
Other (please specify)
Yes, we haveimplemented
automation
53%
24%
12%
11%
Do you currently use or have you considered using Continuous Control Monitoring (CCM) within your SOX program?
Do you currently use or have you considered using continuous control monitoring (CCM) within your SOX program?
© 2019 SOX & Internal Controls Professionals Group

2019 State of the SOX/Internal Controls Market Survey 12
A full 80% of survey respondents report that internal audit or a dedicated SOX/IC compliance team is in charge of the SOX compliance in their organizations. This year, 46% of survey respondents reported that internal audit is in charge of managing SOX/IC compliance, a 5% increase from last year.
Additionally, 34% of survey respondents reported a dedicated SOX team owns the compliance function, up from 25% of respondents a year ago. This year’s survey response indicated a decline in the ownership of SOX compliance by financial reporting, legal, and other departments.
2019 2018 2017 2016
0% 5% 10% 15% 20% 25% 30% 35% 40% 45%
Other
Legal/compliance
Internal audit
Financial reporting
Dedicated SOX/ICcompliance team
Four year comparison of who handles SOX/IC Compliance
INVOLVEMENT OF INTERNAL AUDITThe role of internal audit grows
Four-year comparison of who handles SOX/IC compliance
0% 10% 20% 30% 40% 50%
Dedicated SOX/ICcompliance team
Internal audit
Financial reporting
Legal/compliance
Other
2019
46%
34%
13%
4%
2%
What departement is in charge of managing SOX/IC compliance in your organization?What department is in charge of managing SOX/IC compliance in your organization?
© 2019 SOX & Internal Controls Professionals Group

2019 State of the SOX/Internal Controls Market Survey 13
66% of survey respondents report an in-house internal audit model compared with 60% last year. Survey respondents report a slight decrease in the co-sourced to 21% from 22% last year. 8% report an outsourced model compared with 6% last year. 5% of survey respondents reported no formal internal audit function, a decrease from 11% last year.
Internal audit has increased its involvement in the SOX/IC function across the board compared with last year’s survey. More than three-quarters of survey respondents report a steep increase in internal audit involvement in testing and roll forward to 77% from 52%, walkthroughs to 72% from 47%, and issue tracking and reporting to 66% from 46%. Each of these are primary procedures for measuring how well a company manages its internal controls.
Almost one-third of survey respondents report that internal audit spends more than half its time on SOX. In addition to SOX testing, internal audit is responsible for operational audits. 68% of survey respondents conduct fewer than 20 operational audits in a year.
21%
5%
66%8%
Involvement of IA Internal Audit Model
N/A–No formalinternal audit function
Co-sourced
Outsourced
In-house
What is your internal audit model?
0% 20% 40% 50% 60% 80%
Testing androll forward
Walkthroughs
Issue trackingand reporting
Risk assessment
Planning/scoping
Reporting
Controldocumentation
Training
Projectmanagement
77%
72%
66%
63%
61%
60%
56%
34%
33%
How is your internal audit involved with your SOX/IC program?How is your internal audit involved with your SOX/IC program?
0% 10% 20% 30% 40%
<10%
10–25%
26–50%
>50%
15%
25%
29%
31%
What percent of time does Internal Audit spend on SOX? What percent of time does internal audit spend on SOX?
0% 10% 20% 30% 40%
<10%
10–20
21–50
>50
None
39%
29%
16%
11%
4%
In addition to SOX testing, how many operational audits does your organization perform each year?
In addition to SOX testing, how many operational audits does your organization perform each year?
INVOLVEMENT OF INTERNAL AUDITThe role of internal audit grows
© 2019 SOX & Internal Controls Professionals Group

2019 State of the SOX/Internal Controls Market Survey 14
49% of survey respondents report an increase in SOX/IC compliance costs compared with 13% who report a decrease. 39% of survey respondents report a slight increase in overall SOX/IC compliance costs compared with 35% last year, while 10% report a significant increase compared with 11% last year.
Respondents who report slight decreases in SOX/IC compliance costs remained steady at 8%, and 5% report significantly decreased compliance costs, up from 2% last year.
39% of survey respondents report SOX compliance costs remained the same, down from 44% a year ago.
A little more than half of survey respondents spend less than $1 million annually on SOX compliance.
24% of survey respondents spend less than $250,000 annually, a decline from 29% a year ago.
16% of survey respondents spend between $1.01 million and $3 million on SOX/IC compliance, a 2% increase compared with last year.
COST OF COMPLIANCENearly half experienced increases in the cost of SOX/IC compliance
24%
8%
9%
7%
12%
16%
0% 10% 20% 30%
<$250K
$250K–$500K
$501K–$1M
$1.01M–$1.5M
$1.51M–$3M
>$3M
Don’t know
2019 2018
29%24%
14%
11%
6%
8%
7%
25%
Annual spend for SOX/IC complaince Annual spend for SOX/IC compliance
0% 10% 20% 30% 40% 50%
2019 2018
39%Increasedslightly 35%
Decreasedslightly
8%8%
10%Increasedsignificantly 11%
2%5%Decreased
significantly
Remainedthe same 44%
39%
What change did you experience in your overall SOX/IC compliance assessment costs?
What change did you experience in your overall SOX/IC compliance assessment costs?
© 2019 SOX & Internal Controls Professionals Group

2019 State of the SOX/Internal Controls Market Survey 15
Half of survey respondents report an increase in external audit fees. Industry trends that contribute to higher external audit fees include the adoption of new accounting standards and requests from the Public Company Accounting Oversight Board (PCAOB) for additional documentation.
No change in external audit fees
Increase in external audit fees
Decrease in external audit fees
41%
50%
9%
What change did you experience in your external audit fees?What change did you experience in your external audit fees?
COST OF COMPLIANCENearly half experienced increases in the cost of SOX/IC compliance
© 2019 SOX & Internal Controls Professionals Group

2019 State of the SOX/Internal Controls Market Survey 16
The top three challenges reported by survey respondents in 2019 are unchanged from 2018. The demands of identifying internal controls to address cybersecurity and information technology leads the list of challenges identified by survey respondents, unchanged from a year ago. Managing changes in accounting policy and the meeting the challenging requirements from external audit each rank next in order, though they are separated by a small margin.
CHALLENGES AND PRIORITIESSOX professionals rank their challenges and priorities
© 2019 SOX & Internal Controls Professionals Group
What are the most significant SOX/IC compliance challenges that your organization expects for the year ahead? On a scale of 1–9, with 1 being most important.
Challenge Ranking Average ranking
Focus on cyber and IT controls 1 3.50
Change in accounting policy (revenue recognition, lease accounting, and tax) 2 4.72
Changing requirements from external audit 3 4.74
Increased focus on risk management 4 4.82
Replacement of legacy technology 5 4.84
Shortage of skilled resources 6 4.91
Cost of resources 7 5.09
Control language is dated or obsolete 8 5.87
Insufficient support from management 9 6.5

2019 State of the SOX/Internal Controls Market Survey 17
The top three priorities remain consistent compared with last year’s survey, though in a different order. The demands of identifying internal controls to address cybersecurity and information technology leads the list of priorities identified by survey respondents. Complying with SOX and other regulators is ranked second this year from third last year. Improving the efficiency of the SOX function remains a top priority in third place.
CHALLENGES AND PRIORITIESSOX professionals rank their challenges and priorities
What are your organization’s top priorities for the year? On a scale of 1–10, with 1 being most important.
Priority Ranking Average ranking
Increasing focus on cyber security and IT controls 1 4.57
Ensure compliance with SOX and other regulators 2 4.68
Improve efficiency of the SOX function 3 4.75
Perform control optimization 4 4.88
Identify control requirements for new accounting policies (revenue recognition, lease accounting, and tax) 5 5.69
Build on talent and skills 6 5.8
Manage or maintain the cost of compliance 7 5.94
Reduce/enhance organization’s risk management capabilities 8 6.15
Strengthen organizational relationships (audit committee, board, external auditors, management, etc.) 9 6.24
Replace legacy technology with new systems 10 6.3
© 2019 SOX & Internal Controls Professionals Group

2019 State of the SOX/Internal Controls Market Survey 18
About the SOX & Internal Controls Professionals Group
The SOX & Internal Controls Professional Group is a community of professionals who are actively involved with the SOX, internal control, and internal audit processes. The group’s members are involved in documenting, evaluating and testing internal controls and processes.
The SOX group fosters networking, promotes thought leadership, and provides opportunities for members to share best practices. There is no cost to join and membership provides access to a network of like-minded professionals while helping them increase their value and influence across their organizations.
Visit soxprofessionalsgroup.org for more information.
About Workiva
Workiva, the leading cloud provider of connected reporting and compliance solutions, is used by thousands of enterprises across 180 countries, including more than 75 percent of Fortune 500® companies, and by government agencies. Our customers have linked over five billion data elements to trust their data, reduce risk, and save time. For more information about Workiva (NYSE:WK), please visit workiva.com.
ABOUT OUR SURVEY SPONSORS
© 2019 SOX & Internal Controls Professionals Group