Embed Size (px)
Citation preview

1
ANALYSIS OF A MEASURE OF FUNCTIONAL COGNITION FOR PERSONS WITH STROKE
By
KATHLEEN ANN BERGER
A DISSERTATION PRESENTED TO THE GRADUATE SCHOOL OF THE UNIVERSITY OF FLORIDA IN PARTIAL FULFILLMENT
OF THE REQUIREMENTS FOR THE DEGREE OF DOCTOR OF PHILOSOPHY
UNIVERSITY OF FLORIDA
2013

2
© 2013 Kathleen Ann Berger

3
To my mom and dad
4
ACKNOWLEDGEMENTS
There are many, many people who have supported me through the graduate
school journey. First I would like recognize my chair and mentor, Craig Velozo for
introducing me to Rasch analysis and maintaining a sense of calm when I really needed
it. He teaches by example, with integrity and a very strong work ethic. I am very lucky
to have had him as a mentor. Thank you, Dr. Velozo. Next, I would like to thank my
committee members: Roxanna Bendixen, Shelley Heaton and Michael Marsiske for
their expertise and support. Thanks to Roxanna for her insights and support through
the writing process. Roxanna was always willing to lend an ear. Shelley Heaton for her
help navigating the world of neuropsycholgocial assessment and her willingness to scan
some much needed documents for me. To Michael Mariske who taught me through
three great statistics courses. I have really appreciated his humor and his willingness to
serve on my committee among the gazillion he serves on. It has served me well.
Beyond my academic support system, I need to recognize my family, friends and
colleagues at Kris' Camp. Thanks to Michelle Welde Hardy whose energy, integrity and
confidence in our work has fed my journey. Also, to the many therapists, coworkers and
families who have similarly shared in my passion. It has truly been a group effort.
Lastly, thanks to Kris, Chelsea and Kevy who have been a huge source of inspiration,
support and encouragement.
5
TABLE OF CONTENTS
Page
ACKNOWLEDGEMENTS ............................................................................................... 4
LIST OF TABLES ............................................................................................................ 8
LIST OF FIGURES .......................................................................................................... 9
LIST OF ABBREVIATIONS ........................................................................................... 10
ABSTRACT ................................................................................................................... 11
CHAPTER
1 ANALSYIS OF A MEASURE OF FUNCTIONAL COGNITION FOR PERSONS WITH STROKE ....................................................................................................... 13
1.1 Classical Test Theory ....................................................................................... 14 1.2 Modern Test Theory .......................................................................................... 16 1.3 Value added benefit of MTT .............................................................................. 18
1.3.1 1) Difficulty with comparison across different assessments of a similar construct ................................................................................... 18
1.3.2 2) Long tests that may contain redundant items .................................. 19 1.3.3 3) Assessments that are sample and item dependent ......................... 20 1.3.4 4) Assessments that do not achieve the objective measurement
principle of equal interval scaling. ........................................................ 22 1.4 IRT informing theory and practice: .................................................................... 23
1.5 Conclusion ........................................................................................................ 24
2 A MEASURE OF FUNCTIONAL COGNITION OF STROKE: ASSESSING DIMENSIONALITY ................................................................................................. 27
2.1 Methods ............................................................................................................ 30 2.1.1 Instrumentation .................................................................................... 30
2.1.2 Participants .......................................................................................... 31 2.2 Data Analysis .................................................................................................... 32
2.2.1 Unidimensionality ................................................................................. 32 2.2.2 Subject to item ratio and item parceling ............................................... 33
2.2.3 Dimensionality Analysis ....................................................................... 33 2.3 Results .............................................................................................................. 34
2.3.1 Exploratory Factor Analysis ................................................................. 34 2.3.2 Principle Components Analysis on Residuals ...................................... 36
2.4 Discussion ........................................................................................................ 37
2.5 Conclusion ........................................................................................................ 39
3 MEASURE OF FUNCTIONAL COGNITION IN STROKE: RASCH ANALYSIS ...... 44

6
3.1 Methods ............................................................................................................ 45
3.1.1 Participants .......................................................................................... 45 3.1.2 Instrumentation .................................................................................... 46
3.2 Administration procedures ................................................................................ 47 3.3 Data analysis .................................................................................................... 47
3.3.1 Unidimensionality ................................................................................. 47 3.3.2 Rasch Analysis .................................................................................... 48
3.4 Results .............................................................................................................. 49
3.4.1 Language ............................................................................................. 50 3.4.2 Item Person Map ................................................................................. 50 3.4.3 Reading & Writing ................................................................................ 51 3.4.4 Item Person Map ................................................................................. 51 3.4.5 Numerical Calculation .......................................................................... 51
3.4.6 Item Person Map ................................................................................. 51 3.4.7 Limb Praxis .......................................................................................... 52
3.4.8 Item Person Map ................................................................................. 52
3.4.9 Visuospatial ......................................................................................... 52 3.4.10 Item Person Map ................................................................................. 53 3.4.11 Social Use of Language ....................................................................... 53
3.4.12 Item Person Map ................................................................................. 54 3.4.13 Emotional Function .............................................................................. 54
3.4.14 Item Person Map ................................................................................. 54 3.4.15 Attention............................................................................................... 55 3.4.16 Item Person Map ................................................................................. 55
3.4.17 Executive Function .............................................................................. 55 3.4.18 Item Person Map ................................................................................. 56
3.4.19 Memory ................................................................................................ 56 3.4.20 Item Person Map ................................................................................. 56
3.4.21 Person misfit ........................................................................................ 57 3.5 Discussion ........................................................................................................ 57
3.5.1 Item Misfit ............................................................................................ 58
3.5.2 Person Misfit ........................................................................................ 59 3.5.3 Conclusion ........................................................................................... 60
4 A VALIDITY STUDY OF A MEASURE OF FUNCTIONAL COGNITION FOR PERSONS WITH STROKE .................................................................................... 75
4.1 Methods ............................................................................................................ 76
4.1.1 Participants .......................................................................................... 76
4.1.2 Instrumentation .................................................................................... 77 4.1.2.1 The MFC-S ........................................................................... 77 4.1.2.2 Repeatable Battery for the Assessment of
Neuropsychological Status (RBANS)72 ................................. 77 4.1.2.3 Digit Symbol-Coding ............................................................. 78 4.1.2.4 Behavior Rating Inventory of Executive Functions –Adult
(BRIEF) ................................................................................ 78
7
4.1.2.5 Functional Assessment of Communication Skills for Adults (ASHA-FACS)30 .................................................................... 79
4.1.2.6 Center for Epidemiologic Studies – Depression Scale (CES-D) ................................................................................ 79
4.1.2.7 Wechsler Individual Achievement Tests (WIAT-II)79 ............. 79 4.1.2.8 Trails A & B........................................................................... 79 4.1.2.9 Delis Kaplan Executive Functions Scale (D-KEFS) Sorting
Test20 .................................................................................... 80
4.1.2.10 Mini - Florida Apraxia Battery (Mini-FAB) ............................. 80 4.1.3 Administration Procedure..................................................................... 81 4.1.4 Data Analysis ....................................................................................... 81
4.2 Results .............................................................................................................. 82 4.2.1 Correlation with concurrent measures ................................................. 82
4.2.2 Profile Analysis .................................................................................... 82 4.2.3 Logistic regression ............................................................................... 83
4.3 Discussion ........................................................................................................ 83
4.4 Conclusion ........................................................................................................ 85
5 SUMMARY AND CONCLUSION ............................................................................ 95
5.1 Summary .......................................................................................................... 95
5.2 Conclusion ........................................................................................................ 97 APPENDIX
A PARTICIPANT CHARACTERISTICS ..................................................................... 99
B PATTERN MATRIX RETAINING FOUR FACTORS ............................................. 101
C PATTERN MATRIX RETAINING FIVE FACTORS ............................................... 102
D SECONDARY DIMENSION AFTER REMOVING PRIMARY RASCH DIMENSION ......................................................................................................... 103
E MFC-STROKE PAPER AND PENCIL FIELD TEST ITEM POOL FOR PATIENT 106
LIST OF REFERENCES ............................................................................................. 120
BIOGRAPHICAL SKETCH .......................................................................................... 127

8
LIST OF TABLES
Table Page 2-1 Pattern matrix for 10-factor solution .................................................................... 41
2-2 Higher order ‘G’ factor ........................................................................................ 42
2-3 Summary of PCA of standardized residuals ....................................................... 43
3-1 Summary of Rasch psychometrics for MFC-S .................................................... 61
3-2 Misfitting person demographics .......................................................................... 63
3-3 Reverse coding items ......................................................................................... 64
4-1 Participant characteristics ................................................................................... 86
4-2 Neuropsychological measures and associated MFC-S domain ......................... 89
4-3 MFC-S Domain correlations with neuropsychological measures ........................ 90
4-4 Regression coefficients for binary logistic model predicting left or right CVA ..... 92
4-5 Model classification of right or left CVA .............................................................. 93
9
LIST OF FIGURES
Figure Page 1-1 Two item characteristic curves with differing item discrimination ........................ 25
1-2 Interval and ordinal scale examples ................................................................... 26
1-3 Item characteristic curve ..................................................................................... 26
3-1 Language person item map ................................................................................ 65
3-2 Reading and writing person item map ................................................................ 66
3-3 Numerical calculation person item map .............................................................. 67
3-4 Limb praxis person item map.............................................................................. 68
3-5 Visuospatial person item map............................................................................. 69
3-6 Social language person item map ...................................................................... 70
3-7 Emotional function person item map .................................................................. 71
3-8 Attention person item map .................................................................................. 72
3-9 Executive function person item map ................................................................... 73
3-10 Memory person item map ................................................................................... 74
4-1 Left vs. right comparison profile .......................................................................... 94
10
LIST OF ABBREVIATIONS
ACS Applied Cognition Scale
CTT Classical Test Theory
CVA Cerebral Vascular Accident
FIM Functional Independence Measure
ICC Item Characteristic Curve
IRT Item Response Theory
LSAT LAW SCHOOL ACHIEVEMENT TEST
MFC-S A Measure of Functional Cognition for Persons with Stroke
MTT Modern Test Theory
RBMT Rivermead Behavioral Memory Test
11
Abstract of Dissertation Presented to the Graduate School of the University of Florida in Partial Fulfillment of the Requirements for the Degree of Doctor of Philosophy
ANALYSIS OF A MEASURE OF FUNCTIONAL COGNITION FOR PERSONS WITH
STROKE By
Kathleen Ann Berger
August 2013
Chair: Craig Velozo Major: Rehabilitation Science
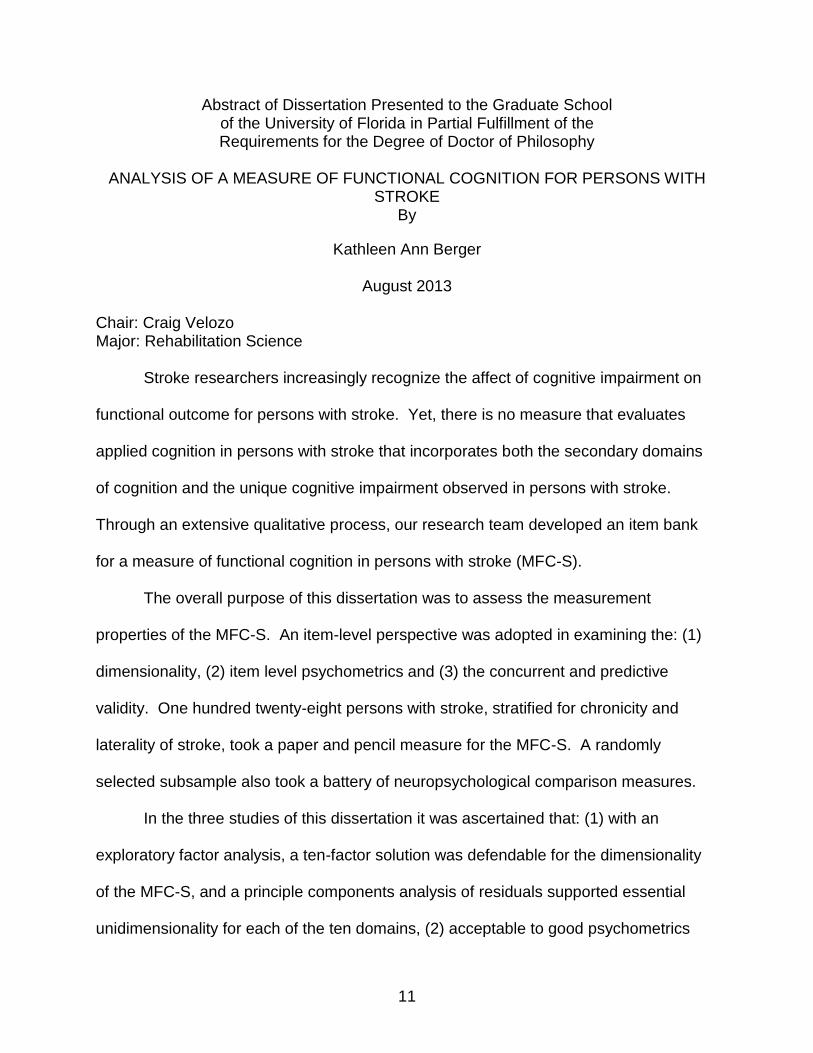
Stroke researchers increasingly recognize the affect of cognitive impairment on
functional outcome for persons with stroke. Yet, there is no measure that evaluates
applied cognition in persons with stroke that incorporates both the secondary domains
of cognition and the unique cognitive impairment observed in persons with stroke.
Through an extensive qualitative process, our research team developed an item bank
for a measure of functional cognition in persons with stroke (MFC-S).
The overall purpose of this dissertation was to assess the measurement
properties of the MFC-S. An item-level perspective was adopted in examining the: (1)
dimensionality, (2) item level psychometrics and (3) the concurrent and predictive
validity. One hundred twenty-eight persons with stroke, stratified for chronicity and
laterality of stroke, took a paper and pencil measure for the MFC-S. A randomly
selected subsample also took a battery of neuropsychological comparison measures.
In the three studies of this dissertation it was ascertained that: (1) with an
exploratory factor analysis, a ten-factor solution was defendable for the dimensionality
of the MFC-S, and a principle components analysis of residuals supported essential
unidimensionality for each of the ten domains, (2) acceptable to good psychometrics
12
with nine out of ten domains separating persons into at least two distinct groups, and (3)
concurrent validity was supported by moderate to strong correlations with existing
comparable measures but weak associations with more fundamental performance
based measures. Predictive validity was somewhat supported by predicting side of
stroke in a profile analysis, but the language domain prediction was contrary to what we
might have expected. That is, persons with higher language ability were more likely to
have had a left cerebral vascular accident.

13
CHAPTER 1 ANALSYIS OF A MEASURE OF FUNCTIONAL COGNITION FOR PERSONS WITH
STROKE
In order to move rehabilitation science forward and evaluate therapeutic
interventions, investigators need to be able to compare outcomes between studies,
facilities and therapists. Yet, although rehabilitation clinicians are encouraged,,48, 76
even required, to use standardized outcome measures when evaluating clients, the
number of clinicians who use standardized measures are limited.41 In addition to lack of
time, clinicians have reported a lack of familiarity or ‘know how’ with outcomes
assessment. Further, while clinicians agree that standardized assessments are
important to administrative and payor decisions, they rarely inform immediate treatment
decisions.84 For example, the Functional Independence Measure (FIMTM)44 is an
assessment currently used on admission and discharge at many rehabilitation settings
to evaluate functional independence. Yet, obtaining a score on the motor portion of the
FIM will not inform the clinician beyond the qualitative judgment that she requires
minimal assistance for grooming. Assessments that are informative and efficient would
facilitate use by clinicians. In fact, some health outcomes investigators cite advantages
in efficiently informing therapeutic treatment plans as an asset of measures created
using modern test theory (MTT) procedures.84
Measure development procedures currently fall into two categories - classical
test theory (CTT), and modern test theory (MTT). While many currently available
assessments have been developed using CTT, many health outcomes researchers
have turned to modern test theory (MTT) procedures to optimize scale development.83
Two primary advantages to using MTT developed assessments include: optimized
ability to compare scores across studies, facilities and therapists; and improved ability to

14
inform theory development. For example, many assessments available to clinicians and
researchers were created using CTT,21 which use standardization to compare persons.
However, scores from standardized assessments cannot be easily compared across
studies, as standardized scores are sample and test dependent. Scales developed with
MTT address concerns of study comparison and are considered sample and test
independent.
This paper reviews key concepts of classical and modern test theory,
emphasizing the value added benefit of MTT. More specifically, MTT investigators cite
improved efficiency, equal interval measurement and theory development as key
advantages of MTT developed measures.92
1.1 Classical Test Theory
CTT encompasses a set of concepts and statistical procedures that are the
foundation for numerous assessment tools. Classical test theory proposes that a
person’s score on an assessment result from the combination of their ‘true score’ on the
measured construct, and measurement error, represented in the equation:
X1 = TX + E1, (1-1)
Where X1 is the observed score on an assessment, which is the sum of the true score
and the error associated with the measure. Error may include things such as noise in
the environment, misunderstanding a question or variance in the manner a person
administers a test. Assessments developed using CTT focus on reducing the
measurement error, so that the observed score approximates the true score as close as
possible.
The primary challenge in CTT is that the true score is unobservable. DeVellis
(2006) summarizes CTT assumptions that address this: 1) the set of items comprising
15
an assessment should represent one construct; 2) items should equivalently represent
the construct; and 3) items that highly correlate with each other are thought discriminate
better on the given construct. Though this suggests that CTT focuses on item
properties, in practice CTT focuses on scale properties. That is, how well does a set of
items represent a true score?
To resolve this, CTT assumes items are strictly parallel. That is, that the set of
items are unidimensional; they represent one underlying construct. Additionally, each
item covaries equivalently with the construct. Put differently, each item is an equally
good indicator of the construct. Then, if the error associated with an item is
independent of the construct, items’ covariation with each other represents their
common association with the underlying construct. This association is called reliability.
Though these assumptions are strict, and thus unrealistic, other models exist that relax
these assumptions but support estimation of scale reliability with item correlation.6
The statistic Cronbach’s alpha5 indicates a scale’s reliability, and increases as
intercorrelations between items increase. Thus, Cronbach’s alpha evaluates how a
scale of items represents the construct it intends to measure. Cronbach’s alpha
includes the number of items in a scale as well as the correlations of these items. But,
because it is often easier to increase the number of items than increase the correlation
of items, the easiest way to increase scale reliability is to increase the items, increasing
test length.
Advantages of using CTT include: 1) familiarity to investigators, 2) easy access
to statistical packages needed to perform the procedures such as calculating
Cronbach’s alpha, and 3) using a sum score from an assessment, which includes a

16
variety of items that represent a construct, can attenuate errors associated with one
particular item. However, disadvantages include: 1) difficulty with comparison across
different assessments of a similar construct; 2) long tests that may contain redundant
items; 3) assessments that are sample and item dependent; and 4) assessments that
do not achieve the objective measurement principle of equal interval scaling. These
challenges and how MTT addresses them are detailed below.
1.2 Modern Test Theory
Rehabilitation outcomes researchers increasingly use modern test theory
methods to create measurement scales.14, 83 Item response theory (IRT), the statistical
analysis procedures used in MTT, focuses on item level statistics, in contrast with CTT
focus on scale level psychometrics. IRT scales, similar to CTT scales, assume
unidimensionality. MTT developers suggest the inclusion of easy items and hard
items,61 representing the breadth of a construct. For example, in a test for fear of falling
in the elderly, Velozo and Peterson (2001)82 hypothesized that “Getting out of bed”
would be an easy item and “Walking outside on icy surfaces” would be a difficult item.
In this manner, items used represent a range of a trait. Person ability is measured
based on how a person responds to an item. On a fear of falling scale, a person who
has high fear would be more likely to report feeling fearful when getting out of bed, as
compared to someone with little fear of falling.
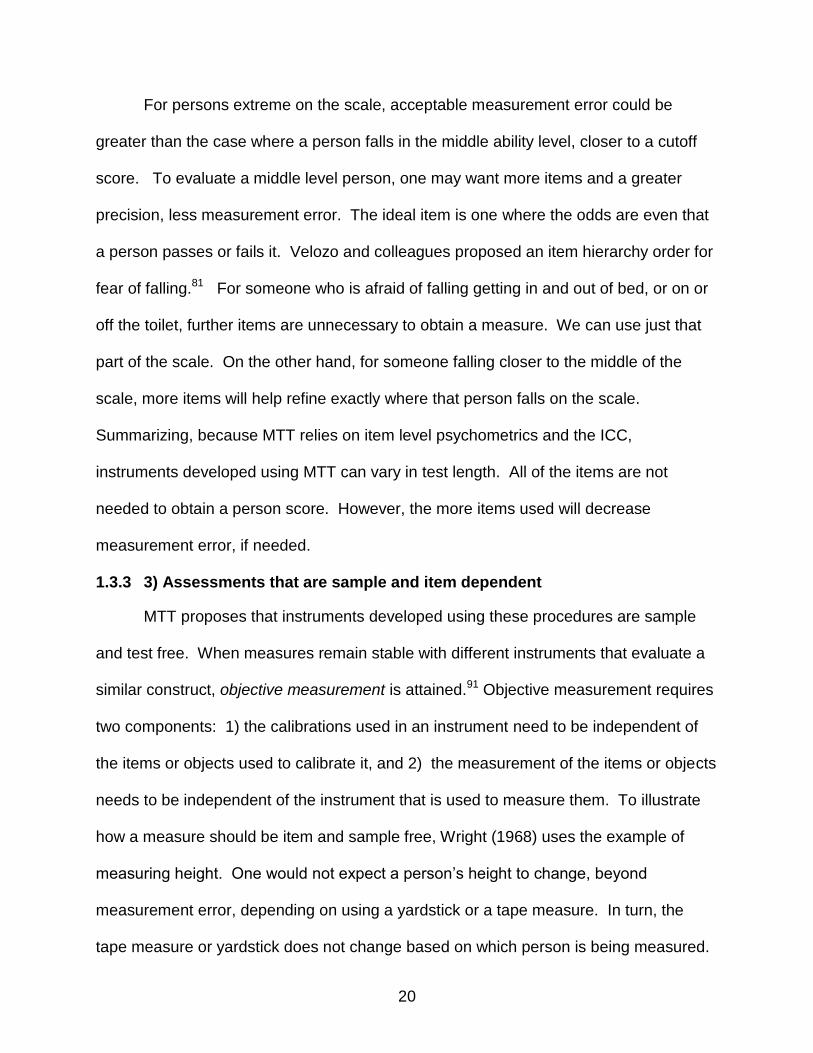
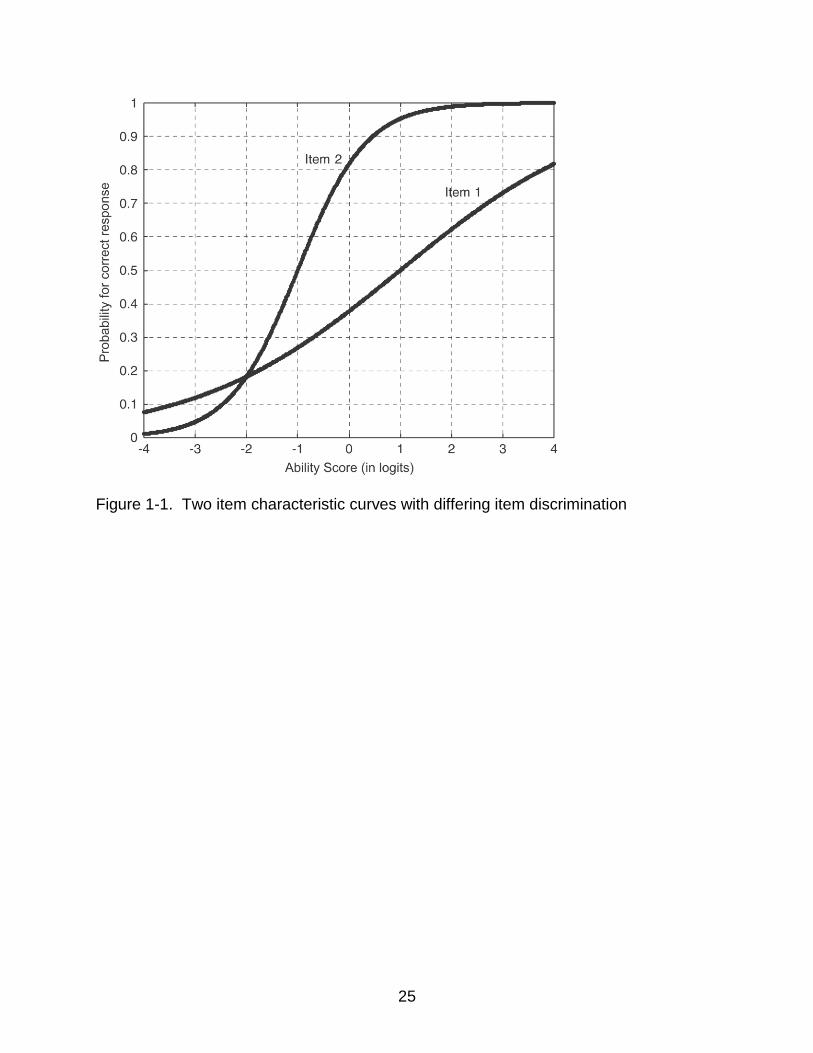
Further, while all IRT models estimate item difficulty, two-parameter models also
estimate item discrimination and three-parameter models add an estimate of guessing.
Person ability for the construct is measured according to the response on an item and
how difficult that item is or how well the item discriminates on the latent trait. For
example, a person who has a higher level of ability would be more likely to pass a more
17
difficult item. Figure 1-1, below, presents two items with differing discrimination
parameters. The slope at the level of item difficulty represents the item discrimination
parameter. Items with steeper slopes discriminate persons better on the measured trait.
Many rehabilitation research investigators use the one-parameter model, also
called the Rasch model to create scales. The Rasch model assumes that a person’s
response to an item is a function of person ability and item difficulty. Scale measures
are log transformed and converted to logits (log odds units), which is an interval scale.8
Rasch model proponents propose that equal interval measures are a key advantage of
the Rasch model. The equal interval property of the one parameter IRT model is lost
with further parameter estimation.91
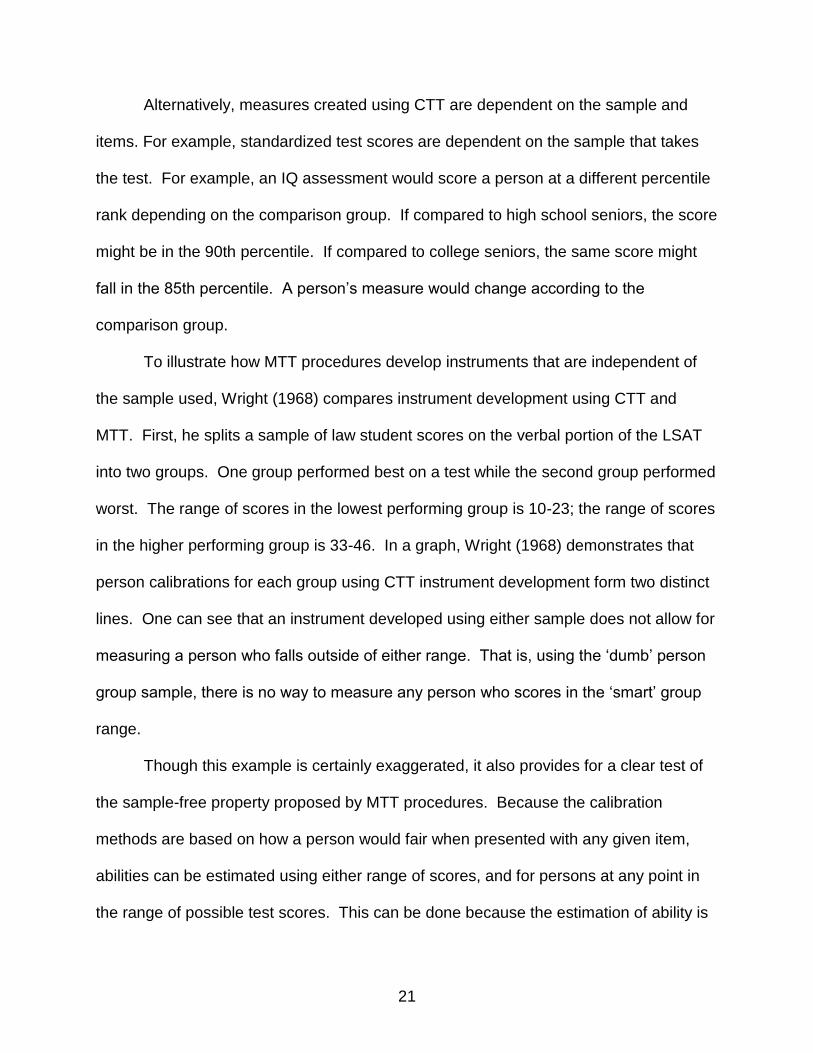
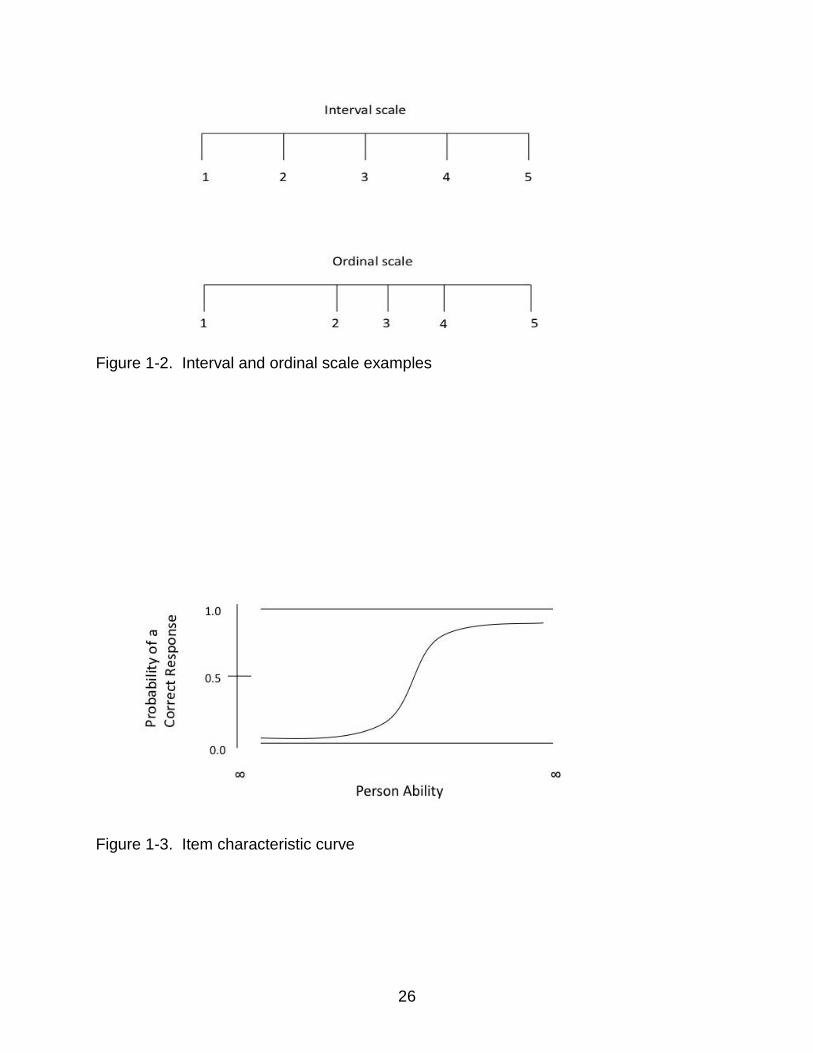
Equal intervals allow for arithmetic functions such as addition and subtraction.
Thus, as shown in figure 1-2, a ‘3’ is exactly 2 more than a 1 on the interval scale.
Alternatively, ordinal scale steps are not equivalent which makes it more difficult to
interpret if an investigator seeks to determine health care intervention efficacy. For
example, looking at the ordinal scale below, a person improving from 1 to a 2 would
improve more than a person improving from 2 to 3. Yet, measuring on the ordinal scale,
each person would improve one unit. Alternatively, using the interval scale, a person
improving from 1 to a 2 would improve equivalently to a person improving from 2 to 3.
Also, a person improving two units demonstrates 2 times the improvement of a person
improving 1 unit.
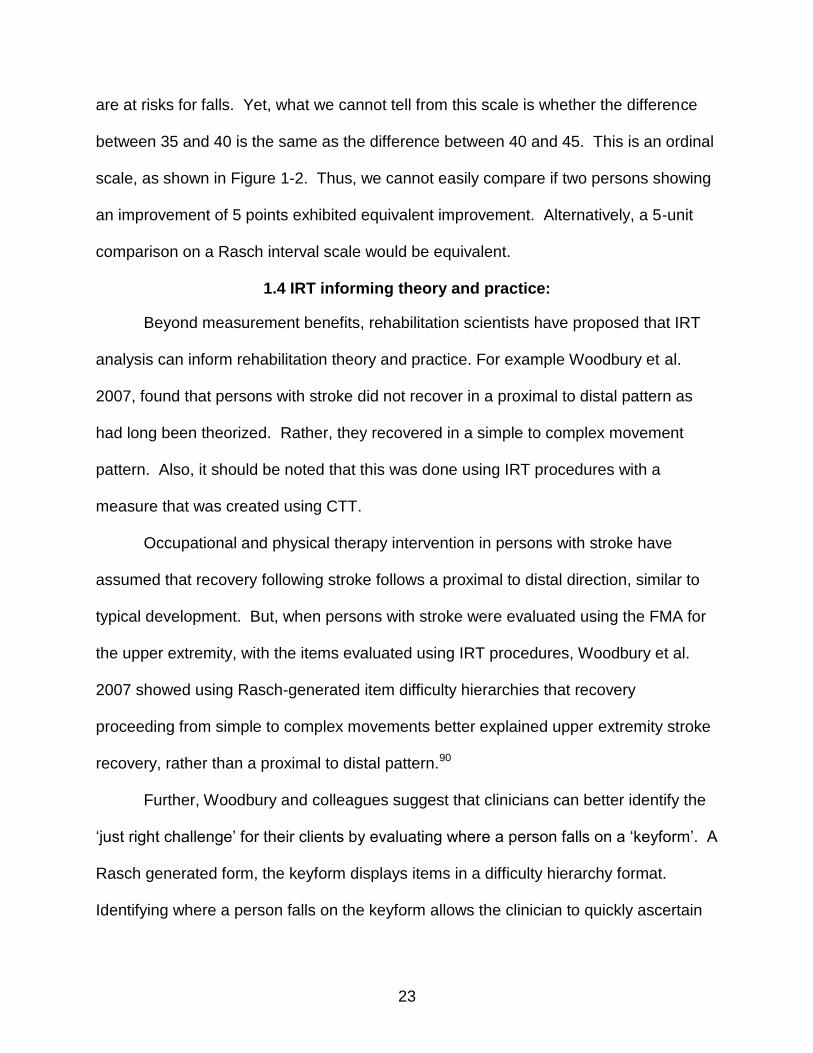
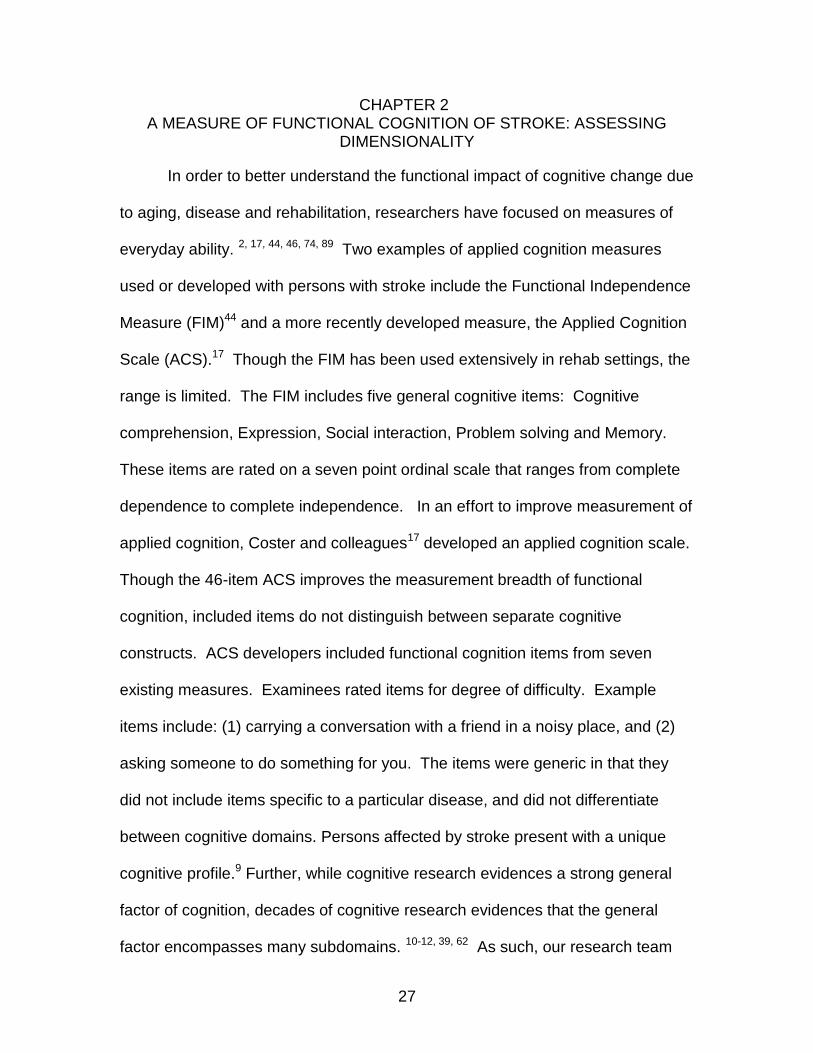
The item characteristic curve (ICC), shown in figure 1-3 below, illustrates the
core concept of IRT – that person ability is a function of an item’s difficulty, and
18
discrimination. The probability that a person passes an item increases as they have a
higher amount of ability.
Though CTT and MTT both assume that created outcomes assessment measure
one primary construct, the procedures used in MTT address measurement challenges
seen in CTT measures. Below, we discuss how IRT analyses address four challenges
of CTT. Lastly, we describe how IRT measures have informed theory and practice in
upper extremity stroke rehabilitation.
1.3 Value added benefit of MTT
1.3.1 1) Difficulty with comparison across different assessments of a similar construct
CTT measures typically produce a score. For example, the FIM44 produces a
score of 18 to 126 based on ratings of assistance needed to perform eighteen functional
motor and cognitive tasks, (bathing, grooming or memory, e.g.). Similar to the cognitive
portion of the FIM, the Rivermead Behavioral Memory Test (RBMT)89 contains items to
assess functional memory. However, though these tests provide norms and
standardized scores for comparison, these scores are sample dependent, which makes
it challenging to compare across groups and studies. Standardization is dependent on
sample heterogeneity and thus can change between samples.
Though procedures do exist that could allow for comparison between scores
obtained on instruments developed using CTT such as effect size,43 MTT procedures
make these comparisons in a more straightforward manner. Specifically, IRT linking
procedures put different measurement scales on a common metric,17, 34, 81 and MTT
measures possess sample and item free properties. A more detailed explanation of the
19
property of sample and item independence is addressed in the sample and test free
property of MTT below.
1.3.2 2) Long tests that may contain redundant items
One way CTT increases the precision of measures is by adding items.21 In CTT
errors associated with items are assumed random, errors can affect a score in either
direction and thus cancel each other out, with a mean of zero. The law of large
numbers theorem demonstrates that, for a random distribution, as the number of
variables or items increases, the sample mean approaches the true mean. Increased
items then decreases the error associated with a score, as the sample error approaches
the true population mean of zero. However, adding items also increase the time
needed to complete the test, and redundant items may create superficial precision.
Alternatively, instruments developed with MTT do not need all items to determine
a person score. Each item has a difficulty ‘level’. A person with higher ability has a
higher probability of passing a more difficult item. If a person passes an item at the
middle of the scale, presenting items at the lower end of the scale is unnecessary.
Further, many measures assess a need, or a diagnosis and have a cutoff score. For
those persons extreme on the scale, only a few items might be needed to ascertain that
a person’s ability is at the extreme low or high part of a scale. They either do or do not
meet a certain cutoff. For example, the Berg Balance Scale5 measures functional
balance ability. Persons scoring less than a 45 have been found to be at risk for falling.
Using MTT, a person passing the higher items of standing on one foot or standing with
one foot out in front, would not need to pass the easier items, such as standing
unsupported.
20
For persons extreme on the scale, acceptable measurement error could be
greater than the case where a person falls in the middle ability level, closer to a cutoff
score. To evaluate a middle level person, one may want more items and a greater
precision, less measurement error. The ideal item is one where the odds are even that
a person passes or fails it. Velozo and colleagues proposed an item hierarchy order for
fear of falling.81 For someone who is afraid of falling getting in and out of bed, or on or
off the toilet, further items are unnecessary to obtain a measure. We can use just that
part of the scale. On the other hand, for someone falling closer to the middle of the
scale, more items will help refine exactly where that person falls on the scale.
Summarizing, because MTT relies on item level psychometrics and the ICC,
instruments developed using MTT can vary in test length. All of the items are not
needed to obtain a person score. However, the more items used will decrease
measurement error, if needed.
1.3.3 3) Assessments that are sample and item dependent
MTT proposes that instruments developed using these procedures are sample
and test free. When measures remain stable with different instruments that evaluate a
similar construct, objective measurement is attained.91 Objective measurement requires
two components: 1) the calibrations used in an instrument need to be independent of
the items or objects used to calibrate it, and 2) the measurement of the items or objects
needs to be independent of the instrument that is used to measure them. To illustrate
how a measure should be item and sample free, Wright (1968) uses the example of
measuring height. One would not expect a person’s height to change, beyond
measurement error, depending on using a yardstick or a tape measure. In turn, the
tape measure or yardstick does not change based on which person is being measured.
21
Alternatively, measures created using CTT are dependent on the sample and
items. For example, standardized test scores are dependent on the sample that takes
the test. For example, an IQ assessment would score a person at a different percentile
rank depending on the comparison group. If compared to high school seniors, the score
might be in the 90th percentile. If compared to college seniors, the same score might
fall in the 85th percentile. A person’s measure would change according to the
comparison group.
To illustrate how MTT procedures develop instruments that are independent of
the sample used, Wright (1968) compares instrument development using CTT and
MTT. First, he splits a sample of law student scores on the verbal portion of the LSAT
into two groups. One group performed best on a test while the second group performed
worst. The range of scores in the lowest performing group is 10-23; the range of scores
in the higher performing group is 33-46. In a graph, Wright (1968) demonstrates that
person calibrations for each group using CTT instrument development form two distinct
lines. One can see that an instrument developed using either sample does not allow for
measuring a person who falls outside of either range. That is, using the ‘dumb’ person
group sample, there is no way to measure any person who scores in the ‘smart’ group
range.
Though this example is certainly exaggerated, it also provides for a clear test of
the sample-free property proposed by MTT procedures. Because the calibration
methods are based on how a person would fair when presented with any given item,
abilities can be estimated using either range of scores, and for persons at any point in
the range of possible test scores. This can be done because the estimation of ability is

22
based on what the probability is that a person with a certain amount of ability would
‘pass’ an item, given its difficulty level. That is, a person with a high ability level would
be more likely to pass a more difficult item. Moreover, comparing calibrations based on
the two groups, the person ability calibrations are almost identical when MTT calibration
procedures are used. So, the using MTT calibrations, it doesn’t matter which sample
is used. In other words, a measure created using MTT calibration procedures is
sample free.
While the above discussion addresses how MTT calibrations create measures
that are independent of the sample, MTT also proposes that the instruments are test
free. That is, they are not dependent on the specific items used to create the measure.
Using the same law student sample, to illustrate test independence, in MTT, Wright
(1968) splits the test questions into two groups: one made up of the easier items and
one made up of the harder items.
If person ability measures developed using MTT procedures are statistically
equivalent, the mean of the standardized difference should be 0, with a standard
deviation of 1. Examining the second part of Table 1-1, where the log ability
transformations are noted, we can see that the difference in ability measures for a
person on the two different tests are essentially 0 (.003), with a standard deviation of 1
(1.014).
1.3.4 4) Assessments that do not achieve the objective measurement principle of equal interval scaling.
The Rasch, or one-parameter IRT model, produces measures with equal
intervals. To illustrate this, I use the Berg Balance Scale,5 a scale used by physical
therapists to assess balance. On the Berg Balance Scale, persons scoring below a 45
23
are at risks for falls. Yet, what we cannot tell from this scale is whether the difference
between 35 and 40 is the same as the difference between 40 and 45. This is an ordinal
scale, as shown in Figure 1-2. Thus, we cannot easily compare if two persons showing
an improvement of 5 points exhibited equivalent improvement. Alternatively, a 5-unit
comparison on a Rasch interval scale would be equivalent.
1.4 IRT informing theory and practice:
Beyond measurement benefits, rehabilitation scientists have proposed that IRT
analysis can inform rehabilitation theory and practice. For example Woodbury et al.
2007, found that persons with stroke did not recover in a proximal to distal pattern as
had long been theorized. Rather, they recovered in a simple to complex movement
pattern. Also, it should be noted that this was done using IRT procedures with a
measure that was created using CTT.
Occupational and physical therapy intervention in persons with stroke have
assumed that recovery following stroke follows a proximal to distal direction, similar to
typical development. But, when persons with stroke were evaluated using the FMA for
the upper extremity, with the items evaluated using IRT procedures, Woodbury et al.
2007 showed using Rasch-generated item difficulty hierarchies that recovery
proceeding from simple to complex movements better explained upper extremity stroke
recovery, rather than a proximal to distal pattern.90
Further, Woodbury and colleagues suggest that clinicians can better identify the
‘just right challenge’ for their clients by evaluating where a person falls on a ‘keyform’. A
Rasch generated form, the keyform displays items in a difficulty hierarchy format.
Identifying where a person falls on the keyform allows the clinician to quickly ascertain
24
which items fall near the client ability level. Thus, allowing for efficient goal setting for
short and long term goals.
1.5 Conclusion
This paper details the value added benefit of using MTT procedures when
creating health outcome measures. As health outcomes research moves forward, MTT
procedures aid in comparing outcomes between studies, facilities and therapists.
Additionally, MTT provides a framework for evaluating theory and practice. This should
not be seen as pitting CTT against MTT, rather, that MTT allows for new means to
further rehabilitation research. As illustrated by Woodbury & Velozo (2007),90 using
MTT procedures on a sound CTT measure furthered understanding of recovery in upper
extremity function following stroke.
25
Figure 1-1. Two item characteristic curves with differing item discrimination
26
Figure 1-2. Interval and ordinal scale examples
Figure 1-3. Item characteristic curve
27
CHAPTER 2 A MEASURE OF FUNCTIONAL COGNITION OF STROKE: ASSESSING
DIMENSIONALITY
In order to better understand the functional impact of cognitive change due
to aging, disease and rehabilitation, researchers have focused on measures of
everyday ability. 2, 17, 44, 46, 74, 89 Two examples of applied cognition measures
used or developed with persons with stroke include the Functional Independence
Measure (FIM)44 and a more recently developed measure, the Applied Cognition
Scale (ACS).17 Though the FIM has been used extensively in rehab settings, the
range is limited. The FIM includes five general cognitive items: Cognitive
comprehension, Expression, Social interaction, Problem solving and Memory.
These items are rated on a seven point ordinal scale that ranges from complete
dependence to complete independence. In an effort to improve measurement of
applied cognition, Coster and colleagues17 developed an applied cognition scale.
Though the 46-item ACS improves the measurement breadth of functional
cognition, included items do not distinguish between separate cognitive
constructs. ACS developers included functional cognition items from seven
existing measures. Examinees rated items for degree of difficulty. Example
items include: (1) carrying a conversation with a friend in a noisy place, and (2)
asking someone to do something for you. The items were generic in that they
did not include items specific to a particular disease, and did not differentiate
between cognitive domains. Persons affected by stroke present with a unique
cognitive profile.9 Further, while cognitive research evidences a strong general
factor of cognition, decades of cognitive research evidences that the general
factor encompasses many subdomains. 10-12, 39, 62 As such, our research team
28
developed a measure of functional cognition in persons with stroke (MFC-S).
More specifically, the aim in developing the MFC-S was to provide clinicians with
a measure of applied cognition that included cognitive subdomains most
pertinent to persons with stroke. We defined functional cognition as the ability to
perform everyday activities that rely heavily on cognition, and separated
functional cognition items into 10 cognitive domains: Language, Reading &
Writing, Numerical Calculation, Visuospatial, Limb Praxis, Social Language,
Emotional Function, Attention, Executive Function and Learning & Memory.23
The qualitative process that developed these domains is described in detail in
Donovan et al, 200823.
MTT methods, as well as most psychometrics, require that a measure is
unidimensional.56 That is, a person’s score on a measure is assumed to
primarily reflect the person’s ability level on the measured construct, and not
other factors. While perfect unidimensionality is ideal, what a test developer
investigates is if the measure is essentially unidimensional. Linacre (2009)53
suggests that when evaluating dimensionality, the measurement developer
considers the purpose of the measure. Many constructs we may want to
measure may contain more than one dimension. For example, a test for
arithmetic may include addition and subtraction items. We would not want to
separate these into two separate measures if the intent is to measure general
math ability. When evaluating unidimensionality for the ten domains of the MFC-
S, we expect that there will be some evidence of secondary dimensions.
29
Each of the MFC-S domains included items from different constructs that
fall under a broader construct, the intended measurement construct. For
example, the language domain contains some items that represent expressive
speech and some items that represent receptive speech. However, the intent is
to measure functional language ability. In cases where there is evidence of
secondary dimensions, Linacre suggests inclusion of an equivalent amount of
items on the secondary dimensions when developing the final measure.53
A variety of statistical methods, discussed further below and in the
methods section, allow investigators to examine underlying dimensions of a
measure and evaluate evidence of multidimensionality.32, 56 In this study, we first
explore the underlying factor structure of the entire MFC-S to evaluate
quantitatively whether it is justifiable to include these 10 domains under the
broader umbrella of functional cognition. Next, we investigated whether it is
justifiable that each of the 10 domains of the MFC-S measure their intended
construct. Alternatively, we investigated whether there was evidence that items
in a given domain should be split into two separate measures.
Relevant to investigation of the entire measure factor structure, though
extensive qualitative work went into the development of the MFC-S, we are
unaware of prior factor analysis work supporting a strong apriori factor structure
hypothesis specific to functional cognition in persons with stroke. However, there
is a large body of work that has examined the factor structure of cognition more
broadly. For example, Spearman78 originally proposed the presence of a 'g'
factor to explain the high correlation between individual performance on different
30
tests of mental ability. Since that time, investigators have developed and
expanded on this theory. As cognition is thought to include a higher order
general factor, encompassing several subdomains,10, 62 we expect evidence for
a higher order general factor of functional cognition.
Several methods exist to establish unidimensionality.32, 56, 73 Historically,
methods used to evaluate dimensionality include factor analysis,32, 73 principal
components analysis (PCA),56 and item response theory fit statistics1. There
are strong arguments supporting each of these approaches. In order to evaluate
dimensionality, but restricted by sample size, we chose to perform an exploratory
factor analysis followed by a PCA of the standardized residuals.
Specifically, this study attempted to answer two questions: (1) Is there
evidence to support a ten factor solution as an adequate fit for the MFC-S? and
(2) For each of the ten proposed domains within the MFC-S, does the evidence
support unidimensionality?
2.1 Methods
2.1.1 Instrumentation
The instrument development process23 proceeded in four phases: (1) a
literature review, (2) input from an expert advisory panel, (3) item development
and (4) a field test. Donovan et al. 2008, detail the approach in conceptualizing
functional cognition in stroke. Initially, the literature review produced seventeen
constructs. An additional construct, apraxia was added after feedback from the
advisory panel, resulting in ten final domains for the MFC-S.
Initial item development within each of ten domains was guided by Rasch
measurement principles, neuropsychological theory and literature review. A

31
hierarchy of easier and harder items was theorized to measure a person’s ability
in each domain. The initial item pool contained 266 items. These 266 items
were then presented to focus groups of persons with stroke, acute (N=20) and
chronic (N=20), their significant others/caregivers and healthcare professionals.
Detailed methods and results of the focus group are currently in a manuscript
under preparation. Based on the focus groups items were removed, modified
and added resulting in a final item bank of 244 items. The finalized 244 items
crossed ten subdomains (language – 12 items, reading/writing – 14 items,
numeric calculation – 9 items, limb praxis – 10 items, visuospatial function – 31
items, social use of language – 32 items, emotional function – 40 items, attention
– 25 items, executive function – 41 items, memory – 29 items).
2.1.2 Participants
Approval for this study was obtained through the IRB-01 at the University
of Florida. Each participant signed an informed consent approved by the IRB.
Participants were recruited at local rehabilitation hospitals, outpatient clinics, area
hospitals, and doctors’ offices. The final sample included 128 persons with
stroke (acute = 49: right CVA = 28; left CVA = 19; other = 2; chronic = 70: right
CVA = 39; left CVA = 35; other = 5). Detailed participant characteristics are
presented in Appendix A. Participants with stroke were included in this study
according to the following criteria: Inclusion criteria: (1) 20 to 89 years of age, (2)
confirmed diagnosis of stroke (ischemic or intracerebral hemorrhage) based on
medical records, (3) acute (7-21 days post onset) or chronic stroke (three months
to one year) (4) English speaker. Exclusion criteria: (1) subarachnoid
hemorrhage, brainstem stroke, intracranial hemorrhage due to rupture aneurysm
32
or arteriovenous malformation, (2) previous stroke on the same side of the brain,
(3) preexisting neurological disease (such as Parkinson’s disease, amyotrophic
lateral sclerosis, multiple sclerosis, dementia), (4) history of head trauma that
resulted in residual neurological deficits, (5) legal blindness or severe visual
impairment, (6) history of significant psychiatric illness (such as bipolar affective
disorder, psychosis, schizophrenia, or medication refractory depression) that
affects their cognitive function, (7) unresponsive to stimulation, (8) unintelligible
to others, or unable to speak, (9) global aphasia (unable to understand or
express).
2.2 Data Analysis
2.2.1 Unidimensionality
Unidimensionality: Historically, methods used to evaluate dimensionality
include factor analysis,32 principal components analysis (PCA),56 and item
response theory fit statistics.1 Examining item banks for unidimensionality, some
modern test theory investigators propose performing a confirmatory factor
analysis (CFA) followed up with an exploratory factor analysis (EFA) if the model
shows poor fit.73 Other researchers suggest performing a PCA of standardized
residuals, after removing the primary Rasch dimension, as a PCA will optimize
the likelihood of uncovering a secondary dimension. Each approach has merits.
Primarily due to a low subject to item ratio, we chose to conduct an EFA followed
by a PCA of the standardized residuals. This allowed us to explore factor
structure for the entire measure, as well as examine possible second dimensions
at the item level for each domain.56
33
2.2.2 Subject to item ratio and item parceling
Though guidelines for necessary sample size and subject to item ratio to
perform a factor analysis vary,33, 60 Guadagnoli & Velicer33 found stability of factor
solutions produced with subject to item ratio as small as 3 to 1. The subject to
item ratio in our dataset was small, .52. One solution investigators have used to
handle small sample size is to parcel the items into a smaller number of groups.
Thus, prior to EFA, items within each hypothesized domain were randomly
assigned to one of three parcels, and the mean of each parcel was calculated.
Further, as evaluation of normality indicated high skewness and kurtosis
statistics, and a non normal distribution, the data was normalized using a Blom
transformation.6 The transformed dataset had acceptable distribution statistics.
2.2.3 Dimensionality Analysis
Exploratory factor analyses were computed in SPSS v 2140 using principle
axis factoring with promax rotation. Initial evaluation of number of factors to
maintain, using Kaiser’s rule of more than one eigenvalue42 and examination of
the scree plot,13 suggested retaining four or five factors. Thus, the initial
proposed ten-factor solution was assessed as well as the four and five factor
solutions. Factor loadings greater than .35 were interpreted.28 Root Mean
Square Residual (RMSR) was calculated to evaluate model fit. RMSR, one of
the few statistics available in EFA, compares the residuals from the reproduced
to the observed correlations. RMSR < .05 suggests adequate model fit.28
Additionally, when performing an EFA, beyond examining the strength of
factor loadings, investigators evaluate interpretability of solutions. Interpretability
evaluates if the solution is compatible with what we know from theory and
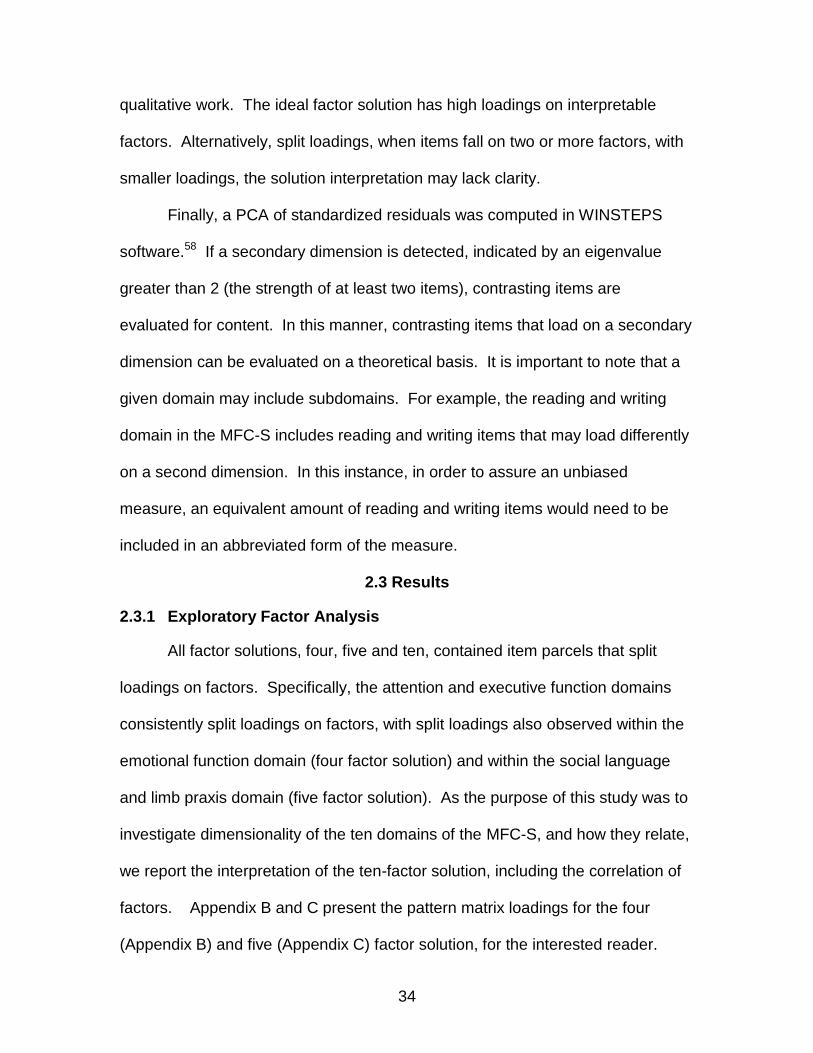
34
qualitative work. The ideal factor solution has high loadings on interpretable
factors. Alternatively, split loadings, when items fall on two or more factors, with
smaller loadings, the solution interpretation may lack clarity.
Finally, a PCA of standardized residuals was computed in WINSTEPS
software.58 If a secondary dimension is detected, indicated by an eigenvalue
greater than 2 (the strength of at least two items), contrasting items are
evaluated for content. In this manner, contrasting items that load on a secondary
dimension can be evaluated on a theoretical basis. It is important to note that a
given domain may include subdomains. For example, the reading and writing
domain in the MFC-S includes reading and writing items that may load differently
on a second dimension. In this instance, in order to assure an unbiased
measure, an equivalent amount of reading and writing items would need to be
included in an abbreviated form of the measure.
2.3 Results
2.3.1 Exploratory Factor Analysis
All factor solutions, four, five and ten, contained item parcels that split
loadings on factors. Specifically, the attention and executive function domains
consistently split loadings on factors, with split loadings also observed within the
emotional function domain (four factor solution) and within the social language
and limb praxis domain (five factor solution). As the purpose of this study was to
investigate dimensionality of the ten domains of the MFC-S, and how they relate,
we report the interpretation of the ten-factor solution, including the correlation of
factors. Appendix B and C present the pattern matrix loadings for the four
(Appendix B) and five (Appendix C) factor solution, for the interested reader.
35
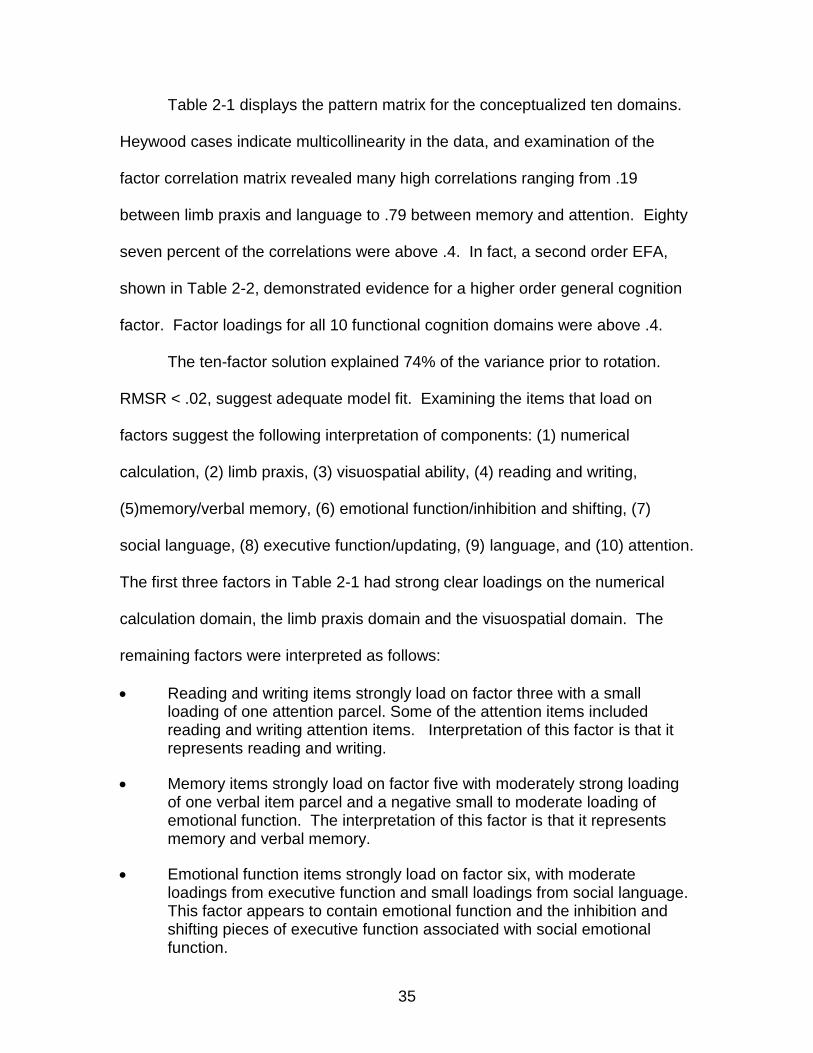
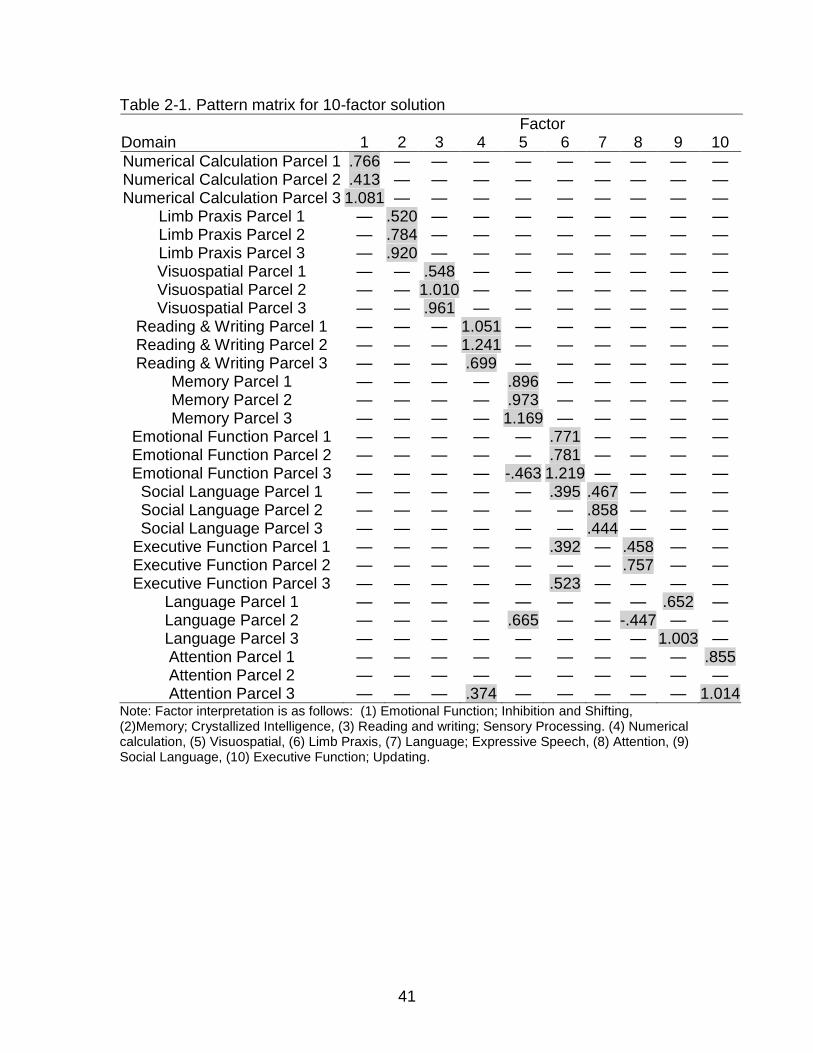
Table 2-1 displays the pattern matrix for the conceptualized ten domains.
Heywood cases indicate multicollinearity in the data, and examination of the
factor correlation matrix revealed many high correlations ranging from .19
between limb praxis and language to .79 between memory and attention. Eighty
seven percent of the correlations were above .4. In fact, a second order EFA,
shown in Table 2-2, demonstrated evidence for a higher order general cognition
factor. Factor loadings for all 10 functional cognition domains were above .4.
The ten-factor solution explained 74% of the variance prior to rotation.
RMSR < .02, suggest adequate model fit. Examining the items that load on
factors suggest the following interpretation of components: (1) numerical
calculation, (2) limb praxis, (3) visuospatial ability, (4) reading and writing,
(5)memory/verbal memory, (6) emotional function/inhibition and shifting, (7)
social language, (8) executive function/updating, (9) language, and (10) attention.
The first three factors in Table 2-1 had strong clear loadings on the numerical
calculation domain, the limb praxis domain and the visuospatial domain. The
remaining factors were interpreted as follows:
Reading and writing items strongly load on factor three with a small loading of one attention parcel. Some of the attention items included reading and writing attention items. Interpretation of this factor is that it represents reading and writing.
Memory items strongly load on factor five with moderately strong loading of one verbal item parcel and a negative small to moderate loading of emotional function. The interpretation of this factor is that it represents memory and verbal memory.
Emotional function items strongly load on factor six, with moderate loadings from executive function and small loadings from social language. This factor appears to contain emotional function and the inhibition and shifting pieces of executive function associated with social emotional function.

36
All social language item parcels had moderate to strong loadings on factor seven. Factor seven was interpreted as social language.
Factor eight had moderate to strong positive loadings from two executive function item parcels and one moderate negative loading from the second language item parcel. We interpreted this factor as executive function/updating. Updating is a form
Factor nine consisted of strong positive loadings from two of the language item parcels. This factor was interpreted as language.
Lastly, factor ten consisted of two strong positive loadings from two of the attention domains. We interpreted this factor as attention.
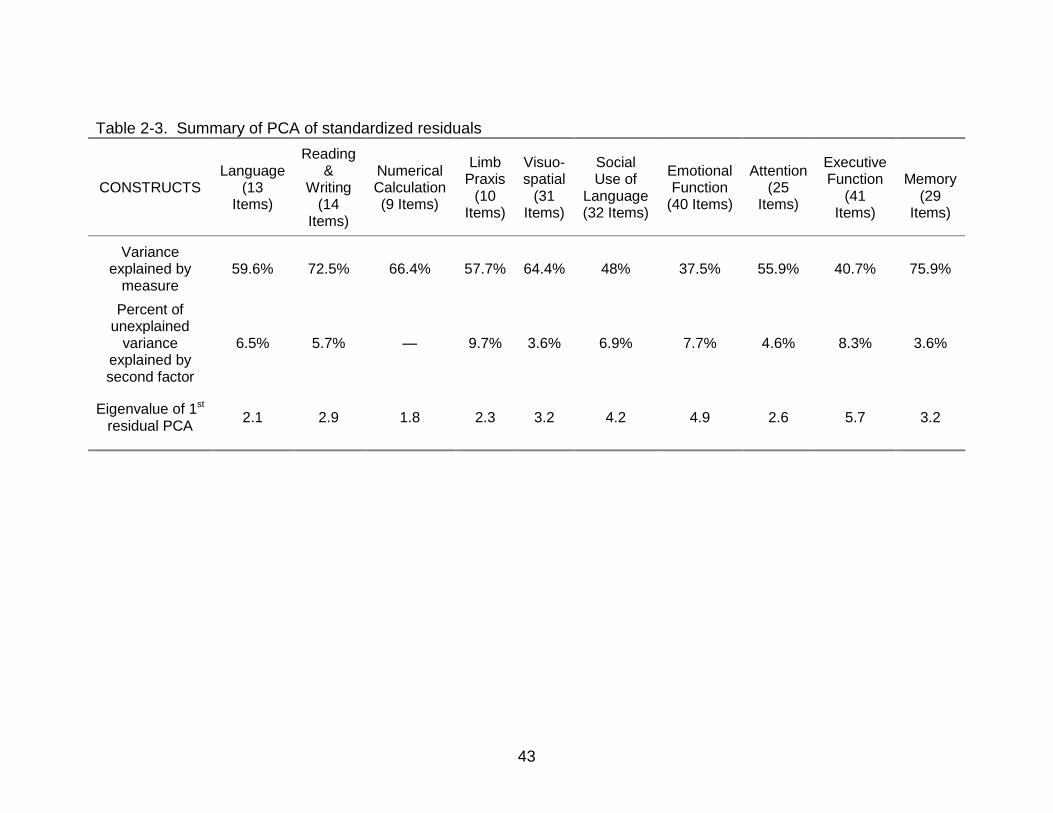
2.3.2 Principle Components Analysis on Residuals
Table 2-3 summarizes PCA of standardized residuals results for the ten
domains. The primary Rasch dimension for each domain explained a
substantially higher amount of variance, ranging from 38% of the variance for the
emotional function domain to 76% of the variance for the memory domain.
Additional unexplained variance accounted for by secondary dimensions ranged
from 2.7% for the memory domain to 9.7% for the limb praxis domain.
Further, secondary dimensions represented conceptualized subdomains
of the construct. Appendix D details contrasting items on a second dimension,
for each domain, using PCA of the standardized residuals, following removal of
the primary Rasch component. Secondary domain dimensions interpretations:
(1) language – receptive and expressive language items contrasted on a second
dimension, (2) reading & writing – secondary dimension items contrasted on
reading and writing items, (3) limb praxis -secondary dimension items separated
along a movement/receptive dimension, (4) visuospatial - a secondary dimension
contained items specific to hemispatial neglect, (5) social language – items that
fell on a second dimension included receptive and expressive language items,
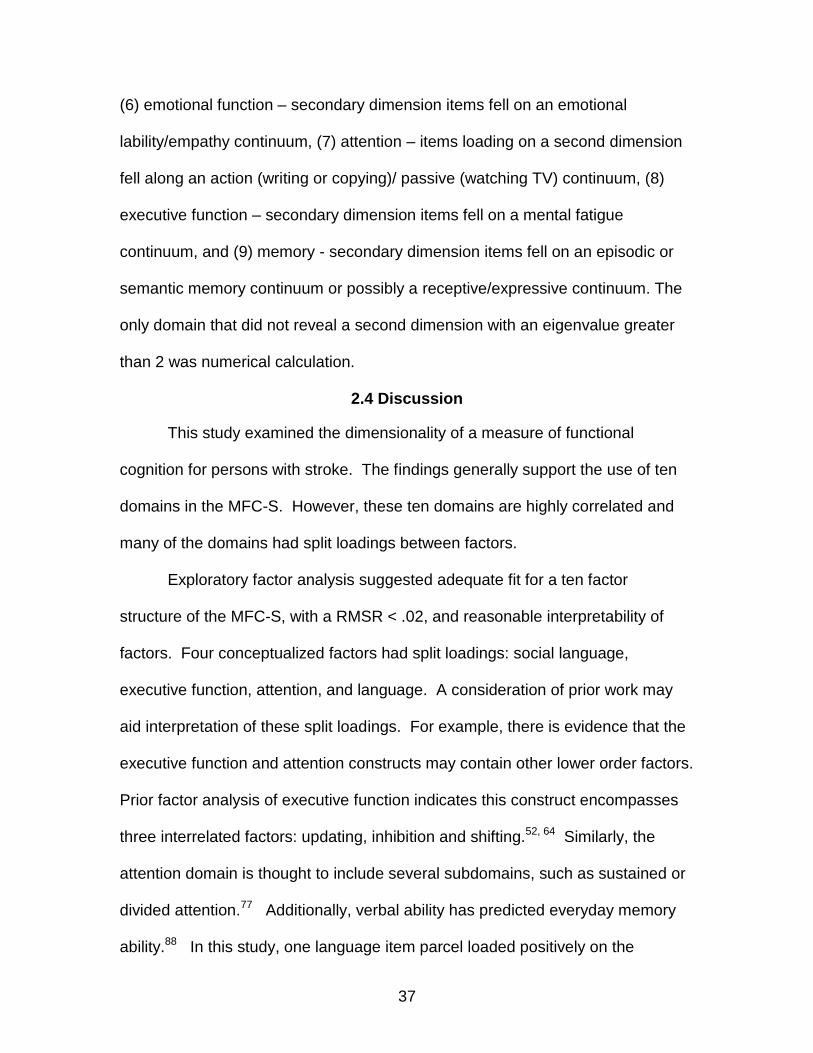
37
(6) emotional function – secondary dimension items fell on an emotional
lability/empathy continuum, (7) attention – items loading on a second dimension
fell along an action (writing or copying)/ passive (watching TV) continuum, (8)
executive function – secondary dimension items fell on a mental fatigue
continuum, and (9) memory - secondary dimension items fell on an episodic or
semantic memory continuum or possibly a receptive/expressive continuum. The
only domain that did not reveal a second dimension with an eigenvalue greater
than 2 was numerical calculation.
2.4 Discussion
This study examined the dimensionality of a measure of functional
cognition for persons with stroke. The findings generally support the use of ten
domains in the MFC-S. However, these ten domains are highly correlated and
many of the domains had split loadings between factors.
Exploratory factor analysis suggested adequate fit for a ten factor
structure of the MFC-S, with a RMSR < .02, and reasonable interpretability of
factors. Four conceptualized factors had split loadings: social language,
executive function, attention, and language. A consideration of prior work may
aid interpretation of these split loadings. For example, there is evidence that the
executive function and attention constructs may contain other lower order factors.
Prior factor analysis of executive function indicates this construct encompasses
three interrelated factors: updating, inhibition and shifting.52, 64 Similarly, the
attention domain is thought to include several subdomains, such as sustained or
divided attention.77 Additionally, verbal ability has predicted everyday memory
ability.88 In this study, one language item parcel loaded positively on the
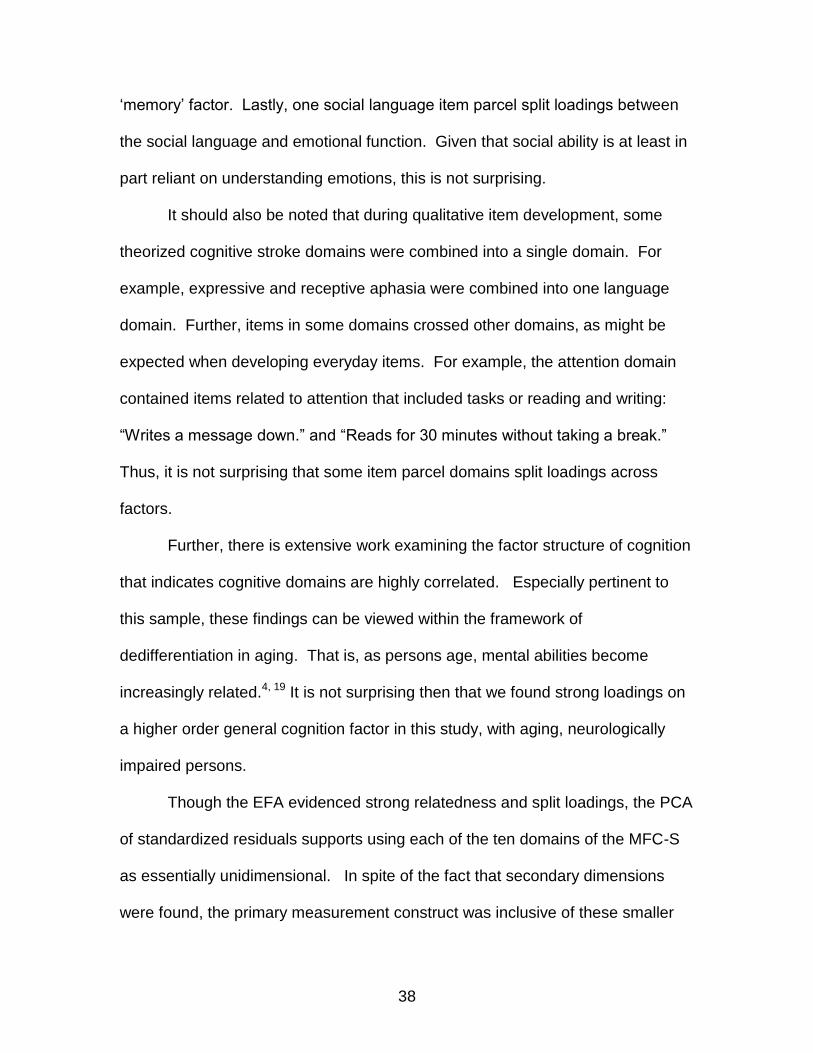
38
‘memory’ factor. Lastly, one social language item parcel split loadings between
the social language and emotional function. Given that social ability is at least in
part reliant on understanding emotions, this is not surprising.
It should also be noted that during qualitative item development, some
theorized cognitive stroke domains were combined into a single domain. For
example, expressive and receptive aphasia were combined into one language
domain. Further, items in some domains crossed other domains, as might be
expected when developing everyday items. For example, the attention domain
contained items related to attention that included tasks or reading and writing:
“Writes a message down.” and “Reads for 30 minutes without taking a break.”
Thus, it is not surprising that some item parcel domains split loadings across
factors.
Further, there is extensive work examining the factor structure of cognition
that indicates cognitive domains are highly correlated. Especially pertinent to
this sample, these findings can be viewed within the framework of
dedifferentiation in aging. That is, as persons age, mental abilities become
increasingly related.4, 19 It is not surprising then that we found strong loadings on
a higher order general cognition factor in this study, with aging, neurologically
impaired persons.
Though the EFA evidenced strong relatedness and split loadings, the PCA
of standardized residuals supports using each of the ten domains of the MFC-S
as essentially unidimensional. In spite of the fact that secondary dimensions
were found, the primary measurement construct was inclusive of these smaller

39
dimensions. Further, the primary Rasch construct explained a substantial
amount of the variance over additional variance explained by possible second
dimensions. Finally, all domain’s residual variance found in this study is less
than that found in a comparable measure, the applied cognition scale (ACS).17
Coster and colleagues found 10.4% residual variance in the ACS. The residual
variance in our domains ranged from 2.7% for the memory domain to 9.7% for
the limb praxis domain. This may be partially due to the ACS containing one
general domain whereas the MFC-S detailed ten cognitive domains. As
cognition is thought to encompass subdomains, it is logical that a measure that
did not distinguish separate domains would have higher residual variance.
Before concluding, we note four limitations of this study. First, our sample
size was relatively small and included both acute and chronic, as well as right
and left hemisphere persons with stroke. Thus, sample size and heterogeneity
may have affected the power of this study. Second, while item parceling
improves the distributional properties of our data, the item level information is
lost, hindering interpretation of the EFA. Third, our sample excluded persons
more severely affected with stroke, which may limit the generalization of these
findings to the larger stroke population. Lastly, the ten-factor solution had eight
loadings greater than one, indicating redundancy between the ten factors.
Future dimensionality work might find other factor solutions to be a more
parsimonious, better fit.
2.5 Conclusion
The ideal Rasch model is perfectly unidimensional, but empirically, we can
never expect pure unidimensionality. This may be particularly relevant when a

40
measure evaluates every day function through self-report. Instead, we rely on
theory and prior knowledge to evaluate secondary dimensions through item
content. Due to evidence of secondary dimensions, as the measure is further
developed, it will be important to include equivalent numbers of items reflecting
secondary domains.
41
Table 2-1. Pattern matrix for 10-factor solution
Factor Domain 1 2 3 4 5 6 7 8 9 10
Numerical Calculation Parcel 1 .766 — — — — — — — — — Numerical Calculation Parcel 2 .413 — — — — — — — — — Numerical Calculation Parcel 3 1.081 — — — — — — — — —
Limb Praxis Parcel 1 — .520 — — — — — — — — Limb Praxis Parcel 2 — .784 — — — — — — — — Limb Praxis Parcel 3 — .920 — — — — — — — — Visuospatial Parcel 1 — — .548 — — — — — — — Visuospatial Parcel 2 — — 1.010 — — — — — — — Visuospatial Parcel 3 — — .961 — — — — — — —
Reading & Writing Parcel 1 — — — 1.051 — — — — — — Reading & Writing Parcel 2 — — — 1.241 — — — — — — Reading & Writing Parcel 3 — — — .699 — — — — — —
Memory Parcel 1 — — — — .896 — — — — — Memory Parcel 2 — — — — .973 — — — — — Memory Parcel 3 — — — — 1.169 — — — — —
Emotional Function Parcel 1 — — — — — .771 — — — — Emotional Function Parcel 2 — — — — — .781 — — — — Emotional Function Parcel 3 — — — — -.463 1.219 — — — — Social Language Parcel 1 — — — — — .395 .467 — — — Social Language Parcel 2 — — — — — — .858 — — — Social Language Parcel 3 — — — — — — .444 — — —
Executive Function Parcel 1 — — — — — .392 — .458 — — Executive Function Parcel 2 — — — — — — — .757 — — Executive Function Parcel 3 — — — — — .523 — — — —
Language Parcel 1 — — — — — — — — .652 — Language Parcel 2 — — — — .665 — — -.447 — — Language Parcel 3 — — — — — — — — 1.003 — Attention Parcel 1 — — — — — — — — — .855 Attention Parcel 2 — — — — — — — — — — Attention Parcel 3 — — — .374 — — — — — 1.014
Note: Factor interpretation is as follows: (1) Emotional Function; Inhibition and Shifting, (2)Memory; Crystallized Intelligence, (3) Reading and writing; Sensory Processing. (4) Numerical calculation, (5) Visuospatial, (6) Limb Praxis, (7) Language; Expressive Speech, (8) Attention, (9) Social Language, (10) Executive Function; Updating.

42
Table 2-2. Higher order ‘G’ factor
43
Table 2-3. Summary of PCA of standardized residuals
CONSTRUCTS Language
(13 Items)
Reading &
Writing (14
Items)
Numerical Calculation (9 Items)
Limb Praxis
(10 Items)
Visuo-spatial
(31 Items)
Social Use of
Language (32 Items)
Emotional Function
(40 Items)
Attention (25
Items)
Executive Function
(41 Items)
Memory
(29 Items)
Variance explained by
measure 59.6% 72.5% 66.4% 57.7% 64.4% 48% 37.5% 55.9% 40.7% 75.9%
Percent of unexplained
variance explained by second factor
6.5% 5.7% — 9.7% 3.6% 6.9% 7.7% 4.6% 8.3% 3.6%
Eigenvalue of 1st residual PCA
2.1 2.9 1.8 2.3 3.2 4.2 4.9 2.6 5.7 3.2
44
CHAPTER 3 MEASURE OF FUNCTIONAL COGNITION IN STROKE: RASCH ANALYSIS
Recent research indicates that cognitive impairment has a significant impact on
post stroke recovery.85 Additionally, though cognitive impairment can predict functional
outcome in persons with stroke,24, 25, 67, 85 and as much as 70% of persons with stroke
experience cognitive impairment, existing measures of everyday functional cognition for
persons with stroke are limited in the breadth and depth of items,18 or do not include
tasks and domains specific to cognitive stroke impairment.9 For example, the
Functional Independence Measure (FIM) contains ratings of ability level for only three
general cognitive items: memory, orientation and problem solving.24, 47
Many health outcomes researchers are increasingly turning to item response
theory methods (described below) to develop and evaluate new and existing scales.
Coster and colleagues17 recently used Rasch analysis, also called the one parameter
item response theory model, to develop an applied cognition scale (ACS). Their study
used a convenience sample that included persons with neurological impairment,
including persons with stroke, yet items did not conceptually integrate unique symptoms
associated with stroke. Further, though the 46-item ACS improves the measurement
breadth of functional cognition, included items did not distinguish between separate
cognitive constructs.
Cognitive researchers have shown a general dimension of cognition that
encompasses many subdomains.2, 12, 62, 78 In an effort to include conceptualized
cognitive subdomains for persons with stroke, our research team developed a measure
of functional cognition for persons with stroke (MFC-S). The development process,
described in detail in Donovan, 2008,23 included a literature review, input from an expert
45
advisory panel, focus groups and cognitive interviews. The final 244 item bank crossed
10 domains: Language, Reading & Writing, Numerical Calculation, Visuospatial, Limb
Praxis, Social Language, Emotional Function, Attention, Executive Function and
Learning & Memory.
We chose Rasch analysis8 to evaluate each of the domains. Rasch measures
allows for equal interval level measurement by converting scores to a logit scale.8 That
is, a score of 1 logit is exactly one more than a score of 2 logits. To illustrate, the Rasch
model presents items on an item difficulty hierarchy, and calculates a person score
based on a person’s response to items. Persons with a higher ability level will be more
likely to pass more difficult items, and persons with less ability will be less likely to pass
more difficult items.
Through examination of the item hierarchy, and fit statistics, Rasch methods
allow for examination of a measure at the item level rather than the test level. Further,
Rasch modelers propose that it is better to fit the data to the model than to fit the model
to the data.54 By fitting the data to the model, misfitting items or persons can be
identified, with fit statistics, and “diagnosed”.
This paper evaluates and presents the Rasch psychometrics of the MFC-S.
Specifically, item and person misfit, scale analysis and item hierarchy are evaluated.
3.1 Methods
3.1.1 Participants
Approval for this study was obtained through the IRB-01 at the University of
Florida. Each participant signed an informed consent approved by the IRB.
Participants were recruited at local rehabilitation hospitals, outpatient clinics, area
hospitals, and doctors’ offices. The final sample included 128 persons with stroke
46
(acute = 49: right CVA = 28; left CVA = 19; other = 2; chronic = 70: right CVA = 39; left
CVA = 35; other = 5). Detailed participant characteristics are presented in Appendix A.
Participants with stroke were included in this study according to the following criteria:
Inclusion criteria: (1) 20 to 89 years of age, (2) confirmed diagnosis of stroke (ischemic
or intracerebral hemorrhage) based on medical records, (3) acute (7-21 days post
onset) or chronic stroke (three months to one year) (4) English speaker. Exclusion
criteria: (1) subarachnoid hemorrhage, brainstem stroke, intracranial hemorrhage due to
rupture aneurysm or arteriovenous malformation, (2) previous stroke on the same side
of the brain, (3) preexisting neurological disease (such as Parkinson’s disease,
amyotrophic lateral sclerosis, multiple sclerosis, dementia), (4) history of head trauma
that resulted in residual neurological deficits, (5) legal blindness or severe visual
impairment, (6) history of significant psychiatric illness (such as bipolar affective
disorder, psychosis, schizophrenia, or medication refractory depression) that affects
their cognitive function, (7) unresponsive to stimulation, (8) unintelligible to others, or
unable to speak, (9) global aphasia (unable to understand or express).
3.1.2 Instrumentation
The MFC-S, presented in Appendix E, contains 244 items that cross 10 domains:
language – 12 items, reading/writing – 14 items, numeric calculation – 9 items, limb
praxis – 10 items, visuospatial function – 31 items, social use of language – 32 items,
emotional function – 40 items, attention – 25 items, executive function – 41 items,
memory – 29 items. Construct development is described in detail in Donovan et al.
20089 and focus group methods in a manuscript in preparation.
47
3.2 Administration procedures
The MFC-S was administered to patients along with several other screening
instruments and assessments. Research assistants, trained by neuropsychologists,
administered all assessments within the hospital room (acute patients) or within the
patient’s home (chronic patients). Patient assessments were administered in the
following order: 1) demographics, 2) MFC-S (Appendix E), 3) NIH Stroke Scale, 4)
Center for Epidemiology Studies Depression Scale (CESD), 5) anosognosia screen, 6)
Modified Rankin Scale, 7) Stroke Impact Scale (participation section), 8) global
cognitive functioning scale pre-stroke, 9) global cognitive functioning scale current, and
10) selected neuropsychological assessments for a random set of 50 percent of
participants. The order of the administration of the MFC-S domains was
counterbalanced. The MFC-S was administered in a self-report format (versus
interview format) for 43 percent of the patients.
3.3 Data analysis
3.3.1 Unidimensionality
Rasch models require that an instrument is unidimensional. Unidimensionality,
and assumption under item response theory (IRT), assumes that a person's score on a
test is the result of their ability level on the construct measured, rather than other
unmeasured constructs. Unidimensionality was evaluated, detailed in a manuscript
under preparation, using exploratory factor analysis and a principal components
analysis of standardized residuals for each of the ten domains. Results generally
supported unidimensionality of the domains, with each domain loading on a second
order, functional cognition factor.
48
3.3.2 Rasch Analysis
Rasch analysis was conducted on each functional cognition domain.
Specifically, each domain was evaluated on five features: (1) Rating scale analysis, (2)
Fit and reliability statistics, (3) Item difficulty hierarchy, (4) Ceiling and floor effects, and
(5) Person separation. First, a rating scale analysis was performed. Linacre 57
proposes three essential criteria for optimal scale performance: (1) A minimum of ten
observations should be observed in each rating scale category to provide unbiased step
calibrations between categories, (2) Monotonicity: category measures were examined
to assure they increase or decrease consistently as categories advance. (3) Outfit
mean square (MnSq) for each rating category are below 2.0.
Under the Rasch model, a reasonable amount of randomness, or noise, is
expected. The MnSq statistic of 1 indicates there is uniform variance of the data.
Values greater than 2 suggest there is more unexplained variance than explained
variance. Fit statistics were examined for each rating scale category, as well as
persons and items.
Second, person fit, item fit and point-measure reliability statistics were estimated.
Rasch analysis calculates two fit statistics.7 The infit statistic is sensitive to unexpected
patterns of responses on items matched to a person’s ability level. The outfit statistc is
sensitive to departure from model expectations when item difficulty is far from a
person’s ability level.
Wright and colleagues1 suggest acceptable fit guidelines of .6 < MnSq < 1.4, with
a corresponding standardized Z score of less than 2.0 for questionnaire type measures.
Less than .6 may produce misleadingly good reliability and separation estimates, but
are not degrading to the measure. High fit statistics indicate that there is more
49
observed variance than expected by the model. Thus, items and persons that had high
fit statistics were flagged and evaluated for theoretical misfit. While the Rasch model
does not include discrimination in item and persons calibrations, Winsteps 55 does
provide item discrimination statistics. Low (<.2) item discrimination indices were flagged.
45 Misfitting persons were further evaluated for data entry errors or misunderstanding of
items.
Third, item hierarchy was evaluated for logical order of item difficulties, and
ceiling and floor effects. For a given domain, items that conceptually are more difficult
should fall on the higher part of the scale. For example, for the language domain,
carrying on a conversation in a distracting environment should be more difficult than
responding to yes or no questions. Ceiling and floor effects are also reflected on the
map. For example, in Figure 3-1, the # symbol to the left of the line represents persons.
Persons reaching maximum or minimum scores fall at the top or bottom of the map,
respectively.
Finally, the precision of this measure, with this particular sample, was evaluated
using person separation and strata statistics. The person separation index indicates
how much persons can be reliably separated into groups. Reliability above .6 allows for
separation of persons into at least two statistically different groups.1, 27 The strata index
is computed from the person separation index and indicates the number of statistically
distinct ability levels the sample can be divided.
3.4 Results
MFC-S Psychometrics are presented in Table 3-1.
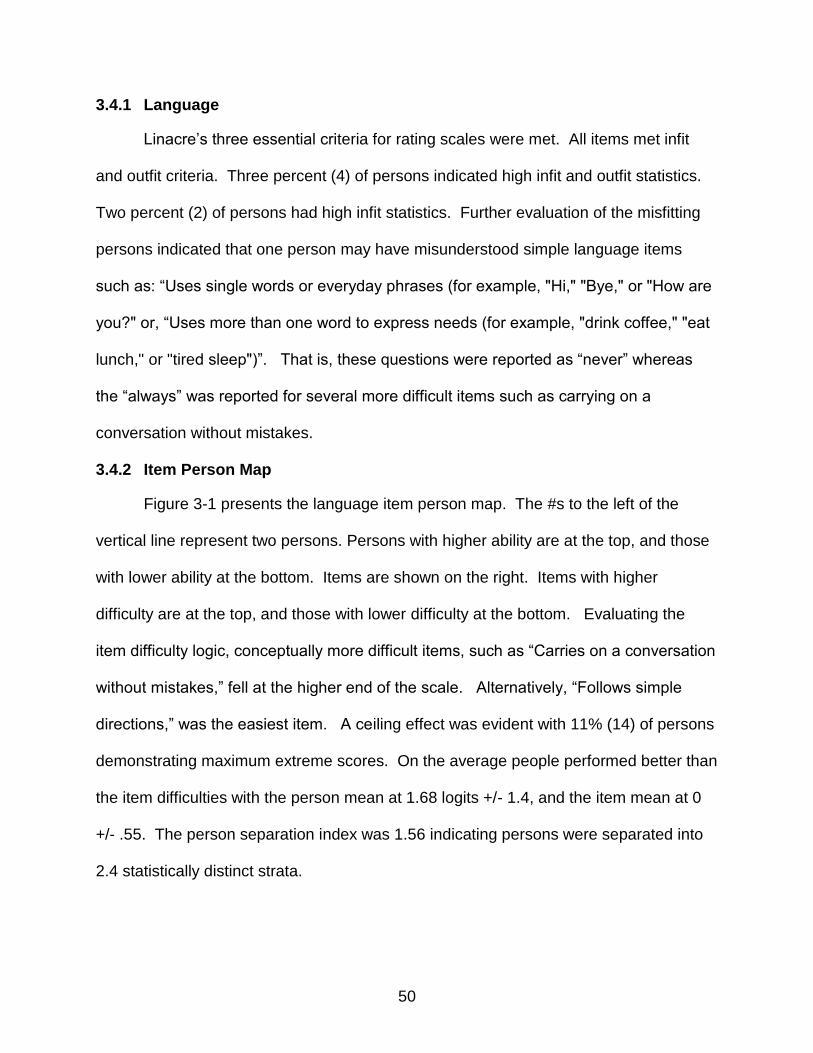
50
3.4.1 Language
Linacre’s three essential criteria for rating scales were met. All items met infit
and outfit criteria. Three percent (4) of persons indicated high infit and outfit statistics.
Two percent (2) of persons had high infit statistics. Further evaluation of the misfitting
persons indicated that one person may have misunderstood simple language items
such as: “Uses single words or everyday phrases (for example, "Hi," "Bye," or "How are
you?" or, “Uses more than one word to express needs (for example, "drink coffee," "eat
lunch," or "tired sleep")”. That is, these questions were reported as “never” whereas
the “always” was reported for several more difficult items such as carrying on a
conversation without mistakes.
3.4.2 Item Person Map
Figure 3-1 presents the language item person map. The #s to the left of the
vertical line represent two persons. Persons with higher ability are at the top, and those
with lower ability at the bottom. Items are shown on the right. Items with higher
difficulty are at the top, and those with lower difficulty at the bottom. Evaluating the
item difficulty logic, conceptually more difficult items, such as “Carries on a conversation
without mistakes,” fell at the higher end of the scale. Alternatively, “Follows simple
directions,” was the easiest item. A ceiling effect was evident with 11% (14) of persons
demonstrating maximum extreme scores. On the average people performed better than
the item difficulties with the person mean at 1.68 logits +/- 1.4, and the item mean at 0
+/- .55. The person separation index was 1.56 indicating persons were separated into
2.4 statistically distinct strata.
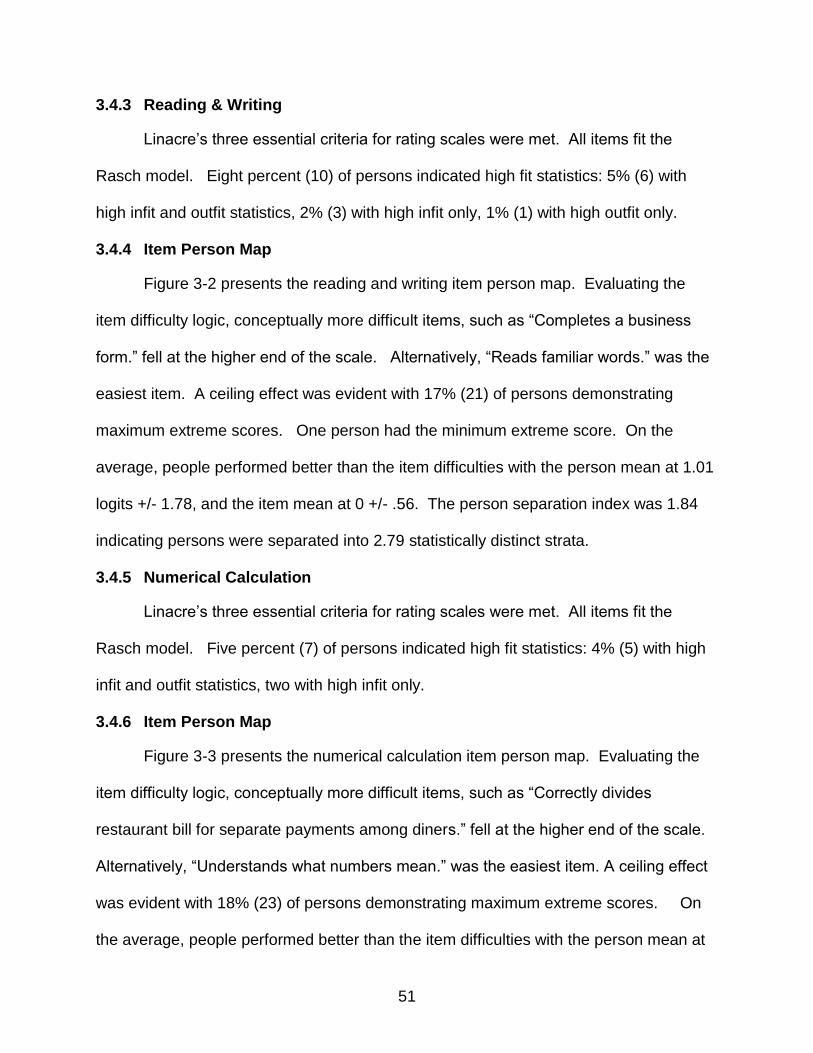
51
3.4.3 Reading & Writing
Linacre’s three essential criteria for rating scales were met. All items fit the
Rasch model. Eight percent (10) of persons indicated high fit statistics: 5% (6) with
high infit and outfit statistics, 2% (3) with high infit only, 1% (1) with high outfit only.
3.4.4 Item Person Map
Figure 3-2 presents the reading and writing item person map. Evaluating the
item difficulty logic, conceptually more difficult items, such as “Completes a business
form.” fell at the higher end of the scale. Alternatively, “Reads familiar words.” was the
easiest item. A ceiling effect was evident with 17% (21) of persons demonstrating
maximum extreme scores. One person had the minimum extreme score. On the
average, people performed better than the item difficulties with the person mean at 1.01
logits +/- 1.78, and the item mean at 0 +/- .56. The person separation index was 1.84
indicating persons were separated into 2.79 statistically distinct strata.
3.4.5 Numerical Calculation
Linacre’s three essential criteria for rating scales were met. All items fit the
Rasch model. Five percent (7) of persons indicated high fit statistics: 4% (5) with high
infit and outfit statistics, two with high infit only.
3.4.6 Item Person Map
Figure 3-3 presents the numerical calculation item person map. Evaluating the
item difficulty logic, conceptually more difficult items, such as “Correctly divides
restaurant bill for separate payments among diners.” fell at the higher end of the scale.
Alternatively, “Understands what numbers mean.” was the easiest item. A ceiling effect
was evident with 18% (23) of persons demonstrating maximum extreme scores. On
the average, people performed better than the item difficulties with the person mean at
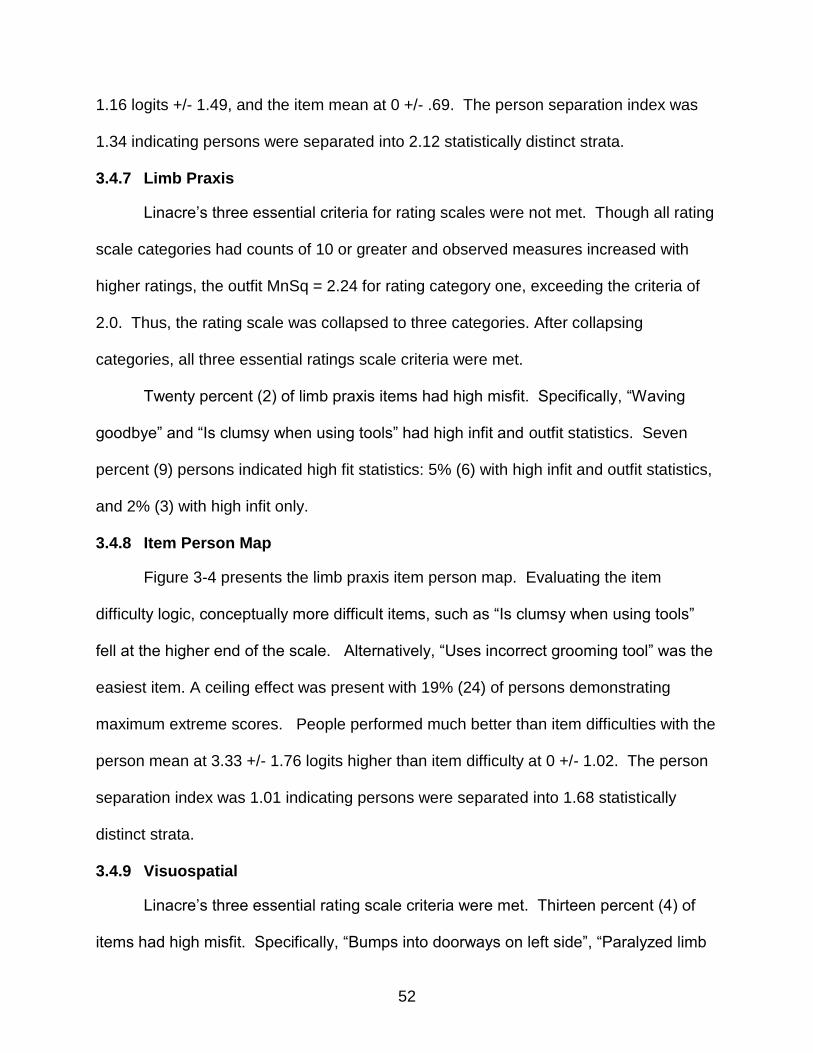
52
1.16 logits +/- 1.49, and the item mean at 0 +/- .69. The person separation index was
1.34 indicating persons were separated into 2.12 statistically distinct strata.
3.4.7 Limb Praxis
Linacre’s three essential criteria for rating scales were not met. Though all rating
scale categories had counts of 10 or greater and observed measures increased with
higher ratings, the outfit MnSq = 2.24 for rating category one, exceeding the criteria of
2.0. Thus, the rating scale was collapsed to three categories. After collapsing
categories, all three essential ratings scale criteria were met.
Twenty percent (2) of limb praxis items had high misfit. Specifically, “Waving
goodbye” and “Is clumsy when using tools” had high infit and outfit statistics. Seven
percent (9) persons indicated high fit statistics: 5% (6) with high infit and outfit statistics,
and 2% (3) with high infit only.
3.4.8 Item Person Map
Figure 3-4 presents the limb praxis item person map. Evaluating the item
difficulty logic, conceptually more difficult items, such as “Is clumsy when using tools”
fell at the higher end of the scale. Alternatively, “Uses incorrect grooming tool” was the
easiest item. A ceiling effect was present with 19% (24) of persons demonstrating
maximum extreme scores. People performed much better than item difficulties with the
person mean at 3.33 +/- 1.76 logits higher than item difficulty at 0 +/- 1.02. The person
separation index was 1.01 indicating persons were separated into 1.68 statistically
distinct strata.
3.4.9 Visuospatial
Linacre’s three essential rating scale criteria were met. Thirteen percent (4) of
items had high misfit. Specifically, “Bumps into doorways on left side”, “Paralyzed limb
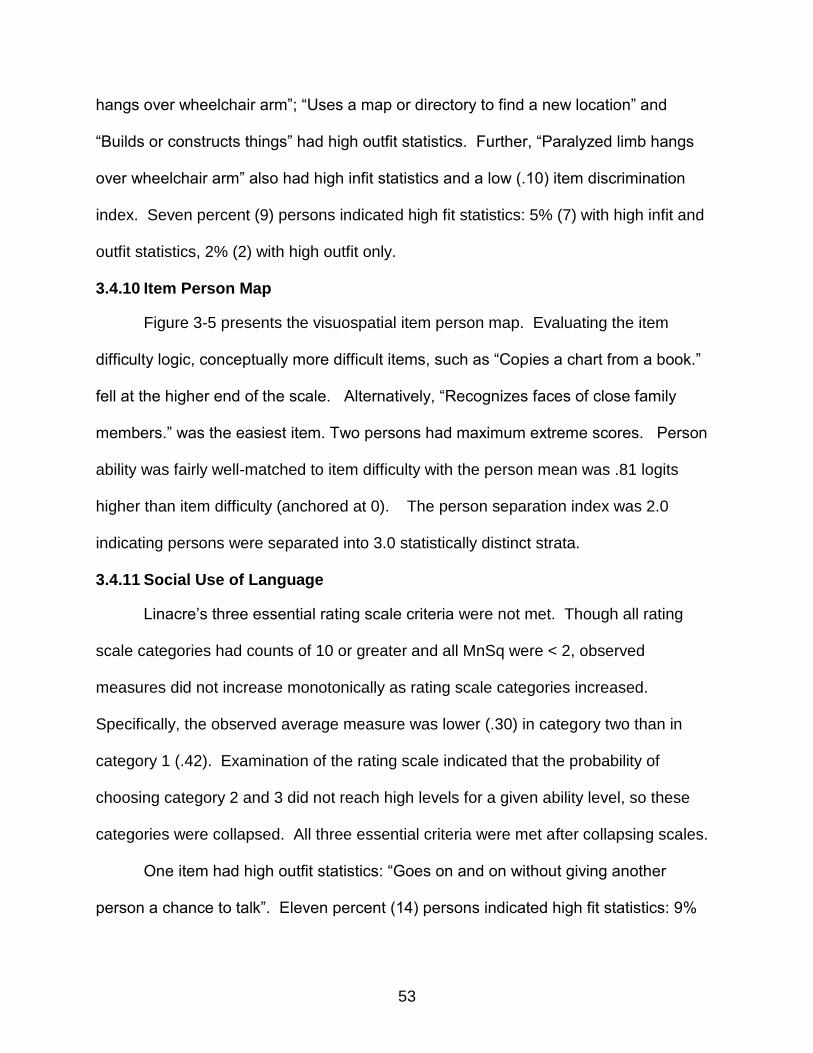
53
hangs over wheelchair arm”; “Uses a map or directory to find a new location” and
“Builds or constructs things” had high outfit statistics. Further, “Paralyzed limb hangs
over wheelchair arm” also had high infit statistics and a low (.10) item discrimination
index. Seven percent (9) persons indicated high fit statistics: 5% (7) with high infit and
outfit statistics, 2% (2) with high outfit only.
3.4.10 Item Person Map
Figure 3-5 presents the visuospatial item person map. Evaluating the item
difficulty logic, conceptually more difficult items, such as “Copies a chart from a book.”
fell at the higher end of the scale. Alternatively, “Recognizes faces of close family
members.” was the easiest item. Two persons had maximum extreme scores. Person
ability was fairly well-matched to item difficulty with the person mean was .81 logits
higher than item difficulty (anchored at 0). The person separation index was 2.0
indicating persons were separated into 3.0 statistically distinct strata.
3.4.11 Social Use of Language
Linacre’s three essential rating scale criteria were not met. Though all rating
scale categories had counts of 10 or greater and all MnSq were < 2, observed
measures did not increase monotonically as rating scale categories increased.
Specifically, the observed average measure was lower (.30) in category two than in
category 1 (.42). Examination of the rating scale indicated that the probability of
choosing category 2 and 3 did not reach high levels for a given ability level, so these
categories were collapsed. All three essential criteria were met after collapsing scales.
One item had high outfit statistics: “Goes on and on without giving another
person a chance to talk”. Eleven percent (14) persons indicated high fit statistics: 9%
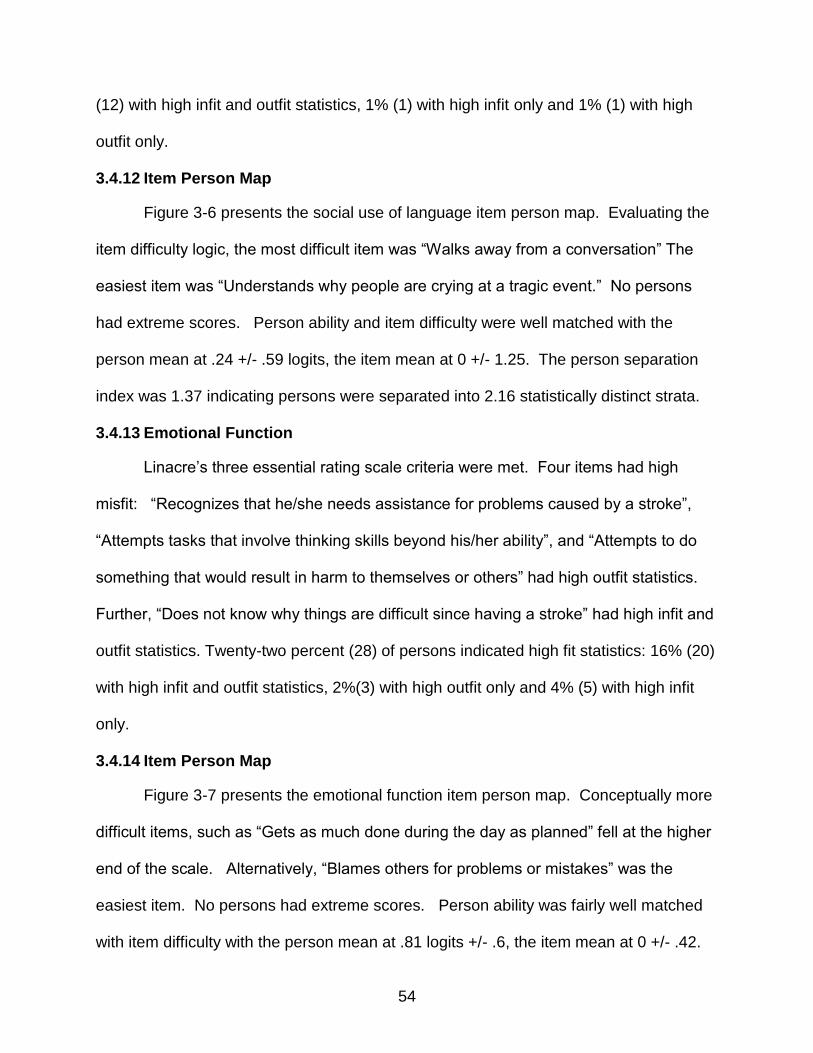
54
(12) with high infit and outfit statistics, 1% (1) with high infit only and 1% (1) with high
outfit only.
3.4.12 Item Person Map
Figure 3-6 presents the social use of language item person map. Evaluating the
item difficulty logic, the most difficult item was “Walks away from a conversation” The
easiest item was “Understands why people are crying at a tragic event.” No persons
had extreme scores. Person ability and item difficulty were well matched with the
person mean at .24 +/- .59 logits, the item mean at 0 +/- 1.25. The person separation
index was 1.37 indicating persons were separated into 2.16 statistically distinct strata.
3.4.13 Emotional Function
Linacre’s three essential rating scale criteria were met. Four items had high
misfit: “Recognizes that he/she needs assistance for problems caused by a stroke”,
“Attempts tasks that involve thinking skills beyond his/her ability”, and “Attempts to do
something that would result in harm to themselves or others” had high outfit statistics.
Further, “Does not know why things are difficult since having a stroke” had high infit and
outfit statistics. Twenty-two percent (28) of persons indicated high fit statistics: 16% (20)
with high infit and outfit statistics, 2%(3) with high outfit only and 4% (5) with high infit
only.
3.4.14 Item Person Map
Figure 3-7 presents the emotional function item person map. Conceptually more
difficult items, such as “Gets as much done during the day as planned” fell at the higher
end of the scale. Alternatively, “Blames others for problems or mistakes” was the
easiest item. No persons had extreme scores. Person ability was fairly well matched
with item difficulty with the person mean at .81 logits +/- .6, the item mean at 0 +/- .42.

55
The person separation index was 2.31 indicating persons were separated into 3.4
statistically distinct strata.
3.4.15 Attention
Linacre’s three essential rating scale criteria were met. Eight percent (2) of items
had high fit statistics. Specifically, “Stops in the middle of a task when distracted” had
high infit and outfit statistics. “Pays attention to the wrong conversation” had high outfit
statistics. Further, these items had negative discrimination indices. Nine percent (11)
of persons indicated high fit statistics: 6% (8) with high infit and outfit statistics and 2%
(3) with high infit only.
3.4.16 Item Person Map
Figure 3-8 presents the attention item person map. Conceptually more difficult
items, such as “Has a conversation in a noisy environment” fell at the higher end of the
scale. Alternatively, “Correctly answers yes or no questions about themselves” was the
easiest item. One percent (1) of persons had extreme high scores. Person ability was
fairly well matched with item difficulty with the person mean at .78 logits +/- .86, the item
mean anchored at 0 +/- .46. The person separation index was 2.26 indicating persons
were separated into 3.35 statistically distinct strata.
3.4.17 Executive Function
Linacre’s three essential rating scale criteria were met. Twenty-four percent (5)
of items had high fit statistics. “Tries to do an activity before having the ability to do it”
had high infit and outfit statistics. “Starts an activity automatically”, “Organizes an
activity several days in advance”, “Takes things literally” and “Seeks help when needed”
had high outfit statistics. Further, “Tries to do an activity before having the ability to do

56
it” had negative discrimination indices. Thirteen percent (16) persons indicated high fit
statistics: 11% (14) with high infit and outfit, 2% (2) with high infit only.
3.4.18 Item Person Map
Figure 3-9 presents the executive function item person map. Evaluating the item
difficulty logic, conceptually more difficult items, such as “Plans a big project” fell at the
higher end of the scale. Alternatively, “Reacts appropriately in a dangerous situation”
was the easiest item. No persons had extreme scores. The person mean was .78
logits +/- .7, with the item mean at 0 +/- .38. The person separation index was 2.74
indicating persons were separated into 3.99 statistically distinct strata.
3.4.19 Memory
Linacre’s three essential rating scale criteria were met. Ten percent (3) of items
had high fit statistics. Specifically, “Recalls birthdays, holidays and anniversaries” had
high infit and outfit statistics. “Recalls childhood events.” and “Recalls where the car is
parked in the mall or grocery store.” had high outfit statistics. Item discrimination
indices revealed adequate discrimination in these items. Eleven percent (14) of
persons indicated high fit statistics: 7% (9) with high infit and 1% (2) with high outfit only.
3.4.20 Item Person Map
Figure 3-10 presents the memory item person map. Evaluating the item difficulty
logic, conceptually more difficult items, such as “Recalls activities or events from several
months ago.” fell at the higher end of the scale. Alternatively, “Says own name
correctly when asked.” was the easiest item. A ceiling effect was evident with 7% (8) of
persons demonstrating maximum extreme scores. On average, people performed
better than the item difficulties with the person mean at 1.76 logits +/- 1.51, and the item

57
mean at 0 +/- .72. The person separation index was 2.29 indicating persons were
separated into 3.39 statistically distinct strata.
3.4.21 Person misfit
The demographics comparing misfitting persons to the overall group are
presented in Table 3-2. Misfitting persons, on average,: (1) were .5 years older, (2)
scored .83 higher on the NIH stroke scale, (3) tended to be classified as moderate to
severe on the Modified Rankin Scale (misfit: 74%, entire sample: 68%), (4) tended to be
acute (misfit: 45.8%, entire sample: 38.3%), (5) tended to have high school education or
less (misfit: 69.5%, entire sample: 58.6%), (6) tended to need assist to complete the
measure (misfit: 66%, entire sample: 57%), and (7) tended to be of non-white race
(misfit: 42.4%, entire sample: 31.3%),
3.5 Discussion
This study presents the psychometrics and item hierarchy of the 10 domains that
comprise the MFC-S. Results from this analysis generally support the use of the MFC-
S domains, except limb praxis, to evaluate functional cognition in stroke rehabilitation
and research settings. . Nine of the ten domains were able to separate persons into at
least two statistically significant strata. Four domains – emotional function (3.4),
attention (3.4), executive function (4.03) and memory (3.39) – separated persons into
three or more statistically significant strata. However, the limb praxis domain did not
separate people into at least two distinct groups and showed a strong ceiling effect with
19% (24) people reaching the maximum score. The language – 11% (14), reading and
writing – 16% (21) and numerical calculation 18% (23) domains also exhibited a ceiling
effect. This indicates that these domains may have been too easy for this sample. One
solution in future work might be to add more difficult items. While sample ability may
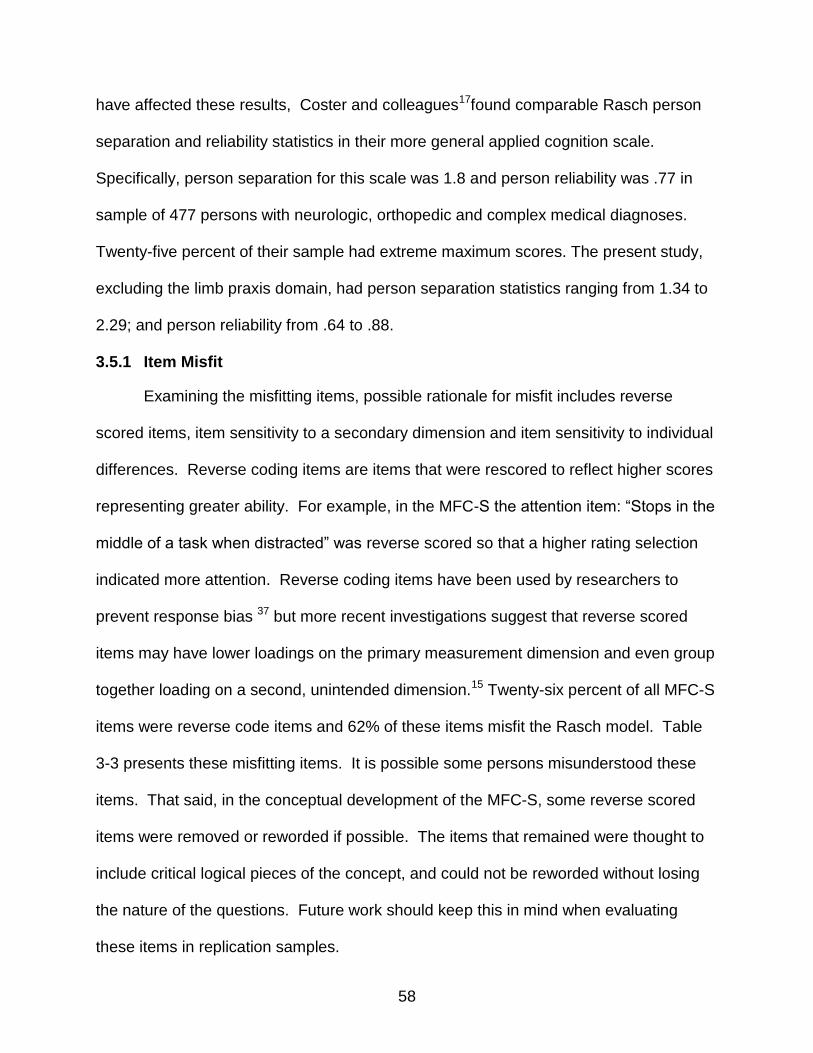
58
have affected these results, Coster and colleagues17found comparable Rasch person
separation and reliability statistics in their more general applied cognition scale.
Specifically, person separation for this scale was 1.8 and person reliability was .77 in
sample of 477 persons with neurologic, orthopedic and complex medical diagnoses.
Twenty-five percent of their sample had extreme maximum scores. The present study,
excluding the limb praxis domain, had person separation statistics ranging from 1.34 to
2.29; and person reliability from .64 to .88.
3.5.1 Item Misfit
Examining the misfitting items, possible rationale for misfit includes reverse
scored items, item sensitivity to a secondary dimension and item sensitivity to individual
differences. Reverse coding items are items that were rescored to reflect higher scores
representing greater ability. For example, in the MFC-S the attention item: “Stops in the
middle of a task when distracted” was reverse scored so that a higher rating selection
indicated more attention. Reverse coding items have been used by researchers to
prevent response bias 37 but more recent investigations suggest that reverse scored
items may have lower loadings on the primary measurement dimension and even group
together loading on a second, unintended dimension.15 Twenty-six percent of all MFC-S
items were reverse code items and 62% of these items misfit the Rasch model. Table
3-3 presents these misfitting items. It is possible some persons misunderstood these
items. That said, in the conceptual development of the MFC-S, some reverse scored
items were removed or reworded if possible. The items that remained were thought to
include critical logical pieces of the concept, and could not be reworded without losing
the nature of the questions. Future work should keep this in mind when evaluating
these items in replication samples.
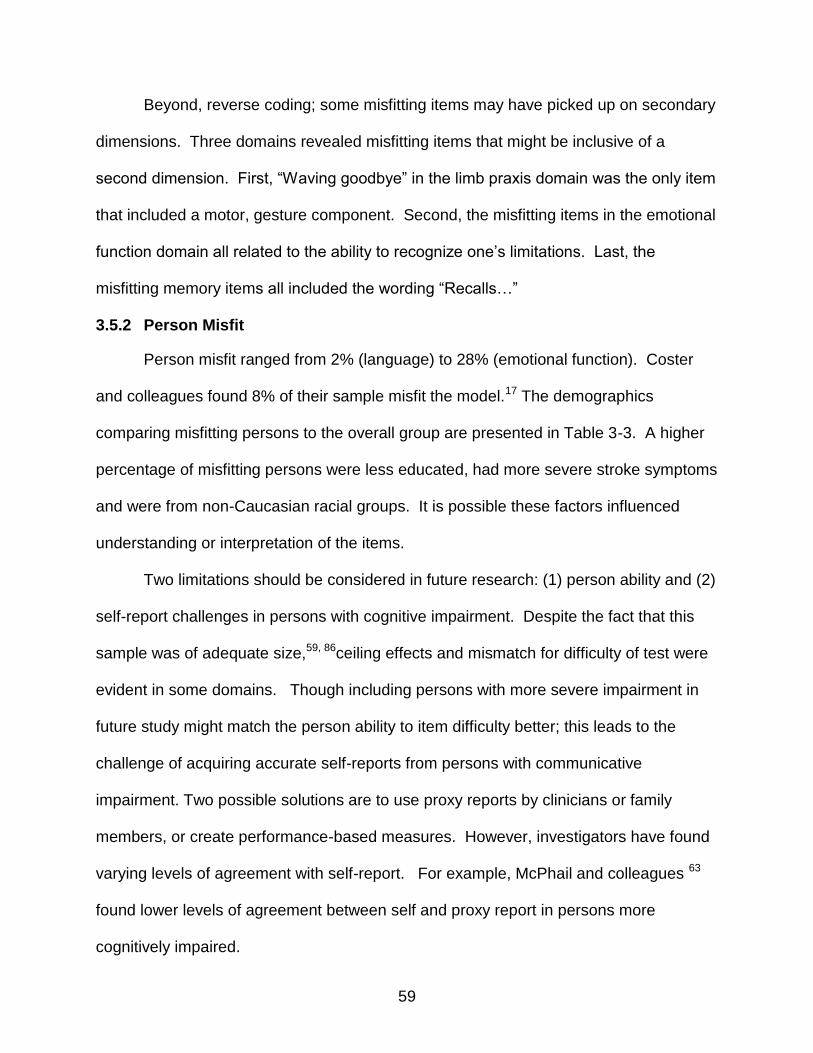
59
Beyond, reverse coding; some misfitting items may have picked up on secondary
dimensions. Three domains revealed misfitting items that might be inclusive of a
second dimension. First, “Waving goodbye” in the limb praxis domain was the only item
that included a motor, gesture component. Second, the misfitting items in the emotional
function domain all related to the ability to recognize one’s limitations. Last, the
misfitting memory items all included the wording “Recalls…”
3.5.2 Person Misfit
Person misfit ranged from 2% (language) to 28% (emotional function). Coster
and colleagues found 8% of their sample misfit the model.17 The demographics
comparing misfitting persons to the overall group are presented in Table 3-3. A higher
percentage of misfitting persons were less educated, had more severe stroke symptoms
and were from non-Caucasian racial groups. It is possible these factors influenced
understanding or interpretation of the items.
Two limitations should be considered in future research: (1) person ability and (2)
self-report challenges in persons with cognitive impairment. Despite the fact that this
sample was of adequate size,59, 86ceiling effects and mismatch for difficulty of test were
evident in some domains. Though including persons with more severe impairment in
future study might match the person ability to item difficulty better; this leads to the
challenge of acquiring accurate self-reports from persons with communicative
impairment. Two possible solutions are to use proxy reports by clinicians or family
members, or create performance-based measures. However, investigators have found
varying levels of agreement with self-report. For example, McPhail and colleagues 63
found lower levels of agreement between self and proxy report in persons more
cognitively impaired.

60
3.5.3 Conclusion
These results support the use of the MFC-S in research and rehabilitation
settings. Though future work will further inform these results, this measure is a basis
measuring functional cognition in persons with stroke. Future work should focus on
evaluating: (1) how the MFC-S relates to other measures of cognition (2) new items that
might extend the difficulty of ceiling domains, (3) re-conceptualizing and developing new
items for the limb praxis domain and (4) evaluate the item statistics of reverse coded
items.
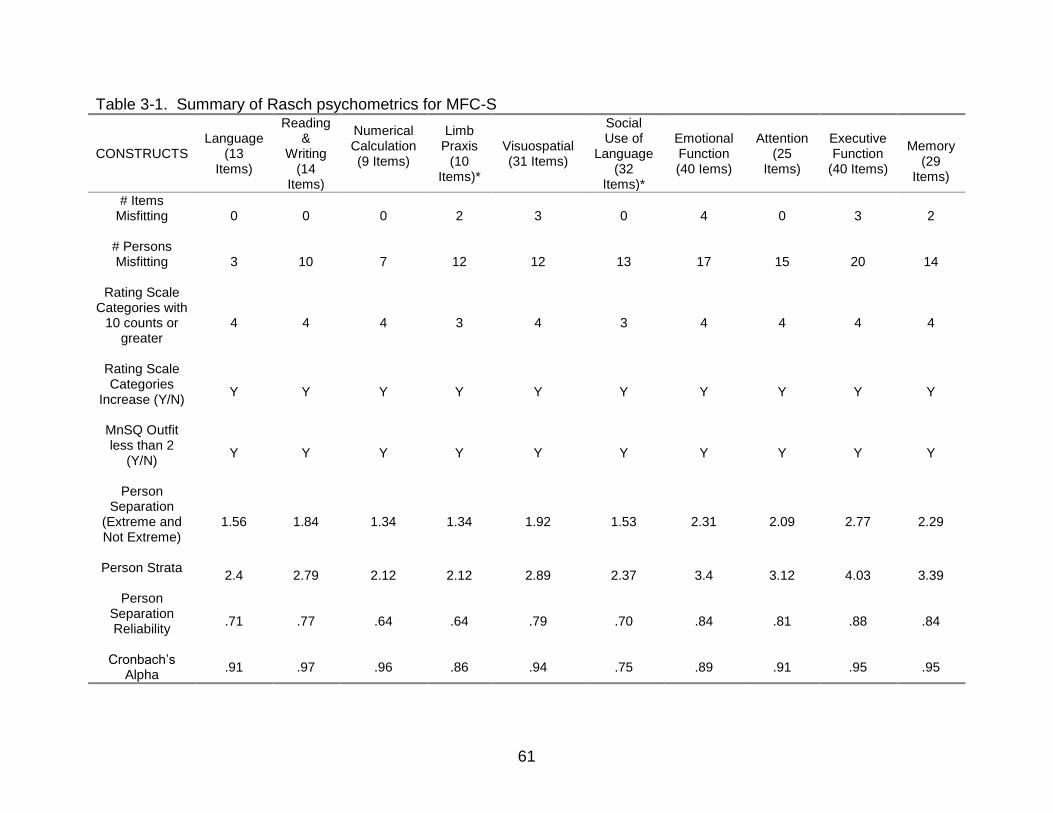
61
Table 3-1. Summary of Rasch psychometrics for MFC-S
CONSTRUCTS Language
(13 Items)
Reading &
Writing (14
Items)
Numerical Calculation (9 Items)
Limb Praxis
(10 Items)*
Visuospatial (31 Items)
Social Use of
Language (32
Items)*
Emotional Function (40 Iems)
Attention (25
Items)
Executive Function
(40 Items)
Memory
(29 Items)
# Items Misfitting
0 0 0 2 3 0 4 0 3 2
# Persons Misfitting
3 10 7 12 12 13 17 15 20 14
Rating Scale Categories with
10 counts or greater
4 4 4 3 4 3 4 4 4 4
Rating Scale Categories
Increase (Y/N)
Y Y Y Y Y Y Y Y Y Y
MnSQ Outfit less than 2
(Y/N)
Y Y Y Y Y Y Y Y Y Y
Person Separation
(Extreme and Not Extreme)
1.56 1.84 1.34 1.34 1.92 1.53 2.31 2.09 2.77 2.29
Person Strata
2.4 2.79 2.12 2.12 2.89 2.37 3.4 3.12 4.03 3.39
Person Separation Reliability
.71 .77 .64 .64 .79 .70 .84 .81 .88 .84
Cronbach’s Alpha
.91 .97 .96 .86 .94 .75 .89 .91 .95 .95
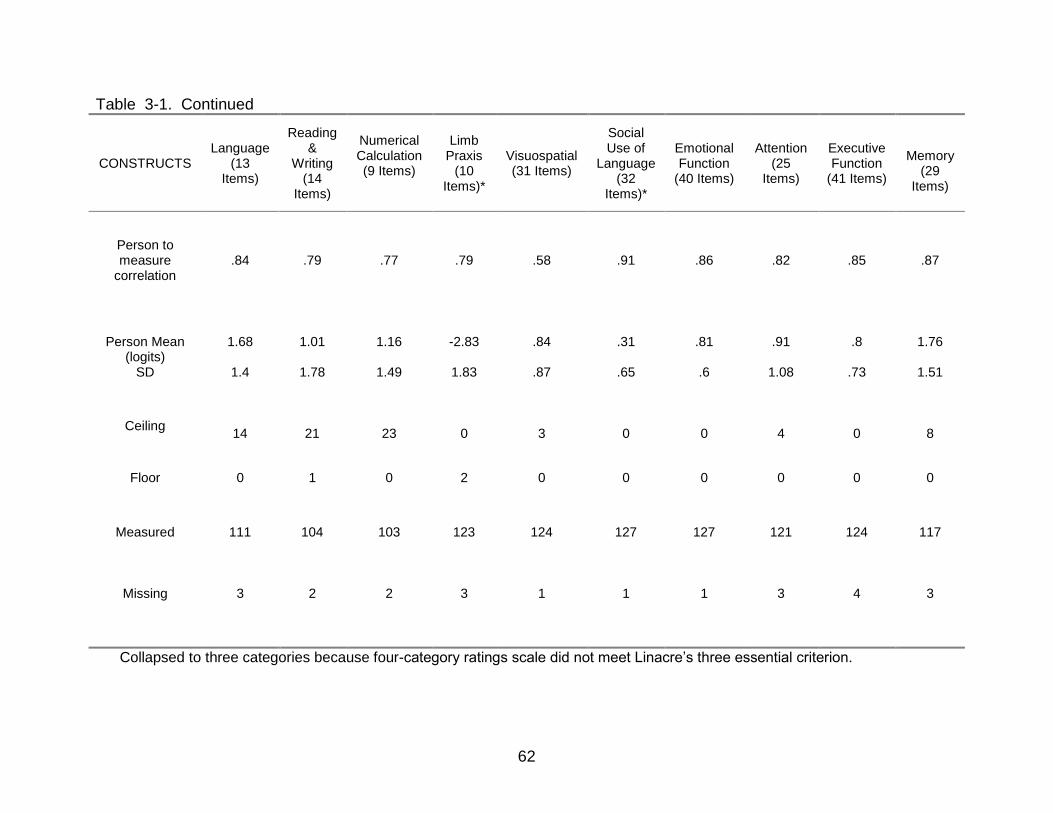
62
Table 3-1. Continued
CONSTRUCTS Language
(13 Items)
Reading &
Writing (14
Items)
Numerical Calculation (9 Items)
Limb Praxis
(10 Items)*
Visuospatial (31 Items)
Social Use of
Language (32
Items)*
Emotional Function
(40 Items)
Attention (25
Items)
Executive Function
(41 Items)
Memory
(29 Items)
Person to measure
correlation .84 .79 .77 .79 .58 .91 .86 .82 .85 .87
Person Mean (logits)
SD
1.68
1.4
1.01
1.78
1.16
1.49
-2.83
1.83
.84
.87
.31
.65
.81
.6
.91
1.08
.8
.73
1.76
1.51
Ceiling
14 21 23 0 3 0 0 4 0 8
Floor 0 1 0 2 0 0 0 0 0 0
Measured
Missing
111
3
104
2
103
2
123
3
124
1
127
1
127
1
121
3
124
4
117
3
Collapsed to three categories because four-category ratings scale did not meet Linacre’s three essential criterion.
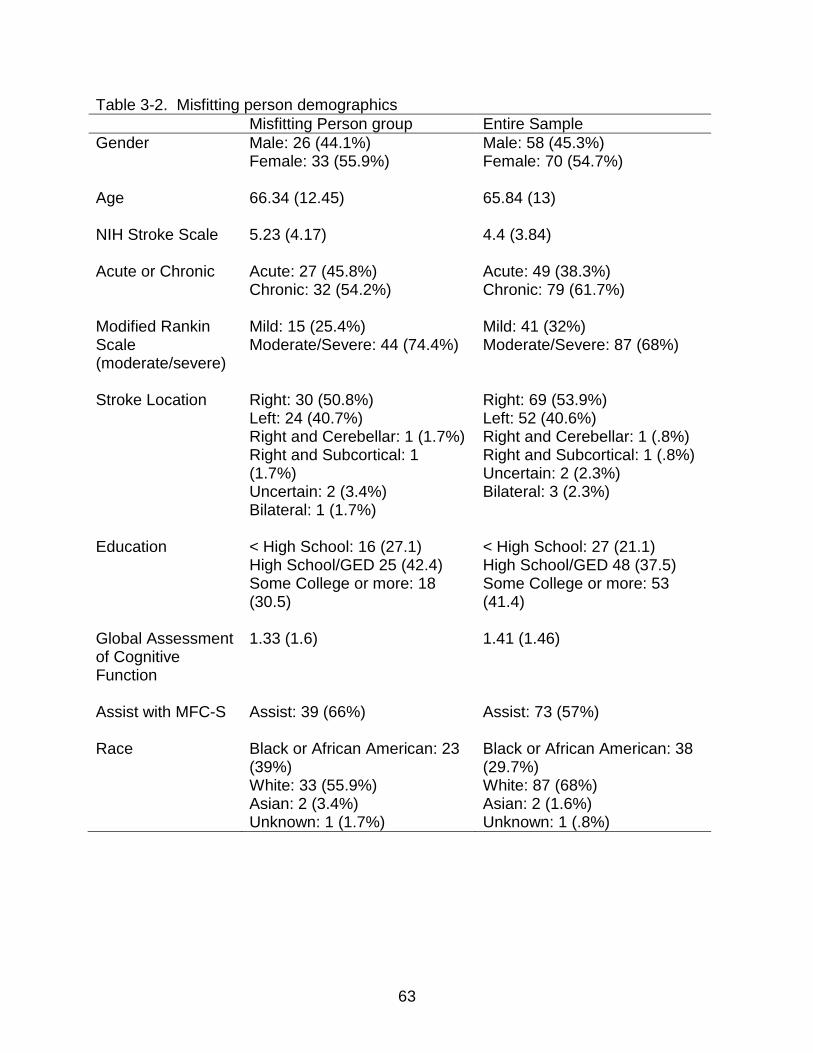
63
Table 3-2. Misfitting person demographics
Misfitting Person group Entire Sample
Gender Male: 26 (44.1%) Female: 33 (55.9%)
Male: 58 (45.3%) Female: 70 (54.7%)
Age 66.34 (12.45)
65.84 (13)
NIH Stroke Scale 5.23 (4.17)
4.4 (3.84)
Acute or Chronic Acute: 27 (45.8%) Chronic: 32 (54.2%)
Acute: 49 (38.3%) Chronic: 79 (61.7%)
Modified Rankin Scale (moderate/severe)
Mild: 15 (25.4%) Moderate/Severe: 44 (74.4%)
Mild: 41 (32%) Moderate/Severe: 87 (68%)
Stroke Location Right: 30 (50.8%) Left: 24 (40.7%) Right and Cerebellar: 1 (1.7%) Right and Subcortical: 1 (1.7%) Uncertain: 2 (3.4%) Bilateral: 1 (1.7%)
Right: 69 (53.9%) Left: 52 (40.6%) Right and Cerebellar: 1 (.8%) Right and Subcortical: 1 (.8%) Uncertain: 2 (2.3%) Bilateral: 3 (2.3%)
Education < High School: 16 (27.1) High School/GED 25 (42.4) Some College or more: 18 (30.5)
< High School: 27 (21.1) High School/GED 48 (37.5) Some College or more: 53 (41.4)
Global Assessment of Cognitive Function
1.33 (1.6) 1.41 (1.46)
Assist with MFC-S
Assist: 39 (66%) Assist: 73 (57%)
Race Black or African American: 23 (39%) White: 33 (55.9%) Asian: 2 (3.4%) Unknown: 1 (1.7%)
Black or African American: 38 (29.7%) White: 87 (68%) Asian: 2 (1.6%) Unknown: 1 (.8%)

64
Table 3-3. Reverse coding items
Domain Item (s)
Limb Praxis Is clumsy when using tools. Visuospatial Paralyzed limb hangs over wheelchair
Bumps into doorway on left side. Gets lost in new setting.
Social Language Goes on and on without giving another persons a chance to talk.
Emotional Function Does not know why things are difficult. Attempts to do harmful things. Attempts tasks that require thinking skills beyond ability. Does not know why things are difficult since having a stroke.
Attention Stops in the middle of a task when distracted. Pays attention to the wrong conversation.
Executive Function Tries to do an activity before having the ability to do it. Takes things literally.
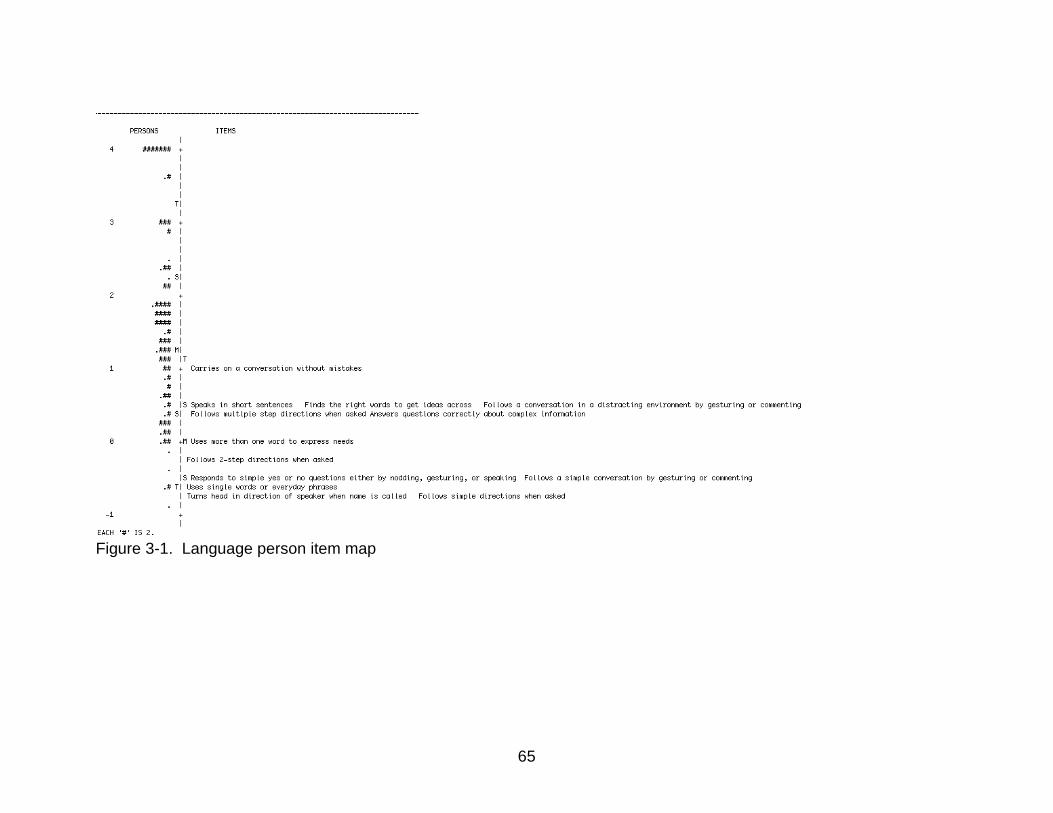
65
Figure 3-1. Language person item map
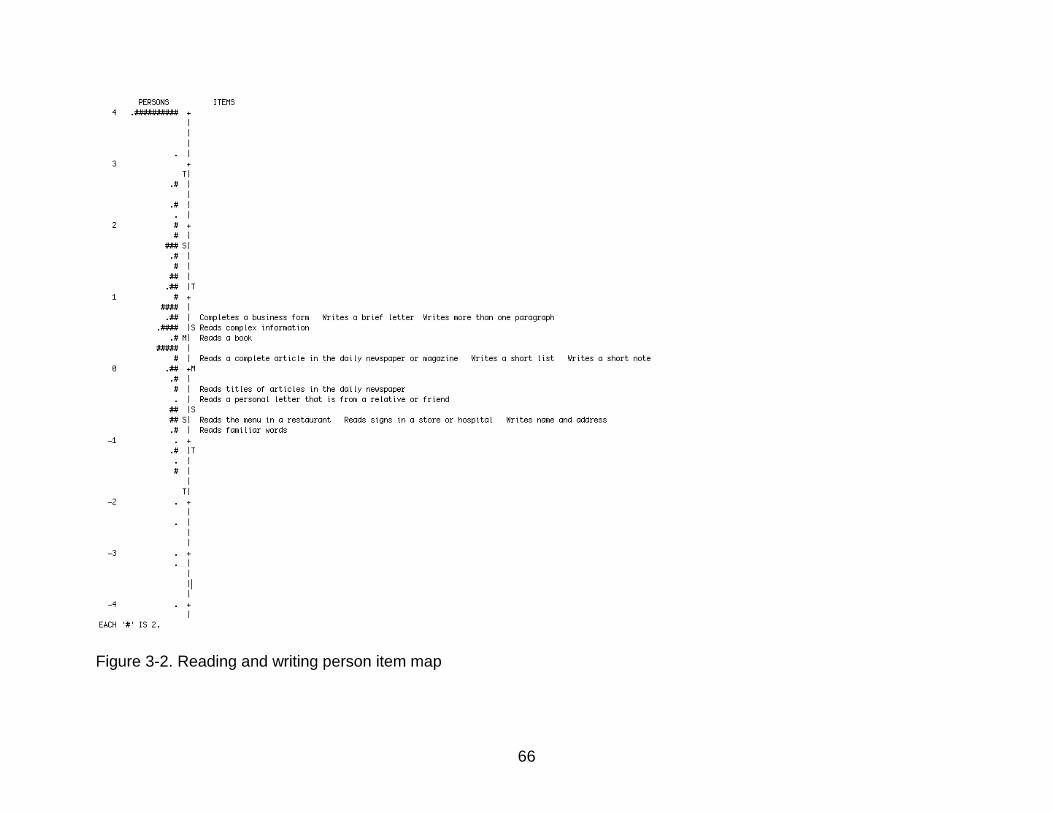
66
Figure 3-2. Reading and writing person item map

67
Figure 3-3. Numerical calculation person item map
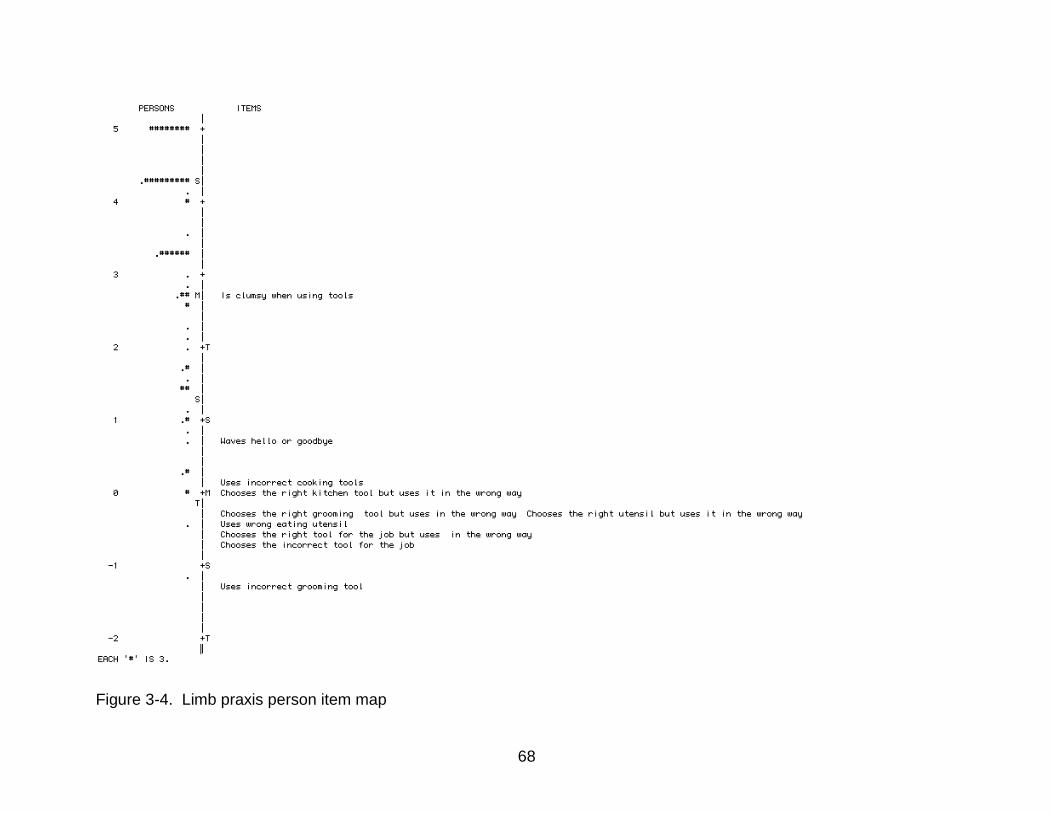
68
Figure 3-4. Limb praxis person item map
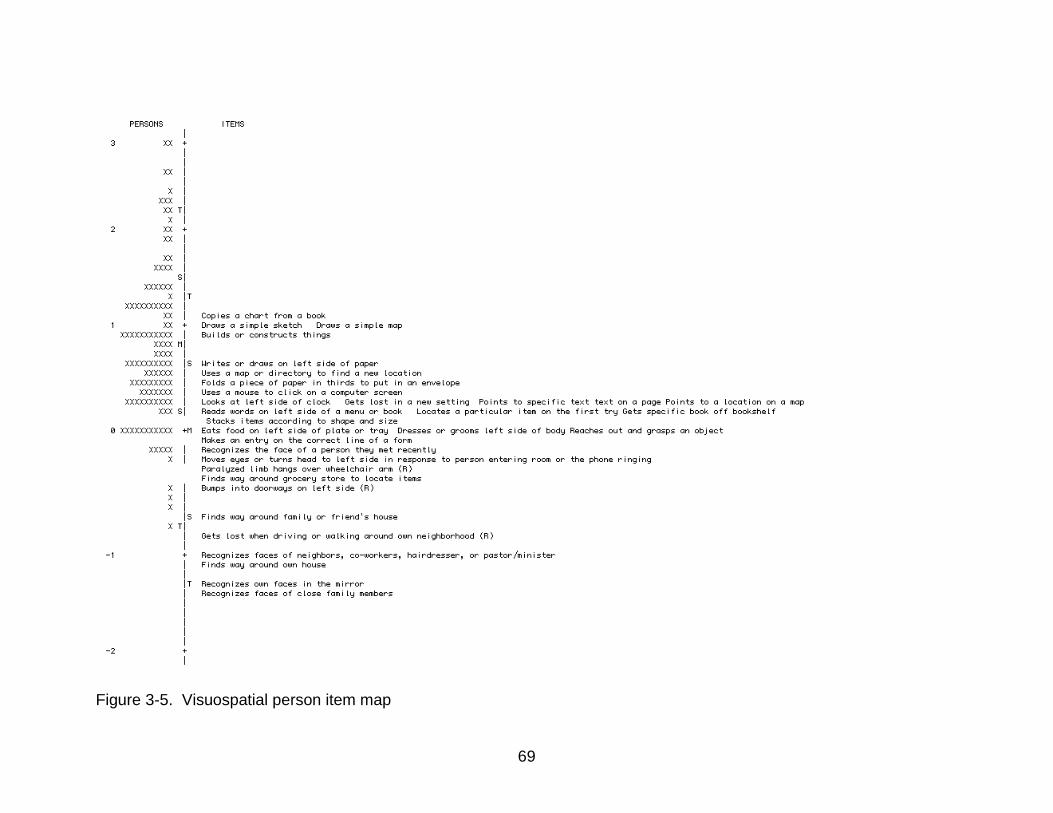
69
Figure 3-5. Visuospatial person item map
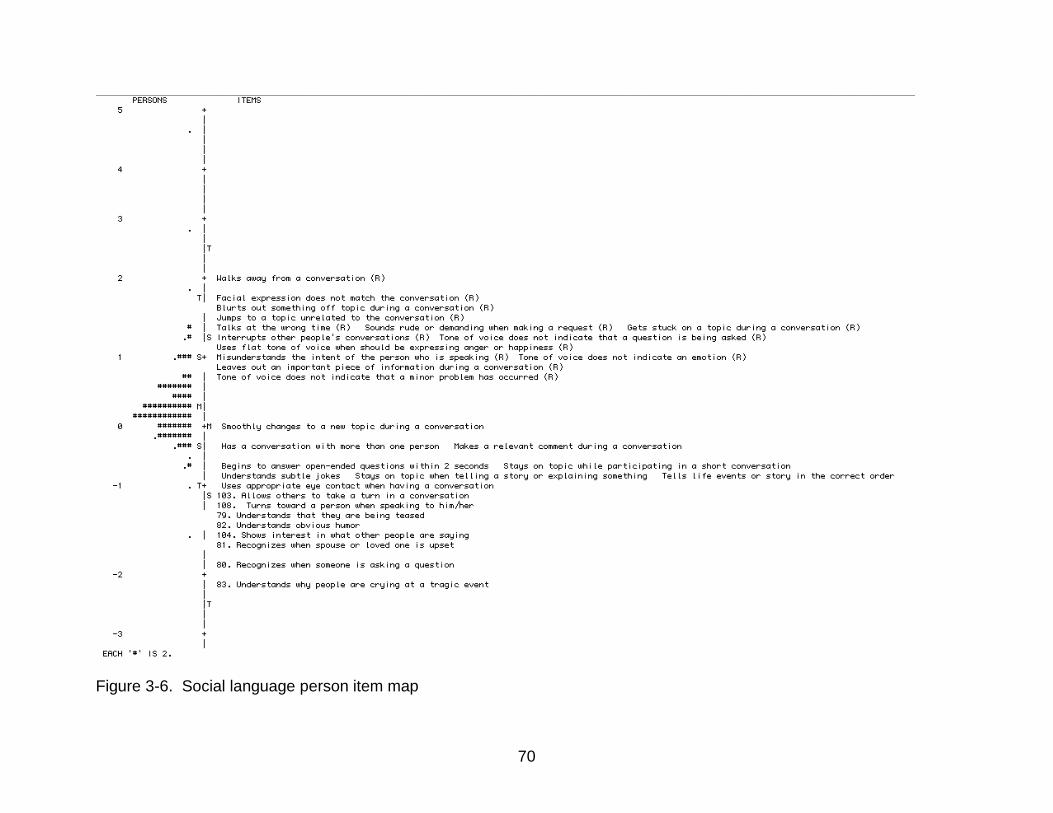
70
Figure 3-6. Social language person item map
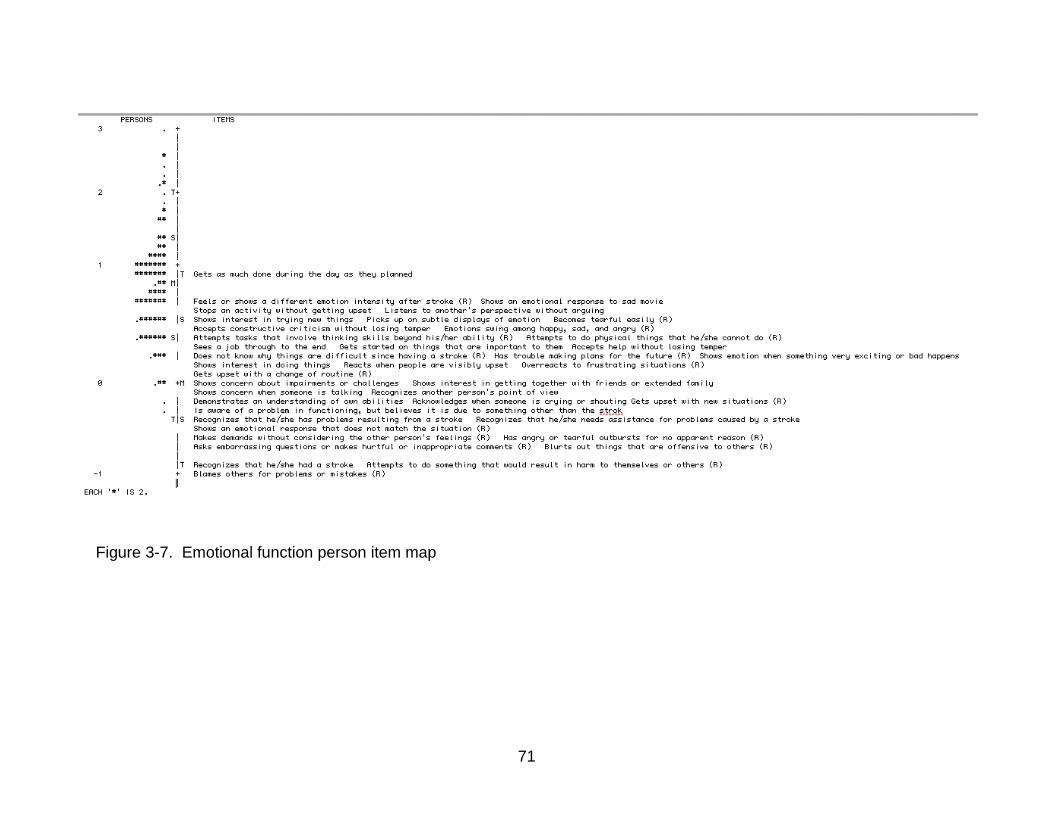
71
Figure 3-7. Emotional function person item map
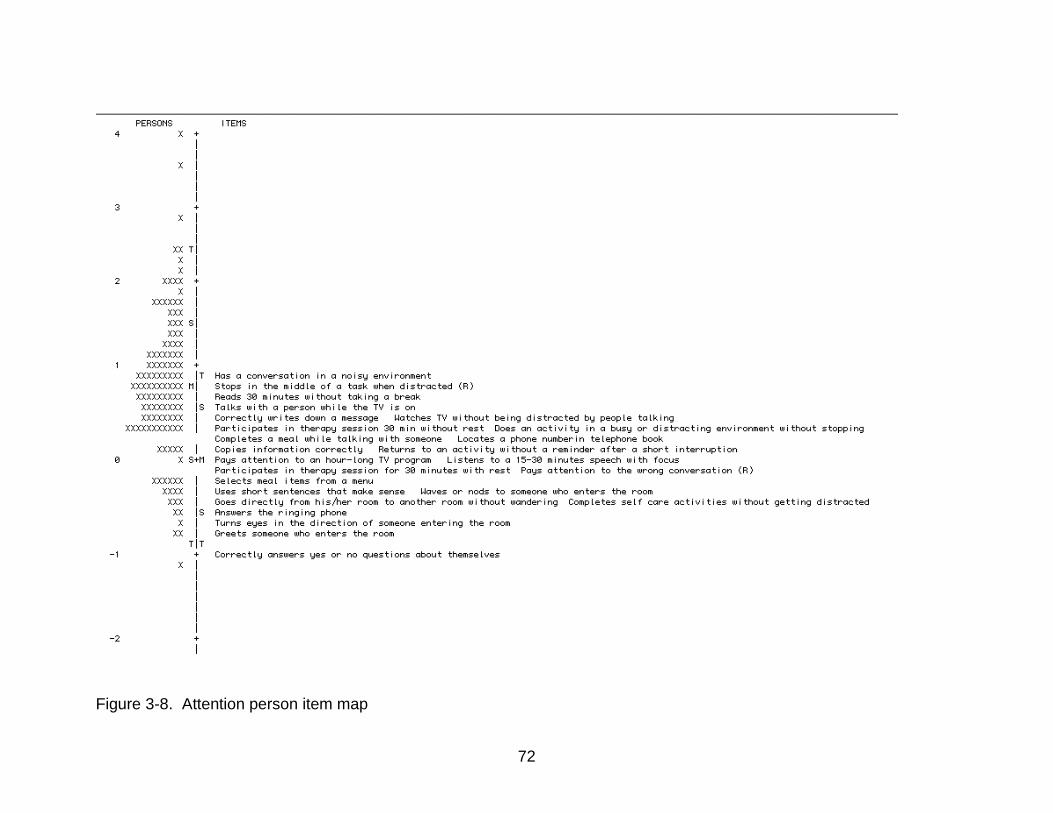
72
Figure 3-8. Attention person item map
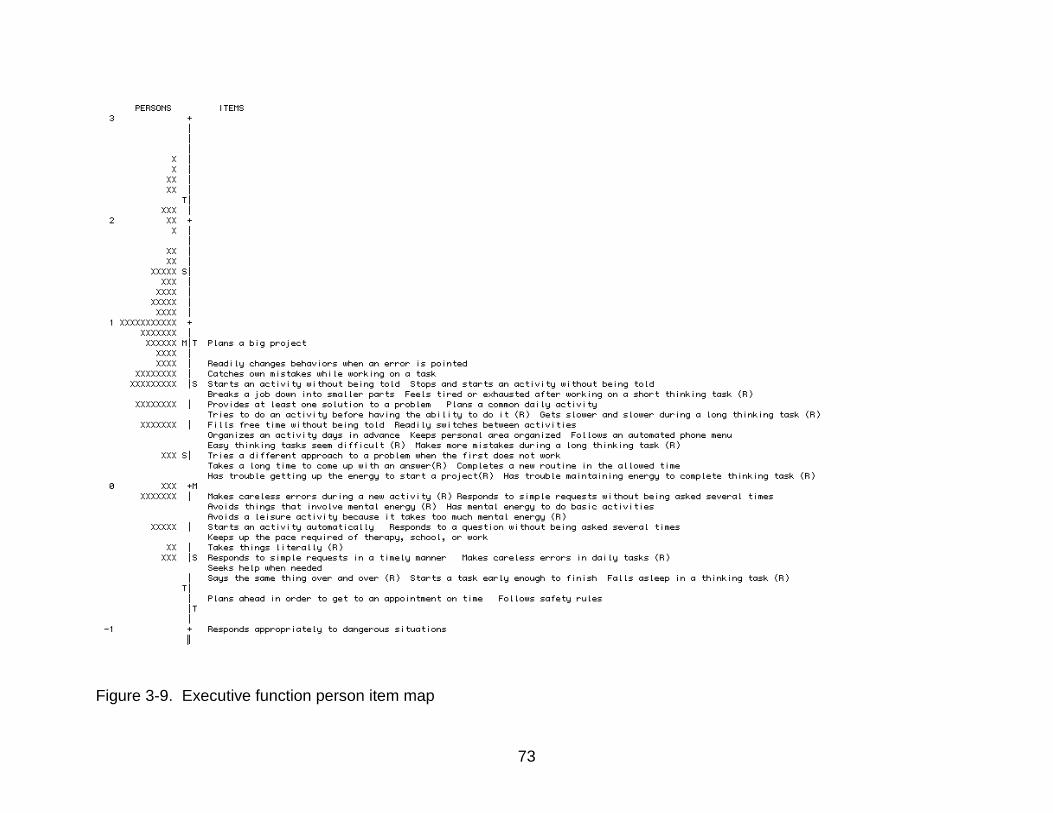
73
Figure 3-9. Executive function person item map
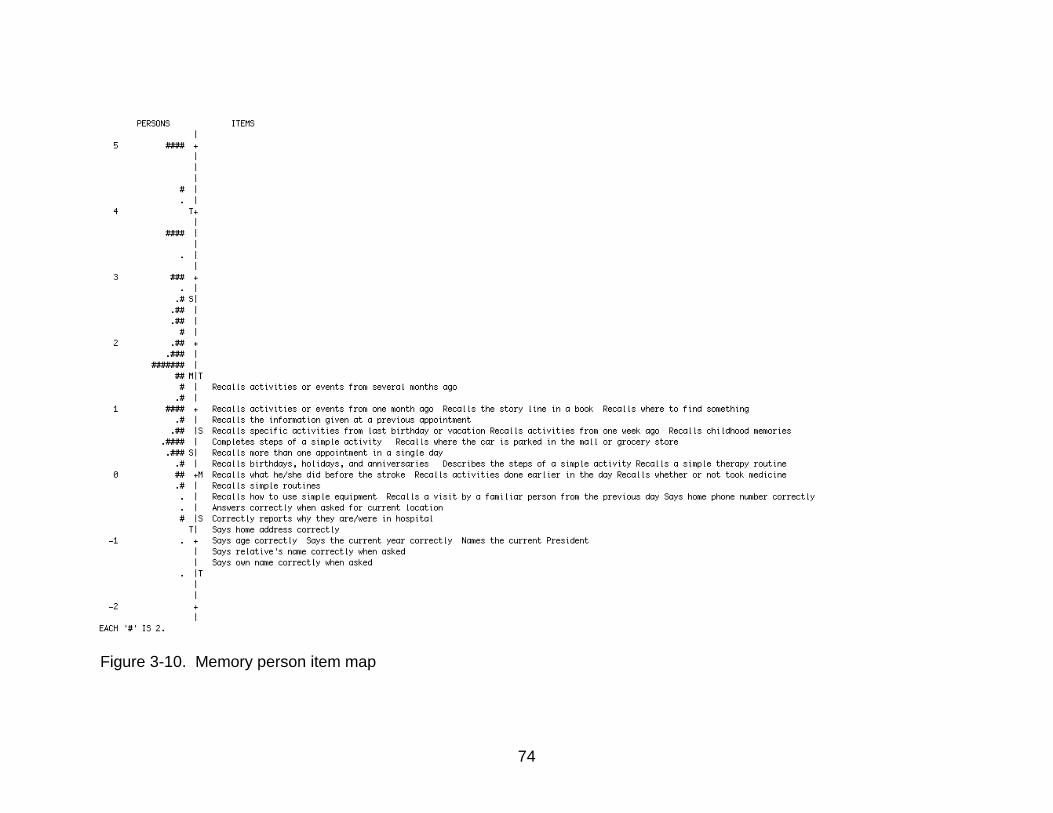
74
Figure 3-10. Memory person item map
75
CHAPTER 4 A VALIDITY STUDY OF A MEASURE OF FUNCTIONAL COGNITION FOR PERSONS
WITH STROKE
Our research team recently developed the MFC -S to encompass everyday tasks
that rely heavily on cognition. 23 Cognition is thought to include multiple secondary
dimensions.10-12 Following qualitative work including a literature review and expert panel
recommendation, the MFC-S included items specific to the cognitive impairment
observed in persons with stroke, covering ten cognitive domains: (1) Language (2)
Reading and writing (3) Numerical calculation (4) Limb praxis (5) Visuospatial ability (6)
Social language (7) Emotional function (8) Attention (9) Executive function and (10)
Memory.
A critical component to instrument development is evaluation of validity. That is,
does the used measure provide a meaningful outcome score given the intended goal?16
Determining the validity of a newly developed applied cognitive measure is important,
especially since this instrument intends to capture the implications of cognitive deficits
on everyday life. Two types of evidence used to evaluate validity include: (1) comparing
an instrument to other instruments thought to measure a similar construct, and (2)
evaluating how an instrument predicts group membership.16 Cognitive researchers
have used more fundamental measures of cognition, as well as existing every day
measures thought to measure a similar construct to examine concurrent validity.2
Additionally, the ten domains of the MFC-S were developed based on cognitive
impairments observed in persons with stroke. For example, persons with a left sided
cerebrovascular accident (CVA) are more likely to have impairments with expressive or
receptive speech. Alternatively, persons with a right hemisphere CVA are more likely to
experience visuospatial impairments. If the MFC-S measures the functional cognition of

76
stroke, we should be able to predict whether a person has a left or right hemisphere
CVA.
This study examines the validity of the MFC-S, answering two questions. First,
what is the relationship between person scores measures on the MFC-S and traditional
neuropsychological measures of cognition from similar domains? Second, can the
MFC-S predict group membership? That is, does the profile of person scores, and for
which domains, predict whether a person has had a right or left hemisphere stroke?
4.1 Methods
4.1.1 Participants
Approval for this study was obtained through the IRB-01 at the University of
Florida. Each participant signed an informed consent approved by the IRB.
Participants were recruited at local rehabilitation hospitals, outpatient clinics, area
hospitals, and doctors’ offices. Participants in this study represent a stratified random
sample, based on acute/chronic and mild (Modified Rankin score 0-2) or moderate
(Modified Rankin Score (3-5), from the larger sample (n=128) who took the MFC-S.
This sample included 62 persons with stroke (acute = 22: right CVA = 17; left CVA = 3;
other = 2; chronic = 40: right CVA = 19; left CVA = 16; other = 5). Detailed participant
characteristics are presented in Table 4-1. Participants with stroke were included in this
study according to the following criteria: Inclusion criteria: (1) 20 to 89 years of age, (2)
confirmed diagnosis of stroke (ischemic or intracerebral hemorrhage) based on medical
records, (3) acute (7-21 days post onset) or chronic stroke (three months to one year)
(4) english speaker. Exclusion criteria: (1) subarachnoid hemorrhage, brainstem stroke,
intracranial hemorrhage due to rupture aneurysm or arteriovenous malformation, (2)
previous stroke on the same side of the brain, (3) preexisting neurological disease (such

77
as Parkinson’s disease, amyotrophic lateral sclerosis, multiple sclerosis, dementia), (4)
history of head trauma that resulted in residual neurological deficits, (5) legal blindness
or severe visual impairment, (6) history of significant psychiatric illness (such as bipolar
affective disorder, psychosis, schizophrenia, or medication refractory depression) that
affects their cognitive function, (7) unresponsive to stimulation, (8) unintelligible to
others, or unable to speak, (9) global aphasia (unable to understand or express).
4.1.2 Instrumentation
4.1.2.1 The MFC-S
The MFC-S is a questionnaire type measure that includes 244 items over 10
domains: language – 12 items, reading/writing – 14 items, numeric calculation – 9
items, limb praxis – 10 items, visuospatial function – 31 items, social use of language –
32 items, emotional function – 40 items, attention – 25 items, executive function – 41
items, memory – 29 items. Respondents rated their ability of performing a task in the
past week on a 4-point likert scale. Example items include: (1) Responds to simple yes
or no questions either by nodding, gesturing, or speaking, and (2) Has trouble making
plans for the future. Traditional Neuropsychologicall Measures: Table 4-2 presents
MFC-S domains and corresponding neuropsychological measures, described further
below.
4.1.2.2 Repeatable Battery for the Assessment of Neuropsychological Status (RBANS)72
The RBANS has been used to screen general cognitive function in a variety of
diagnoses31, 38, 50, 51, 65, 69, 72, including persons with stroke . The RBANS contains 12
subtests that constitute 5 index scores: (1) The immediate memory index comprises the
subtests of list learning and story memory; (2) Figure copy and line orientation yield the
78
visuospatial/constructional index; (3) Picture naming and semantic fluency yield the
language index; (4) the attention index contains the digit span and coding subtests; (5)
the delayed memory index includes list recall, list recognition, story recall, and figure
recall subtests. We used: (1) the language index score to examine relationship with the
MFC-S language domain; (2) index score of visuospatial construction to examine
relationship with the MFC-S visuospatial domain; (3) the index score of immediate
memory and the index score of delayed memory to examine relationship with the MFC-
S learning and memory domain; and (4) the index score of attention to examine
relationship with the MFC-S attention domain.
4.1.2.3 Digit Symbol-Coding
The Digit Symbol Coding, a subtest of the Wechsler Adult Intelligence Scale third
edition (WAIS III)87 was used to assess processing speed. A list of matched numbers
and symbols is presented to the participant who is then asked to copy the symbols
under the boxes of the numbers as fast as they can within 120 seconds. The number of
correct responses is recorded. The WAIS-III coding scale was seleted to compare to
MFC-S scores on the attention domain.
4.1.2.4 Behavior Rating Inventory of Executive Functions –Adult (BRIEF)
The Behavior Rating Inventory of Executive Function Adult Version (BRIEF-A)
contains eight subscales.74 The BRIEF is a questionnaire consisting of 75 items
assessing executive behaviors. Three-point rating scale of the BRIEF ranges from 1 to
3, with 1 representing “never”, 2 representing “sometimes”, and 3 representing “often”.
The Emotional Control subscale scores were compared to the MFC-S emotional
function scores. The inhibit, shift, metacognition, and self-monitor scores were
compared to the MFC-S executive function scores.
79
4.1.2.5 Functional Assessment of Communication Skills for Adults (ASHA-FACS)30
The ASHA-FACS contains a social communication subscale of 21 items. On a
seven point rating scale, persons rate their ability on items such as: “Understands tone
of voice” or “Initiates communication with other people.” The score of the social
communication subscale was compared to the MFC-S social language score.
4.1.2.6 Center for Epidemiologic Studies – Depression Scale (CES-D)
The CES-Dis a 20 item self-report scale designed to assess a person’s level of 6
depression domains: depressed mood, feeling of worthlessness, feeling of
helplessness, psychomotor retardation, loss of appetite and sleep disturbance. The
questionnaire is rated on the frequency of experiencing depression-related symptoms in
the past week. The four point scale ranges from 0 – rarely or none of the time to 3 –
most or all of the time. CES-D scores range from 0-60 with higher scores indicative of
higher depression symptoms. CES-D scores were compared to MFC-S emotional
function scores.
4.1.2.7 Wechsler Individual Achievement Tests (WIAT-II)79
The WIAT-II is a standardized test for measuring achievement. The full-length
assessment contains 9 subscales to assess academic achievement. We used the
Word Reading, Spelling and Numerical Calculation subtests to examine the relationship
with: (1) the MFC-S reading & writing domain (WIAT- II word reading and spelling); and
(2) the MFC-S numerical calculation domain (WIAT - II numerical calculation).
4.1.2.8 Trails A & B
The Trail Making Test (TMT) is a timed test and includes parts A and B, which
are both visual scanning tasks.80 The TMT integrates recognition of numbers and

80
letters and perception of spatial distribution. The Trails A requires connecting dots in
sequential order of numbers whereas the Trails B requires connecting dots alternating
sequential letters and numbers. We used the Trails A index score to examine the
relationship with the MFC-S attention domain. The Trails B index score, and the Trails
B/A raw score to examine the relationship with the executive function domain.3 Some
investigators have used the difference score between Trails A and B or the ratio of the
Trails B to A to differentiate the processing speed component of Trails A from the
switching component of Trails B.49
4.1.2.9 Delis Kaplan Executive Functions Scale (D-KEFS) Sorting Test20
The D-KEFS Sorting Test has two parts: a sort recognition condition and a free
sort condition. In the free sorting condition the participant sorts cards into groups
according to stimulus words or patterns on the cards. In the sort recognition condition
the examinee attempts to describe the grouping rule the examiner uses to sort the
cards. The D-KEFS Sorting allows for evaluation of several components of executive
function such as problem solving, initiation and inhibition. The scores of the sorting test
were compared to the MFC-S executive function score.
4.1.2.10 Mini - Florida Apraxia Battery (Mini-FAB)
The Florida Apraxia Battery (FAB) was chosen to assess praxis ability and has
been used in studies with persons with stroke29, 35, 68, 70, 75. Subtest 5, gesture to
command, was used in this study. Example items include “Show me how you wave
goodbye”, or “Show me how you hammer a nail”. Participants were given verbal
instruction to gesture or pretend to use a tool as if they were actually holding the tool in
the hand. Persons were scored pass/fail if they could perform the gesture on 30 praxis
items. FAB scores were compared to MFC-S limb praxis domain scores.
81
4.1.3 Administration Procedure
Research assistants, trained by a neuropsychologist, administered all the
assessments. Assessment sessions occurred within the hospital room (acute patients),
or within the patient’s home (chronic patients). The MFC-S was administered in a self-
report format (versus interview format) 43 percent of the time for patients. As with the
MFC-S domains, the ordering of the neuropsychological/ functional assessment battery
was counterbalanced.
4.1.4 Data Analysis
Correlation, profile analysis and logistic regression were used to evaluate the
validity of the MFC-S. Pearson correlations were computed in SPSS vs 21 40between
the neuropsychological measures and the corresponding domains of the MFC-S to
examine the relationship between the traditional neuropsychological measures and the
MFC-S domains. In order to control for family wise error rate, for each domain that had
more than one comparison, we report the p value from the statistical output, then use
the Bonferroni correction26 (α / number of comparisons) to evaluate significance at the p
= .05 level. So, if there are three comparisons for a domain, we would need the
reported p value to be .05/3 = .017 to reach statistical significance, controlling for
multiple comparisons. . We predicted to find significant correlations between
comparable constructs.
Next, a profile analysis was done comparing right hemisphere CVA and left
hemisphere CVA groups. As persons with stroke often present with cognitive
impairment based on the side of their CVA, we predicted that persons with left and right
hemisphere stroke would present with a different pattern of scores. Lastly, we
82
performed a logistic regression; following the profile analysis to assess which domains
significantly predicted group membership (i.e. left or right hemisphere CVA).
4.2 Results
4.2.1 Correlation with concurrent measures
Table 4-3 presents the correlation results for the MFC-S domains with
comparison measures. Seven of the ten domains had statistically significant
correlations with at least some of the comparison measures. Significant correlations
ranged from .26 between the ASHA FACS and the social language domain to .62
between the BRIEF shift subtest and the executive function domain. P values available
from the statistical output are reported. Two significant p values could be considered
non significant, at the p < .05 level, with Bonferroni correction: (1) The RBANS
immediate memory in the memory domain (Bonferroni correction p value = .025) and (2)
the D-KEFS Sort Recognition in the executive function domain (Bonferroni correction p
value = .006).
4.2.2 Profile Analysis
Figure 4-1 illustrates the profile of MFC-S domain scores comparing persons with
a left CVA to right CVA. From visual inspection, persons with a left CVA tended to
perform worse on all domains except the language and visuospatial domains. Data
screening was done and three persons had missing data so were removed from further
analysis. In order to meet the commensurate scales assumption, the scores from each
domain were transformed using a Blom transformation. The Box’s M test was not
significant at the .001 level, F(55, 38018) = 1.342, p = .05, but our sample sizes were
unequal: right CVA: n=62, left CVA: n=52. However, as the Levene’s test was non
significant for unequal variances, assumptions were satisfied to proceed with the
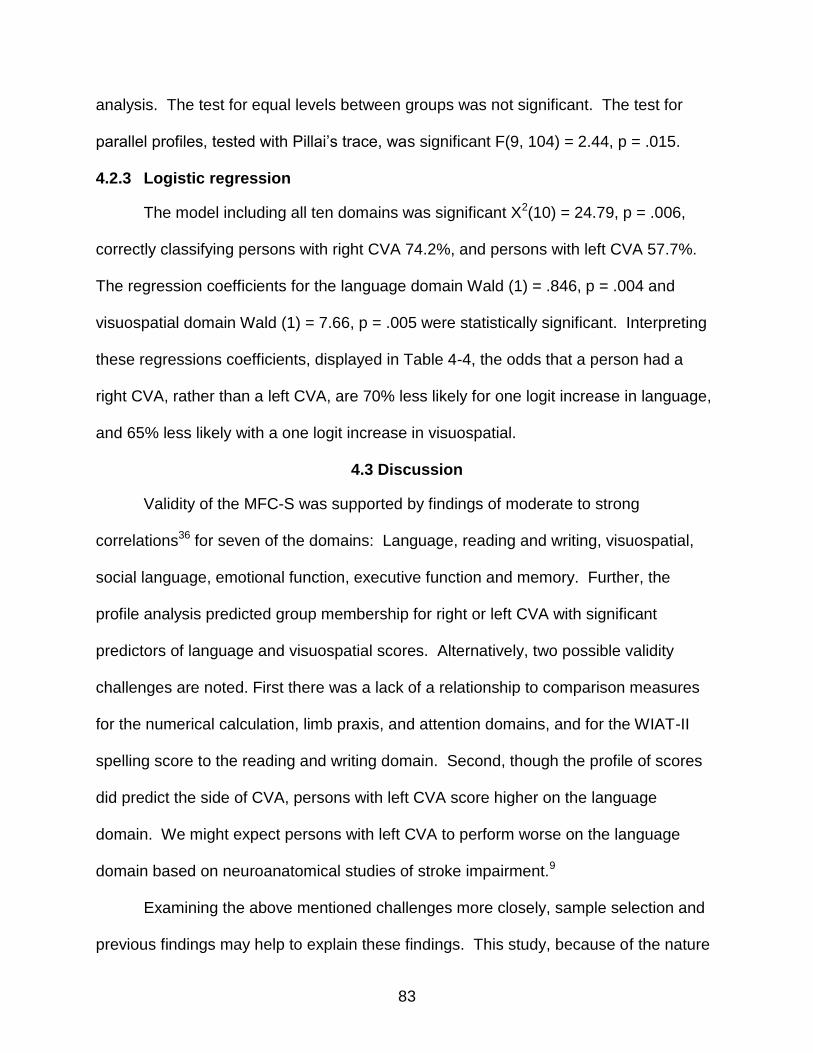
83
analysis. The test for equal levels between groups was not significant. The test for
parallel profiles, tested with Pillai’s trace, was significant F(9, 104) = 2.44, p = .015.
4.2.3 Logistic regression
The model including all ten domains was significant X2(10) = 24.79, p = .006,
correctly classifying persons with right CVA 74.2%, and persons with left CVA 57.7%.
The regression coefficients for the language domain Wald (1) = .846, p = .004 and
visuospatial domain Wald (1) = 7.66, p = .005 were statistically significant. Interpreting
these regressions coefficients, displayed in Table 4-4, the odds that a person had a
right CVA, rather than a left CVA, are 70% less likely for one logit increase in language,
and 65% less likely with a one logit increase in visuospatial.
4.3 Discussion
Validity of the MFC-S was supported by findings of moderate to strong
correlations36 for seven of the domains: Language, reading and writing, visuospatial,
social language, emotional function, executive function and memory. Further, the
profile analysis predicted group membership for right or left CVA with significant
predictors of language and visuospatial scores. Alternatively, two possible validity
challenges are noted. First there was a lack of a relationship to comparison measures
for the numerical calculation, limb praxis, and attention domains, and for the WIAT-II
spelling score to the reading and writing domain. Second, though the profile of scores
did predict the side of CVA, persons with left CVA score higher on the language
domain. We might expect persons with left CVA to perform worse on the language
domain based on neuroanatomical studies of stroke impairment.9
Examining the above mentioned challenges more closely, sample selection and
previous findings may help to explain these findings. This study, because of the nature

84
of self-report, necessitated that persons with severe communication impairment were
not included. This may have biased the left hemisphere group to be less inclusive of the
language impairment associated with left sided CVA, thus influencing our results. Also,
when developing items for the MFC-S, there was not an intention to separate right from
left CVA, but to include items that were more descriptive of the cognitive impairment
observed in persons with stroke, inclusive of both right and left CVA symptoms. The
visuospatial domain included several items that relate to left side neglect. For example:
“Dresses or grooms left side of body”. Left sided neglect is observed in persons with R
CVA. This may have impacted the predictiveness of the visuospatial scores for right vs
left CVA.
Further, it is notable that 9/9 of the comparison measures that did not show a
relationship with the MFC-S domain were comprised of performance based, measures
of cognition. For example, the Trails A and Trails B measure the speed and ability to
switch, respectively, between numbers and/or letters. On the other hand, the
comparison measures that significantly and strongly associated with the MFC-S domain
were similar self-report measures of everyday ability: (1) the BRIEF and (2) the ASHA
FAC and (3) the CESD. Some cognitive researchers propose that though there is a
relationship between performance based measures of cognition and everyday ability,
this relationship may be moderated by other variables such as education.22
Limitations of this study include challenges of using a self-report measure in
persons with cognitive impairment, sample size limitations, and the use of univariate
analyses. The nature of a self-report measure requires that persons are able to
communicate, yet persons with stroke may experience communication challenges. One
85
solution is to use proxy or interview formats. Yet, differences have been found between
self and proxy, caregiver or health provider, report. Future work should consider how
the MFC-S self-report scores relate to proxy reports, and include persons more severely
affected by stroke. Further, the generalizability is limited to this sample, which included
persons mildly to moderately affected by stroke. The NIH stroke scale score for
persons of moderate to severe impairment is 15. Our sample averaged 4.54 (4.07) for
the acute group and 4.31 (3.72) for the chronic group. For domains that did not related
to comparison future work might include performance based or questionnaire
comparison measures to further evaluate validity in these domains. Lastly, sample size
limitations may have affected the power of detecting relationships between comparison
studies, a type II error. In contrast, while we attempted to decrease type II errors using
Bonferroni corrections, this was still a possibility.
4.4 Conclusion
This study presents beginning evidence that the MFC-S can be used as a
meaningful measure of everyday cognition for persons with stroke. Interesting next
questions might be to evaluate how the MFC-S compares with proxy report, to other
everyday performance measures of cognition and in a clinical setting. Lastly, future
work with larger sample sizes will allow for further investigation of the impact of
variables such as age, education and race moderate the effect between more
fundamental cognitive performance on measures, such as the Trails A and B, and
functional cognitive ability.
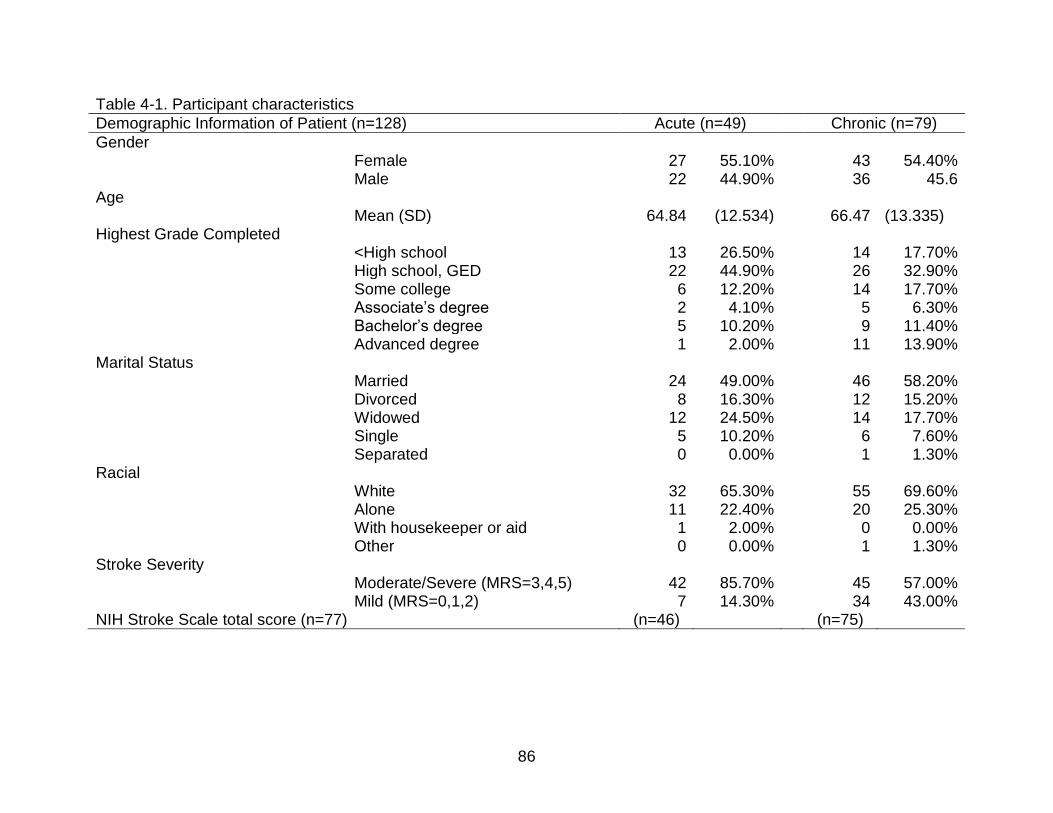
86
Table 4-1. Participant characteristics
Demographic Information of Patient (n=128) Acute (n=49) Chronic (n=79)
Gender Female 27 55.10% 43 54.40% Male 22 44.90% 36 45.6
Age Mean (SD) 64.84 (12.534) 66.47 (13.335)
Highest Grade Completed <High school 13 26.50% 14 17.70% High school, GED 22 44.90% 26 32.90% Some college 6 12.20% 14 17.70% Associate’s degree 2 4.10% 5 6.30% Bachelor’s degree 5 10.20% 9 11.40% Advanced degree 1 2.00% 11 13.90%
Marital Status Married 24 49.00% 46 58.20% Divorced 8 16.30% 12 15.20% Widowed 12 24.50% 14 17.70% Single 5 10.20% 6 7.60% Separated 0 0.00% 1 1.30%
Racial White 32 65.30% 55 69.60% Alone 11 22.40% 20 25.30% With housekeeper or aid 1 2.00% 0 0.00% Other 0 0.00% 1 1.30%
Stroke Severity Moderate/Severe (MRS=3,4,5) 42 85.70% 45 57.00% Mild (MRS=0,1,2) 7 14.30% 34 43.00%
NIH Stroke Scale total score (n=77) (n=46) (n=75)
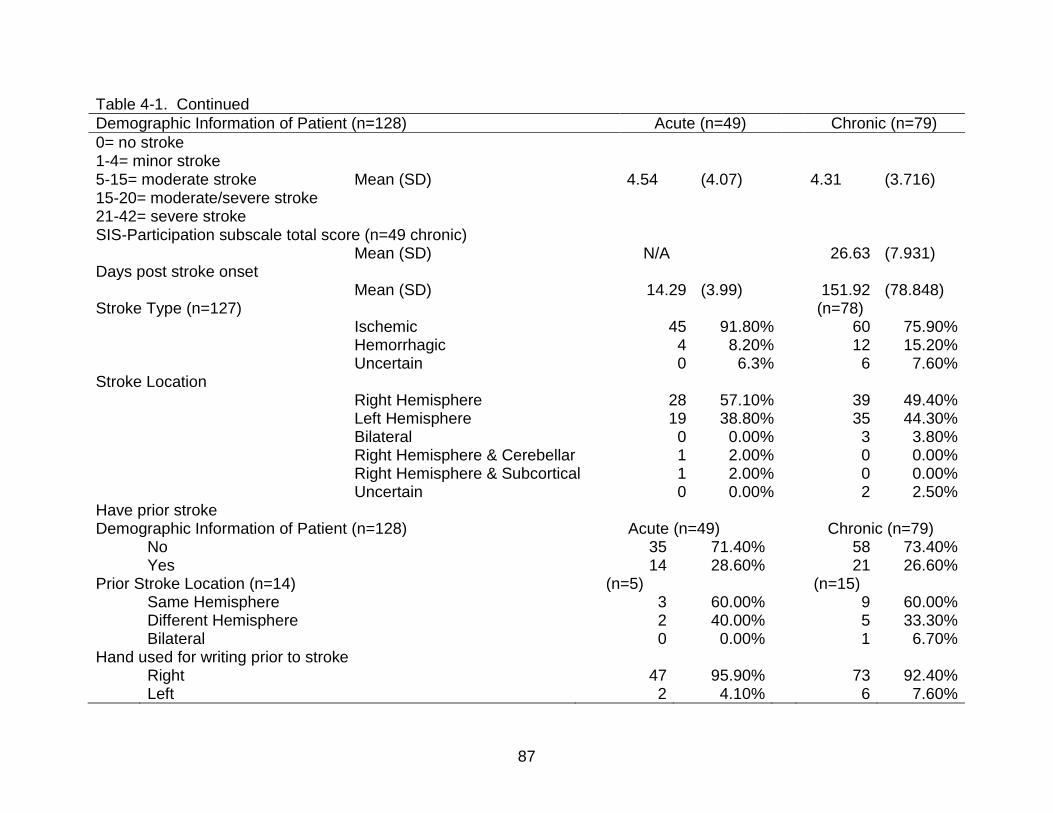
87
Table 4-1. Continued
Demographic Information of Patient (n=128) Acute (n=49) Chronic (n=79)
0= no stroke 1-4= minor stroke 5-15= moderate stroke 15-20= moderate/severe stroke 21-42= severe stroke
Mean (SD) 4.54 (4.07) 4.31 (3.716)
SIS-Participation subscale total score (n=49 chronic) Mean (SD) N/A 26.63 (7.931)
Days post stroke onset Mean (SD) 14.29 (3.99) 151.92 (78.848)
Stroke Type (n=127) (n=78) Ischemic 45 91.80% 60 75.90% Hemorrhagic 4 8.20% 12 15.20% Uncertain 0 6.3% 6 7.60%
Stroke Location Right Hemisphere 28 57.10% 39 49.40% Left Hemisphere 19 38.80% 35 44.30% Bilateral 0 0.00% 3 3.80% Right Hemisphere & Cerebellar 1 2.00% 0 0.00% Right Hemisphere & Subcortical 1 2.00% 0 0.00% Uncertain 0 0.00% 2 2.50%
Have prior stroke Demographic Information of Patient (n=128) Acute (n=49) Chronic (n=79)
No 35 71.40% 58 73.40% Yes 14 28.60% 21 26.60%
Prior Stroke Location (n=14) (n=5) (n=15) Same Hemisphere 3 60.00% 9 60.00% Different Hemisphere 2 40.00% 5 33.30% Bilateral 0 0.00% 1 6.70%
Hand used for writing prior to stroke Right 47 95.90% 73 92.40% Left 2 4.10% 6 7.60%
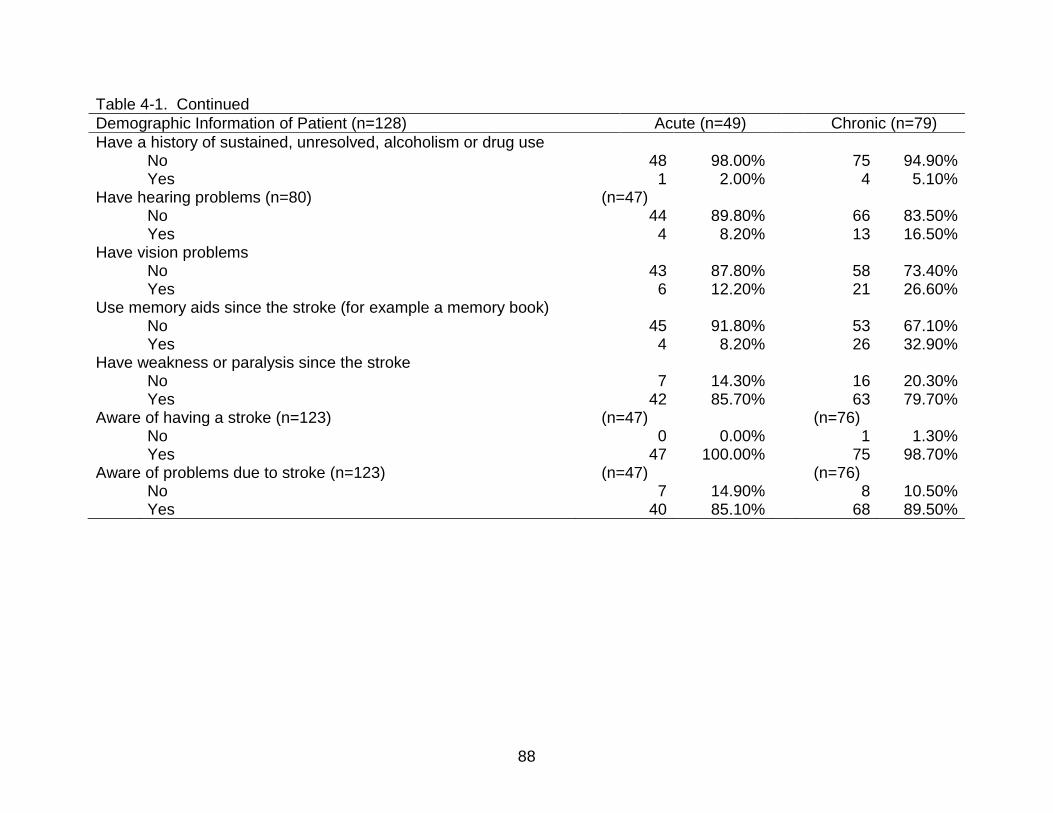
88
Table 4-1. Continued
Demographic Information of Patient (n=128) Acute (n=49) Chronic (n=79)
Have a history of sustained, unresolved, alcoholism or drug use No 48 98.00% 75 94.90% Yes 1 2.00% 4 5.10%
Have hearing problems (n=80) (n=47) No 44 89.80% 66 83.50% Yes 4 8.20% 13 16.50%
Have vision problems No 43 87.80% 58 73.40% Yes 6 12.20% 21 26.60%
Use memory aids since the stroke (for example a memory book) No 45 91.80% 53 67.10% Yes 4 8.20% 26 32.90%
Have weakness or paralysis since the stroke No 7 14.30% 16 20.30% Yes 42 85.70% 63 79.70%
Aware of having a stroke (n=123) (n=47) (n=76) No 0 0.00% 1 1.30% Yes 47 100.00% 75 98.70%
Aware of problems due to stroke (n=123) (n=47) (n=76) No 7 14.90% 8 10.50% Yes 40 85.10% 68 89.50%
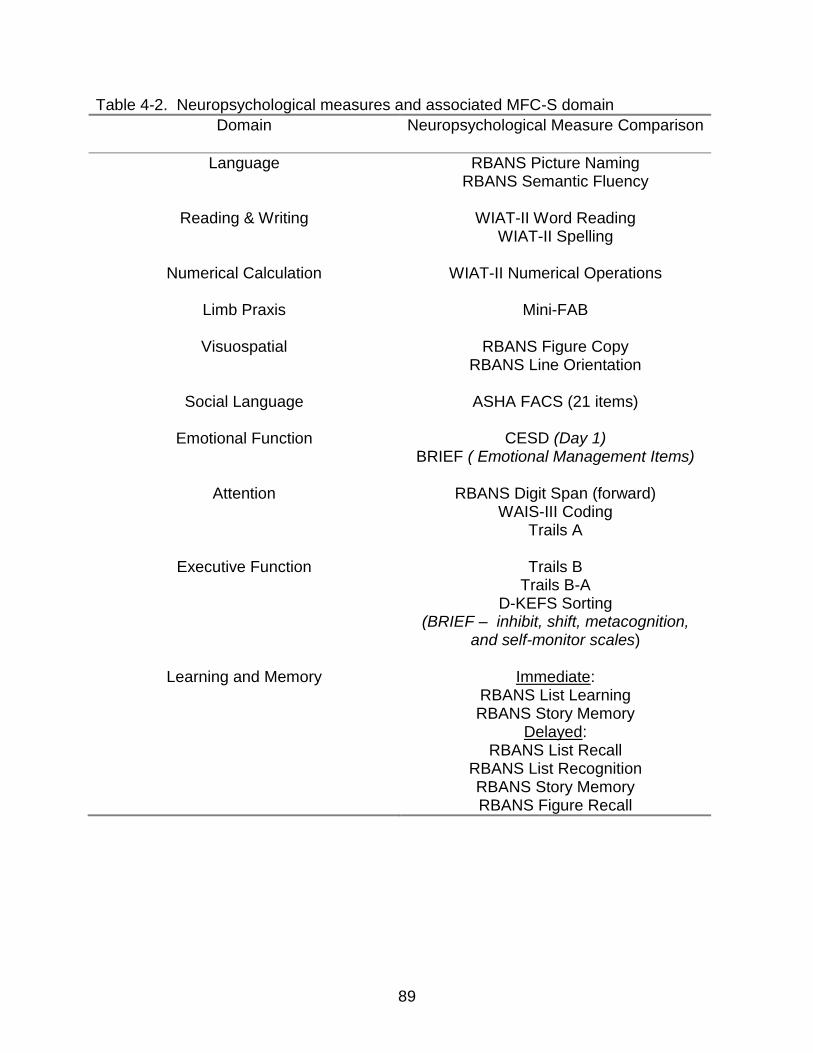
89
Table 4-2. Neuropsychological measures and associated MFC-S domain
Domain Neuropsychological Measure Comparison
Language RBANS Picture Naming RBANS Semantic Fluency
Reading & Writing WIAT-II Word Reading
WIAT-II Spelling
Numerical Calculation WIAT-II Numerical Operations
Limb Praxis Mini-FAB
Visuospatial RBANS Figure Copy RBANS Line Orientation
Social Language ASHA FACS (21 items)
Emotional Function CESD (Day 1)
BRIEF ( Emotional Management Items)
Attention RBANS Digit Span (forward) WAIS-III Coding
Trails A
Executive Function Trails B Trails B-A
D-KEFS Sorting (BRIEF – inhibit, shift, metacognition,
and self-monitor scales)
Learning and Memory Immediate: RBANS List Learning RBANS Story Memory
Delayed: RBANS List Recall
RBANS List Recognition RBANS Story Memory RBANS Figure Recall

90
Table 4-3. MFC-S Domain correlations with neuropsychological measures
Domain Measure used for Analysis
Pearson’s Correlation Coefficient
Significance
1) Language
RBANS language score n = 59
.30 * p = .01
2) Reading & Writing
WIAT-II-A standard score of word reading n = 59 WIAT-II-A standard score of spelling n = 62
.29* .16
p = .01 p = .11
3) Numerical calculation
WIAT-II-A numerical operation n = 62
.12 p = .19
4) Limb praxis Mini Florida Apraxia Battery n = 61
.15 p = .18
5) Visuospatial RBANS viso-spatial construction n = 59
.31* p = .008
6) Social language ASHA FACS (21 items) n = 62
.26* p =.02
7) Emotional function CESD (Day 1) n = 62 BRIEF (Emotional Management Items) n = 62
-.5* -.47*
p < .001 p < .001
8) Attention Trails A n = 62 WAIS-III coding n = 56 RBANS attention n = 62
-.12 -.09 .12
p = .17 p = .31 p = .18

91
Table 4-3. Continued.
Domain Measure used for Analysis
Pearson’s Correlation Coefficient
Significance
9) Executive function BRIEF inhibit n = 62 BRIEF shift n = 62 BRIEF self monitor n = 62 BRIEF Metacognition n = 62 D-KEFS confirmed correct sorts n = 62 D-KEFS free sorting description n = 62 D-KEFS sort recognition n = 59 Trails B n = 61 Trails B/A Ratio n = 61
-.47* -.62* -.51* -.52* .08 .14 .30* .17 -.11
p < .001 p < .001 p < .001 p < .001 p = .28 p = .15 p = .011 p = .17 p=.11
10) Learning & Memory
RBANS immediate memory n = 62 RBANS delayed memory n = 62
.24* .27*
p = .03 p = .02
* Significant correlations.
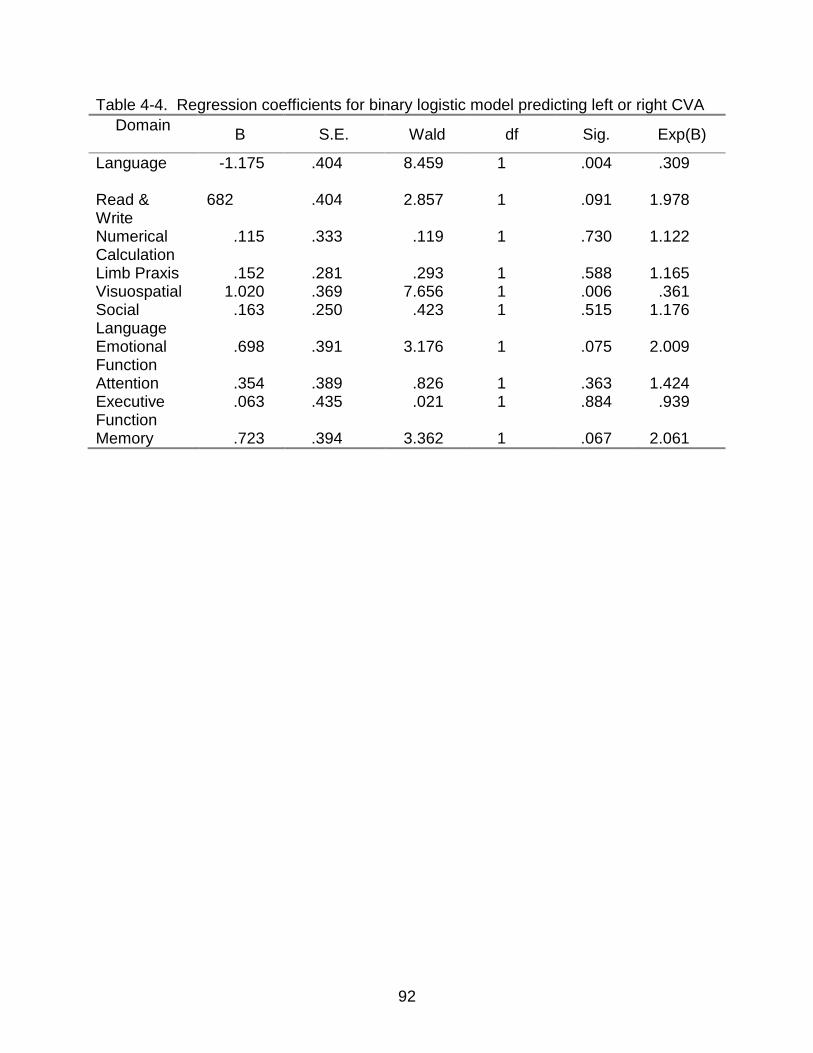
92
Table 4-4. Regression coefficients for binary logistic model predicting left or right CVA
Domain B S.E. Wald df Sig. Exp(B)
Language -1.175 .404 8.459 1 .004 .309
Read & Write
682 .404 2.857 1 .091 1.978
Numerical Calculation
.115 .333 .119 1 .730 1.122
Limb Praxis .152 .281 .293 1 .588 1.165 Visuospatial 1.020 .369 7.656 1 .006 .361 Social Language
.163 .250 .423 1 .515 1.176
Emotional Function
.698 .391 3.176 1 .075 2.009
Attention .354 .389 .826 1 .363 1.424 Executive Function
.063 .435 .021 1 .884 .939
Memory .723 .394 3.362 1 .067 2.061
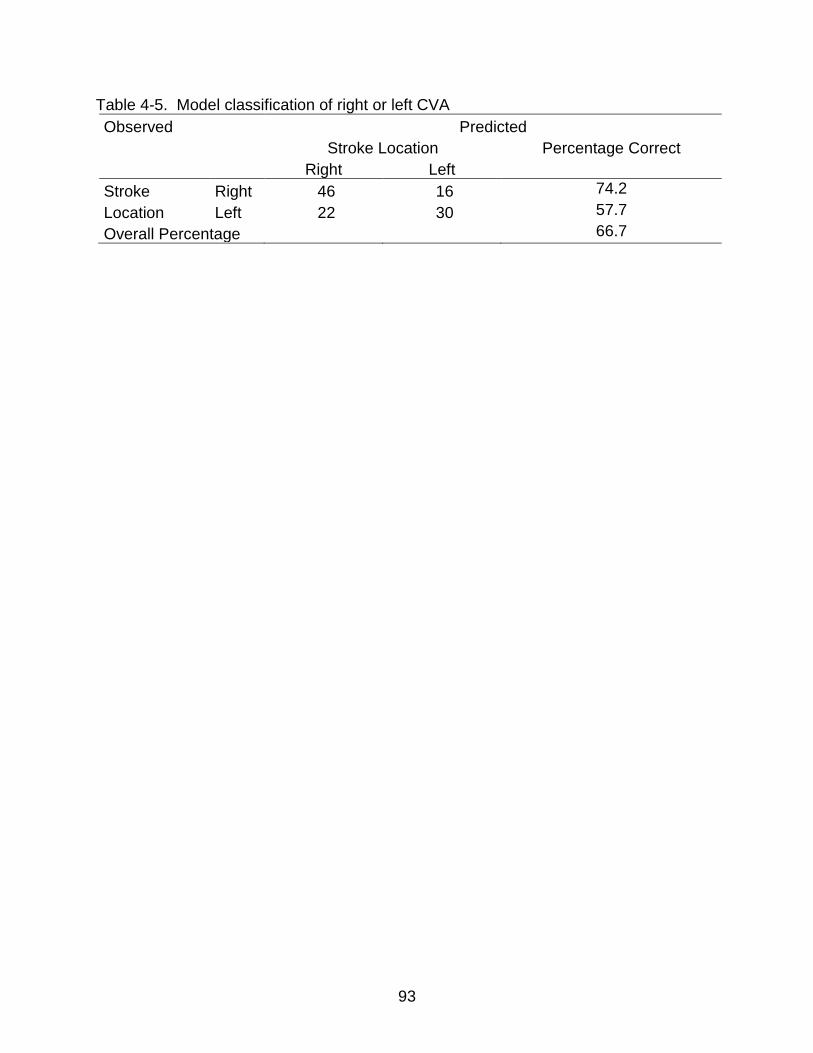
93
Table 4-5. Model classification of right or left CVA
Observed Predicted
Stroke Location Percentage Correct
Right Left
Stroke
Location
Right 46 16 74.2
Left 22 30 57.7
Overall Percentage 66.7
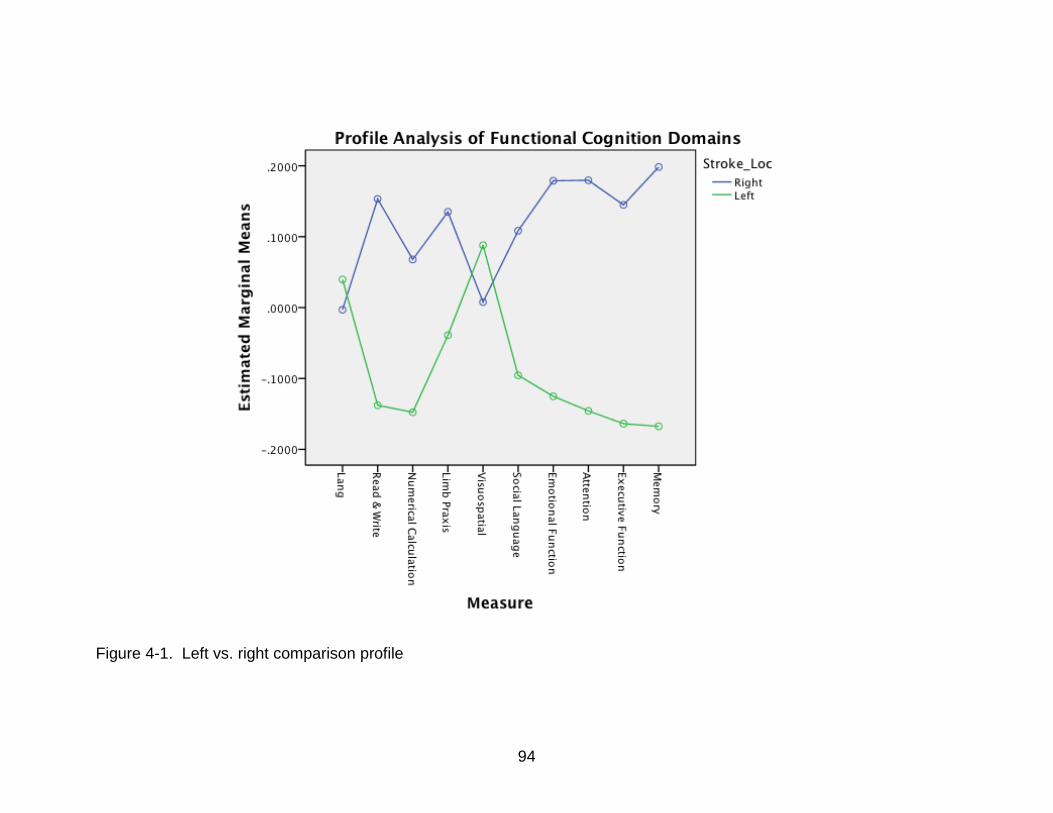
94
Figure 4-1. Left vs. right comparison profile
95
CHAPTER 5 SUMMARY AND CONCLUSION
Research indicates that cognitive impairment associated with stroke affects
functional outcomes.85 While important work remains to be done to determine optimal
treatment methods, and related issues, given this information, this project was
concerned with the measurement of applied cognition. Current measures to evaluate
functional, or everyday, ability specifically related to cognitive impairment are limited in
breadth 18 or contain neither the secondary constructs of cognition nor impairment
unique to stroke.17
5.1 Summary
To that end, this project examines the psychometric properties of a measure of
functional cognition in persons with stroke (MFC-S). Beginning with a review and
comparison of classical test theory (CTT) and modern test theory (MTT), this project
proceeded to three studies: (1) evaluation of dimensionality of the MFC-S through
exploratory factor analysis (EFA) and principle components analysis (PCA) of the
residuals, (2) evaluation of the measurement properties of the MFC-S using the Rasch
measurement model, and (3) evaluation of the validity of the MFC-S using correlation
analysis to comparison measures and a profile analysis to predict laterality of
cerebrovascular accident (CVA).
Study one used factor analytic techniques to examine the dimensionality of the
MFC-S. The EFA demonstrated support for a ten-factor solution, with second order
factors loading on a higher general factor. The PCA of residuals allowed for item level
examination. Every domain, except numerical calculation, revealed a possible second
dimension. But, for every domain, the majority of the variance was captured by the

96
primary Rasch component. Further, each secondary dimension was explained by
constructs the primary dimension intended to capture. For example, the reading and
writing domain contained both a reading and writing secondary dimension. This study
was important since it supports measuring the individual dimensions of MFC in the
population of individuals with stroke.
Study two used the Rasch measurement model to assess item level
psychometrics of the MFC-S. Nine of the ten domains, all but limb praxis, were able to
separate persons into at least two statistically different groups. Further, evaluation of
the item hierarchy for each domain indicated a gradient from less difficult to more
difficult items that was conceptually sound. For example, the language domain
indicated that “follows simple directions when asked” was at the easier end of the scale
and “carries on a conversation without mistakes” was at the more difficult end of the
scale. Though, several of the domains showed ceiling effects with persons from this
sample reaching the maximum extreme score: language (11% (14)), reading & writing
(17% (21)), numerical calculation (18% (23)), limb praxis (19% (24)) and memory (6%
(8)), our sample selection criteria excluded those persons more severely affected by
stroke. On the National Institute of Health Stroke Scale (NIHSS), the mean of our acute
group was 4.54 (4.07) and the chronic group was 4.31 (3.716). The NIHSS range for
moderate stroke is 5-15 and the cutoff for moderate to severe stroke is 15-20. This
study demonstrated that the MFC-S domains (with the exception of apraxia) separate
persons into statistically distinct levels of functional/applied cognitive ability.
Study three examined the validity of the MFC-S using correlation with
comparison measures, and a profile analysis followed up by logistic regression to
97
predict laterality of stroke. Comparison questionnaire type measures that included
everyday abilities such as the Functional Assessment of Communication Skills for
Adults (ASHA-FACS),30 the Behavior Rating Inventory of Executive Functions –Adult
(BRIEF)74 and the Center for Epidemiologic Studies – Depression Scale (CES-D)71 had
statistically significant and stronger associations with the MFC-S than did the more
traditional neuropsychological measures. The profile analysis indicated that profile
scores associated with right or left CVA could predict group membership, i.e. in which
cerebral hemisphere a person had their stroke. The language and visuospatial domains
were significant predictors in a logistic regression model entering all ten domains,
though language was the opposite of what we would have expected. That is, a person
with left CVA, for this sample, tended to have a higher language scores. We posited
that as this sample, selected on criterion that excluded persons with communication
impairment may have affected this result. Alternatively, the visuopsatial domain scores
did predict in the expected direction. Persons with left CVA tended to do better with
visuospatial ability than persons with right CVA. This study demonstrates the concurrent
validity of the MFC-S.
5.2 Conclusion
The importance of this series of studies was that it evaluated a measure of
functional, or applied, cognition in persons with stroke that incorporates secondary
cognitive constructs. The above findings suggest that the MFC-S can provide a profile
of applied cognitive abilities and deficits that can be the target of treatment
interventions. The above findings strengthens clinicians and investigators confidence
using the MFC-S, specifically to measure differences in applied cognitive ability and to
relate this ability on this measure with meaningful outcomes such as the ability to live on

98
one’s own, or the need for and level of support, such as a health care facility or in home
support.
Future work needs to focus on replicating and expanding these findings. If the
misfitting items in this study continue to misfit or not discriminate persons, removing
these items should improve the measure. Additional work should focus on
reexamination of the limb praxis domain. It is possible that this sample was truncated
with respect to ability, i.e., too able, for this measure to discriminate well. It is also
possible that the items did not fully capture the functional limb praxis domain. This
needs to be further investigated. Future work with larger sample sizes will allow for
further investigation of the impact of variables such as age, education and race
moderate the effect between more fundamental cognitive performance on measures,
such as the Trails A and B, and applied cognitive ability. Future work should also
investigate the sensitivity of the MFC in monitoring meaningful clinical differences in
patients across normal recovery and recovery followed by rehabilitation interventions.
The overarching purpose of this series of studies supports the rehabilitation
research goals of developing meaningful measurement tools to assess treatment
effects. 66 While this represents the initial psychometric findings of the MFC, it provides
the basis for evaluating treatment interventions through meaningful outcome measures
that evaluate everyday tasks that rely heavily on cognition.
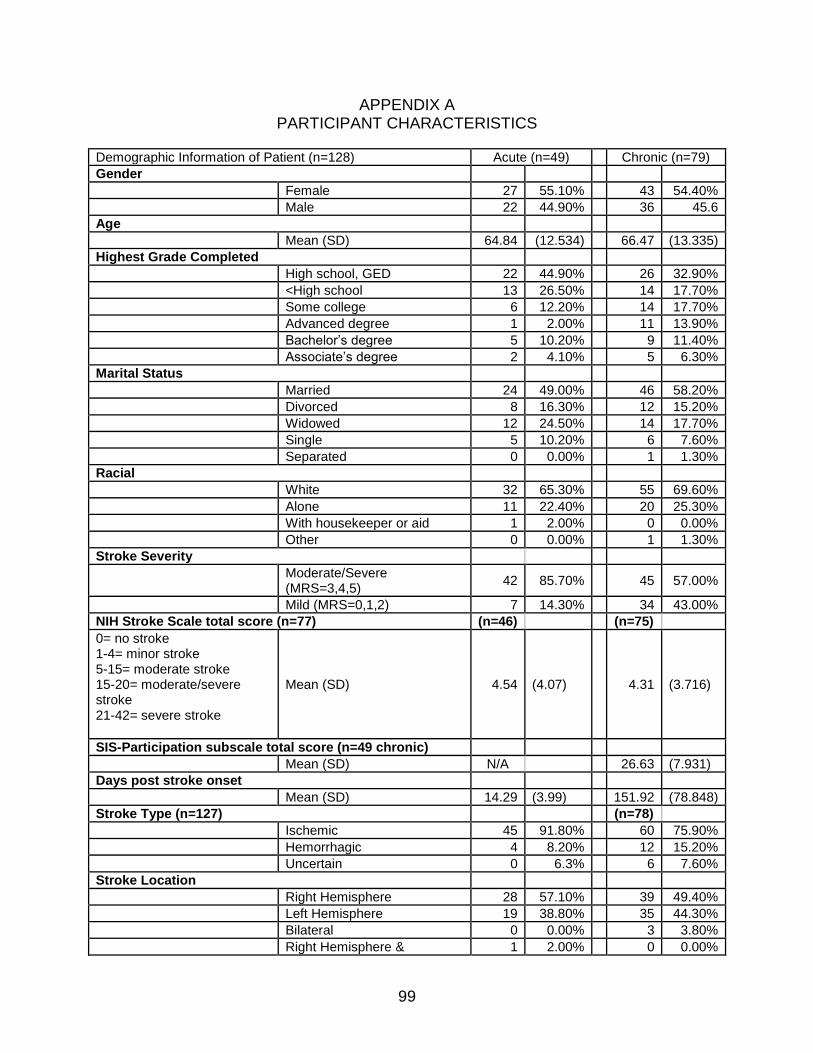
99
APPENDIX A PARTICIPANT CHARACTERISTICS
Demographic Information of Patient (n=128) Acute (n=49) Chronic (n=79)
Gender
Female 27 55.10% 43 54.40%
Male 22 44.90% 36 45.6
Age
Mean (SD) 64.84 (12.534) 66.47 (13.335)
Highest Grade Completed
High school, GED 22 44.90% 26 32.90%
<High school 13 26.50% 14 17.70%
Some college 6 12.20% 14 17.70%
Advanced degree 1 2.00% 11 13.90%
Bachelor’s degree 5 10.20% 9 11.40%
Associate’s degree 2 4.10% 5 6.30%
Marital Status
Married 24 49.00% 46 58.20%
Divorced 8 16.30% 12 15.20%
Widowed 12 24.50% 14 17.70%
Single 5 10.20% 6 7.60%
Separated 0 0.00% 1 1.30%
Racial
White 32 65.30% 55 69.60%
Alone 11 22.40% 20 25.30%
With housekeeper or aid 1 2.00% 0 0.00%
Other 0 0.00% 1 1.30%
Stroke Severity
Moderate/Severe (MRS=3,4,5)
42 85.70% 45 57.00%
Mild (MRS=0,1,2) 7 14.30% 34 43.00%
NIH Stroke Scale total score (n=77) (n=46) (n=75)
0= no stroke 1-4= minor stroke 5-15= moderate stroke 15-20= moderate/severe stroke 21-42= severe stroke
Mean (SD) 4.54 (4.07) 4.31 (3.716)
SIS-Participation subscale total score (n=49 chronic)
Mean (SD) N/A 26.63 (7.931)
Days post stroke onset
Mean (SD) 14.29 (3.99) 151.92 (78.848)
Stroke Type (n=127) (n=78)
Ischemic 45 91.80% 60 75.90%
Hemorrhagic 4 8.20% 12 15.20%
Uncertain 0 6.3% 6 7.60%
Stroke Location
Right Hemisphere 28 57.10% 39 49.40%
Left Hemisphere 19 38.80% 35 44.30%
Bilateral 0 0.00% 3 3.80%
Right Hemisphere & 1 2.00% 0 0.00%

100
Demographic Information of Patient (n=128) Acute (n=49) Chronic (n=79)
Cerebellar
Right Hemisphere & Subcortical
1 2.00% 0 0.00%
Uncertain 0 0.00% 2 2.50%
Have prior stroke
No 35 71.40% 58 73.40%
Yes 14 28.60% 21 26.60%
Prior Stroke Location (n=14) (n=5) (n=15)
Same Hemisphere 3 60.00% 9 60.00%
Different Hemisphere 2 40.00% 5 33.30%
Bilateral 0 0.00% 1 6.70%
Hand used for writing prior to stroke
Right 47 95.90% 73 92.40%
Left 2 4.10% 6 7.60%
Have a history of sustained, unresolved, alcoholism or drug use
No 48 98.00% 75 94.90%
Yes 1 2.00% 4 5.10%
Have hearing problems (n=80) (n=47)
No 44 89.80% 66 83.50%
Yes 4 8.20% 13 16.50%
Have vision problems
No 43 87.80% 58 73.40%
Yes 6 12.20% 21 26.60%
Use memory aids since the stroke (for example a memory book)
No 45 91.80% 53 67.10%
Yes 4 8.20% 26 32.90%
Have weakness or paralysis since the stroke
Yes 42 85.70% 63 79.70%
No 7 14.30% 16 20.30%
Aware of having a stroke (n=123) (n=47) (n=76)
Yes 47 100.00% 75 98.70%
No 0 0.00% 1 1.30%
Aware of problems due to stroke (n=123) (n=47) (n=76)
Yes 40 85.10% 68 89.50%
No 7 14.90% 8 10.50%
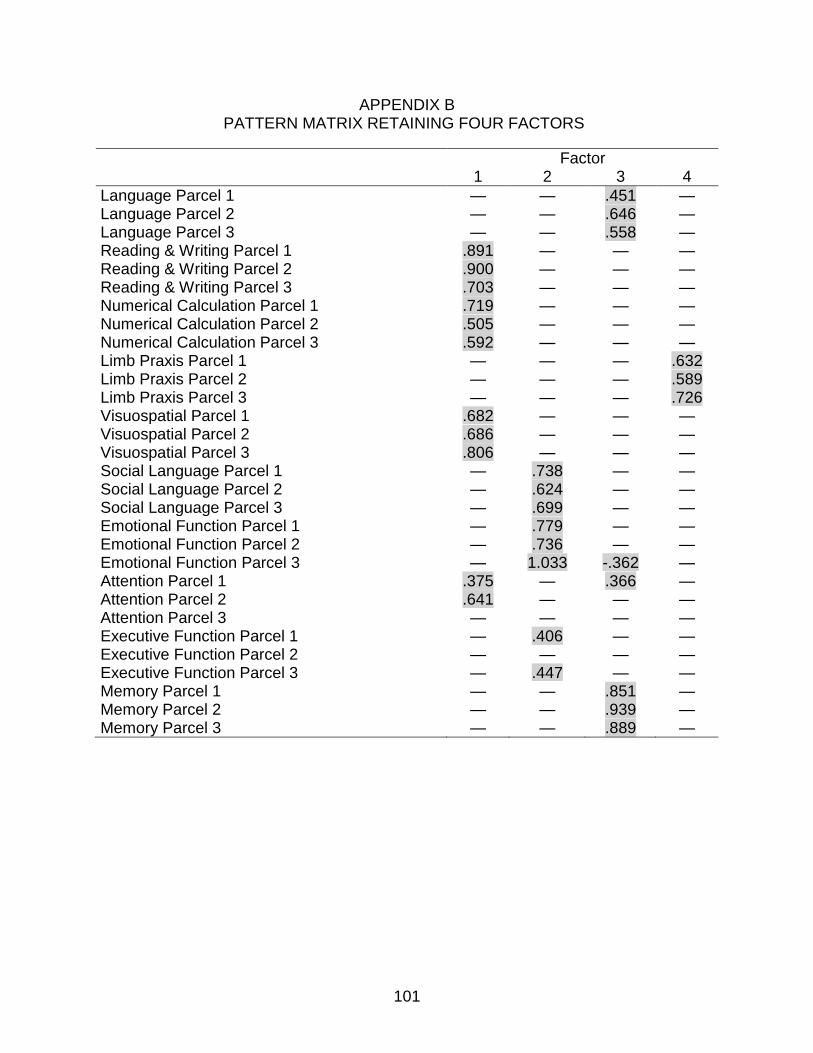
101
APPENDIX B PATTERN MATRIX RETAINING FOUR FACTORS
Factor 1 2 3 4
Language Parcel 1 — — .451 — Language Parcel 2 — — .646 — Language Parcel 3 — — .558 — Reading & Writing Parcel 1 .891 — — — Reading & Writing Parcel 2 .900 — — — Reading & Writing Parcel 3 .703 — — — Numerical Calculation Parcel 1 .719 — — — Numerical Calculation Parcel 2 .505 — — — Numerical Calculation Parcel 3 .592 — — — Limb Praxis Parcel 1 — — — .632 Limb Praxis Parcel 2 — — — .589 Limb Praxis Parcel 3 — — — .726 Visuospatial Parcel 1 .682 — — — Visuospatial Parcel 2 .686 — — — Visuospatial Parcel 3 .806 — — — Social Language Parcel 1 — .738 — — Social Language Parcel 2 — .624 — — Social Language Parcel 3 — .699 — — Emotional Function Parcel 1 — .779 — — Emotional Function Parcel 2 — .736 — — Emotional Function Parcel 3 — 1.033 -.362 — Attention Parcel 1 .375 — .366 — Attention Parcel 2 .641 — — — Attention Parcel 3 — — — — Executive Function Parcel 1 — .406 — — Executive Function Parcel 2 — — — — Executive Function Parcel 3 — .447 — — Memory Parcel 1 — — .851 — Memory Parcel 2 — — .939 — Memory Parcel 3 — — .889 —
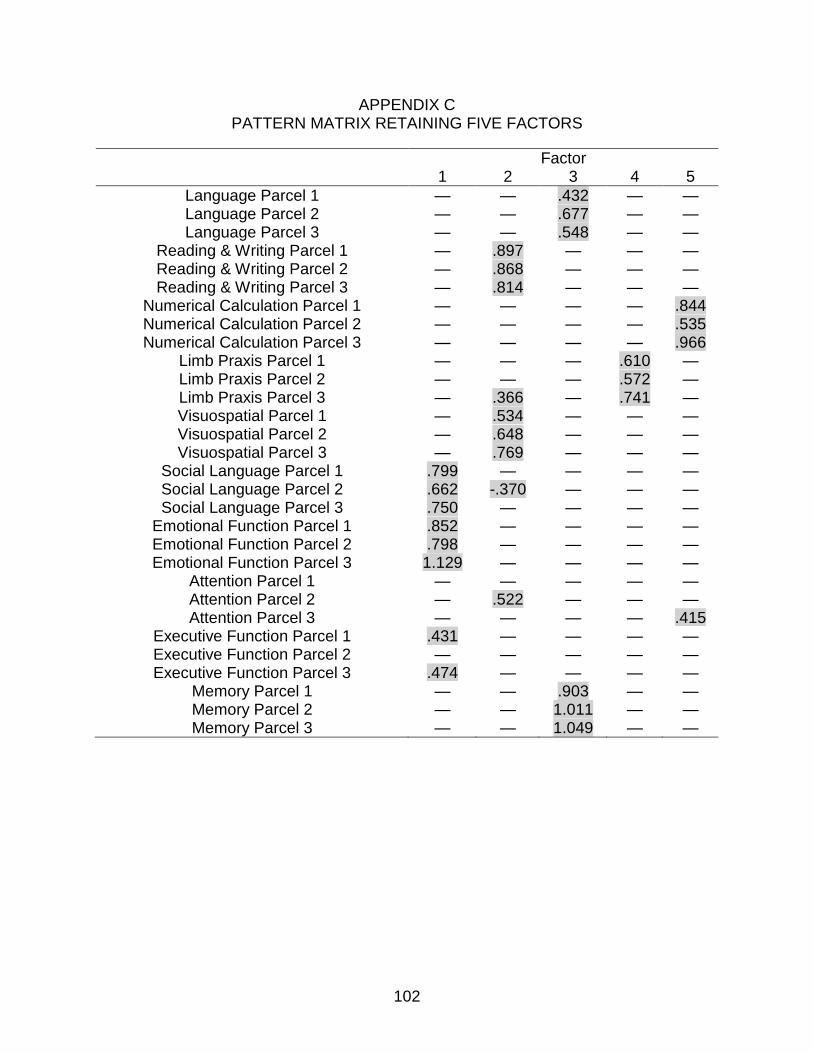
102
APPENDIX C PATTERN MATRIX RETAINING FIVE FACTORS
Factor 1 2 3 4 5
Language Parcel 1 — — .432 — — Language Parcel 2 — — .677 — — Language Parcel 3 — — .548 — —
Reading & Writing Parcel 1 — .897 — — — Reading & Writing Parcel 2 — .868 — — — Reading & Writing Parcel 3 — .814 — — —
Numerical Calculation Parcel 1 — — — — .844 Numerical Calculation Parcel 2 — — — — .535 Numerical Calculation Parcel 3 — — — — .966
Limb Praxis Parcel 1 — — — .610 — Limb Praxis Parcel 2 — — — .572 — Limb Praxis Parcel 3 — .366 — .741 — Visuospatial Parcel 1 — .534 — — — Visuospatial Parcel 2 — .648 — — — Visuospatial Parcel 3 — .769 — — —
Social Language Parcel 1 .799 — — — — Social Language Parcel 2 .662 -.370 — — — Social Language Parcel 3 .750 — — — —
Emotional Function Parcel 1 .852 — — — — Emotional Function Parcel 2 .798 — — — — Emotional Function Parcel 3 1.129 — — — —
Attention Parcel 1 — — — — — Attention Parcel 2 — .522 — — — Attention Parcel 3 — — — — .415
Executive Function Parcel 1 .431 — — — — Executive Function Parcel 2 — — — — — Executive Function Parcel 3 .474 — — — —
Memory Parcel 1 — — .903 — — Memory Parcel 2 — — 1.011 — — Memory Parcel 3 — — 1.049 — —
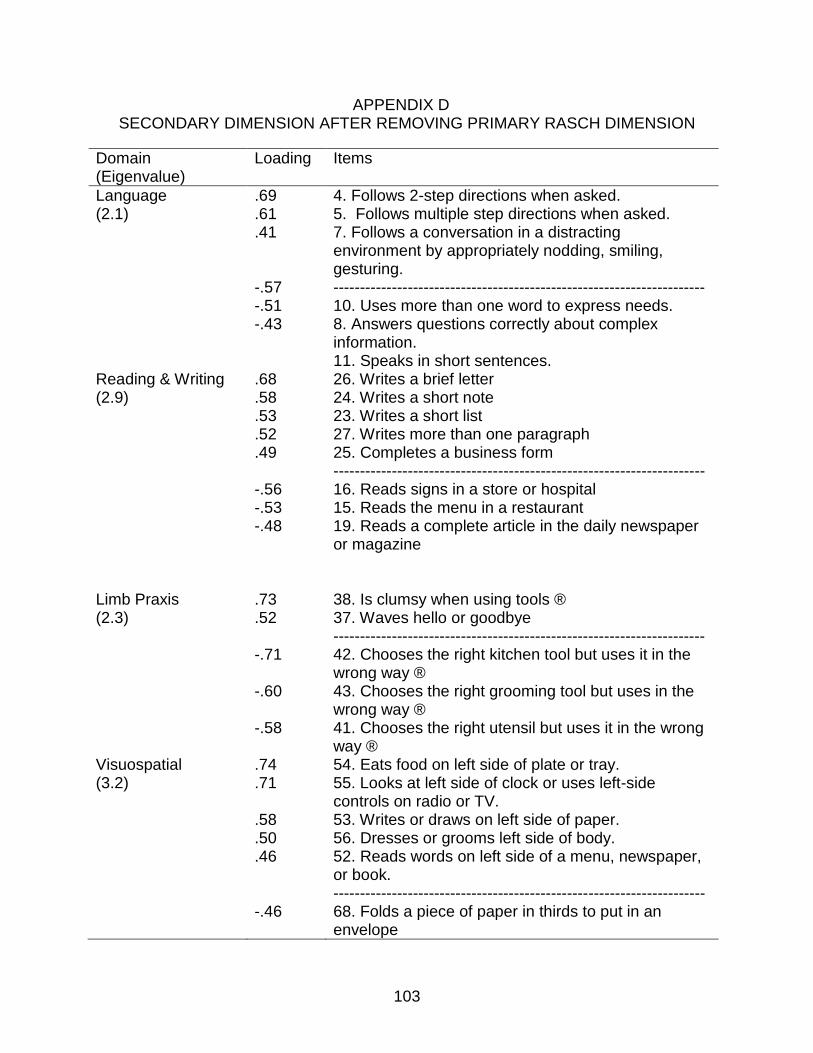
103
APPENDIX D SECONDARY DIMENSION AFTER REMOVING PRIMARY RASCH DIMENSION
Domain (Eigenvalue)
Loading Items
Language (2.1)
.69
.61
.41 -.57 -.51 -.43
4. Follows 2-step directions when asked. 5. Follows multiple step directions when asked. 7. Follows a conversation in a distracting environment by appropriately nodding, smiling, gesturing. ---------------------------------------------------------------------- 10. Uses more than one word to express needs. 8. Answers questions correctly about complex information. 11. Speaks in short sentences.
Reading & Writing (2.9)
.68
.58
.53
.52
.49 -.56 -.53 -.48
26. Writes a brief letter 24. Writes a short note 23. Writes a short list 27. Writes more than one paragraph 25. Completes a business form ---------------------------------------------------------------------- 16. Reads signs in a store or hospital 15. Reads the menu in a restaurant 19. Reads a complete article in the daily newspaper or magazine
Limb Praxis (2.3)
.73
.52 -.71 -.60 -.58
38. Is clumsy when using tools ® 37. Waves hello or goodbye ---------------------------------------------------------------------- 42. Chooses the right kitchen tool but uses it in the wrong way ® 43. Chooses the right grooming tool but uses in the wrong way ® 41. Chooses the right utensil but uses it in the wrong way ®
Visuospatial (3.2)
.74
.71 .58 .50 .46 -.46
54. Eats food on left side of plate or tray. 55. Looks at left side of clock or uses left-side controls on radio or TV. 53. Writes or draws on left side of paper. 56. Dresses or grooms left side of body. 52. Reads words on left side of a menu, newspaper, or book. ---------------------------------------------------------------------- 68. Folds a piece of paper in thirds to put in an envelope
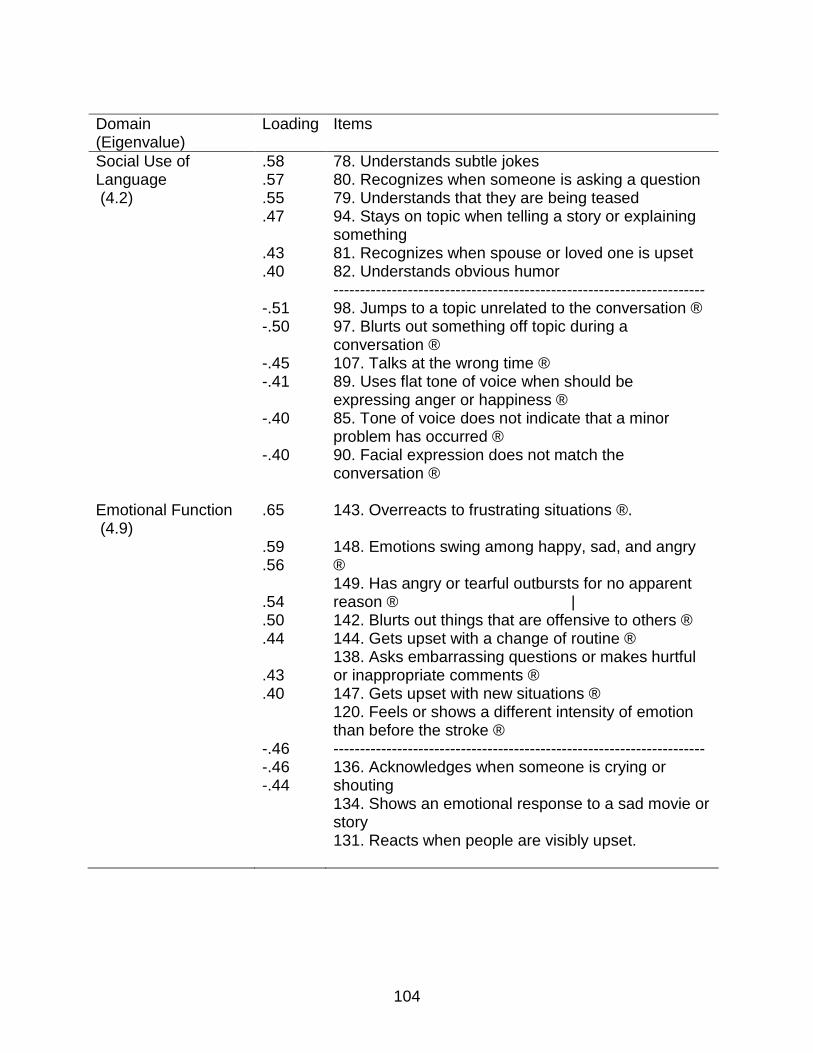
104
Domain (Eigenvalue)
Loading Items
Social Use of Language (4.2)
.58
.57
.55
.47 .43 .40 -.51 -.50 -.45 -.41 -.40 -.40
78. Understands subtle jokes 80. Recognizes when someone is asking a question 79. Understands that they are being teased 94. Stays on topic when telling a story or explaining something 81. Recognizes when spouse or loved one is upset 82. Understands obvious humor ---------------------------------------------------------------------- 98. Jumps to a topic unrelated to the conversation ® 97. Blurts out something off topic during a conversation ® 107. Talks at the wrong time ® 89. Uses flat tone of voice when should be expressing anger or happiness ® 85. Tone of voice does not indicate that a minor problem has occurred ® 90. Facial expression does not match the conversation ®
Emotional Function (4.9)
.65 .59 .56 .54 .50 .44 .43 .40 -.46 -.46 -.44
143. Overreacts to frustrating situations ®. 148. Emotions swing among happy, sad, and angry ® 149. Has angry or tearful outbursts for no apparent reason ® | 142. Blurts out things that are offensive to others ® 144. Gets upset with a change of routine ® 138. Asks embarrassing questions or makes hurtful or inappropriate comments ® 147. Gets upset with new situations ® 120. Feels or shows a different intensity of emotion than before the stroke ® ---------------------------------------------------------------------- 136. Acknowledges when someone is crying or shouting 134. Shows an emotional response to a sad movie or story 131. Reacts when people are visibly upset.

105
Domain (Eigenvalue)
Loading Items
Attention (2.6)
.66 .61 .52 .48
-.53 -.42
167. Correctly writes down a message from an answering machine or person on the phone 159. Selects meal items from a menu 160. Copies information correctly 168. Locates a phone number or address in the telephone book ----------------------------------------------------------------------
172. Watches TV without being distracted by people talking 173. Talks with a person while the TV is on.
Executive Function (5.7)
.66 .65 .59 .57 .56 .55 .51 .43 .42 .42 -.50 -.44 -.41 -.41 -.41
207. Easy thinking tasks seem difficult and require a lot of effort ® 213. Makes more mistakes during a long thinking task ® 214. Gets slower and slower during a long thinking task ® 206. Feels tired or exhausted after working on a short thinking task ® | 215. Avoids a leisure activity because it takes too much mental energy ® 208. Avoids things that involve mental energy ® 192. Makes careless errors during a new activity ® 191. Makes careless errors in daily tasks ® 201. Takes a long time to come up with an answer to a question after it is asked ® 212. Falls asleep in the middle of a thinking task ® ---------------------------------------------------------------------- 178. Fills free time with activities without being told 182. Readily switches from one activity to another 199. Responds to simple requests without being asked several times 184. Stops an activity and starts a new activity without being told 185. Plans a common daily activity
Memory (3.2)
.69
.66
.52
.49
.45 -.52 -.51 -.42
243. Says home address correctly 244. Names the current President 237. Says relative’s name correctly when asked 242. Says home phone number correctly 240. Says age correctly ---------------------------------------------------------------------- 218. Recalls specific activities from last birthday or vacation 220. Recalls activities or events from one month ago 221. Recalls activities or events from several months ago
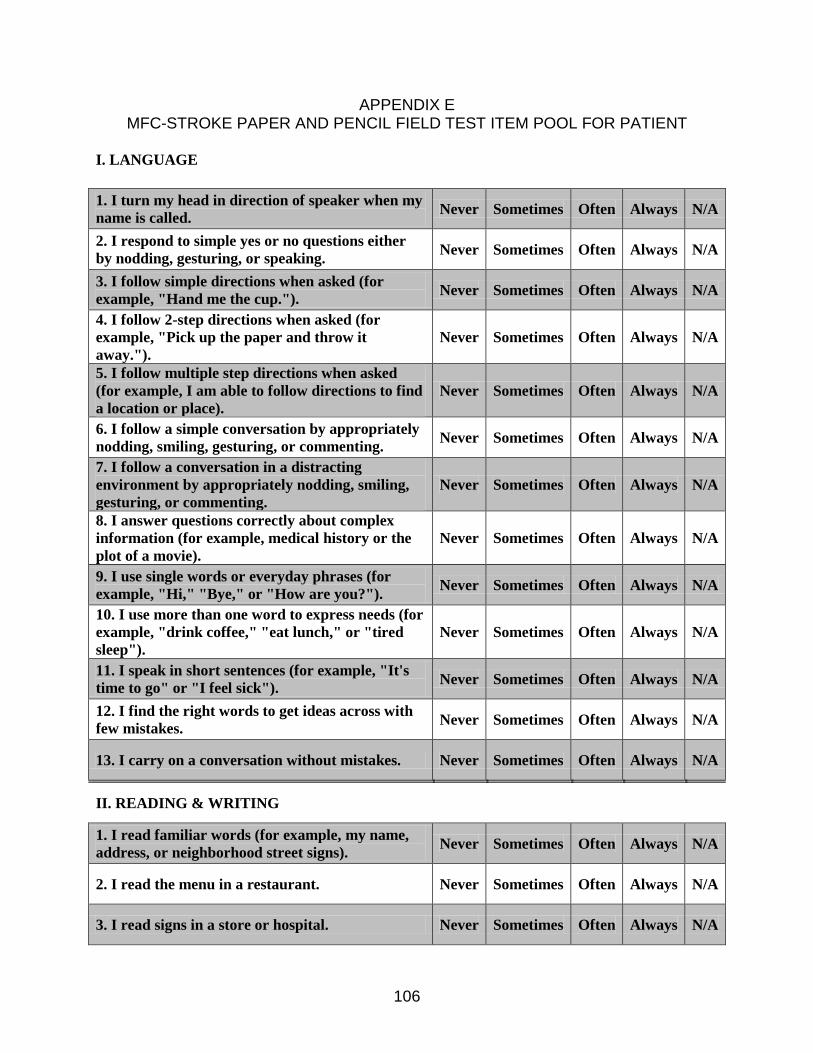
106
APPENDIX E MFC-STROKE PAPER AND PENCIL FIELD TEST ITEM POOL FOR PATIENT
I. LANGUAGE
1. I turn my head in direction of speaker when my
name is called. Never Sometimes Often Always N/A
2. I respond to simple yes or no questions either
by nodding, gesturing, or speaking. Never Sometimes Often Always N/A
3. I follow simple directions when asked (for
example, "Hand me the cup."). Never Sometimes Often Always N/A
4. I follow 2-step directions when asked (for
example, "Pick up the paper and throw it
away.").
Never Sometimes Often Always N/A
5. I follow multiple step directions when asked
(for example, I am able to follow directions to find
a location or place).
Never Sometimes Often Always N/A
6. I follow a simple conversation by appropriately
nodding, smiling, gesturing, or commenting. Never Sometimes Often Always N/A
7. I follow a conversation in a distracting
environment by appropriately nodding, smiling,
gesturing, or commenting.
Never Sometimes Often Always N/A
8. I answer questions correctly about complex
information (for example, medical history or the
plot of a movie).
Never Sometimes Often Always N/A
9. I use single words or everyday phrases (for
example, "Hi," "Bye," or "How are you?"). Never Sometimes Often Always N/A
10. I use more than one word to express needs (for
example, "drink coffee," "eat lunch," or "tired
sleep").
Never Sometimes Often Always N/A
11. I speak in short sentences (for example, "It's
time to go" or "I feel sick"). Never Sometimes Often Always N/A
12. I find the right words to get ideas across with
few mistakes. Never Sometimes Often Always N/A
13. I carry on a conversation without mistakes. Never Sometimes Often Always N/A
II. READING & WRITING
1. I read familiar words (for example, my name,
address, or neighborhood street signs). Never Sometimes Often Always N/A
2. I read the menu in a restaurant. Never Sometimes Often Always N/A
3. I read signs in a store or hospital. Never Sometimes Often Always N/A
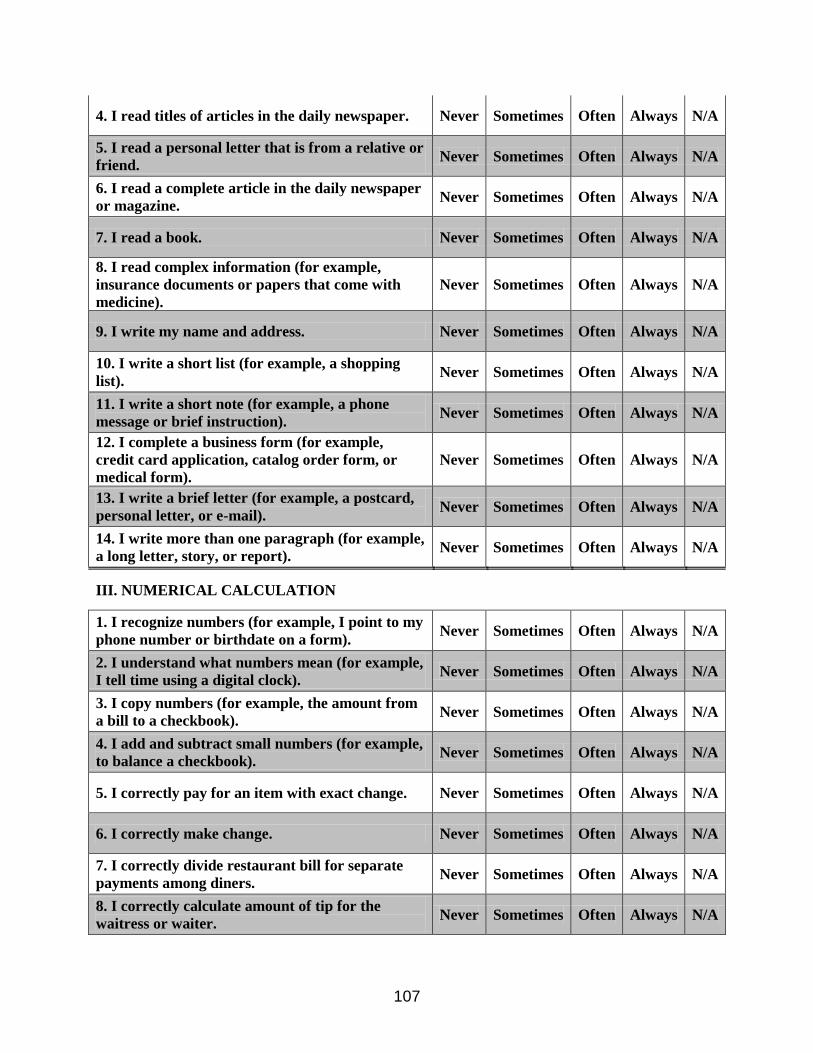
107
4. I read titles of articles in the daily newspaper. Never Sometimes Often Always N/A
5. I read a personal letter that is from a relative or
friend. Never Sometimes Often Always N/A
6. I read a complete article in the daily newspaper
or magazine. Never Sometimes Often Always N/A
7. I read a book. Never Sometimes Often Always N/A
8. I read complex information (for example,
insurance documents or papers that come with
medicine).
Never Sometimes Often Always N/A
9. I write my name and address. Never Sometimes Often Always N/A
10. I write a short list (for example, a shopping
list). Never Sometimes Often Always N/A
11. I write a short note (for example, a phone
message or brief instruction). Never Sometimes Often Always N/A
12. I complete a business form (for example,
credit card application, catalog order form, or
medical form).
Never Sometimes Often Always N/A
13. I write a brief letter (for example, a postcard,
personal letter, or e-mail). Never Sometimes Often Always N/A
14. I write more than one paragraph (for example,
a long letter, story, or report). Never Sometimes Often Always N/A
III. NUMERICAL CALCULATION
1. I recognize numbers (for example, I point to my
phone number or birthdate on a form). Never Sometimes Often Always N/A
2. I understand what numbers mean (for example,
I tell time using a digital clock). Never Sometimes Often Always N/A
3. I copy numbers (for example, the amount from
a bill to a checkbook). Never Sometimes Often Always N/A
4. I add and subtract small numbers (for example,
to balance a checkbook). Never Sometimes Often Always N/A
5. I correctly pay for an item with exact change. Never Sometimes Often Always N/A
6. I correctly make change. Never Sometimes Often Always N/A
7. I correctly divide restaurant bill for separate
payments among diners. Never Sometimes Often Always N/A
8. I correctly calculate amount of tip for the
waitress or waiter. Never Sometimes Often Always N/A
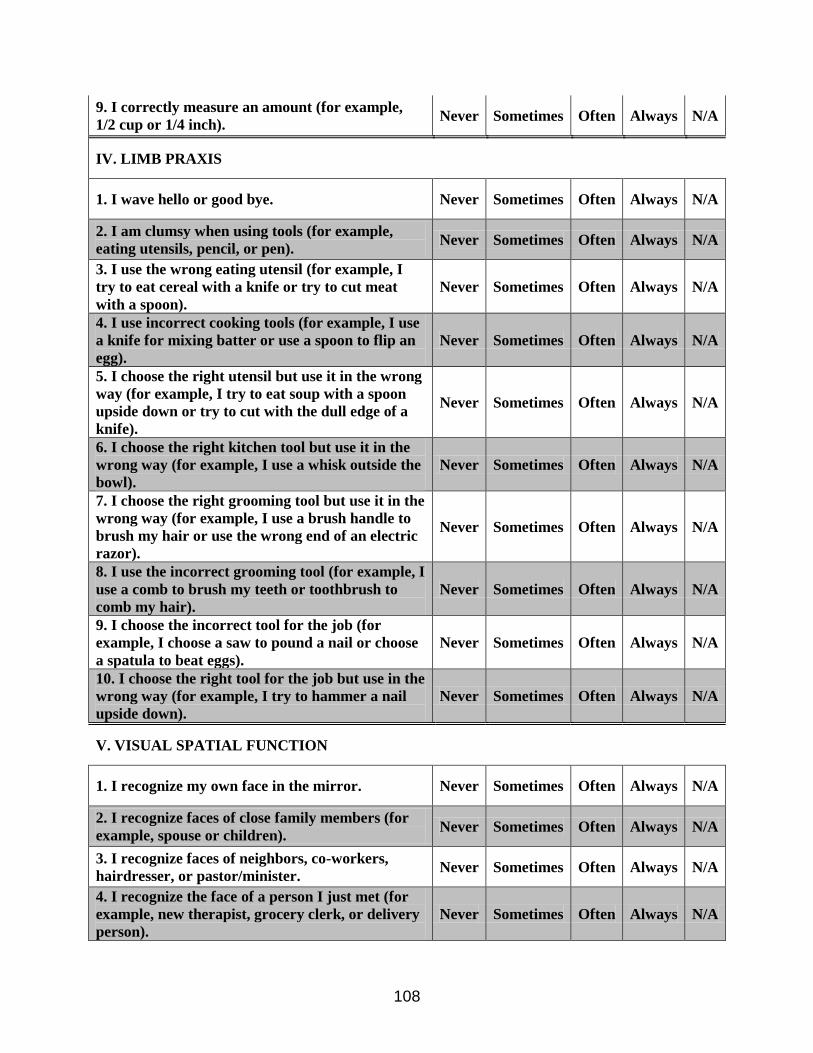
108
9. I correctly measure an amount (for example,
1/2 cup or 1/4 inch). Never Sometimes Often Always N/A
IV. LIMB PRAXIS
1. I wave hello or good bye. Never Sometimes Often Always N/A
2. I am clumsy when using tools (for example,
eating utensils, pencil, or pen). Never Sometimes Often Always N/A
3. I use the wrong eating utensil (for example, I
try to eat cereal with a knife or try to cut meat
with a spoon).
Never Sometimes Often Always N/A
4. I use incorrect cooking tools (for example, I use
a knife for mixing batter or use a spoon to flip an
egg).
Never Sometimes Often Always N/A
5. I choose the right utensil but use it in the wrong
way (for example, I try to eat soup with a spoon
upside down or try to cut with the dull edge of a
knife).
Never Sometimes Often Always N/A
6. I choose the right kitchen tool but use it in the
wrong way (for example, I use a whisk outside the
bowl).
Never Sometimes Often Always N/A
7. I choose the right grooming tool but use it in the
wrong way (for example, I use a brush handle to
brush my hair or use the wrong end of an electric
razor).
Never Sometimes Often Always N/A
8. I use the incorrect grooming tool (for example, I
use a comb to brush my teeth or toothbrush to
comb my hair).
Never Sometimes Often Always N/A
9. I choose the incorrect tool for the job (for
example, I choose a saw to pound a nail or choose
a spatula to beat eggs).
Never Sometimes Often Always N/A
10. I choose the right tool for the job but use in the
wrong way (for example, I try to hammer a nail
upside down).
Never Sometimes Often Always N/A
V. VISUAL SPATIAL FUNCTION
1. I recognize my own face in the mirror. Never Sometimes Often Always N/A
2. I recognize faces of close family members (for
example, spouse or children). Never Sometimes Often Always N/A
3. I recognize faces of neighbors, co-workers,
hairdresser, or pastor/minister. Never Sometimes Often Always N/A
4. I recognize the face of a person I just met (for
example, new therapist, grocery clerk, or delivery
person).
Never Sometimes Often Always N/A
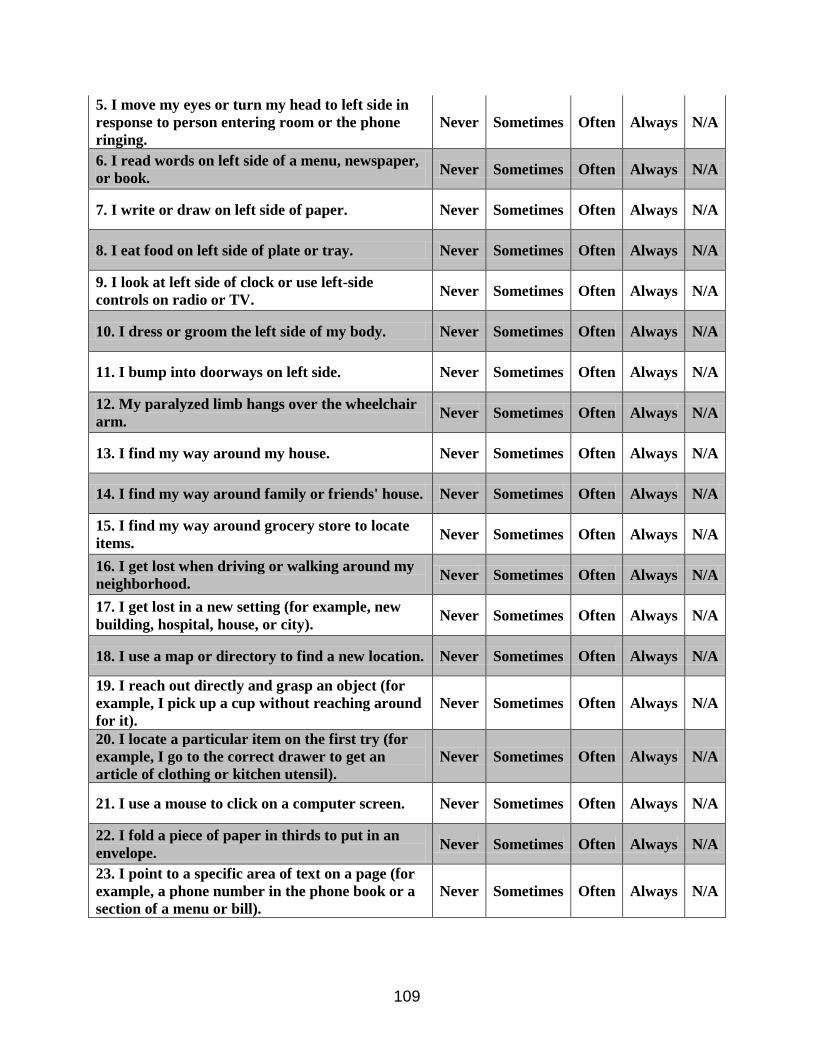
109
5. I move my eyes or turn my head to left side in
response to person entering room or the phone
ringing.
Never Sometimes Often Always N/A
6. I read words on left side of a menu, newspaper,
or book. Never Sometimes Often Always N/A
7. I write or draw on left side of paper. Never Sometimes Often Always N/A
8. I eat food on left side of plate or tray. Never Sometimes Often Always N/A
9. I look at left side of clock or use left-side
controls on radio or TV. Never Sometimes Often Always N/A
10. I dress or groom the left side of my body. Never Sometimes Often Always N/A
11. I bump into doorways on left side. Never Sometimes Often Always N/A
12. My paralyzed limb hangs over the wheelchair
arm. Never Sometimes Often Always N/A
13. I find my way around my house. Never Sometimes Often Always N/A
14. I find my way around family or friends' house. Never Sometimes Often Always N/A
15. I find my way around grocery store to locate
items. Never Sometimes Often Always N/A
16. I get lost when driving or walking around my
neighborhood. Never Sometimes Often Always N/A
17. I get lost in a new setting (for example, new
building, hospital, house, or city). Never Sometimes Often Always N/A
18. I use a map or directory to find a new location. Never Sometimes Often Always N/A
19. I reach out directly and grasp an object (for
example, I pick up a cup without reaching around
for it).
Never Sometimes Often Always N/A
20. I locate a particular item on the first try (for
example, I go to the correct drawer to get an
article of clothing or kitchen utensil).
Never Sometimes Often Always N/A
21. I use a mouse to click on a computer screen. Never Sometimes Often Always N/A
22. I fold a piece of paper in thirds to put in an
envelope. Never Sometimes Often Always N/A
23. I point to a specific area of text on a page (for
example, a phone number in the phone book or a
section of a menu or bill).
Never Sometimes Often Always N/A

110
24. I get a specific book off a bookshelf. Never Sometimes Often Always N/A
25. I make an entry on the correct line of a form
(for example, in a checkbook). Never Sometimes Often Always N/A
26. I point to a location on a map or directory. Never Sometimes Often Always N/A
27. I stack items according to shape and size (for
example, dishes, containers, books, or tools in a
case).
Never Sometimes Often Always N/A
28. I build or construct things (for example, I
make scrapbooks, build bird houses, or assemble
puzzles).
Never Sometimes Often Always N/A
29. I draw a simple sketch (for example, a stick
figure of a person or a flower). Never Sometimes Often Always N/A
30. I copy a chart from a book (for example, a
chart of facts or diagram from a text book). Never Sometimes Often Always N/A
31. I draw a simple map. Never Sometimes Often Always N/A
VI. SOCIAL USE OF LANGUAGE
1. I understand subtle jokes (for example, a play
on words or witty remark). Never Sometimes Often Always N/A
2. I understand when I am being teased. Never Sometimes Often Always N/A
3. I recognize when someone is asking a question
(for example, I recognize intonation). Never Sometimes Often Always N/A
4. I recognize when my spouse or loved one is
upset. Never Sometimes Often Always N/A
5. I understand obvious humor (for example, "a
pie in the face"). Never Sometimes Often Always N/A
6. I understand why people are crying at a tragic
event (for example, a car accident or death). Never Sometimes Often Always N/A
7. I misunderstand the intent of the person who is
speaking (for example, I do not recognize when
someone makes a joke or uses sarcasm). ©
Never Sometimes Often Always N/A
8. My tone of voice does not indicate that a minor
problem has occurred (for example, spilling a
drink on some papers).
Never Sometimes Often Always N/A
9. My tone of voice does not indicate an emotion
(for example, anger, urgency, or fear). Never Sometimes Often Always N/A
10. My tone of voice does not indicate that a
question is being asked. Never Sometimes Often Always N/A
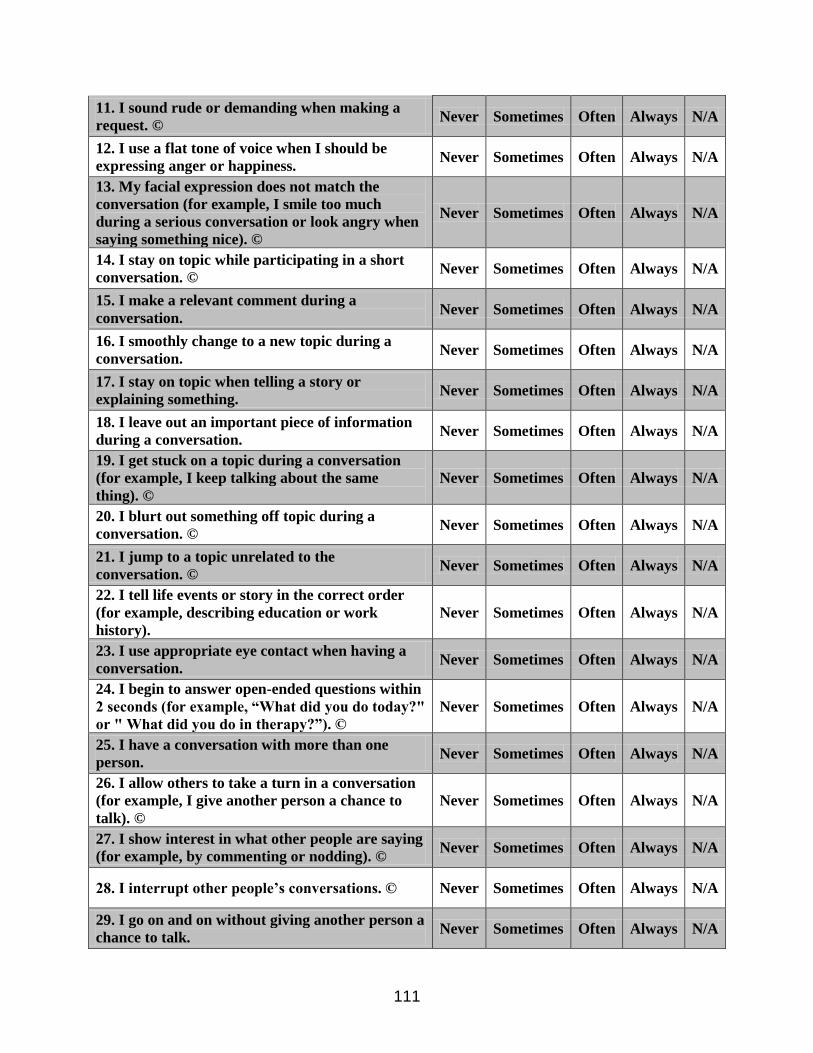
111
11. I sound rude or demanding when making a
request. © Never Sometimes Often Always N/A
12. I use a flat tone of voice when I should be
expressing anger or happiness. Never Sometimes Often Always N/A
13. My facial expression does not match the
conversation (for example, I smile too much
during a serious conversation or look angry when
saying something nice). ©
Never Sometimes Often Always N/A
14. I stay on topic while participating in a short
conversation. © Never Sometimes Often Always N/A
15. I make a relevant comment during a
conversation. Never Sometimes Often Always N/A
16. I smoothly change to a new topic during a
conversation. Never Sometimes Often Always N/A
17. I stay on topic when telling a story or
explaining something. Never Sometimes Often Always N/A
18. I leave out an important piece of information
during a conversation. Never Sometimes Often Always N/A
19. I get stuck on a topic during a conversation
(for example, I keep talking about the same
thing). ©
Never Sometimes Often Always N/A
20. I blurt out something off topic during a
conversation. © Never Sometimes Often Always N/A
21. I jump to a topic unrelated to the
conversation. © Never Sometimes Often Always N/A
22. I tell life events or story in the correct order
(for example, describing education or work
history).
Never Sometimes Often Always N/A
23. I use appropriate eye contact when having a
conversation. Never Sometimes Often Always N/A
24. I begin to answer open-ended questions within
2 seconds (for example, “What did you do today?"
or " What did you do in therapy?”). ©
Never Sometimes Often Always N/A
25. I have a conversation with more than one
person. Never Sometimes Often Always N/A
26. I allow others to take a turn in a conversation
(for example, I give another person a chance to
talk). ©
Never Sometimes Often Always N/A
27. I show interest in what other people are saying
(for example, by commenting or nodding). © Never Sometimes Often Always N/A
28. I interrupt other people’s conversations. © Never Sometimes Often Always N/A
29. I go on and on without giving another person a
chance to talk. Never Sometimes Often Always N/A

112
30. I talk at the wrong time (for example, I talk
when I should be listening). © Never Sometimes Often Always N/A
31. I turn toward a person when speaking to
him/her. Never Sometimes Often Always N/A
32. I walk away from a conversation before it is
finished. © Never Sometimes Often Always N/A
VII. EMOTIONAL FUNCTION
1. I recognize that I had a stroke. Never Sometimes Often Always N/A
2. I recognize that I have problems resulting from
a stroke (for example, trouble talking, walking,
thinking, or remembering things).
Never Sometimes Often Always N/A
3. I recognize that I need assistance for problems
caused by a stroke. Never Sometimes Often Always N/A
4. I attempt tasks that involve thinking skills
beyond my ability (for example, I try to manage
finances alone when I really need help).
Never Sometimes Often Always N/A
5. I attempt to do physical things that I cannot do
(for example, I try to get dressed when needing
physical help).
Never Sometimes Often Always N/A
6. I do not know why things are difficult since
having a stroke. Never Sometimes Often Always N/A
7. I blame others for problems or mistakes. © Never Sometimes Often Always N/A
8. I demonstrate an understanding of my own
abilities (for example, I know what I can and
cannot do, such as driving, returning to
school/work, or cooking). ©
Never Sometimes Often Always N/A
9. I am aware of a problem in functioning, but I
believe it is due to something other than the stroke
(for example, I make excuses or say that's how
I've always been).
Never Sometimes Often Always N/A
10. I attempt to do something that would result in
harm to myself or others (for example, I cook
alone when I need supervision or try to drive with
visual problems).
Never Sometimes Often Always N/A
11. I feel or show a different intensity of emotion
than before the stroke (for example, my emotions
seem to be much stronger or to be lacking or
"flat").
Never Sometimes Often Always N/A
12. I get as much done during the day as I had
planned. Never Sometimes Often Always N/A
13. I see a job through to the end. Never Sometimes Often Always N/A
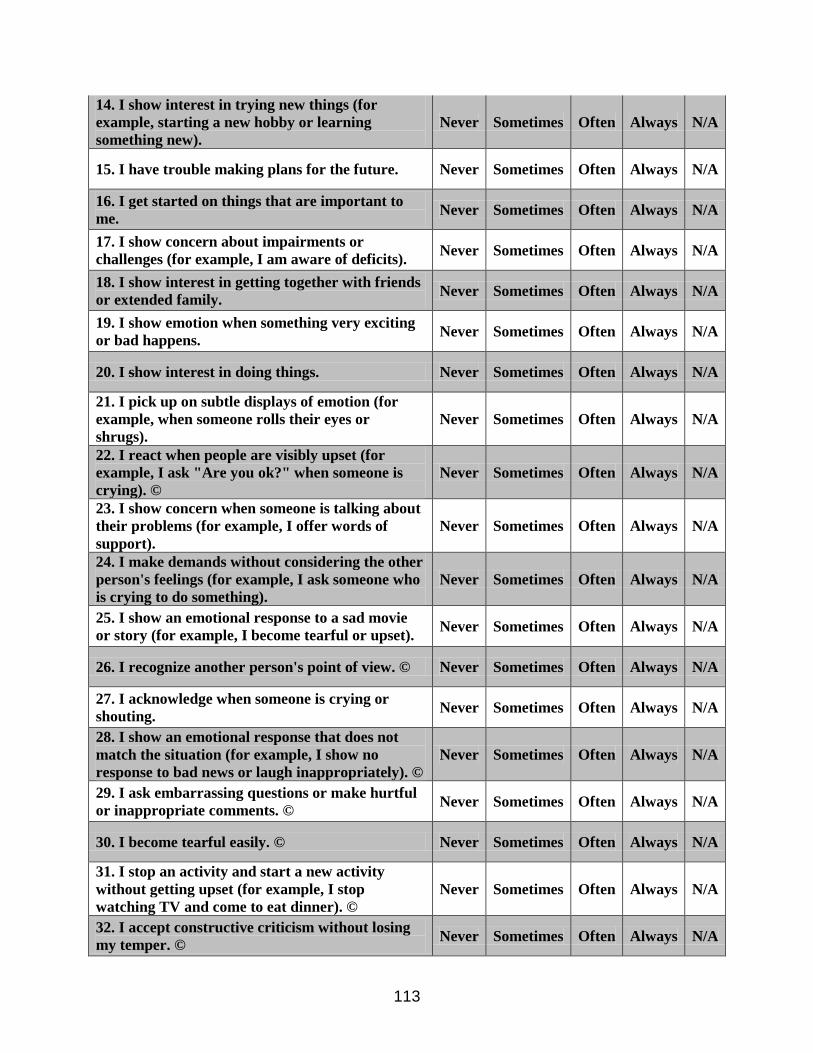
113
14. I show interest in trying new things (for
example, starting a new hobby or learning
something new).
Never Sometimes Often Always N/A
15. I have trouble making plans for the future. Never Sometimes Often Always N/A
16. I get started on things that are important to
me. Never Sometimes Often Always N/A
17. I show concern about impairments or
challenges (for example, I am aware of deficits). Never Sometimes Often Always N/A
18. I show interest in getting together with friends
or extended family. Never Sometimes Often Always N/A
19. I show emotion when something very exciting
or bad happens. Never Sometimes Often Always N/A
20. I show interest in doing things. Never Sometimes Often Always N/A
21. I pick up on subtle displays of emotion (for
example, when someone rolls their eyes or
shrugs).
Never Sometimes Often Always N/A
22. I react when people are visibly upset (for
example, I ask "Are you ok?" when someone is
crying). ©
Never Sometimes Often Always N/A
23. I show concern when someone is talking about
their problems (for example, I offer words of
support).
Never Sometimes Often Always N/A
24. I make demands without considering the other
person's feelings (for example, I ask someone who
is crying to do something).
Never Sometimes Often Always N/A
25. I show an emotional response to a sad movie
or story (for example, I become tearful or upset). Never Sometimes Often Always N/A
26. I recognize another person's point of view. © Never Sometimes Often Always N/A
27. I acknowledge when someone is crying or
shouting. Never Sometimes Often Always N/A
28. I show an emotional response that does not
match the situation (for example, I show no
response to bad news or laugh inappropriately). ©
Never Sometimes Often Always N/A
29. I ask embarrassing questions or make hurtful
or inappropriate comments. © Never Sometimes Often Always N/A
30. I become tearful easily. © Never Sometimes Often Always N/A
31. I stop an activity and start a new activity
without getting upset (for example, I stop
watching TV and come to eat dinner). ©
Never Sometimes Often Always N/A
32. I accept constructive criticism without losing
my temper. © Never Sometimes Often Always N/A
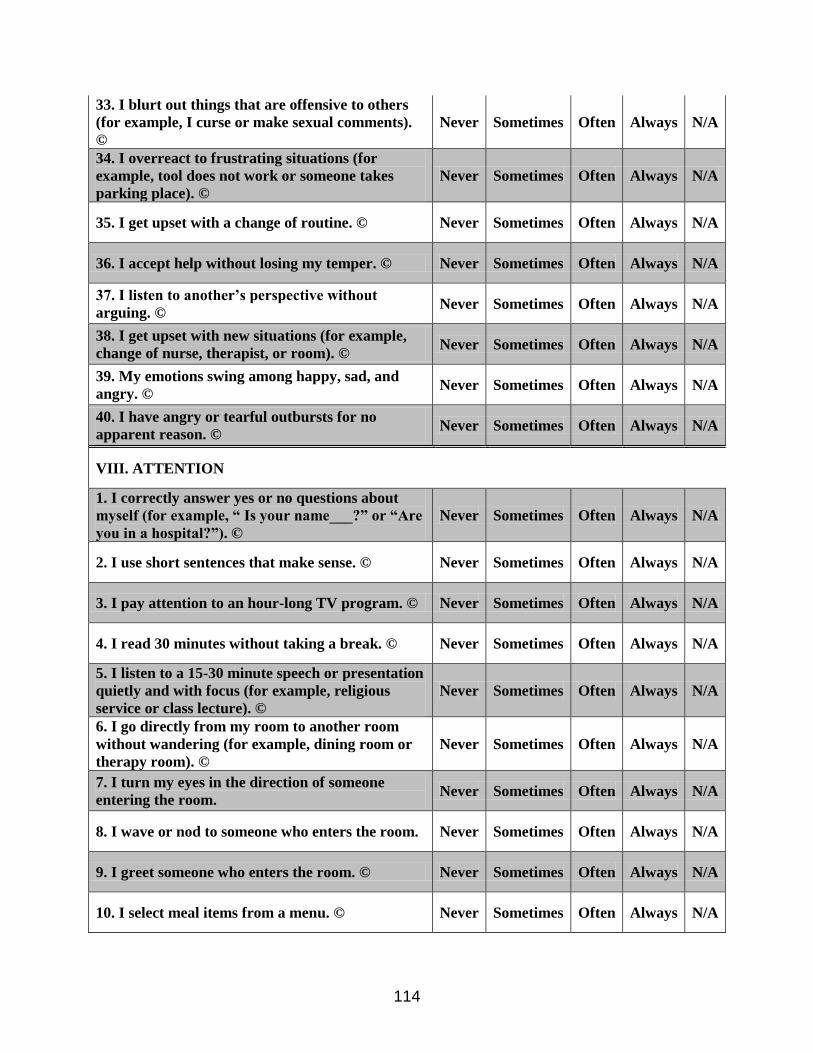
114
33. I blurt out things that are offensive to others
(for example, I curse or make sexual comments).
©
Never Sometimes Often Always N/A
34. I overreact to frustrating situations (for
example, tool does not work or someone takes
parking place). ©
Never Sometimes Often Always N/A
35. I get upset with a change of routine. © Never Sometimes Often Always N/A
36. I accept help without losing my temper. © Never Sometimes Often Always N/A
37. I listen to another’s perspective without
arguing. © Never Sometimes Often Always N/A
38. I get upset with new situations (for example,
change of nurse, therapist, or room). © Never Sometimes Often Always N/A
39. My emotions swing among happy, sad, and
angry. © Never Sometimes Often Always N/A
40. I have angry or tearful outbursts for no
apparent reason. © Never Sometimes Often Always N/A
VIII. ATTENTION
1. I correctly answer yes or no questions about
myself (for example, “ Is your name___?” or “Are
you in a hospital?”). ©
Never Sometimes Often Always N/A
2. I use short sentences that make sense. © Never Sometimes Often Always N/A
3. I pay attention to an hour-long TV program. © Never Sometimes Often Always N/A
4. I read 30 minutes without taking a break. © Never Sometimes Often Always N/A
5. I listen to a 15-30 minute speech or presentation
quietly and with focus (for example, religious
service or class lecture). ©
Never Sometimes Often Always N/A
6. I go directly from my room to another room
without wandering (for example, dining room or
therapy room). ©
Never Sometimes Often Always N/A
7. I turn my eyes in the direction of someone
entering the room. Never Sometimes Often Always N/A
8. I wave or nod to someone who enters the room. Never Sometimes Often Always N/A
9. I greet someone who enters the room. © Never Sometimes Often Always N/A
10. I select meal items from a menu. © Never Sometimes Often Always N/A
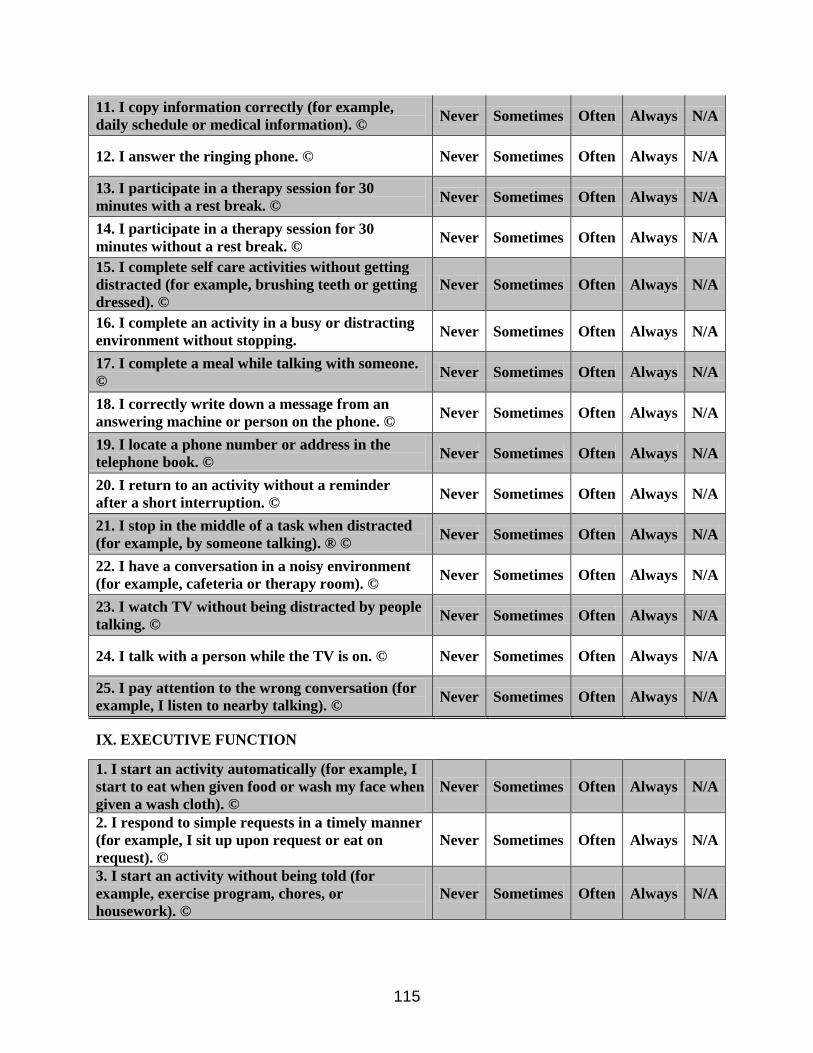
115
11. I copy information correctly (for example,
daily schedule or medical information). © Never Sometimes Often Always N/A
12. I answer the ringing phone. © Never Sometimes Often Always N/A
13. I participate in a therapy session for 30
minutes with a rest break. © Never Sometimes Often Always N/A
14. I participate in a therapy session for 30
minutes without a rest break. © Never Sometimes Often Always N/A
15. I complete self care activities without getting
distracted (for example, brushing teeth or getting
dressed). ©
Never Sometimes Often Always N/A
16. I complete an activity in a busy or distracting
environment without stopping. Never Sometimes Often Always N/A
17. I complete a meal while talking with someone.
© Never Sometimes Often Always N/A
18. I correctly write down a message from an
answering machine or person on the phone. © Never Sometimes Often Always N/A
19. I locate a phone number or address in the
telephone book. © Never Sometimes Often Always N/A
20. I return to an activity without a reminder
after a short interruption. © Never Sometimes Often Always N/A
21. I stop in the middle of a task when distracted
(for example, by someone talking). ® © Never Sometimes Often Always N/A
22. I have a conversation in a noisy environment
(for example, cafeteria or therapy room). © Never Sometimes Often Always N/A
23. I watch TV without being distracted by people
talking. © Never Sometimes Often Always N/A
24. I talk with a person while the TV is on. © Never Sometimes Often Always N/A
25. I pay attention to the wrong conversation (for
example, I listen to nearby talking). © Never Sometimes Often Always N/A
IX. EXECUTIVE FUNCTION
1. I start an activity automatically (for example, I
start to eat when given food or wash my face when
given a wash cloth). ©
Never Sometimes Often Always N/A
2. I respond to simple requests in a timely manner
(for example, I sit up upon request or eat on
request). ©
Never Sometimes Often Always N/A
3. I start an activity without being told (for
example, exercise program, chores, or
housework). ©
Never Sometimes Often Always N/A
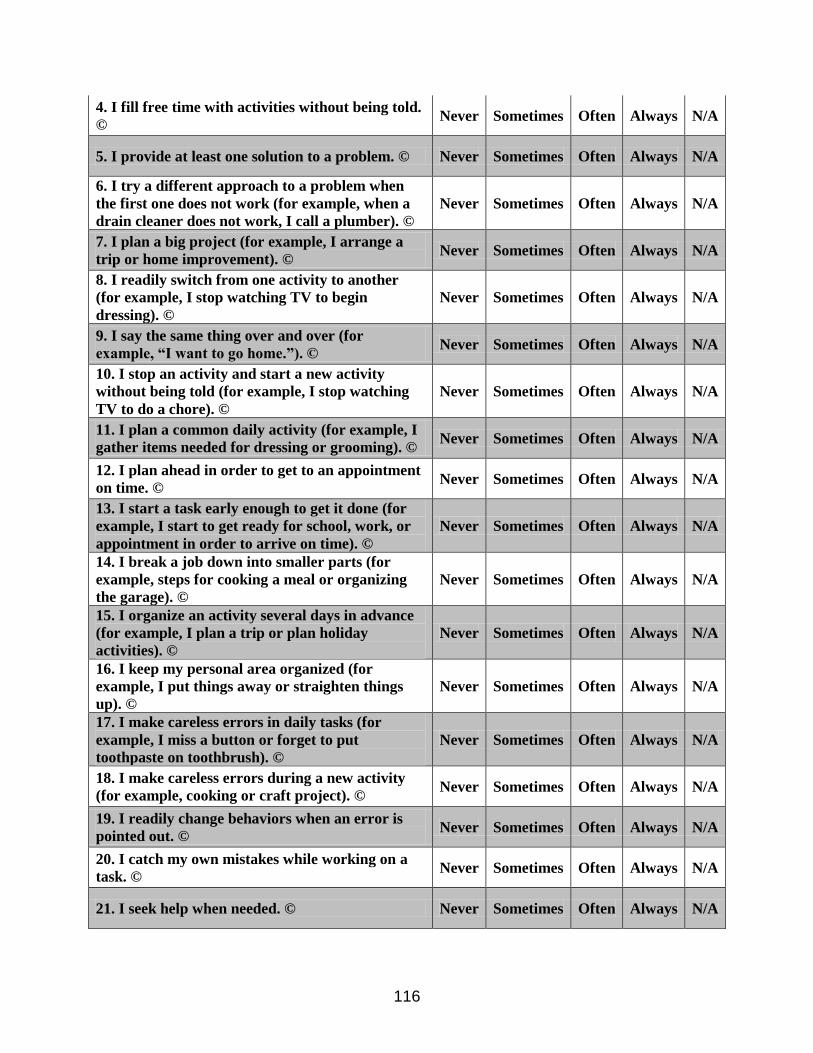
116
4. I fill free time with activities without being told.
© Never Sometimes Often Always N/A
5. I provide at least one solution to a problem. © Never Sometimes Often Always N/A
6. I try a different approach to a problem when
the first one does not work (for example, when a
drain cleaner does not work, I call a plumber). ©
Never Sometimes Often Always N/A
7. I plan a big project (for example, I arrange a
trip or home improvement). © Never Sometimes Often Always N/A
8. I readily switch from one activity to another
(for example, I stop watching TV to begin
dressing). ©
Never Sometimes Often Always N/A
9. I say the same thing over and over (for
example, “I want to go home.”). © Never Sometimes Often Always N/A
10. I stop an activity and start a new activity
without being told (for example, I stop watching
TV to do a chore). ©
Never Sometimes Often Always N/A
11. I plan a common daily activity (for example, I
gather items needed for dressing or grooming). © Never Sometimes Often Always N/A
12. I plan ahead in order to get to an appointment
on time. © Never Sometimes Often Always N/A
13. I start a task early enough to get it done (for
example, I start to get ready for school, work, or
appointment in order to arrive on time). ©
Never Sometimes Often Always N/A
14. I break a job down into smaller parts (for
example, steps for cooking a meal or organizing
the garage). ©
Never Sometimes Often Always N/A
15. I organize an activity several days in advance
(for example, I plan a trip or plan holiday
activities). ©
Never Sometimes Often Always N/A
16. I keep my personal area organized (for
example, I put things away or straighten things
up). ©
Never Sometimes Often Always N/A
17. I make careless errors in daily tasks (for
example, I miss a button or forget to put
toothpaste on toothbrush). ©
Never Sometimes Often Always N/A
18. I make careless errors during a new activity
(for example, cooking or craft project). © Never Sometimes Often Always N/A
19. I readily change behaviors when an error is
pointed out. © Never Sometimes Often Always N/A
20. I catch my own mistakes while working on a
task. © Never Sometimes Often Always N/A
21. I seek help when needed. © Never Sometimes Often Always N/A
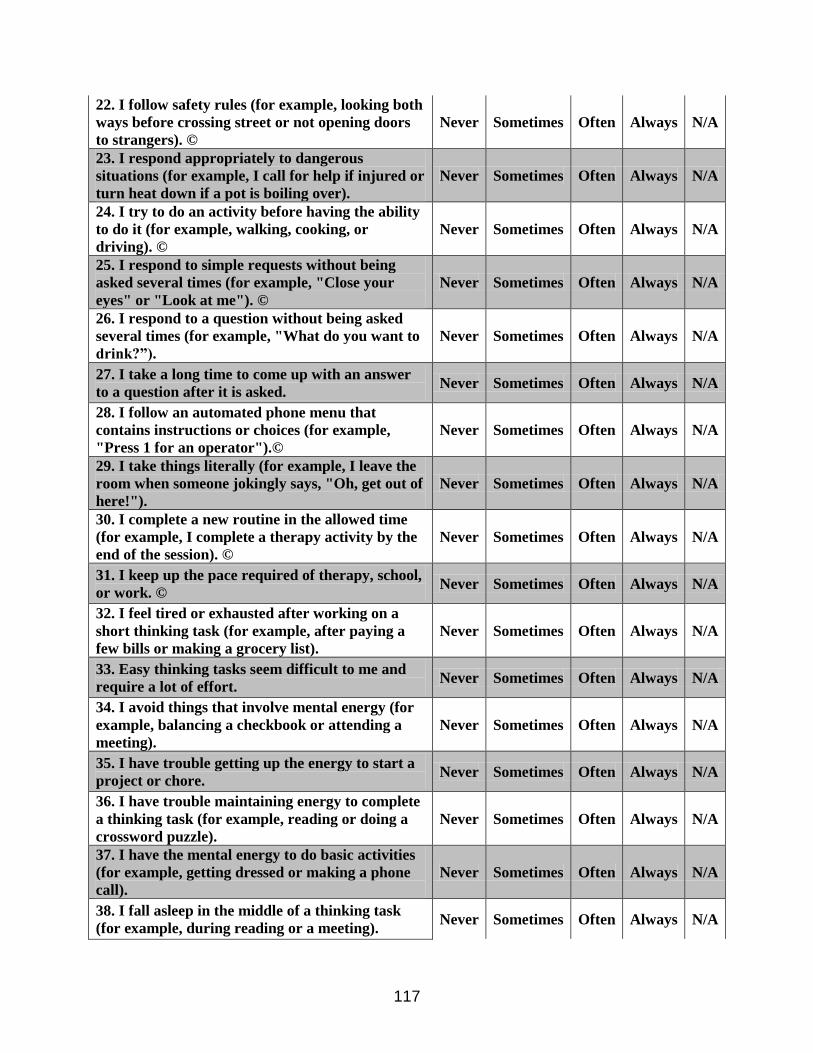
117
22. I follow safety rules (for example, looking both
ways before crossing street or not opening doors
to strangers). ©
Never Sometimes Often Always N/A
23. I respond appropriately to dangerous
situations (for example, I call for help if injured or
turn heat down if a pot is boiling over).
Never Sometimes Often Always N/A
24. I try to do an activity before having the ability
to do it (for example, walking, cooking, or
driving). ©
Never Sometimes Often Always N/A
25. I respond to simple requests without being
asked several times (for example, "Close your
eyes" or "Look at me"). ©
Never Sometimes Often Always N/A
26. I respond to a question without being asked
several times (for example, "What do you want to
drink?”).
Never Sometimes Often Always N/A
27. I take a long time to come up with an answer
to a question after it is asked. Never Sometimes Often Always N/A
28. I follow an automated phone menu that
contains instructions or choices (for example,
"Press 1 for an operator").©
Never Sometimes Often Always N/A
29. I take things literally (for example, I leave the
room when someone jokingly says, "Oh, get out of
here!").
Never Sometimes Often Always N/A
30. I complete a new routine in the allowed time
(for example, I complete a therapy activity by the
end of the session). ©
Never Sometimes Often Always N/A
31. I keep up the pace required of therapy, school,
or work. © Never Sometimes Often Always N/A
32. I feel tired or exhausted after working on a
short thinking task (for example, after paying a
few bills or making a grocery list).
Never Sometimes Often Always N/A
33. Easy thinking tasks seem difficult to me and
require a lot of effort. Never Sometimes Often Always N/A
34. I avoid things that involve mental energy (for
example, balancing a checkbook or attending a
meeting).
Never Sometimes Often Always N/A
35. I have trouble getting up the energy to start a
project or chore. Never Sometimes Often Always N/A
36. I have trouble maintaining energy to complete
a thinking task (for example, reading or doing a
crossword puzzle).
Never Sometimes Often Always N/A
37. I have the mental energy to do basic activities
(for example, getting dressed or making a phone
call).
Never Sometimes Often Always N/A
38. I fall asleep in the middle of a thinking task
(for example, during reading or a meeting). Never Sometimes Often Always N/A
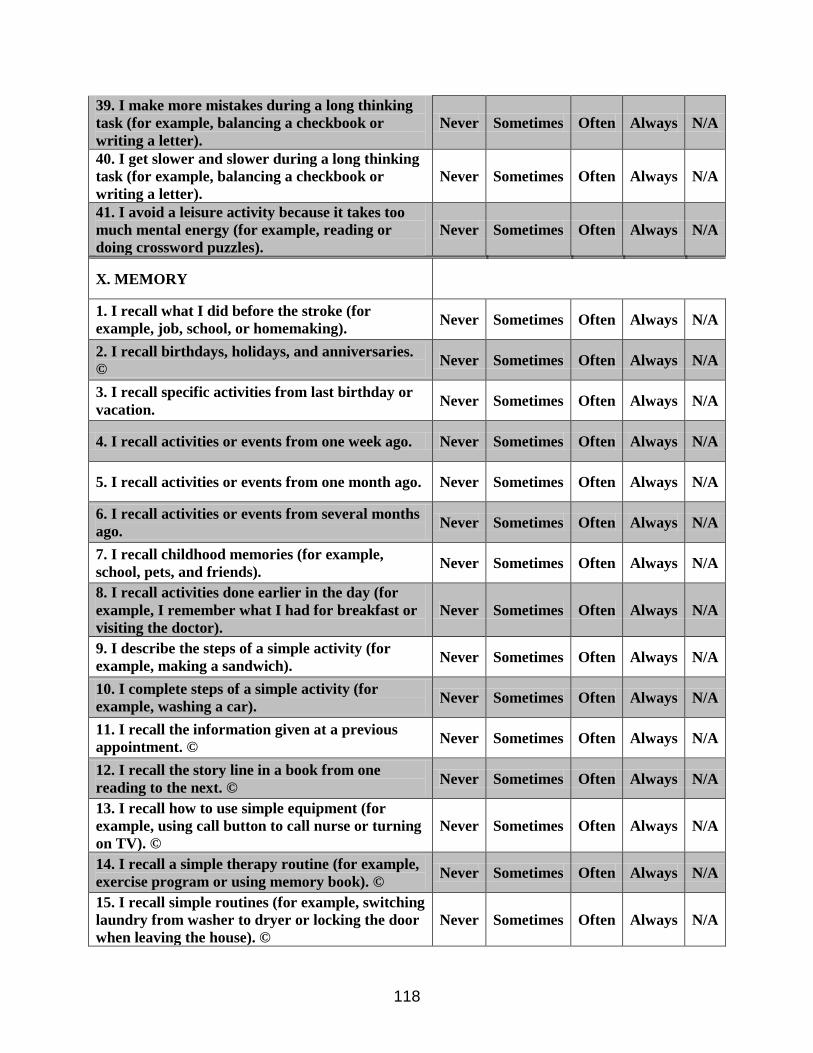
118
39. I make more mistakes during a long thinking
task (for example, balancing a checkbook or
writing a letter).
Never Sometimes Often Always N/A
40. I get slower and slower during a long thinking
task (for example, balancing a checkbook or
writing a letter).
Never Sometimes Often Always N/A
41. I avoid a leisure activity because it takes too
much mental energy (for example, reading or
doing crossword puzzles).
Never Sometimes Often Always N/A
X. MEMORY
1. I recall what I did before the stroke (for
example, job, school, or homemaking). Never Sometimes Often Always N/A
2. I recall birthdays, holidays, and anniversaries.
© Never Sometimes Often Always N/A
3. I recall specific activities from last birthday or
vacation. Never Sometimes Often Always N/A
4. I recall activities or events from one week ago. Never Sometimes Often Always N/A
5. I recall activities or events from one month ago. Never Sometimes Often Always N/A
6. I recall activities or events from several months
ago. Never Sometimes Often Always N/A
7. I recall childhood memories (for example,
school, pets, and friends). Never Sometimes Often Always N/A
8. I recall activities done earlier in the day (for
example, I remember what I had for breakfast or
visiting the doctor).
Never Sometimes Often Always N/A
9. I describe the steps of a simple activity (for
example, making a sandwich). Never Sometimes Often Always N/A
10. I complete steps of a simple activity (for
example, washing a car). Never Sometimes Often Always N/A
11. I recall the information given at a previous
appointment. © Never Sometimes Often Always N/A
12. I recall the story line in a book from one
reading to the next. © Never Sometimes Often Always N/A
13. I recall how to use simple equipment (for
example, using call button to call nurse or turning
on TV). ©
Never Sometimes Often Always N/A
14. I recall a simple therapy routine (for example,
exercise program or using memory book). © Never Sometimes Often Always N/A
15. I recall simple routines (for example, switching
laundry from washer to dryer or locking the door
when leaving the house). ©
Never Sometimes Often Always N/A
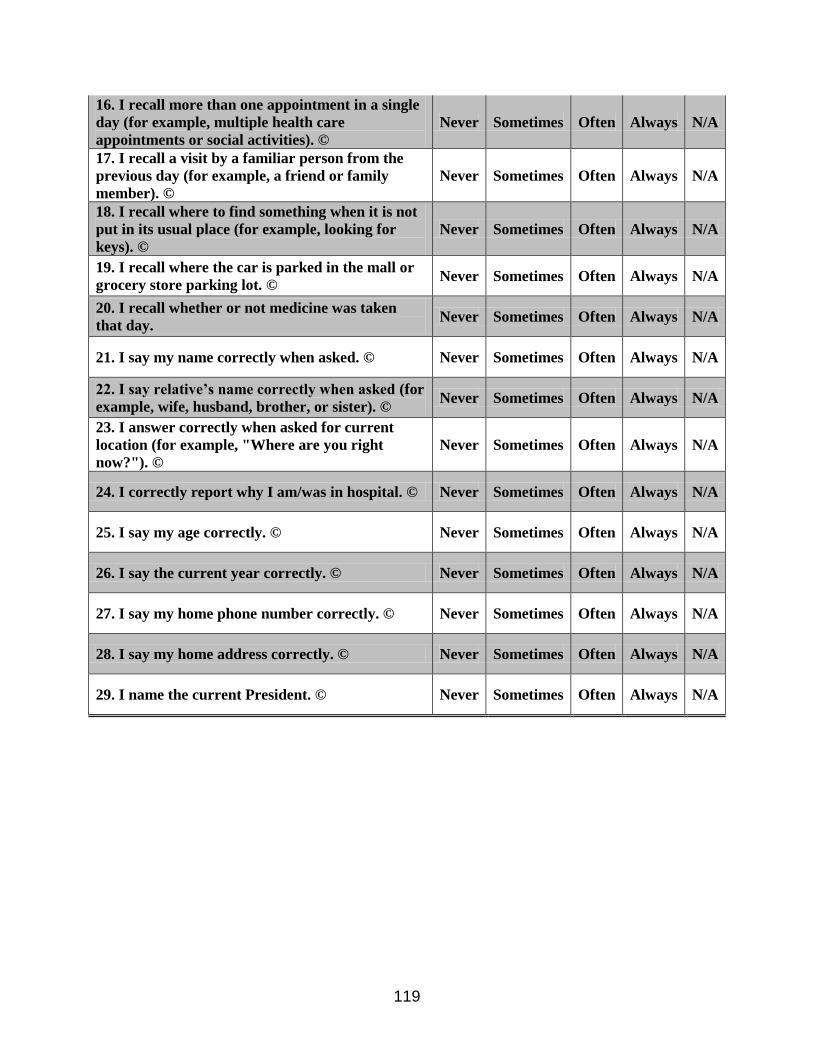
119
16. I recall more than one appointment in a single
day (for example, multiple health care
appointments or social activities). ©
Never Sometimes Often Always N/A
17. I recall a visit by a familiar person from the
previous day (for example, a friend or family
member). ©
Never Sometimes Often Always N/A
18. I recall where to find something when it is not
put in its usual place (for example, looking for
keys). ©
Never Sometimes Often Always N/A
19. I recall where the car is parked in the mall or
grocery store parking lot. © Never Sometimes Often Always N/A
20. I recall whether or not medicine was taken
that day. Never Sometimes Often Always N/A
21. I say my name correctly when asked. © Never Sometimes Often Always N/A
22. I say relative’s name correctly when asked (for
example, wife, husband, brother, or sister). © Never Sometimes Often Always N/A
23. I answer correctly when asked for current
location (for example, "Where are you right
now?"). ©
Never Sometimes Often Always N/A
24. I correctly report why I am/was in hospital. © Never Sometimes Often Always N/A
25. I say my age correctly. © Never Sometimes Often Always N/A
26. I say the current year correctly. © Never Sometimes Often Always N/A
27. I say my home phone number correctly. © Never Sometimes Often Always N/A
28. I say my home address correctly. © Never Sometimes Often Always N/A
29. I name the current President. © Never Sometimes Often Always N/A
120
LIST OF REFERENCES
1. Wright BD, Linacre JM, Gustafson J, Martin-Lof P. Reasonable mean-square fit values. Rasch measurement transactions. 1994;8:370.
2. Allaire JC, Marsiske M. Everyday cognition: age and intellectual ability correlates. Psychology and Aging; Psychology and Aging. 1999;14:627.
3. Arbuthnott K, Frank J. Trail making test, part B as a measure of executive control: validation using a set-switching paradigm. Journal of Clinical and Experimental Neuropsychology. 2000;22:518-528.
4. Baltes PB, Cornelius SW, Spiro A, Nesselroade JR, Willis SL. Integration versus differentiation of fluid/crystallized intelligence in old age. Developmental Psychology. 1980;16:625-635.
5. Berg KO, Maki BE, Williams JI, Holliday PJ, Wood-Dauphinee SL. Clinical and laboratory measures of postural balance in an elderly population. Archives of physical medicine and rehabilitation. 1992;73:1073.
6. Blom G. Statistical elements and transformed beta variables. 1958
7. Bond T, Fox C. Applying the Rasch model: Fundamental measurement in the human sciences. Lawrence Erlbaum; 2007.
8. Bond TG, Fox, C. M. Applying the Rasch Model: Fundamental Measurement in the Human Sciences. Mahwah, New Jersey: Lawrence Erlbaum Associates; 2007.
9. Caplan B, Moelter S. Stroke. In: Frank RG, Elliott TR, eds. Handbook of Rehabilitation Psychology. Washington, DC: American Psychological Association; 2000:75-108.
10. Carroll JB. The three-stratum theory of cognitive abilities. 1997.
11. Carroll JB. The higher-stratum structure of cognitive abilities: Current evidence supports g and about ten broad factors. The scientific study of general intelligence: Tribute to Arthur R Jensen. 2003;5-21.
12. Cattell RB. Theory of fluid and crystallized intelligence: A critical experiment. Journal of educational psychology. 1963;54:1.
13. Cattell RB. The scree test for the number of factors. Multivariate behavioral research. 1966;1:245-276.
121
14. Cella D, Riley W, Stone A et al. The Patient-Reported Outcomes Measurement Information System (PROMIS) developed and tested its first wave of adult self-reported health outcome item banks: 2005-2008. J Clin Epidemiol. 2010;63:1179-1194.
15. Conrad KJ, Wright BD, Mcknight P, Mcfall M, Fontana A, Rosenheck R. Comparing traditional and Rasch analyses of the Mississippi PTSD scale: Revealing limitations of reverse-scored items. Journal of Applied Measurement. 2004;5:15-30.
16. Cook DA, Beckman TJ. Current concepts in validity and reliability for psychometric instruments: theory and application. The American journal of medicine. 2006;119:166-e16.
17. Coster WJ, Haley SM, Ludlow LH, Andres PL, Ni PS. Development of an applied cognition scale to measure rehabilitation outcomes. Archives of physical medicine and rehabilitation. 2004;85:2030-2035.
18. Cournan M. Use of the functional independence measure for outcomes measurement in acute inpatient rehabilitation. Rehabilitation Nursing. 2011;36:111-117.
19. De Frias CM, Lövdén M, Lindenberger U, Nilsson L-G. Revisiting the dedifferentiation hypothesis with longitudinal multi-cohort data. Intelligence. 2007;35:381-392.
20. Delis DC, Kaplan E, Kramer JH. Delis-Kaplan executive function system (D-KEFS). Psychological Corporation; 2001.
21. Devellis RF. Classical Test Theory. Medical Care. 2006;44:S50-S59.
22. Diehl M, Marsiske M, Horgas A, Rosenberg A, Saczynski J, Willis S. The Revised Observed Tasks of Daily Living: A Performance-Based Assessment of Everyday Problem Solving in Older Adults. J Appl Gerontol. 2005;24:211-230.
23. Donovan NJ, Kendall DL, Heaton SC, Kwon S, Velozo CA, Duncan PW. Conceptualizing functional cognition in stroke. Neurorehabilitation and Neural Repair. 2008;22:122.
24. Duncan PW, Horner RD, Reker DM et al. Adherence to postacute rehabilitation guidelines is associated with functional recovery in stroke. Stroke. 2002;33:167-178.
25. Duncan PW, Lai SM, Keighley J. Defining post-stroke recovery: implications for design and interpretation of drug trials. Neuropharmacology. 2000;39:835.
122
26. Dunnett CW. A multiple comparison procedure for comparing several treatments with a control. Journal of the American Statistical Association. 1955;50:1096-1121.
27. Fisher WP. The Cash Value of Reliability. Rasch Measurement Transactions. 2008;22:1160-1163.
28. Floyd FJ, Widaman KF. Factor analysis in the development and refinement of clinical assessment instruments. Psychological assessment. 1995;7:286-299.
29. Foundas AL, Macauley BL, Raymer AM, Maher LM, Heilman KM, Rothi LJG. Ecological implications of limb apraxia: evidence from mealtime behavior. J Int Neuropsychol Soc. 1995;1:62-66.
30. Frattali C, Thompson C, Holland A, Wohl C, Ferketic M. American speech-language-hearing association functional assessment of communication skills for adults. Rockville, Md: ASHA. 1995.
31. Garcia C, Leahy B, Corradi K, Forchetti C. Component structure of the Repeatable Battery for the Assessment of Neuropsychological Status in dementia. Archives of Clinical Neuropsychology. 2008;23:63-72.
32. Gorsuch RL. Exploratory factor analysis: Its role in item analysis. Journal of personality assessment. 1997;68:532-560.
33. Guadagnoli E, Velicer WF. Relation to sample size to the stability of component patterns. Psychological bulletin. 1988;103:265.
34. Haley SM, Ni P, Lai JS et al. Linking the Activity Measure for Post Acute Care and the Quality of Life Outcomes in Neurological Disorders. Archives of physical medicine and rehabilitation. 2011;92:S37-S43.
35. Heilman KM, Maher LM, Greenwald ML, Rothi LJG. Conceptual apraxia from lateralized lesions. Neurology. 1997;49:457-464.
36. Hemphill JF. Interpreting the magnitudes of correlation coefficients. American Psychologist. 2003;58:78-78.
37. Hinkin TR. A review of scale development practices in the study of organizations. Journal of Management. 1995;21:967-988.
38. Hobart MP, Goldberg R, Bartko JJ, Gold JM. Repeatable battery for the assessment of neuropsychological status as a screening test in schizophrenia, II: convergent/discriminant validity and diagnostic group comparisons. American Journal of Psychiatry. 1999;156:1951-1957.
39. Horn JL, Cattell RB. Age differences in fluid and crystallized intelligence. Acta psychologica. 1967;26:107-129.

123
40. Corp. IBM. IBM SPSS Statistics for Windows. Armonk, NY: 2012.
41. Jette DU, Halbert J, Iverson C, Miceli E, Shah P. Use of Standardized Outcome Measures in Physical Therapist Practice: Perceptions and Applications. Physical Therapy. 2009;89:125-135.
42. Kaiser HF. The application of electronic computers to factor analysis. Educational and psychological measurement. 1960.
43. Kane R. Understanding health care outcomes research. Jones & Bartlett Learning; 2008.
44. Keith RA, Granger CV, Hamilton BB, Sherwin FS. The functional independence measure: a new tool for rehabilitation. Advances in clinical rehabilitation. 1987;1:6.
45. Kelley T, Ebel R, Linacre J. Item discrimination indices. Rasch Measurement Transactions. 2002;16:883-884.
46. Kirasic KC, Allen GL, Dobson SH, Binder KS. Aging, cognitive resources, and declarative learning. Psychology and Aging. 1996;11:658.
47. Kollen B, Kwakkel G, Lindeman E. Functional recovery after stroke: a review of current developments in stroke rehabilitation research. Reviews on Recent Clinical Trials. 2006;1:75-80.
48. Kramer A, Holthaus D. Uniform patient assessment for post-acute care. Aurora: Division of Health Care Policy and Research University of Colorado at Denver and Health Sciences Center. 2006.
49. Lamberty GJ, Putnam SH, Chatel DM, Bieliauskas LA, Adams KM. A Preliminary Report. Cognitive and Behavioral Neurology. 1994;7:230-234.
50. Larson EB, Kirschner K, Bode R, Heinemann A, Goodman R. Construct and predictive validity of the Repeatable Battery for the Assessment of Neuropsychological Status in the evaluation of stroke patients. Journal of Clinical and Experimental Neuropsychology. 2005;27:16-32.
51. Larson EB, Kirschner K, Bode RK, Heinemann AW, Clorfene J, Goodman R. Brief cognitive assessment and prediction of functional outcome in stroke. Topics in stroke rehabilitation. 2003;9:10-21.
52. Lehto JE, Juujärvi P, Kooistra L, Pulkkinen L. Dimensions of executive functioning: Evidence from children. British Journal of Developmental Psychology. 2003;21:59-80.
53. J.M. L. Unidimensional Models in a Multidimensional World. Rasch Measurement Transactions. 2009;23:1209.
124
54. Linacre J. a href="http://www.ncbi.nlm.nih.gov/pubmed/20485233">Two perspectives on the application of Rasch models.</a>. European journal of physical and rehabilitation …. 2010.
55. Linacre J. Oregon: Winsteps.Com. Winsteps® Rasch measurement computer program. 2012.
56. Linacre JM. Detecting multidimensionality: which residual data-type works best? Journal of outcome measurement. 1998;2:266-283.
57. Linacre JM. Optimizing rating scale category effectiveness. Journal of applied measurement. 2002;3:85-106.
58. Linacre JM. Winsteps® Rasch measurement computer program User's Guide. 2012
59. Linacre JM. Sample size and item calibration stability. Rasch Measurement Transactions. 1994;7:328.
60. Little TD, Cunningham WA, Shahar G, Widaman KF. To parcel or not to parcel: Exploring the question, weighing the merits. Structural Equation Modeling. 2002;9:151-173.
61. Magasi S, Ryan G, Revicki D et al. Content validity of patient-reported outcome measures: perspectives from a PROMIS meeting. Quality of Life Research. 2012;21:739-746.
62. Mcgrew KS. The Cattell-Horn-Carroll Theory of Cognitive Abilities: Past, Present, and Future. 2005.
63. Mcphail S, Beller E, Haines T. Two perspectives of proxy reporting of health-related quality of life using the Euroqol-5D, an investigation of agreement. Medical care. 2008;46:1140-1148.
64. Miyake A, Friedman NP, Emerson MJ, Witzki AH, Howerter A, Wager TD. The unity and diversity of executive functions and their contributions to complex “frontal lobe” tasks: A latent variable analysis. Cognitive psychology. 2000;41:49-100.
65. Mooney S, Hasssanein TI, Hilsabeck RC et al. Utility of the Repeatable Battery for the Assessment of Neuropsychological Status (RBANS) in patients with end-stage liver disease awaiting liver transplant. Archives of clinical neuropsychology. 2007;22:175-186.
66. Research plan for the national center for medical rehabilitation research. 1993, National Institutes of Health.

125
67. Nys G, Van Zandvoort M, De Kort P et al. The prognostic value of domain-specific cognitive abilities in acute first-ever stroke. Neurology. 2005;64:821-827.
68. Ochipa C, Rothi LG, Heilman KM. Ideational apraxia: A deficit in tool selection and use. Annals of neurology. 1989;25:190-193.
69. Pachet AK. Construct validity of the Repeatable Battery of Neuropsychological Status (RBANS) with acquired brain injury patients. The Clinical Neuropsychologist. 2007;21:286-293.
70. Pharr V, Uttl B, Stark M, Litvan I, Fantie B, Grafman J. Comparison of apraxia in corticobasal degeneration and progressive supranuclear palsy. Neurology. 2001;56:957-963.
71. Radloff LS. The CES-D scale A self-report depression scale for research in the general population. Applied psychological measurement. 1977;1:385-401.
72. Randolph C, Tierney MC, Mohr E, Chase TN. The Repeatable Battery for the Assessment of Neuropsychological Status (RBANS): preliminary clinical validity. Journal of clinical and experimental neuropsychology. 1998;20:310-319.
73. Reeve BB, Hays RD, Bjorner JB et al. Psychometric evaluation and calibration of health-related quality of life item banks: plans for the Patient-Reported Outcomes Measurement Information System (PROMIS). Med Care. 2007;45:S22-31.
74. Roth RM, Gioia GA. Behavior Rating Inventory of Executive Function--adult Version. Psychological Assessment Resources; 2005.
75. Rothi L, Raymer A, Ochipa C, Maher L, Greenwald M, Heilman K. Florida apraxia battery, experimental edition. Gainesville, FL: Univ of Florida College of Medicine. 1992
76. Sackley CML, Nadina B. Physiotherapy treatment for stroke patients: A survey of current practice. Physiotherapy Theory and Practice. 1996;12:87-96.
77. Sohlberg MM, Mateer CA. Cognitive rehabilitation : an integrative neuropsychological approach. New York: Guilford Press; 2001.
78. Spearman CE. The Abilities of Man, Their Nature and Measurement. ment. Macmillan; 1927.
79. Spreen O, Strauss E. A Compendium of Neuropsychological Tests: Administration, Norms, and Commentary: Administration, Norms, and Commentary. Oxford University Press, USA; 1998.
80. Tombaugh TN. Trail Making Test A and B: Normative data stratified by age and education. Archives of Clinical Neuropsychology. 2004;19:203-214.
126
81. Velozo CA, Byers KL, Joseph B. Translating measures across the continuum of care: Using Rasch analysis to create a crosswalk between the Functional Independence Measure and the Minimum Data Set. Journal of rehabilitation research and development. 2007;44:467.
82. Velozo CA, Peterson EW. Developing meaningful fear of falling measures for community dwelling elderly. American journal of physical medicine & rehabilitation. 2001;80:662.
83. Velozo CA, Seel RT, Magasi S, Heinemann AW, Romero S. Improving Measurement Methods in Rehabilitation: Core Concepts and Recommendations for Scale Development. Archives of Physical Medicine and Rehabilitation. 2012;93:S154-S163.
84. Velozo CA, Woodbury ML. Translating measurement findings into rehabilitation practice: An example using Fugl-Meyer Assessment-Upper Extremity with patients following stroke. Journal of rehabilitation research and development. 2011;48:1-11.
85. Wagle J, Farner L, Flekkøy K et al. Early Post-Stroke Cognition in Stroke Rehabilitation Patients Predicts Functional Outcome at 13 Months. Dementia and Geriatric Cognitive Disorders. 2011;31:379-387.
86. Wang W-C, Chen C-T. Item parameter recovery, standard error estimates, and fit statistics of the WINSTEPS program for the family of Rasch models. Educational and Psychological Measurement. 2005;65:376-404.
87. Wechsler D. Wechsler Adult Intelligence Scale (WAIS). Journal of Consulting Psychology. 1955;19:319-320.
88. West RL, Crook TH, Barron KL. Everyday memory performance across the life span: effects of age and noncognitive individual differences. Psychology and aging. 1992;7:72.
89. Wilson BA, Cockburn J, Baddeley A. The Rivermead behavioural memory test. Pearson; 2008.
90. Woodbury ML, Velozo CA, Richards LG, Duncan PW, Studenski S, Lai SM. Dimensionality and construct validity of the Fugl-Meyer Assessment of the upper extremity. Archives of physical medicine and rehabilitation. 2007;88:715-723.
91. Wright BD. Sample-free test calibration and person measurement. 1968;Proceedings of the 1967 invitational conference on testing problems:85-101.
92. Wright BD, Stone MH. Measurement essentials. Wilmington, DE: Wide Range. 1999.
127
BIOGRAPHICAL SKETCH
Kathleen Berger, PT graduated with her Bachelor of Science in physical therapy
in 1984 from Northwestern University. Her clinical experience has been divided between
the fields of geriatrics and pediatrics Her earlier work included employment in the home
care setting, skilled nursing facility, and rehabilitation centers with persons with stroke.
More recently, her work has focused on persons with developmental disability. After
her son was diagnosed with a seizure disorder and autism in 1990, she was pushed into
understanding more about autism. Then, after founding and directing a therapy
intensive respite program for children with autism and their families, Kathleen returned
to graduate school to become competent to do research to understand autism better,
especially persons with nonverbal autism. Kathleen completed her Master of Science in
psychology in 2010, and her PhD in rehabilitation science from the University of Florida
in 2013.