Embed Size (px)
Citation preview

1
EFFECTS OF LASER LABELING ON THE STORAGE QUALITY OF SELECTED FRESH FRUITS AND VEGETABLES
By
PREETI SOOD
A THESIS PRESENTED TO THE GRADUATE SCHOOL OF THE UNIVERSITY OF FLORIDA IN PARTIAL FULFILLMENT
OF THE REQUIREMENTS FOR THE DEGREE OF MASTER OF SCIENCE
UNIVERSITY OF FLORIDA
2009

2
© 2009 Preeti Sood

3
To my late grandmother Mrs. Vedvati Sood, my parents Mr. Subhash Chandra Sood and Mrs. Subhash Sood and my lovable brothers Prashant and Dhanvesh

4
ACKNOWLEDGMENTS
First and foremost, I would like to express my deepest thanks and gratitude to Dr. Edgardo
Etxeberria, my committee chair, for providing me the opportunity to work on such an interesting
project. I certainly feel myself fortunate enough to work with him and greatly appreciate all his
guidance, encouragement and valuable advice he has given throughout my degree program.
Many thanks to all my supervisory committee members, Dr. Steve Sargent, Dr. Mark
Ritenour and Dr. Jan Narciso for serving on my committee and their help, support and valuable
discussions towards the successful completion of this work. Special thanks to Chris Ference and
James Holeton for helping me conduct my experiments. A huge appreciation for Pedro
Gonzalez, my labmate for all his help whether it was fruit pick-up, labeling, discussing current
topics etc. I cannot be thankful enough to people at CREC, Paul Weikel, Tam Nyugen, John
Henderson and Katherine Snyder for helping me in many ways. I express my thanks to Dr.
Schumann for writing software which helped in assessing data.
I am personally indebted to Greg Drouilliard, the inventor of the laser labeling machine as
without his initiation this work would not have been conducted. I would also like to extend my
special thanks to friends here in US especially Saurabh Morarka, Nicacio Cruz Huerta, and
Desire Djidonou, and not to mention my friends at CREC, Manjul Dutt and Karthik John
Karrupiah for their help and support.
Finally my deepest appreciation for my family members in India, my parents Mr. Subhash
Chandra Sood and Mrs. Subhash Sood, my brothers Prashant and Dhanvesh for their love,
motivation and support throughout my entire life. My thanks to friend Lovejot Chaudhary and
her parents for their love and support till date.

5
TABLE OF CONTENTS
Page
ACKNOWLEDGMENTS.................................................................................................................... 4
LIST OF TABLES................................................................................................................................ 7
LIST OF FIGURES .............................................................................................................................. 8
LIST OF ABBREVIATIONS ............................................................................................................ 11
ABSTRACT ........................................................................................................................................ 12
CHAPTER
1 INTRODUCTION AND LITERATURE REVIEW................................................................. 14
1.1 Fruit Anatomy and Classification .................................................................................... 15 1.2 Postharvest Concerns ........................................................................................................ 16 1.3 Traceback ........................................................................................................................... 18 1.4 Produce Labeling............................................................................................................... 19 1.5 Laser Labeling ................................................................................................................... 21
2 EFFECTS OF LASER LABELING ON THE QUALITY OF TANGERINES DURING STORAGE .............................................................................................................................. 25
2.1 Introduction ....................................................................................................................... 25 2.2 Materials and Methods ...................................................................................................... 25
2.2.1 Plant Material ........................................................................................................ 25 2.2.2 Exposure Time Selection ..................................................................................... 26 2.2.3 Water Loss ............................................................................................................ 26 2.2.4 Effects of Waxes on Water Loss from Labeled Areas ....................................... 27 2.2.5 Peel Stability ......................................................................................................... 27 2.2.6 Decay Study .......................................................................................................... 28 2.2.7 Inoculation Study .................................................................................................. 28
2.3 Results and Discussion ..................................................................................................... 29 2.3.1 Water Loss ............................................................................................................ 30 2.3.2 Effects of Waxes on Water Reduction from Labeled Areas .............................. 31 2.3.3 Peel Stability ......................................................................................................... 32 2.3.4 Decay Study .......................................................................................................... 34
3 LASER ETCHING: A NOVEL TECHNOLOGY TO LABEL FLORIDA GRAPEFRUIT . 37
3.1 Introduction ....................................................................................................................... 37 3.2 Materials and Methods ...................................................................................................... 38
3.2.1 Plant Material ........................................................................................................ 38 3.2.2 Fruit Labeling........................................................................................................ 38

6
3.2.3 Selection of Optimal Exposure Time .................................................................. 38 3.2.4 Determination of Water Loss ............................................................................... 39 3.2.5 Effect of Different Waxes on Water Loss from Labeled Areas......................... 40 3.2.6 Peel Stability ......................................................................................................... 40 3.2.7 Decay Study .......................................................................................................... 41 3.2.8 Mold Inoculation Study ........................................................................................ 41
3.3 Results ................................................................................................................................ 42 3.3.1 Optimization of Exposure Time for Grapefruit Labeling .................................. 42 3.3.2 Measurements of Water Loss ............................................................................... 43 3.3.3 Effect of Waxes on Water Loss Retardation in Labeled Area ........................... 44 3.3.4 Peel Stability ......................................................................................................... 45 3.3.5 Decay Study .......................................................................................................... 47
3.4 Discussion .......................................................................................................................... 49
4 EFFECTS OF LASER LABELING ON THE POSTHARVEST STORAGE BEHAVIOUR OF TOMATO AND PEPPER FRUIT ........................................................ 53
4.1 Introduction ....................................................................................................................... 53 4.2 Materials and Methods ...................................................................................................... 54
4.2.1 Plant Material ........................................................................................................ 54 4.2.2 Fruit Labeling........................................................................................................ 55 4.2.3 Selection of Optimal Exposure Time .................................................................. 55 4.2.4 Determination of Water Loss ............................................................................... 55 4.2.5 Peel Stability ......................................................................................................... 55 4.2.6 Decay Study .......................................................................................................... 56 4.2.7 Inoculation Study .................................................................................................. 57
4.3 Results ................................................................................................................................ 57 4.3.1 Optimum Exposure Time for Labeling ............................................................... 57 4.3.2 Measurements of Water Loss ............................................................................... 59 4.3.3 Peel Stability ......................................................................................................... 61 4.3.4 Decay Study .......................................................................................................... 65
4.4 Discussion .......................................................................................................................... 67
5 CONCLUSIONS ......................................................................................................................... 70
LIST OF REFERENCES ................................................................................................................... 73
BIOGRAPHICAL SKETCH ............................................................................................................. 77

7
LIST OF TABLES
Table page 2-1 Nine commercial waxes tested for water loss reduction from laser labeled areas ............. 27
2-2 Peel stability of laser labeled “Honey Tangerine” using 45µs and stored at 10 oC and 65% RH................................................................................................................................... 33
2-3 Peel stability of laser labeled “Honey Tangerine” using 45µs and stored at 10 oC and 95% RH................................................................................................................................... 33
2-4 Decay of non laser labeled and laser labeled “Honey Tangerine” using four different exposure time.......................................................................................................................... 34
3-1 Nine commercial waxes tested for water loss reduction from laser labeled areas ............. 40
3-2 Peel stability of laser labeled “Ruby Red” grapefruit using 45µs and stored at 10 oC and 95% RH............................................................................................................................ 46
3-3 Peel stability of laser labeled “Ruby Red” grapefruit using 45µs and stored at 10oC and 65% RH............................................................................................................................ 47
3-4 Decay of non laser labeled and laser labeled “Ruby Red” grapefruit using four different exposure time .......................................................................................................... 48
4-1 Peel stability of laser labeled tomato fruit stored at 12.5oC and 65% RH .......................... 61
4-2 Peel stability of laser labeled tomato fruit stored at 12.5oC and 95% RH .......................... 61
4-3 Peel stability of laser labeled pepper fruit stored at 7.5oC and 65% RH ............................ 63
4-4 Peel stability of laser labeled pepper fruit stored at 7.5oC and 95% RH ............................ 63
4-5 Decay of non laser labeled and laser labeled tomato fruit using four different exposure time .......................................................................................................................................... 65
4-6 Decay of non laser labeled and laser labeled pepper fruit using four different exposure time .......................................................................................................................................... 66

8
LIST OF FIGURES
Figure page 1-1 Laser labeling machine .......................................................................................................... 22
1-2 Laser Labels. A) Laser labeled pepper. B) Etched pear. ..................................................... 22
2-1 Shrinkage rating scale ranges from 0 (no shrinkage) to 5 (total label collapse) ................ 28
2-2 A group photograph of labels etched using increasing exposure times .............................. 30
2-3 Surface area covered by 100 dots etched with exposure times ranging from 30 µs to 140 µs. ..................................................................................................................................... 30
2-4 Water loss associated with labels etched using four different exposure times................... 31
2-5 Percentage decrease in evaporation rate resulting from wax application on labeled areas......................................................................................................................................... 31
2-6 Evaporation from unwaxed laser label, waxed laser label (using Carnuba 505), and control (no label) during 7 d storage ..................................................................................... 32
2-7 Peel stability of etched fruit (45 µs) during storage at 10 oC and 65% RH ........................ 33
2-8 Peel stability of laser labeled fruit (45 µs) during storage at 10 oC and 95% RH .............. 33
2-9 Decay of labeled fruit in storage. Fruit were labeled with four exposure times and stored at 10 ºC and 95% RH. ................................................................................................. 35
2-10 Fungal spores were spread on agar plates and laser labeled at 45 µs (A) and laser labeling of 72 h grown hyphae (B) ....................................................................................... 35
2-11 Combined data from Figure 2-3 and 2-4 showing water loss and label exposure time and the oval area includes all readable labels ....................................................................... 36
3-1 Shrinkage rating scale for laser-labeled ‘Ruby Red’ grapefruit peel. Scale ranges from 0 (no shrinkage) to 5 (total label collapse) ........................................................................... 41
3-2 A group photograph of labels etched on ‘Ruby Red’ grapefruit using different exposure times/energy levels. ................................................................................................ 42
3-3 Relationship between exposure time (30 to 140 µs) and laser-labeled surface area (covered by 100 dots) of ‘Ruby Red’ grapefruit .................................................................. 43
3-4 Water loss from laser-labeled ‘Ruby Red’ grapefruit peel using four different exposure times ........................................................................................................................................ 44

9
3-5 Percentage decrease in the rate of water loss from laser-labeled ‘Ruby Red’ grapefruit peel by different commercial waxes compared to unwaxed label. ..................................... 44
3-6 Water loss from unwaxed label, waxed (carnuba) label and control ‘Ruby Red’ grapefruit (no label) during 7 d storage at 10 °C (50.0 °F). ................................................ 45
3-7 Peel shrinkage of etched ‘Ruby Red’ grapefruit during storage at 10 °C (50.0 °F) and 95% relative humidity. ........................................................................................................... 46
3-8 Peel shrinkage of etched ‘Ruby Red’ grapefruit during storage at 10 °C (50.0 °F) and 65% relative humidity. ........................................................................................................... 47
3-9 Total decay of labeled ‘Ruby Red’ grapefruit in storage. Fruit were labeled using 4 exposure times (35 µs, 45 µs , 85 µs and 120 µs) at ambient temperature and stored at 10 °C (50.0 °F) and 95% relative humidity. ......................................................................... 48
3-10 Fungal hyphae grown for 72 h on potato dextrose agar. A) after a lawn of spores was laser labeled at 45 µs, B) laser labeling of 72 h grown hyphae........................................... 49
4-1 Shrinkage rating scale for laser-labeled tomato peel. Scale ranges from 0 (no shrinkage) to 5 (total label collapse). .................................................................................... 56
4-2 Shrinkage rating scale for laser-labeled pepper peel. Scale ranges from 0 (no shrinkage) to 5 (total label collapse). .................................................................................... 56
4-3 A group photograph of laser labels on tomato fruit using different exposure times/energy levels. ................................................................................................................ 58
4-4 A group photograph of labels etched on pepper fruit using different exposure times/energy levels. ................................................................................................................ 58
4-5 Relationship between exposure time (30 to 120 µs) and laser-labeled surface area (covered by 100 dots) of tomato fruit. .................................................................................. 59
4-6 Relationship between exposure time (30 to 120 µs) and laser-labeled surface area (covered by 100 dots) of pepper fruit. .................................................................................. 59
4-7 Water loss from laser-labeled tomato fruit peel using four different exposure times. ..... 60
4-8 Water loss from laser-labeled pepper fruit peel using four different exposure times ........ 60
4-9 Peel shrinkage of laser labeled tomato fruit during storage at 12.5°C (55 °F) and 95% relative humidity. ................................................................................................................... 62
4-10 Peel shrinkage of laser labeled tomato fruit during storage at 12.5 °C (55 °F) and 65% relative humidity. ................................................................................................................... 62
4-11 Peel shrinkage of laser labeled pepper fruit during storage at 7°C (45 °F) and 95% relative humidity. ................................................................................................................... 63

10
4-12 Peel shrinkage of laser labeled pepper fruit during storage at 7°C (45 °F) and 65% relative humidity .................................................................................................................... 64
4-13 Unwaxed and waxed laser labeled tomato fruit during storage. ......................................... 64
4-14 Total decay of labeled tomato fruit in storage. ..................................................................... 66
4-15 Total decay of labeled pepper fruit in storage. ..................................................................... 66

11
LIST OF ABBREVIATIONS
CO2 Carbon Dioxide
P.L.U. Price Look Up
RH Relative Humidity

12
Abstract of Thesis Presented to the Graduate School of the University of Florida in Partial Fulfillment of the
Requirements for the Degree of Master of Science
EFFECTS OF LASER LABELING ON THE STORAGE QUALITY OF SELECTED FRESH FRUITS AND VEGETABLES
By
Preeti Sood
August 2009 Chair: Edgardo Etxeberria Major: Horticultural Sciences
Although in common practice since the 1990’s, fruit labeling gained greater significance
after 9/11 due to its potential relevance to food safety and bioterrorism. Labeling of fruits and
vegetables is important for internal accounting, traceability and safety concerns. Most fruits and
vegetables sold in the US are marked with non-permanent stickers or adhesive tags. These
stickers usually contain names, identification numbers (three, four or five digit codes), country of
origin, brands, and logos. They provide required information and help distinguishing among
produce with similar appearance but a different quality value, resulting in a more efficient
checkout process. Despite the many advantages, sticker labeling technology has several
drawbacks. These adhesive labels are expensive to purchase and apply, and application
equipment requires clean up after the season. In addition, produce are often left with glue residue
on their surfaces after sticker removal, resulting in blemished fruits. An emerging technology
called “Laser Labeling” could be considered a desirable alternative to the existing labeling
system. Not only is each piece of produce permanently coded, but the specific information can
be stored electronically for any period of time. The technique involves a low energy carbon
dioxide laser beam which vaporizes the epidermal cells and reveals the underlying cells,
preferably with a contrasting color. Produce epidermis is marked with alphanumerical dot matrix
13
characters formed by pinhole depressions (Drouilllard and Rowland, 1997). However, these
depressions can promote water loss and increase the number of potential entry sites for decay-
promoting organisms. The present study addresses the most vital of these postharvest concerns.
The experiments were conducted to measure water loss, peel appearance, and potential decay in
laser labeled citrus fruit namely “Honey tangerine” (Citrus reticulata), “Ruby Red” grapefruit
(Citrus paradisi), tomato (Lycopersicon esculentum) and pepper (Capsicum annum) during
storage. Laser labeled fruit stored at their respective optimum temperature and two relative
humidities (i.e., 95% and 65% RH) for 3 to 5 weeks depending on the commodity, showed no
increase in decay compared to non-etched control fruit, suggesting that laser labeling does not
facilitate decay. This was confirmed by experiments where the spores of common postharvest
pathogen (such as Penicillium digitatum in citrus and Geotrichum candidum in tomato and
pepper) were coated on fruit surfaces before and after laser labeling. In either case, no decay
was observed. Further, in agar plates which contain a lawn of P. digitatum spores, the laser
labeling reduced germination of spores in contact areas. Water loss from etched areas and label
appearance were determined during storage. Water loss from waxed and etched citrus peel
declined to control levels after 24 hours in storage. Label appearance deteriorated slowly in
citrus fruit as compared to tomato and pepper and was proportional to laser energy levels and
ambient relative humidity. Waxing the laser labeled surface in citrus fruit reduced water loss by
35% to 94%, depending on the wax formulation used. This study concludes that laser labeling
provides the produce industry a feasible alternative to adhesive sticker labeling without
enhancing decay susceptibility.

14
CHAPTER 1 INTRODUCTION AND LITERATURE REVIEW
Fresh fruits and vegetables have been a part of the human diet in all cultures (Willis, et al.,
1998). The nutritional importance of fresh fruits and vegetables was first recognized in England
during the early part of the17th century for the ability of citrus to cure the ‘scurvy’ disease among
the naval personnel. Their complete nutritional benefits were not known until recently however.
Most fruits and vegetables are high in water content (80-90% of fresh weight) and low in protein
and fat content. Carbohydrates content in fruits and vegetable is low except in certain starchy
vegetables, for example cassava, potato, sweet potato, sweet corn and fruits such as dates. Lipids
comprise less than 1% of most fruits and vegetables and are associated with cell membranes and
the protective cuticular surface layer. Fruits and vegetables are also rich sources of certain
vitamins, especially beta-carotene (precursor of vitamin A) and vitamin C (ascorbic acid).
Approximately 95% of the human dietary vitamin C comes from fruits and vegetables. Fruits,
such as citrus, strawberry and kiwifruit, are outstanding sources of this vitamin. All vegetables
contain small amounts of the B-complex vitamins, but their nutritive value is attributed mainly to
beta carotene, vitamin C and folic acid. The most abundant mineral found in fruits and
vegetables is potassium followed by calcium. Minerals like magnesium, iron and phosphorus are
also present at substantial levels. Their high water and fiber content helps in digestion and
utilization of foods. Fruits and vegetables are good sources of naturally occurring antioxidants
that may help protect against free radicals and oxidative damage, thereby lowering cancer and
cardiovascular disease risk (Cao et al., 1996; Cohen et al., 2000). These antioxidants include
vitamin C, glucosinolates, flavonoids , carotenoids and polyphenolics (Larson, 1988). For
example limonin and nomilin in citrus fruits are believed to help inhibit the development of
certain forms of cancer (Lam and Hasegawa, 1989; Miller et al., 1989). Many studies have

15
stated that a frequent intake of cruciferous vegetables, such as broccoli, cauliflower, and
cabbage, could also be helpful in protecting against cancer (De Long et al., 1986, Zhang et al.,
1995). Avocado is a very rich source of monounsaturated fats (50-75%) and recent studies
reported the benefits of avocado with respect to heart diseases. The United States Department of
Agriculture food pyramid or “5 A Day- For Better Health” dietary program suggests 2 servings
of fruits and 3 servings of vegetables every day per individual (Center for Nutrition Policy and
Promotion, 2000).
World fruits and vegetable production is estimated around 388 MT and 486 MT
respectively, with China being the world’s largest producer of both fruits and vegetables
followed by India. According to FAO, China contributes nearly 50% of the world’s vegetable
production and 16% of the fruit production. India accounts for about 8% of the world’s fruit
production and 15% of the total vegetable production. US is a dominant player in the
international trade of fruits and vegetables and accounts for about 25% of world trade. As far as
production within the US, California leads by producing more than 50% of the all fruits and
vegetables. Florida is the second largest producer with 8% and 14% of the US vegetable and fruit
production respectively (NASS, 2000). In general, production of fruits and vegetable crops
worldwide has increased over the past few years.
1.1 Fruit Anatomy and Classification
Botanically, ‘fruit’ is defined as a ripened or mature ovary including seeds and other
associated plant plants such as the receptacle (e.g.,strawberry), bracts (e.g., apple) and peduncle
(e.g., pineapple). Fruits can be classified various ways. Based on the growing conditions, fruits
are divided into temperate, tropical and sub-tropical types. Temperate fruits are grown in places
with distinctly cold winter. These are suited to higher elevations and can withstand frost such as
apple, plum, peach and pear. Tropical fruits require moist warm climate and can bear dry

16
weather (e.g., banana, mango, guava, papaya). Fruits such as citrus, grapes, loquat etc., are sub-
tropical in nature. These fruits are grown in between temperate and tropical climates, and can
withstand low temperature and frost but only for short period.
Based on their respiration patterns and ethylene production during maturation and
ripening, fruits and vegetables are categorized as either climacteric or non climacteric (Biale, and
Young, 1981). The term ‘climacteric’ was first used in apples for the characteristic rise in the
respiration rate that accompanies maturation and ripening (Kidd and West, 1924). The ripening
process of climacteric fruits (e.g., apple, banana, mango) is accompanied by a peak in respiration
and a simultaneous burst of ethylene production (Giovannoni, 2004). When exposed to
exogenous ethylene, climacteric fruits undergo autocatalytic ethylene production. On the
contrary, non climacteric fruits (e.g., citrus, strawberry) do not show increased ethylene
production and respiration during ripening (Knee et al., 1977). Vegetables in general are divided
into three main groups: 1) seeds and pods; 2) flowers, buds, stems and leaves; and 3) bulbs, roots
and tubers. Some immature fruit (cucumber, zucchini, beans) and ripe fruit types (tomato,
avocado, capsicum, egg plant) are also consumed as vegetables.
1.2 Postharvest Concerns
Fresh fruits and vegetables are living tissues and therefore highly perishable in nature.
They continue their biological processes after harvest and subject to changes (Kader, 2002).
Their quality rapidly deteriorates after harvest. During handling and transportation, these fresh
commodities are subjected to impact, compression, vibration, bruising, low/ high temperature,
humidity conditions and pathological attacks. These may lead to loss in the quantity and quality
of these fresh commodities between harvest and consumption. The magnitude of these
postharvest losses is higher in developing countries (20-50%) than in developed countries (5-
25%) depending on the commodity, cultivar, infrastructure and handling practices. These losses

17
can be reduced by implementing proper handling and storage techniques. Proper postharvest
management facilitates the continuous and timely supply of fresh fruits and vegetables.
The deterioration of fresh commodities can be the result of physiological breakdown due to
natural ripening, water loss, temperature injury, or invasion by pathogens (Thompson et al.,
1998). These harvested fresh commodities exhibit enhanced respiration and ethylene production.
Respiration is a process by which organic compounds are broken down into simple sugars and
further with a release of heat ATP and energy resulting in reduced nutritional quality as well.
Within the range of 4o to 35oC every 10 oC rise in temperature causes 2-3 fold increase in the
respiration rate thereby shortening the shelf life of the commodity (Pittenger, 2002). Fresh
commodities are stored at low temperature to slow down respiration and senescence which in
turn lengthen the postharvest shelf life (Kader, 2002). Since fresh horticultural commodities vary
in composition, morphology (roots, stems, leaves, flowers, fruits) and physiology, they have
different postharvest requirements and recommendations for maintaining maximum postharvest
shelf life. Storage life can vary from < 2 weeks to > 16 weeks depending on the commodity. For
example, green onions can be stored for less than 2 weeks as compared to dried onions which
can be held at 0 oC for 8-10 weeks. Citrus fruits in general can be stored for moderate periods of
time. Grapefruit can be stored for 6-8 weeks at 12-15 oC and 90-95% RH. Fully ripe tomatoes
can be stored optimally for 3-5 days at 7-10 oC and 85-95% RH, in contrast to mature green
which can be kept for 14 days at 12.5 -15 o C. Storage of peppers at 7.5 oC is best for
maintaining maximum shelf life of 3-5 weeks.
Fresh horticultural crops are a “package of water”. Water loss equates to loss in saleable
weight, textural quality (softening, flaccidity, loss of crispiness, juiciness) and nutritional quality.
Weight loss of only 5 % can make the fresh produce appear wilted or shriveled and may render

18
them unmarketable. However, high (RH) (90-95%) in conjunction with low temperature and
low surrounding air velocity helps in reducing water loss. In general, fruits store best at 85 to
95% RH and vegetables at 90 to 98% RH in order to retain freshness. Besides holding the
produce at high humidity, transpiration or water loss can be reduced by applying waxes and other
surface coatings or wrapping with plastic films. Fruits that are normally waxed include citrus,
apples, pear, avocado, cucumber, tomato and pepper (Baldwin, 1994).
Packaging is one of the most important postharvest treatments required for marketing of
fresh produce. It also plays a crucial role in preventing deterioration losses and improving shelf
life of produce. More than 1,500 types of packages are used for produce in the US. Packaging
material includes corrugated fiber board boxes, plastic trays, mesh bags, woven sacks, stretch
films, shrink wrapping etc. Commodities such as potatoes, onions, citrus, sweet corn are packed
in mesh bags. Besides making attractive displays for supermarket, these bags provide adequate
ventilation for produce. Plastic bags (polyethylene films/wraps) are commonplace in packing
fresh fruits and vegetables such as wrapping of an individual stalk of cauliflower, cabbage, and
lettuce. High value produce items such as berries (strawberry, blueberry, raspberry), small fruits
and datil peppers are most often packed in clamshells. Besides being inexpensive, clamshells
provide great protection to the produce and make a very pleasing consumer package.
1.3 Traceback
The “Center for Disease Control and Prevention” (CDC) estimated that food borne
diseases causes approximately 76 million cases illnesses, 350,000 hospitalizations and 5,000
deaths annually in US. Produce is considered a leading vehicle of foodborne illnesses and was
responsible for more than half of illnesses associated with foodborne outbreaks between 1998
and 2004. From 1995-2006, 22 produce outbreaks have been reported in the US. Hepatitis cases
by consumption of green onions from Mexico in 2003 and Salmonella outbreak of 2004 in Roma
19
tomatoes led to deaths of thousands. Furthermore, in 2006, 205 cases of E. coli O157:H7
illnesses transmitted by bagged spinach were reported in 26 states. The same year, Salmonella
outbreaks linked to tomatoes accounted for the death of thousands. Salmonella is the most
common bacterial agent causing food borne illness. Approximately, 1.4 million illnesses and 600
deaths are caused by Salmonella each year in US (Mead, et al., 1999). In 2005, US Center for
Disease Control and Prevention’s Emerging Infectious Program under the Food-borne Diseases
Active Surveillance Network reported 6471 confirmed cases of Salmonella (Center for Disease
Control and Prevention, 2006). However, difficulty in tracing the source of tainted food items
stifled the investigation of these past outbreaks. Due to the difficulties in tracing back produce,
more emphasis has been lately placed on traceability and other food safety concerns of the fresh
produce industry.
Traceability is the ability to trace food items back to their source (growers, packers) and
through all commercial channels. It is considered as “good agricultural practices” (GAP) and
intended to minimize the liability and preventing occurrence of food security problems. (Center
for Food Safety and Applied Nutrition,1998). Owing to the current food safety concerns, track
and trace systems for the product in international trade, particularly in sea and air freight are
becoming increasingly important. There is a need for high quality identification (labeling) and
information systems.
1.4 Produce Labeling
In 2002, US congress passed the Public Health Security and Bioterrorism Preparedness and
Response Act, also known as “Bioterrorism Act”. The purpose of the Act was to protect the
country’s food supply against the intentional contamination. Section 305 of this Act specifies the
requirement for labeling of products including produce. Since then price look up (P.L.U.)
labeling of produce has become commonplace. Price –look –up (P.L.U.) labeling of the fresh

20
fruits and vegetables has gained marked attention in the United States over the last decade. PLU
codes are normally used on items that are sold in loose state or bunch (for example, an individual
orange or bunch of greens). The PLU index coding contains four-digit identification number
developed by the Produce Electronic Board (PEIB) to identify the variety of fruit and vegetables
(PEIB, 1995). This board was established to upgrade the electronic data collection and
communication of fresh produce sales (Etxeberria et. al., 2006).
So far, the most commonly used labeling system consists of adhesive tags/stickers applied
to individual fruit and vegetable on the packing line (Varon and Paddock, 1978). The first fruit
label is dated back in 1929 and was created by a British company Elders & Fyffes Ltd.
(Anonymous). Produce labeling started with the labeling of bananas. Labeling of oranges,
grapefruit, tomatoes, pepper and others with individual stickers is accomplished by passing the
individual fruit beneath a cassette of gummed labels applied with gentle pressure. The PLU
stickers usually contain names, identification number (three, four or five digit code), country of
origin, brands and logos. These are helpful for grocery clerks, making it easy to distinguish
among produces with similar appearance, but a different quality value. As a consequence,
sticker labeling also saves time at the checkout counter.
Despite the many advantages, sticker labeling technology has several drawbacks.
Besides being expensive, these stickers require clean up after the season, as they gummed up
along the packingline. Fruits are often left with glue residue on its surface after sticker removal
resulting in blemished fruits. In addition, these stickers are not permanent and can be detached at
any postharvest handling stage. It is also not possible to make P.L.U. number changes in a
timely manner.

21
1.5 Laser Labeling
Laser labeling is a technology where low-energy CO2 lasers beam (10,600 nm)
(Drouilllard and Rowland, 1997) is used to mark a produce. The general etching process is
similar to the one used in electronics manufacturing and medical treatments and explained by
Hecht (1994). The laser labeling is a sterile, non-contact, high speed, efficient method which
provides a sharply defined permanent mark. Laser beam etches the outermost pigment layer of
the produce skin to reveal a contrasting sub-layer. Etched markings are formed in dot matrix
pattern letters and numbers, each dot created by pinhole depressions (Etxeberria et al., 2006).
The laser labeling apparatus has an articulating arm with an optical head attached to it (Figure 1-
1) and can be positioned at a variety of positions related to the piece of produce. The laser head
emits a high intensity and controlled light beam which is directed along a predetermined path to
etch the epidermis of the produce. The mark is produced by “vaporizing” the wax portion of the
skin and desiccating the underlying cell layers under where the high intensity beam contacts the
skin. The contact time of the beam is yet limited to reduce or prevent transfer of heat energy or
thermal degradation or breakdown of the underlying tissues. The whole system is controlled by a
programmable electronic interface, which is a high speed programmable logic controller (PLC).
The graphic interface create files to store specific equipment settings required for different
varieties of fruit, different PLU codes, and other related information. Such settings of the
equipment allow the system to sense differences in surface texture and color and make necessary
adjustments.
In order to operate the laser labeling machine, the user enters the desired code and system
parameters using a keypad. The PLC uses this input and the one from the attached external
sensors to make the necessary calculations and adjustments in order to emit laser beam. The
system can etch PLUs, trace codes, and date and time stamps in 14 different languages; it can

22
also convert any kind of image into a matrix that can be printed. The processing speed of the
laser labeling machine is up to 17 fruits per second. It can be used in various fruits and
vegetables such as cucumber, pepper, potato, avocado, tomato, apple, citrus, pear, watermelons
and even onions (whose epidermis is only 18 µm deep) (Figure 1-2A and Figure 1-2B). For
fruits such as citrus that do not have good contrast, FDA-approved food coloring is used for
contrast enhancement.
Figure 1-1. Laser labeling machine
A B
Figure 1-2. Laser Labels. A) Laser labeled pepper. B) Etched pear.
Other advantages of this laser technique are that the label are permanent, do not require
additional adhesives, and labeling information can be stored electronically for any period of
Laser output User interface
Articulating arm

23
time. In the long run, laser system offers production cost cutting as well. The machine requires
little or no supervision, thereby reducing operating cost to a greater extent. Furthermore, these
labels do not create any clutter, leave no glue residues on the produce surface, and above all,
offers the potential to track and trace the origin of the produce. The system is more flexible as
PLU information can be changed number of times before labeling the fruit. Furthermore, the
laser labels are environment friendly.
The barriers to the acceptance of this technology are the presumptions that it is not safe and
may leads to early produce decay, as pinhole depressions make the surface more susceptible to
water loss, potential pathogen attack and other postharvest losses. Water loss from harvested
fruit occurs continuously and may be responsible for loss of quality and marketability of fruit.
The natural cuticular wax layer of citrus fruit protects against water loss. Laser labeling pinholes
rarely penetrate beyond the third layer of epidermal and/or underlying cells. Underlying tissues
deposit additional wax, lignin and phenolic suggesting a self healing process as noticed
previously in avocado and tomato (Exteberria et.al, 2006). Brown (1973) also reported lignin
deposition in the injured citrus peel. Significant deposition of lignin was noticed around the
wounds inoculated with Geotrichum candidum in lemon peel (Baudoin and Eckert, 1985). Some
changes were observed at the wound and in surrounding peel tissues after 1-4 days of wounding
in satsuma mandarins (Kinay et al., 2005). The lignin-like material (L-LM) is induced by
wounding of fruit in cucumber (Walter et al., 1990) and impedes the hyphal penetration of
Penicillium in lemons (Stange and Eckert, 1994).
The effectiveness of natural cuticular barrier diminishes by the soaking, washing and
brushing of the fruit during packinghouse operations. Therefore, commercial wax coating is
applied to the fruits to compensate the loss of natural protection. In addition, waxes applied for

24
other reasons such as reduction of water loss, improved appearance and some level of protection
against decay. The composition and properties of a typical self-polishing, fungicide-containing
water wax was described by Newhall and Grierson (1955). In general the rate of water loss from
waxed fruit is comparable to unwashed fruit. Commercial use of waxes is extensive for fruits,
especially apples and citrus, and some vegetables such as tomatoes, melons and cucumbers.
Limited use is observed in asparagus (Asparagus officinalis) peppers, carrots, radish, potatoes,
squash and turnip (Baldwin, 1994).
Produce may be exposed to pathogens both prior to harvest in the field and also after
harvest while handling, storage and transit. Most pathogens required wounds or other
unprotected areas to enter the fruit tissue. Laser labeling disrupts the natural protective barrier
seemingly creating open wounds. Studies on anatomical, morphological and physical aspects of
the laser labeling cavities states that the cells underlining etch depression increase phenolic and
lignin deposits in their walls (Etxeberria et al., 2006) , yet the degree of protection has not been
investigated. The microbial community of bacteria and yeasts on the surfaces of fruit and
vegetables can influence the development of postharvest rots of fruit and vegetables (Blakeman,
1985; Spurr, 1994). Although it was shown previously that the alphanumeric codes produced by
the laser beams do not support the infiltration and survival of spoilage organism like Salmonella
spp. on tomato surface (Yuk et. al., 2007) little additional information is available regarding the
decay of laser labeled fruits. The present study addresses potential complications brought about
by microflora population and various other postharvest losses on the laser labeled fruit in
comparison to non laser labeled.

25
CHAPTER 2 EFFECTS OF LASER LABELING ON THE QUALITY OF TANGERINES DURING
STORAGE
2.1 Introduction
Citrus is the major fruit crop of Florida. The state contributes nearly 58% of all U.S.
tangerine production, 78% of which goes to the fresh market. With the possibility of bioterrorism
and other economic concerns, labeling of fresh market produce has become increasingly relevant
in the last few years. In addition to making ‘check-out’ easier, labeling helps with the tracking
and traceability of the produce. Laser labeling is emerging as an alternative to traditional
stickers/adhesive labels. With this method, a low energy CO2 beam creates pinhole depressions
into the product surface that forms the alphanumeric label information (Drouilliard and Rowland,
1997). However, these pinhole depressions disrupt the protective barrier of the produce and can
potentially become entry sites for decay organisms and sites for enhanced water loss, despite the
significant amounts of wax and lignin deposited by surrounding and underlying cells (Etxeberria
et al., 2006). Little information is available on the impact of this new technology on the overall
quality of the labeled produce, especially its effect on water loss and decay during storage. The
present study investigates the effects of laser labeling on the quality of “Honey tangerine”
(Citrus reticulata Blanco) during storage.
2.2 Materials and Methods
2.2.1 Plant Material
“Honey tangerine” (Citrus reticulata Blanco) fruit was purchased in October 2008 from
Haines City CGA, Haines City, Fla. after commercial washing and waxing. Fruit was labeled
using a low energy CO2 laser labeling machine (Model XY mark 10, Sunkist Growers Inc.,
Fontana, Calif.) at the Citrus Research and Education center in Lake Alfred as described earlier
(Etxeberria et al., 2006).

26
2.2.2 Exposure Time Selection
A label code “M1” was etched on fruit surfaces using 18 different exposure times
corresponding to 30 µs to 140 µs label duration (Etxeberria et al., 2006). The energy level used
was the recommended 0.000752 W/dot. To enhance resolution, labels were dyed with fruit-
based black color. Five replicates per exposure time were used. Images of the dyed label were
taken using a Canon Powershot S31S digital camera mounted on a Wild Heerbrugg 165083
stereoscope. Surface area altered by the label was measured using an Image Processing
Software. Total area was calculated based on number of pixels within the area covered by the
laser depressions with 1 pixel corresponding to 50 µm2.
2.2.3 Water Loss
Water loss from the fruit surface was measured using a modified leaf porometer (Decagon
Devices, Pullman, Wash.). To estimate water loss as a function of exposure time, an etched
rectangle of 7 x 8 dots matrix pattern was used for each of four exposure times, namely low
(35 µs), commercially recommended (45 µs), medium (85 µs ), and high (120 µs). The modified
leaf porometer was placed on the top of the treated area immediately after laser labeling until a
stable reading was obtained.
Water vapor diffusion from fruit and vegetables was calculated using Eq. 2-1 based on
Fick’s law where “water vapor flux density” or “evaporation rate” is the product of vapor
conductance (gv) and the difference between vapor concentration at the evaporating surface
(Cvs) and water vapor concentration in atmosphere (Cva). Values are expressed as mmol m-2
sec-1. The modified leaf porometer (Decagon Devices, Pullman, Wash.) estimates the value for
water vapor conductance (gv) which can be computed in the equation below to obtain
“evaporation rate.”
F = gv (Cvs – Cva) (2-1)
27
Vapor concentration was calculated using Eq. 2-2, where ea is the vapor pressure (kPa)
which is a function of temperature, and pa is the atmospheric pressure (kPa) (information
courtesy of Dr. Doug Cobos, Decagon Devices, Inc., Pullman, Wash.).
Cv = ea / pa (2-2)
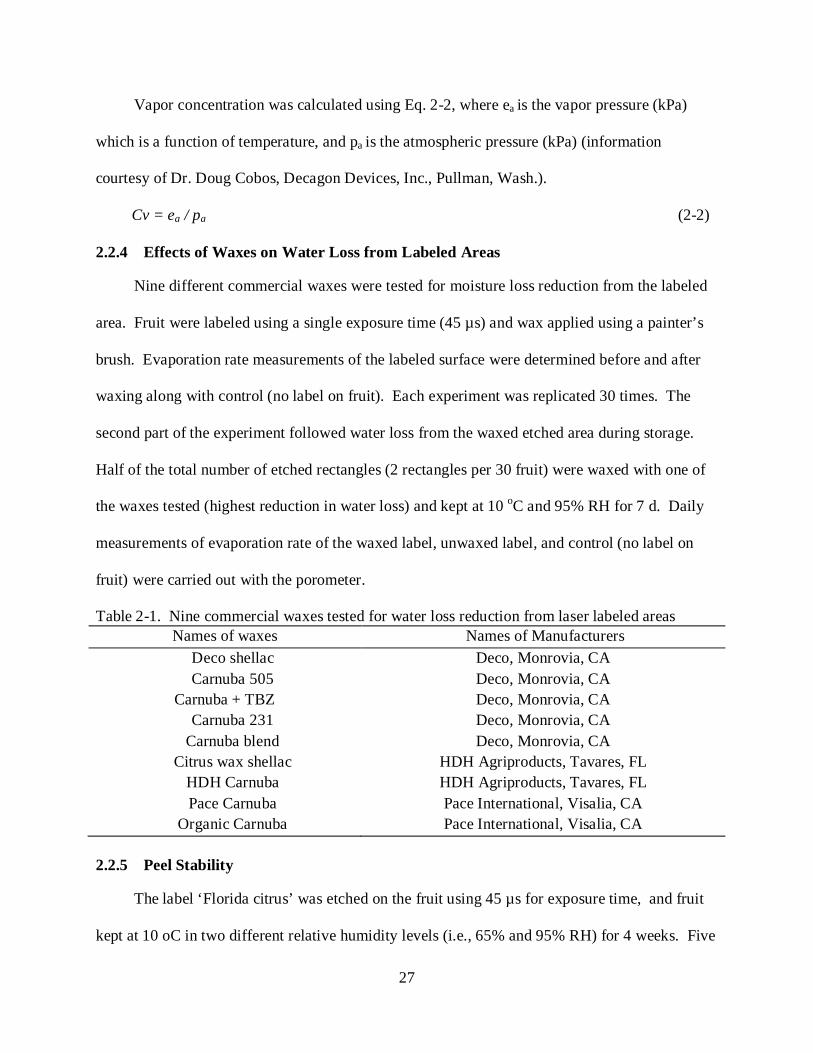
2.2.4 Effects of Waxes on Water Loss from Labeled Areas
Nine different commercial waxes were tested for moisture loss reduction from the labeled
area. Fruit were labeled using a single exposure time (45 µs) and wax applied using a painter’s
brush. Evaporation rate measurements of the labeled surface were determined before and after
waxing along with control (no label on fruit). Each experiment was replicated 30 times. The
second part of the experiment followed water loss from the waxed etched area during storage.
Half of the total number of etched rectangles (2 rectangles per 30 fruit) were waxed with one of
the waxes tested (highest reduction in water loss) and kept at 10 oC and 95% RH for 7 d. Daily
measurements of evaporation rate of the waxed label, unwaxed label, and control (no label on
fruit) were carried out with the porometer.
Table 2-1. Nine commercial waxes tested for water loss reduction from laser labeled areas Names of waxes Names of Manufacturers Deco shellac Deco, Monrovia, CA Carnuba 505 Deco, Monrovia, CA Carnuba + TBZ Deco, Monrovia, CA Carnuba 231 Deco, Monrovia, CA
Carnuba blend Deco, Monrovia, CA Citrus wax shellac HDH Agriproducts, Tavares, FL
HDH Carnuba HDH Agriproducts, Tavares, FL Pace Carnuba Pace International, Visalia, CA
Organic Carnuba Pace International, Visalia, CA
2.2.5 Peel Stability
The label ‘Florida citrus’ was etched on the fruit using 45 µs for exposure time, and fruit
kept at 10 oC in two different relative humidity levels (i.e., 65% and 95% RH) for 4 weeks. Five

28
replicates (1 replicate = 1 box = 60 fruit) per exposure time and control (non-labeled fruit) were
used. Weekly examination of the label appearance and surrounding area was done. Peel
stability was determined on the basis of a visual rating scale according to the shrinkage of the
skin around label as follows: 0 (no shrinkage), 1 (very low), 2 (low), 3 (medium), 4 (high), and
5 (very high) (Figure 2-1). For better visualization, we show the scale using grapefruit.
Figure 2-1. Shrinkage rating scale ranges from 0 (no shrinkage) to 5 (total label collapse)
2.2.6 Decay Study
Fruit were labeled using the commercially suggested exposure time (45 µs) and stored for
5 weeks at 10 oC and 95% RH. Five replicates of labeled and control (non-labeled fruit) (1
replicate = 1 box = 60 fruit) were used. Fruit were examined weekly for decay.
2.2.7 Inoculation Study
Experimental areas on the fruit were subjected to four treatments. The four treatments
were: 1) inoculation of fruit prior to labeling, 2) inoculation after labeling, 3) inoculation on
waxed label, and 4) waxing of inoculated label. Fruit were inoculated with a spore suspension of
Penicillium digitatum. Link (105) was used as inoculum. Inoculum was prepared by growing P.
digitatum Link on potato dextrose agar (BD/Difco, Sparks, MD) plates for 7 d. One hundred
microliters of sterile 0.1% Tween 20 was placed on the plate surface and the spores were
liberated from the colony and placed in sterile phosphate buffer (0.1%; 7.2 pH). Spore

29
concentration was determined by counting cells with a hemocytometer (Hausser Scientific,
Horsham, PA). Inoculum was adjusted to 105 cells /mL. Inoculation was carried out by
spreading a thin layer of spore suspension onto the fruit peel before and after labeling using a
sterilized small brush. Inoculation was carried out by applying a thin layer of spore suspension
over the experimental areas using a painters brush. Inoculated fruit was stored at 10 oC and 95%
RH for 3 weeks and examined for decay weekly. Labeling was done using one exposure time
(45 µs). Thirty replicates consisting of one fruit each were used for all four treatments.
In a separate experiment, Penicillium spore suspension was spread on potato dextrose agar
plates (BD/Difco, Sparks, Md.). The plates were laser labeled and observed under the
microscope immediately and 72 h after labeling. Each experiment was repeated five times.
2.3 Results and Discussion
The visual effect of increasing laser labeling exposure time on tangerine peel is shown in
Figure 2-2. At the lowest possible exposure time of 30 µs, the label was faint and hardly visible,
whereas at the highest exposure time of 120 µs, the etch markings merged into solid lines.
Calculations of laser etched surface area were done using Image processing software. In general,
the area covered by the etched markings increased with increase in exposure time (Figure 2-3).
The rate of peel surface area disruption declined at higher exposure times as etch markings began
to merge. Etched markings created with 45 µs exposure time were selected as the best among all
energy levels on the basis of visual appearance and area covered. This exposure time (45 µs)
creates less surface disruption while generating readable code. However, from Figure 2-2 and 2-
3, higher exposure times create darker labels without significantly increasing peel disruption.

30
Figure 2-2. A group photograph of labels etched using increasing exposure times
Figure 2-3. Surface area covered by 100 dots etched with exposure times ranging from 30 µs to
140 µs. Each point represents an average of five replicates. Vertical lines represent SE
2.3.1 Water Loss
Moisture content is one of the important factors determining the marketable quality of
produce. Fruit and vegetables start losing moisture immediately after harvest (Ben Yehoshua
and Rodov, 2002). However, laser-generated etched markings are physical pinholes penetrating
through the cuticle and into the epidermis rendering the produce surface more susceptible to
water loss than non etched surfaces. There was a sharp increase in the rate of water loss between
the 35 and 45 µs exposure times (Figure 2-4). The difference in the rate of water loss was less
pronounced at higher exposure times.

31
Figure 2-4. Water loss associated with labels etched using four different exposure times. Each bar represents an average of 20 samples
2.3.2 Effects of Waxes on Water Reduction from Labeled Areas
Natural waxes on the epidermis play a vital role in retaining moisture in fruit and
vegetables (Kader, 2002). The openings created by laser labeling disrupt the natural waxy
coating on the surface of produce. In this experiment, all nine commercial waxes that were
applied helped in reducing water loss by sealing the etched area. However, significant
differences in the capability of these waxes to prevent water loss were observed. Among all
waxes, three reduced water loss by >80%, with Carnauba 505 resulting in the highest protection
(86% reduction in water loss) (Figure 2-5).
Figure 2-5. Percentage decrease in evaporation rate resulting from wax application on labeled areas. Each wax was tested on 30 separate labels
b
aa a
0
2
4
6
8
10
35 45 85 120
Eva
pora
tion
rate
(mm
ol. m
-2se
c-1)
Energy (µs)
LSD 3.08
a a ab ab b ab b b
0102030405060708090
100
% D
ecre
ase
in ev
apor
atio
n ra
te
Waxes
a
32
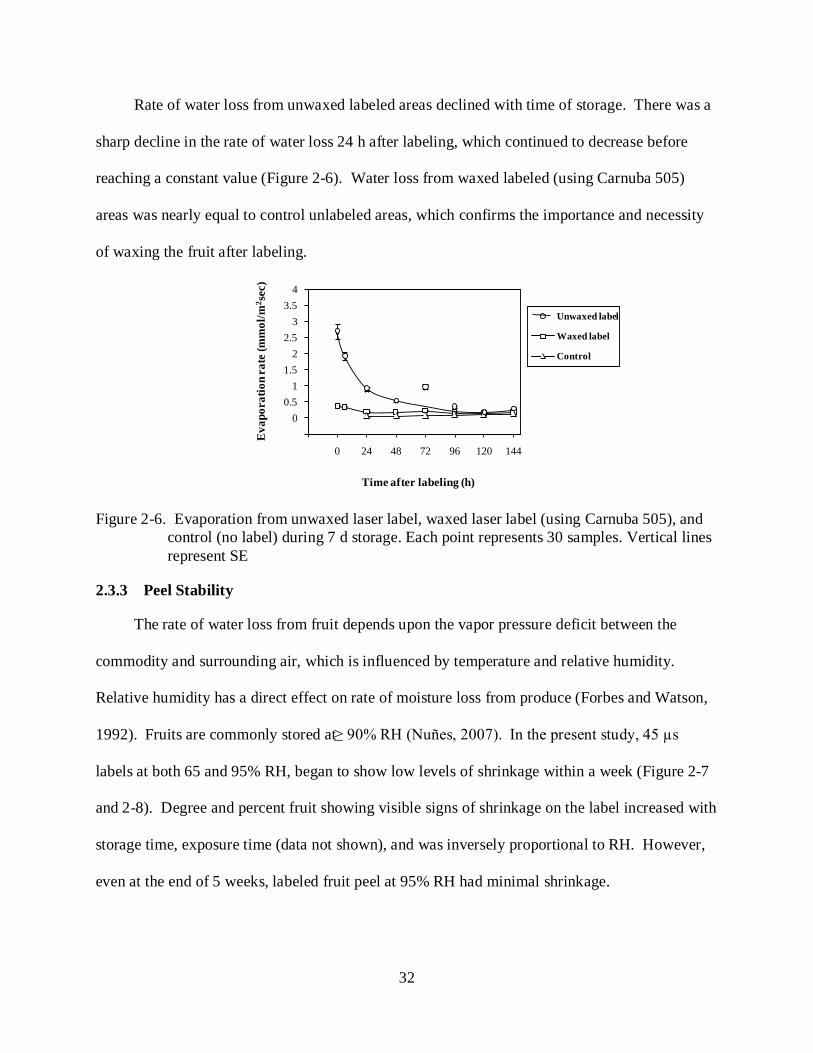
Rate of water loss from unwaxed labeled areas declined with time of storage. There was a
sharp decline in the rate of water loss 24 h after labeling, which continued to decrease before
reaching a constant value (Figure 2-6). Water loss from waxed labeled (using Carnuba 505)
areas was nearly equal to control unlabeled areas, which confirms the importance and necessity
of waxing the fruit after labeling.
Figure 2-6. Evaporation from unwaxed laser label, waxed laser label (using Carnuba 505), and control (no label) during 7 d storage. Each point represents 30 samples. Vertical lines represent SE
2.3.3 Peel Stability
The rate of water loss from fruit depends upon the vapor pressure deficit between the
commodity and surrounding air, which is influenced by temperature and relative humidity.
Relative humidity has a direct effect on rate of moisture loss from produce (Forbes and Watson,
1992). Fruits are commonly stored at ≥ 90% RH (Nuñes, 2007). In the present study, 45 µs
labels at both 65 and 95% RH, began to show low levels of shrinkage within a week (Figure 2-7
and 2-8). Degree and percent fruit showing visible signs of shrinkage on the label increased with
storage time, exposure time (data not shown), and was inversely proportional to RH. However,
even at the end of 5 weeks, labeled fruit peel at 95% RH had minimal shrinkage.
-0.50
0.51
1.52
2.53
3.54
-24 0 24 48 72 96 120 144
Eva
pora
tion
rate
(mm
ol/m
2 sec
)
Time after labeling (h)
Unwaxed label
Waxed label
Control

33
Table 2-2. Peel stability of laser labeled “Honey Tangerine” using 45µs and stored at 10 oC and 65% RH
Percentage of total fruit Time after labeling (weeks) 1 (very low) 2(low) 3(medium) 4(high) 5(very high)
1 5.28 1.66 0.32 0 0 2 6.3 3.66 0.66 0 0 3 2.64 5.28 2.98 0.32 0 4 2.96 4.64 4.62 1.96 0
Figure 2-7. Peel stability of etched fruit (45 µs) during storage at 10 oC and 65% RH
Table 2-3. Peel stability of laser labeled “Honey Tangerine” using 45µs and stored at 10 oC and 95% RH
Percentage of total fruit Time after labeling (weeks) 1 (very low) 2(low) 3(medium) 4(high) 5(very high)
1 1.28 0.32 0 0 0 2 2.6 0.66 0 0 0 3 0.98 1.96 0 0 0 4 1.64 1.96 0.64 0.32 0
Figure 2-8. Peel stability of laser labeled fruit (45 µs) during storage at 10 oC and 95% RH
0
5
10
1 2 3 4
% o
f tot
al fr
uit
Storage after labeling (weeks)
1 (very low)2 (low)3 (medium)4 (high)5 (very high)
0
5
10
1 2 3 4
% o
f tot
al fr
uit
Storage after labeling (weeks)
1(very low)2 (low)3 (medium)4 (high)5 (very high)

34
2.3.4 Decay Study
Citrus fruits are relatively non-perishable and can be stored for long periods. Tangerine, in
general, can be stored at 5-8 oC at 90-95% RH for 2-6 weeks (Arpaia and Kader, 2006). Decay
of citrus fruit in storage is one of the major factors responsible for postharvest losses. Citrus
fruits in storage are vulnerable to various decay organisms such as fungi (e.g., Penicilium spp.)
and bacteria (Kader, 2002). Laser labeled fruit held at 10 ºC and 95% RH conditions showed no
decay around etched area (Figure 2-9). All decay during the storage period was independent
from the labeled areas, the most common being stem end rot. In the present study, decay rate of
the fruits labeled with all the four exposure times were similar to the control (non-labeled fruit)
which confirms that laser labeling does not enhance decay (Figure 2-9). These results are in
accordance with those of Yuk et al. (2007) where laser labeling did not facilitate Salmonella
infiltration and survival in tomato.
Table 2-4. Decay of non laser labeled and laser labeled “Honey Tangerine” using four different exposure time
Total Decay (%) Time after labeling
(weeks) Control 35 µs 45 µs 85 µs 120 µs
1 0 0 0 0 0 2 0 0 0 0 0 3 5 7.5 5.31 5 6.87 4 8.12 10.62 11.25 9.37 10.62 5 14.06 15.62 15.62 15.31 15.62
In a separate experiment, fruit were inoculated before and after laser labeling with a
suspension of P. digitatum (105). In fruit inoculated prior to and after labeling, no symptoms of
decay appeared after 3 weeks in storage. When viewed under the microscope, laser labeling
appeared to prevent spore germination as indicated by the lack of fungal growth at the points of

35
laser impact (Figure 2-10A). The laser also destroyed mycelial strands after germination as
demonstrated in Figure 2-10B.
Figure 2-9. Decay of labeled fruit in storage. Fruit were labeled with four exposure times and stored at 10 ºC and 95% RH. Each point represents an average of five boxes, each containing 50 fruits. There was no decay associated with the laser label
Figure 2-10. Fungal spores were spread on agar plates and laser labeled at 45 µs (A) and laser labeling of 72 h grown hyphae (B)
The results obtained in the present study demonstrate that the epidermal openings created
by the laser labeling do not promote decay in tangerines, as no decay symptoms associated with
the laser etched area were observed. In fact, laser labeling appeared to prevent mold decay.
Analysis of the data allows us to estimate an optimum exposure time that produces readable
labels with minimal water loss (Figure 2-11). For tangerines, a label using 45-65 µs exposure
-5
0
5
10
15
20
1 2 3 4 5
% D
ecay
Time after labeling (weeks)
control35 µs45µs85µs120µs
Generaldecay
Label
associated decay

36
times is optimal. It is important that labels are protected with a wax coat to control water loss, or
significant label collapse may occur.
Figure 2-11. Combined data from Figure 2-3 and 2-4 showing water loss and label exposure time and the oval area includes all readable labels
-0.5
0.5
1.5
2.5
3.5
4.5
5.5
6.5
7.5
0
500
1000
1500
2000
2500
3000
3500
-15 0 15 30 45 60 75 90 105 120 135 150
Evaporation rate (mm
ol/m2sec)
Surf
ace a
rea
(µm
2 )
Energy ( µs )

37
CHAPTER 3 LASER ETCHING: A NOVEL TECHNOLOGY TO LABEL FLORIDA GRAPEFRUIT
3.1 Introduction
Laser labeling has become an alternative means of fruit labeling in many areas of the world
(e.g., New Zealand, Australia, Pacific Rim countries), approved in others (e.g., South Africa,
Mexico, Canada, Argentina, Chile, EU), and currently in final approval stages by the Food and
Drug Administration. The technique consists of etching the required information on the produce
surface using a low energy carbon dioxide laser beam (10,600 nm) (Drouillard and Rowland,
1997). Etched markings are formed in dot matrix style letters and numbers, each dot created by
a pin-hole depression. The advantages of laser labeling have been described previously
(Etxeberria et al., 2006), yet some reservations linger about potential adverse effects during
storage. The pinhole depressions applied after washing and waxing disrupt the natural cuticular
barrier and the protective commercial wax cover, seemingly creating open cavities that would
allow for increased water loss and facilitate entrance of decay organisms.
In previous anatomical studies using tomato (Lycopersicum esculentum) and avocado
(Persea Americana) (Etxeberria et al., 2006), it was demonstrated that cells under the affected
area of a laser pinhole developed a protective layer mostly of lignin and phenolics when stored
for 4 d at 10 °C and 95% relative humidity (RH). This rapid healing response, accompanied by
phenolic deposition, has been observed in Valencia oranges (Citrus sinensis) (Brown et al.,
1979). When ‘Ruby Red’ grapefruit (Citrus paradisi) were damaged by friction with sandpaper,
penetration by Penicillium digitatum was inhibited where cells at the surface produced lignin
before fungal entry (Brown et al., 1979). In a related study, Yuk et al. (2007) challenged tomato
fruit with Salmonella immediately after labeling and observed no migration into the tissue by the
organism, suggesting that some protection is supplied by the labeling process itself.

38
Little information is available on the impact of this new technology on the overall quality
of labeled produce, especially its effect on water loss and decay during prolonged storage. In
Florida, grapefruit represents 43% of the citrus fresh market (Florida Citrus Mutual, 2008), a
condition that requires extended storage especially when transported to international
destinations. The present study determined the effects of laser labeling on water loss and decay
susceptibility during prolonged storage.
3.2 Materials and Methods
3.2.1 Plant Material
“Ruby Red” grapefruit was procured from Haines City CGA (Citrus Growers Association)
Packinghouse, Haines City, FL. The fruit had been washed and waxed with carnuba containing
15 ppm thiabendazole (TBZ) following established commercial practices.
3.2.2 Fruit Labeling
Fruit was labeled as described by Etxeberria et al. (2006) using a low energy carbon
dioxide laser labeling machine (Model XY Mark-10, Sunkist Growers Inc., Fontana, CA)
located at the University of Florida’s Citrus Research and Education Center, Lake Alfred, FL.
Individual fruit were placed against a polyvinyl chloride (PVC) rectangular frame stabilized 10
cm from the laser’s output. The energy level used was the recommended 0.000752 W/dot per
35-µs exposure with a 25% duty cycle range. Differences in applied energy are expressed by
variations in the exposure time to the laser, and varied according to individual experiments as
described below.
3.2.3 Selection of Optimal Exposure Time
A label code containing one letter and one number (“M1”) was etched on fruit surfaces
using different exposure times ranging from 30 µs to 140 µs. To enhance resolution, labels were
rubbed gently with a cotton-tipped swab dipped in a dark, fruit-based colorant. Images of the

39
dyed label were captured using a Canon Powershot S31S digital camera (Cannon, Lake Success,
New York) mounted on a Wild Heerbrugg 165083 stereoscope (Leica Microsystems GmbH,
Wetzlar, Germany). Surface area affected by the label was measured using image processing
software developed by Dr. Arnold Schumann (Citrus Research and Education Center, University
of Florida/IFAS, Lake Alfred, FL). Total area was calculated based on number of pixels within
the area covered by the laser depressions with 1 pixel corresponding to 50 µm2. Five replicates
per energy level were used.
3.2.4 Determination of Water Loss
Water loss from the fruit surface was measured using a modified leaf porometer (Decagon
Devices, Pullman, WA). To estimate water loss as a function of energy level, an etched
rectangular matrix pattern of 7 X 8 dots was used for each of four pre-selected exposure times,
low (30 µs), commercial standard (45 µs), medium (80 µs) and high (120 µs). The modified leaf
porometer was placed on the top of the treated area immediately after etching until a stable
reading was obtained.
Water vapor diffusion from grapefruit was calculated using equation 3-1 based on Fick’s
law where “water vapor flux density” or “evaporation rate” (F) is the product of vapor
conductance (gv) and the difference between vapor concentration at the evaporating surface
(Cvs) and water vapor concentration in atmosphere (Cva). Values are expressed as millimoles
per square meter per second. The modified leaf porometer estimates the value for water vapor
conductance (gv) which can be computed in the equation below to obtain ‘Evaporation rate’.
F = gv (Cvs – Cva) (3-1)
Vapor concentration was calculated using equation 3-2, where ea is the vapor pressure
(kPa) which is a function of temperature, and pa is the atmospheric pressure (kPa).

40
𝐶𝐶𝐶𝐶 = 𝑒𝑒𝑎𝑎𝑃𝑃2
(3-2)
3.2.5 Effect of Different Waxes on Water Loss from Labeled Areas
Nine different commercial waxes were tested for their effect on moisture loss reduction
from a labeled area. Waxes were obtained directly from the manufacturers. Fruit were labeled
using a single exposure time (45 µs) then waxed using a sponge paint brush. Evaporation rate
measurements of the labeled and unlabeled (control) surfaces were performed before and after
waxing. Each measurement was replicated 30 times.
Table 3-1. Nine commercial waxes tested for water loss reduction from laser labeled areas Names of waxes Names of Manufacturers Deco shellac Deco, Monrovia, CA Carnuba 505 Deco, Monrovia, CA Carnuba + TBZ Deco, Monrovia, CA Carnuba 231 Deco, Monrovia, CA
Carnuba blend Deco, Monrovia, CA Citrus wax shellac HDH Agriproducts, Tavares, FL
HDH Carnuba HDH Agriproducts, Tavares, FL Pace Carnuba Pace International, Visalia, CA
Organic Carnuba Pace International, Visalia, CA
A separate experiment was conducted to evaluate water loss from waxed and unwaxed
etched areas during storage. Etched rectangles were waxed and fruit kept at 10 °C and 95% RH
for 7 d. Daily measurements of ‘evaporation rates’ of the waxed label, unwaxed label and
control (no label on fruit) were carried out. For each treatment, 30 separate measurements were
made.
3.2.6 Peel Stability
The label “Florida citrus” was etched on the fruit using four exposure times (35 µs, 45 µs,
85 µs, 120 µs), and fruit was kept at 10 °C and 65% or 95% RH for 4 weeks. Five replicates (1
replicate = 1 box = 35 fruit) per exposure time and control (non labeled fruit) were used. Weekly

41
examination of the label appearance and surrounding area was performed. Peel stability was
determined on the basis of a visual rating scale according to the shrinkage of the skin around
label as follows: 0 (no shrinkage); 1 (very low); 2 (low); 3 (medium); 4 (high); 5 (very high)
(Figure 3-1).
Figure 3-1. Shrinkage rating scale for laser-labeled ‘Ruby Red’ grapefruit peel. Scale ranges from 0 (no shrinkage) to 5 (total label collapse). Fruit were labeled at 45 µs with the label “Florida Citrus”
3.2.7 Decay Study
Fruit treated as indicated above and stored at 95% RH were examined weekly for decay
symptoms for 5 weeks. Decay was categorized individually, but reported as total decay.
3.2.8 Mold Inoculation Study
Fruit labeled “Florida Citrus” were subjected to four treatments: 1) Inoculation of fruit
prior to labeling; 2) Inoculation after labeling; 3) Inoculation on waxed label; 4) Waxing of
inoculated label. Inoculum was prepared as described in chapter 2. Inoculated fruit were stored
at 10 °C and 95% RH for 3 weeks and examined for decay weekly. Thirty replicates of one fruit
each were used for all four treatments. Labeling was performed using one exposure time (45µs).
In a separate experiment, 250 µL of the P. digitatum spore suspension was spread on agar
plates, allowed to dry and incubated at 23 °C. In a separate experiment, spores were allowed to

42
germinate for 72 h and plates were then labeled as indicated above. Laser labels were observed
under microscope immediately and 48 h after labeling.
3.3 Results
3.3.1 Optimization of Exposure Time for Grapefruit Labeling
A previous study demonstrated that the dot matrix style forming the alphanumerical
characters of laser labels constitute superficial ruptures (pinholes) of the epidermal layer
exposing the contrasting underlying tissue (Etxeberria et al., 2006). On citrus fruit, however,
because the colored epidermis (flavedo) is thicker than the depth of the pinholes, vegetable dye
was applied to provide contrast. The visual effect of increasing laser labeling exposure time on
grapefruit peel is shown in Figure 3-2. At the lowest possible exposure time of 30 µs, the label
was faint and hardly visible, whereas at the highest exposure time the pinhole depressions
merged into solid lines.
Figure 3-2. A group photograph of labels etched on ‘Ruby Red’ grapefruit using different exposure times/energy levels. The 45 µs picture represents the energy level generally recommended for commercial use. Contrast of etched label was enhanced using fruit based color

43
Using image processing software, affected surface area was calculated as a factor of
increasing exposure time. In general, area covered by the etched marking increased with higher
exposure times (Figure 3-3). As expected, the rate of peel surface area disruption declined at
higher exposure times as pinholes began to merge.
Figure 3-3. Relationship between exposure time (30 to 140 µs) and laser-labeled surface area (covered by 100 dots) of ‘Ruby Red’ grapefruit. Each point represents the average of five replicates labeled at ambient temperature. Vertical lines represent the standard error
3.3.2 Measurements of Water Loss
Water loss from etched surfaces was measured as a function of exposure time and pinhole
size (Figure 3-4). For this experiment, four exposure times were selected representing low (35
µs), commercially recommended (45 µs), medium (85 µs) and high (120 µs). Water loss
measurements were made immediately after labeling. As shown in Figure 3-4, there was a rapid
increase in the rate of water loss between 45 and 85 µs. Afterwards, increase in the rate of water
loss was negligible.
y = 1472.3ln(x) - 4958.3R² = 0.9069
0
500
1000
1500
2000
2500
3000
0 50 100 150
Surf
ace a
rea
(µm
2/1
00 d
ots)
Exposure time (µs)

44
Figure 3-4. Water loss from laser-labeled ‘Ruby Red’ grapefruit peel using four different exposure times. Water loss from the etched surface was measured at ambient temperature immediately after laser labeling 30 fruit per exposure time. Letters atop bars indicate statistical groupings. Bars with different letters are significantly different (P=0.05)
3.3.3 Effect of Waxes on Water Loss Retardation in Labeled Area
The effect of waxing on reducing water loss from etched fruit surfaces was investigated
using different waxes. All nine waxes tested reduced water loss by 25% to 94% with four
coatings showing over 90% reduction (Figure 3-5). Citrus wax shellac resulted in the highest
reduction of water loss (94%; Figure 3-5) whereas shellac resulted in moderate water loss
reduction as previously described by Hagenmaier and Shaw (1991).
Figure 3-5. Percentage decrease in the rate of water loss from laser-labeled ‘Ruby Red’ grapefruit peel by different commercial waxes compared to unwaxed label. Bars with different letters are significantly different by t Tests (LSD= 14.7, P=0.05)
b b
a a
0
2
4
6
8
10
35 45 85 120E
vapo
ratio
n ra
te (m
mol
.m -2
.sec
-1)
Exposure time (µs)
LSD1.19
0
20
40
60
80
100
120
Dec
reas
e in
eva
pora
tion
rate
(%)
Type of wax
a a a a
b b
ccd
d

45
Water loss from unwaxed labeled areas declined with time in storage (Figure 3-6). There
was a steady decline in the rate of water loss up to 72 h after labeling which continued more
gradually thereafter. Water loss from unwaxed labeled areas never reached control levels
(Figure 3-6) as they did with tangerines (Citrus reticulata) 4 d after labeling (Sood et al., 2008).
During the first 24 h, the rate of water loss from waxed etched areas was approximately 40%
higher than control. Afterwards, water loss from control and waxed labeled surface remained
nearly identical.
Figure 3-6. Water loss from unwaxed label, waxed (carnuba) label and control ‘Ruby Red’ grapefruit (no label) during 7 d storage at 10 °C (50.0 °F). Initial measurements were taken on 30 fruit immediately after labeling at ambient temperature. Vertical lines represent standard error of the averages.
3.3.4 Peel Stability
The potential effect of water loss from the etched area on the label stability during storage
was investigated at two levels of RH. To determine the physical effect on label stability, a visual
scale was created (see Materials and Methods; Figure 3-1). As expected, degree of label
distortion increased with time and was inversely proportional to ambient RH (Figures 3-7 and 3-
0
2
4
6
8
10
0 24 48 72 96 120 144
Eva
pora
tion
rat
e (m
mol
.m -2
.sec
-1)
Time after labeling (h)
unwaxed label
waxed label
control

46
8). After 4 weeks in storage, approximately 40% of etched labels in fruit stored at 95% RH
showed some degree of shrinkage, although most were classified as very low (Figure 3-7). On
the contrary, storage at 65% RH resulted in substantial label shrinkage with approximately 98%
of the fruit affected (Figure 3-8). This is in sharp contrast to tangerines which showed minimal
shrinkage when stored at similar RH (Sood et al., 2008).
Table 3-2. Peel stability of laser labeled “Ruby Red” grapefruit using 45µs and stored at 10 oC and 95% RH
Percentage of total fruit Time after labeling (weeks) 1 (very low) 2(low) 3(medium) 4(high) 5(very high)
1 15.38 1.14 0 0 0 2 28.55 2.28 0 0 0 3 28.54 5.13 0 0 0 4 27.39 10.26 1.14 0 0
Figure 3-7. Peel shrinkage of etched ‘Ruby Red’ grapefruit during storage at 10 °C (50.0 °F) and 95% relative humidity. Shrinkage severity was determined on 175 unwaxed fruit per exposure time using a visual scale of 0 (very low or no shrinkage) to 5 (very high or total label collapse) depicted in Figure 3-1.
0
10
20
30
40
50
60
70
1 2 3 4
% o
f tot
al fr
uit
Time after labeling (week)
1 (very low)2 (low)3 (medium)4 (high)5 (very high)

47
Table 3-3 Peel stability of laser labeled “Ruby Red” grapefruit using 45µs and stored at 10oC and 65% RH
Percentage of total fruit Time after labeling (weeks) 1 (very low) 2(low) 3(medium) 4(high) 5(very high)
1 19.96 13.68 3.99 0 0 2 58.24 25.1 5.13 0 0 3 50.24 24.54 13.68 2.28 0 4 55.4 23.4 11.4 4.56 1.14
Figure 3-8. Peel shrinkage of etched ‘Ruby Red’ grapefruit during storage at 10 °C (50.0 °F) and
65% relative humidity. Shrinkage severity was determined on 175 unwaxed fruit per exposure time using a visual scale of 0 (very low or no shrinkage) to 5 (very high or total label collapse) depicted in Figure 3-1.
3.3.5 Decay Study
Fruit decay was followed for 5 weeks in packed grapefruit stored at 10 °C and 95% RH.
Close attention was placed to the sites of decay with special emphasis on the labeled area.
Although different kinds of decay were noted, we report total decay for simplification. In the
present study, fruit decay in fruits labeled with all four exposure times was similar to control
non-labeled fruit (Figure 3-9). All decay present during the 5-week storage period was
0
10
20
30
40
50
60
70
1 2 3 4
% o
f tot
al fr
uit
Time after labeling (week)
1 (very low)2 (low)3 (medium)4 (high)5 (very high)

48
independent from the labeled areas, the most common being stem end rot. These results are
analogous to those of Yuk et al. (2007) who demonstrated a lack of Salmonella migration and
survival in tomato laser labels.
Table 3-4 Decay of non laser labeled and laser labeled “Ruby Red” grapefruit using four different exposure time
Total Decay (%) Time after labeling
(weeks) Control 35 µs 45 µs 85 µs 120 µs
1 0 0 0 1.14 0 2 0.57 0 0 1.14 0 3 1.71 0 0.57 1.14 0.57 4 1.71 0.57 0.57 1.71 1.41 5 1.71 0.57 0.57 1.71 1.41
Figure 3-9. Total decay of labeled ‘Ruby Red’ grapefruit in storage. Fruit were labeled using 4 exposure times (35 µs, 45 µs , 85 µs and 120 µs) at ambient temperature and stored at 10 °C (50.0 °F) and 95% relative humidity. There was no decay associated with the laser label. Each point represents the average of five boxes, each box containing 50 fruit. Vertical lines represent standard error of the averages
In citrus fruits, green mold caused by P. digitatum is the most common postharvest decay.
Surprisingly, fruit inoculated prior to or after labeling with a P. digitatum spore suspension
showed no symptoms of mold growth even after 3 weeks in storage. On the contrary, the control
fruit which was wounded and inoculated with the same spore suspension decayed within a week.
aa
a
a
a
0
1
2
3
4
5
1 2 3 4 5
Tot
al d
ecay
(%)
Time after labeling (weeks)
35 µs45µs85µs120µscontrol
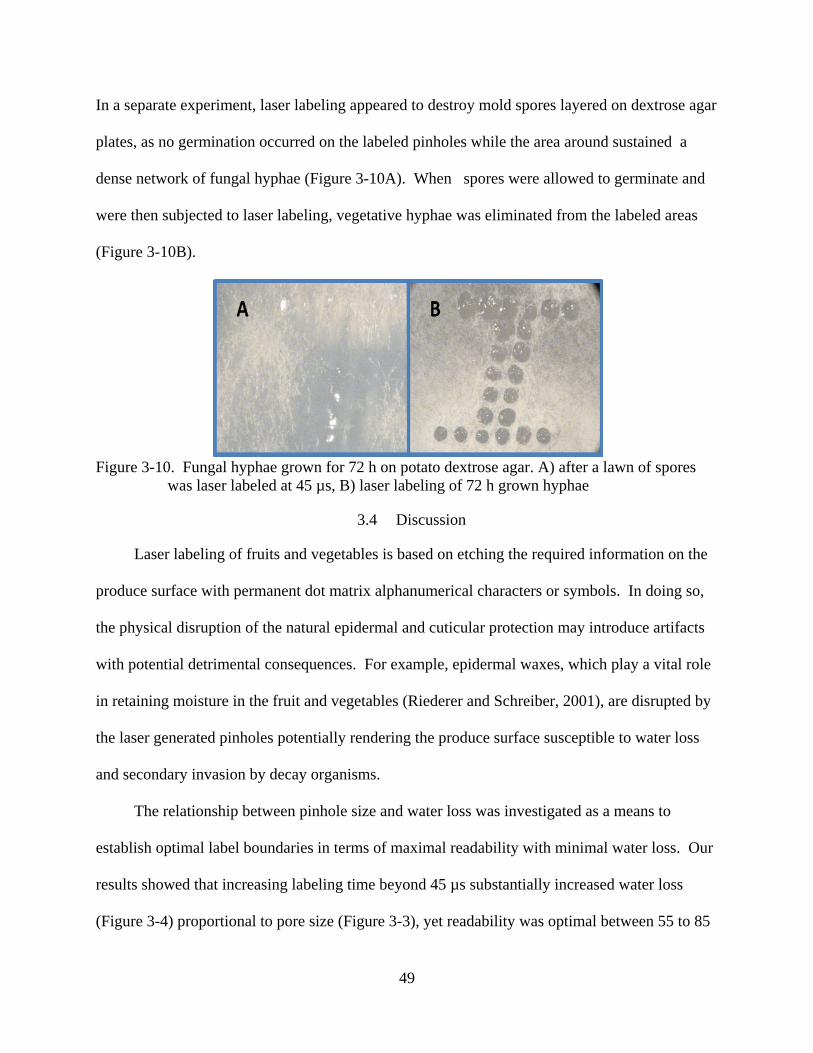
49
In a separate experiment, laser labeling appeared to destroy mold spores layered on dextrose agar
plates, as no germination occurred on the labeled pinholes while the area around sustained a
dense network of fungal hyphae (Figure 3-10A). When spores were allowed to germinate and
were then subjected to laser labeling, vegetative hyphae was eliminated from the labeled areas
(Figure 3-10B).
Figure 3-10. Fungal hyphae grown for 72 h on potato dextrose agar. A) after a lawn of spores
was laser labeled at 45 µs, B) laser labeling of 72 h grown hyphae
3.4 Discussion
Laser labeling of fruits and vegetables is based on etching the required information on the
produce surface with permanent dot matrix alphanumerical characters or symbols. In doing so,
the physical disruption of the natural epidermal and cuticular protection may introduce artifacts
with potential detrimental consequences. For example, epidermal waxes, which play a vital role
in retaining moisture in the fruit and vegetables (Riederer and Schreiber, 2001), are disrupted by
the laser generated pinholes potentially rendering the produce surface susceptible to water loss
and secondary invasion by decay organisms.
The relationship between pinhole size and water loss was investigated as a means to
establish optimal label boundaries in terms of maximal readability with minimal water loss. Our
results showed that increasing labeling time beyond 45 µs substantially increased water loss
(Figure 3-4) proportional to pore size (Figure 3-3), yet readability was optimal between 55 to 85

50
µs. Therefore, optimizing readability at the lowest range of water loss between the range 45 to
55 µs can be achieved without risking additional detrimental effects due to water loss.
During commercial operations at the packinghouse, waxing of citrus fruits precedes fruit
labeling, packing, storage, and long-distance transport. Whereas sticker labels do not suffer
physical deterioration in storage, the loss of water from the etched labels (Figure 3-6) may alter
the physical appearance of the fruit’s surface, thereby distorting the label (Figures 3-1, 3-7, 3-8)
and making it less effective and appealing. As reported, RH has a direct effect on the rate of
moisture loss from produce surfaces (Forbes and Watson, 1992). The data indicated that a
considerable portion of the fruit showed some level of shrinkage making the label unreadable,
especially fruit stored at 65% RH for 4 weeks. Even the lowest shrinkage (or shriveling)
obtained at 95% RH can be sufficient to make the fruit less appealing. It is likely that at some
point in the commercial chain of events, fruit may encounter lower than 65% RH. Although the
natural healing process of the label pinholes reduced water loss to control levels after 4 d (Figure
3-6; Etxeberria et al., 2006), addition of a secondary wax coat immediately after labeling reduced
water loss to control levels (Figure 3-6) which delayed or prevented unnecessary shrinkage. In
as much as a second wax application is not commercially feasible at the moment, methods
should be developed to address this problem in the future to avoid loss of visual appeal and
functionality.
Citrus fruits are relatively non-perishable, and can normally be stored for long periods
(Kader, 2002). Grapefruit can be stored at 10 to 15 °C and 90% to 95% RH for 5 to 8 weeks
(Grierson, 1974). In general, citrus fruits are vulnerable to various decay organisms during
storage, especially Penicillium sp. (Kinay et al., 2001). Penicillium sp. growth necessitates
rupture of the produce surfaces (Eckert and Brown, 1986) a condition seemingly created by the

51
laser pinholes. Our data from fruit held at 10 ºC and 95% RH for 5 weeks showed no decay
symptoms associated with the etched area. Brown et al. (1979) found that accumulation of lignin
occurred rapidly in injuries at 30 °C and RH over 90%, likely creating rapid protection.
Although our experiments were conducted at 10 ºC, either formation of lignin or loss of humidity
from the pinhole area appeared sufficient to deter decay. This is probable because P. digitatum
is a wound parasite and does not actively invade intact plant tissue. There were some decayed
fruit in the etched fruit samples; however, it was no different than that of non-etched fruit control
samples. The lack of decay associated with etched areas was further substantiated by exposing
the fruit to four possible conditions : 1) Inoculation of fruit prior to labeling; 2) Inoculation after
labeling; 3) Inoculation on waxed label; 4) Waxing of inoculated label. Whether coated with a
high concentration of P. digitatum spores before laser labeling or a layer of spores coated over
the freshly etched surface, no fruit decay took place from the labeled area during 4 weeks in
storage. The lack of decay by mold was unexpected given that, in one instance, fruit were
essentially inoculated with P. digitatum spores immediately after laser labeling. These data, and
especially those of Figure 3-10 showing lack of spore germination on etched areas and the
elimination of vegetative hyphal growth by laser labeling, demonstrate that the laser labeled
areas do not have increased susceptibility to decay organisms in grapefruit.
There was an appreciable difference in the postharvest behavior of laser labeled fruit
between grapefruit and tangerines, especially on the efficacy of different waxes in preventing
water loss and in label shrinkage (Sood et al., 2008). Differences in wax efficiency are difficult
to reconcile considering that surface area affected by different labeling times was nearly identical
in both types of citrus and coverage by waxes is expected to be alike. However, previous work
by the authors showed that any treatment of fruit peel affects the cuticle, and therefore, could

52
have an effect on the way that additional coatings are laid down. Re-arrangement of the
epicuticular waxes, even in different areas on the same fruit, will determine the coverage of
waxes applied to the peel (data not shown). Also the differences in peel topography between the
tangerine and the grapefruit may be an added factor in the uniformity of the applied coating. The
larger number of grapefruit affected by label shrinkage, however, is likely due to the higher
percentage of water loss through the labeled areas as compared to non-labeled areas.
Although restricted to one commodity, this study shows that laser labeling of grapefruit is
a viable option to identify produce with a permanent tag. When compared to sticker labeled fruit,
a laser labeled commodity is relatively tamper free and the fruit quality remains high as the
invasion of the epidermis does not incite decay, provide an avenue for food pathogens and water
loss is easily controlled.

53
CHAPTER 4 EFFECTS OF LASER LABELING ON THE POSTHARVEST STORAGE BEHAVIOUR OF
TOMATO AND PEPPER FRUIT
4.1 Introduction
Produce consumption is considered as the prime source of food borne illnesses in the US
(Center for Disease Control and Prevention, 2006). The difficulty to trace the past outbreaks such
as Salmonella in tomatoes, E.coli O157:H7 in apples etc. has made the labeling of produce a
necessity. Labeling helps track and trace the product to its original source (i.e. grower and
packer). Thus far, the most widely used labeling system for produce is Price Look Up (P.L.U.)
stickers/adhesive labels. These stickers offer several advantages such as making the checkout
process easier, helps distinguishing between similar products and tracing back to the original
sources. However the non permanency of these stickers urged industry and scientists to develop
a more efficient and permanent labeling method called as laser labeling. Laser labeling, as
mentioned in previous chapters, involves the use of low energy CO2 to etch information directly
onto the fruit surface by creating pinhole depressions. These etched openings can promote
undesirable water loss and serve as an entry site for pathogen invasion. However, anatomical and
morphological studies of laser etched depressions in tomato and avocado showed the
accumulation of additional waxes and phenolic compounds around exposed cell walls and
underneath tissues, thereby proposing the self healing mechanism of laser etched areas
(Etxeberria et al., 2006).
Initial studies to investigate the postharvest effect of the laser labeling were conducted on
citrus fruit such as tangerine and grapefruit. The results helped in identifying the optimum laser
energies for commercial use in both the fruits. Additionally, it was shown that laser labeling
does not promote decay and only allows minimal water loss in citrus fruits. The appearance of
the label does change with the time unless wax coated. The present study deals with fruit with

54
edible peel such as tomato and pepper. Because of the variation in the morphology of the fruits
with non-edible peel fruit like citrus, laser labeling was anticipated to behave differently.
Tomato (Lycopersicon esculentum) is one of the most widely consumed vegetable crops
worldwide (Chapagain and Wiesman, 2004) .Botanically, a tomato fruit is a berry consists of
seed enclosed in fleshy pericarp developed from ovary. Pericarp is further divided into exocarp
or fruit skin, parenchymatous mesocarp and a single celled layer of endocarp. The fruit skin or
exocarp composed of the outer epidermal layer and two to four layers of thick walled
hypodermal cells with collenchymatous thickenings. Epidermal layer of a tomato fruit is covered
with thin waxy cuticle. Green pepper (Capsicum annum) is a berry fruit with capsule shaped
hollow structure. The berry is formed by a thick juicy pericarp and a placenta binding the seeds.
The pericarp is further composed of an epicarp or external layer, mesocarp or fleshy intermediate
zone and a membranous endocarp.
This study was focused on the effects of laser labeling on water loss and other postharvest
concerns (e.g., decay, label shrinkage) in thin skinned peel-edible produce such as tomato and
green peppers and to contrast the results with those obtained for citrus fruit.
4.2 Materials and Methods
4.2.1 Plant Material
Tomato fruit variety “BHN602” was purchased from Taylor and Fulton Packinghouse,
Palmetto, Floridaon 10 June, 2008. Tomato fruit was procured at mature green stage. On the
other hand, pepper fruit was purchased from and J&J Ag Products, Inc. Packinghouse,
Clewiston, Florida on 5 th July, 2008. Both the fruits had been washed and coated with mineral
oil based waxes following established commercial practices.

55
4.2.2 Fruit Labeling
Fruit was labeled as described in chapter 3. Applied energy or exposure time varied
depending on the type of experiments conducted.
4.2.3 Selection of Optimal Exposure Time
A label code containing one letter and one number (“O1”) was etched on fruit surfaces
using different exposure times ranging from 30 µs to 120 µs. A dark, fruit- based colorant was
rubbed gently over the labels with a cotton-tipped swab to enhance resolution. Total area covered
by the laser depressions was calculated by following the procedure described in chapter 3. Five
replicates per energy level were used.
4.2.4 Determination of Water Loss
Water loss was measured as described in chapter 3 except the exposure times used. Tomato
and pepper fruit were labeled using four pre-selected exposure times, low (35 µs), standard (55
µs), medium (75 µs) and high (100 µs).
4.2.5 Peel Stability
The label “Florida tomato” was etched on tomato fruit using an optimum exposure time
and fruit was kept at 12.5°C and 65% or 95% RH for 3 weeks. Five replicates (1 replicate = 1
box = 50 fruit) per exposure time and control (non labeled fruit) were used. Similarly, pepper
fruit was etched with the label “Florida pepper” and stored at 7oC and 65% or 95% RH for 3
weeks. Five replicates (1 replicate = 1 box = 30 fruit) per exposure time and control (non labeled
fruit) were used. Fruit was examined for label appearance and surrounding area for 3 weeks. Peel
stability of both the fruit types was determined on the basis of a visual rating scale according to
the shrinkage of the skin around label as follows: 0 (no shrinkage); 1 (very low); 2 (low); 3
(medium); 4 (high); 5 (very high) (Figure 4-1) and (Figure 4-2).

56
A separate experiment was conducted to evaluate peel stability of waxed and unwaxed
etched areas in tomato fruit during storage. Daily visual observations of the unwaxed and waxed
laser labels on tomato fruit was done for 7 days.
4.2.6 Decay Study
Fruit treated as indicated above and stored at 95% RH were examined for decay
symptoms nearly every alternate day for 3 weeks. Results were reported as total decay.
Figure 4-1. Shrinkage rating scale for laser-labeled tomato peel. Scale ranges from 0 (no shrinkage) to 5 (total label collapse). Fruit were labeled at 55 µs with the label “Florida tomato”
Figure 4-2. Shrinkage rating scale for laser-labeled pepper peel. Scale ranges from 0 (no shrinkage) to 5 (total label collapse). Fruit were labeled at 55 µs with the label “Florida pepper

57
4.2.7 Inoculation Study
Pathogen inoculation study on fruit labeled “Florida tomato” and “Florida pepper” was
conducted as described in chapter 3. Tomato and pepper fruit were inoculated with Geotrichum
candidum Link. The inoculum was prepared using the same method as with the Penicillium
digitatum. Inoculated tomato and pepper fruit were stored for 3 weeks at 95% RH and at 12.5 oC
and 7 oC, respectively. Weekly examination of the inoculated fruit was carried out. Labeling was
performed using one exposure time (55µs).
4.3 Results
4.3.1 Optimum Exposure Time for Labeling
Previous anatomical and morphological studies demonstrated that the dot matrix style
forming the alphanumerical characters of laser labels represent surface ruptures (pinholes) of the
epidermal layer exposing the contrasting underlying tissue (Etxeberria et al., 2006). The visual
effect of increasing laser labeling exposure time on tomato and pepper peel is shown in Figure 4-
3 and Figure 4-4. As in previous tests on tangerine and grapefruit, the lowest possible exposure
time of 30 µs generated faint, very superficial and slightly visible label, whereas the highest
exposure time caused the merging of the pinhole depressions into solid lines.
These results were similar to as seen in citrus fruit (Sood et al, 2007). However, because
of the difference in skin morphology, the labels on tomato and pepper were clearer and more
visible than on citrus.
The affected surface area as a function of increasing exposure time was calculated using
the same image processing software developed by Dr. Arnold Schumann. As previously
demonstrated in citrus fruit, (Chapter 1 and 2), area covered by etched markings increased in
response to higher exposure times (Figure 4-5 and Figure 4-6). As expected, the rate of peel
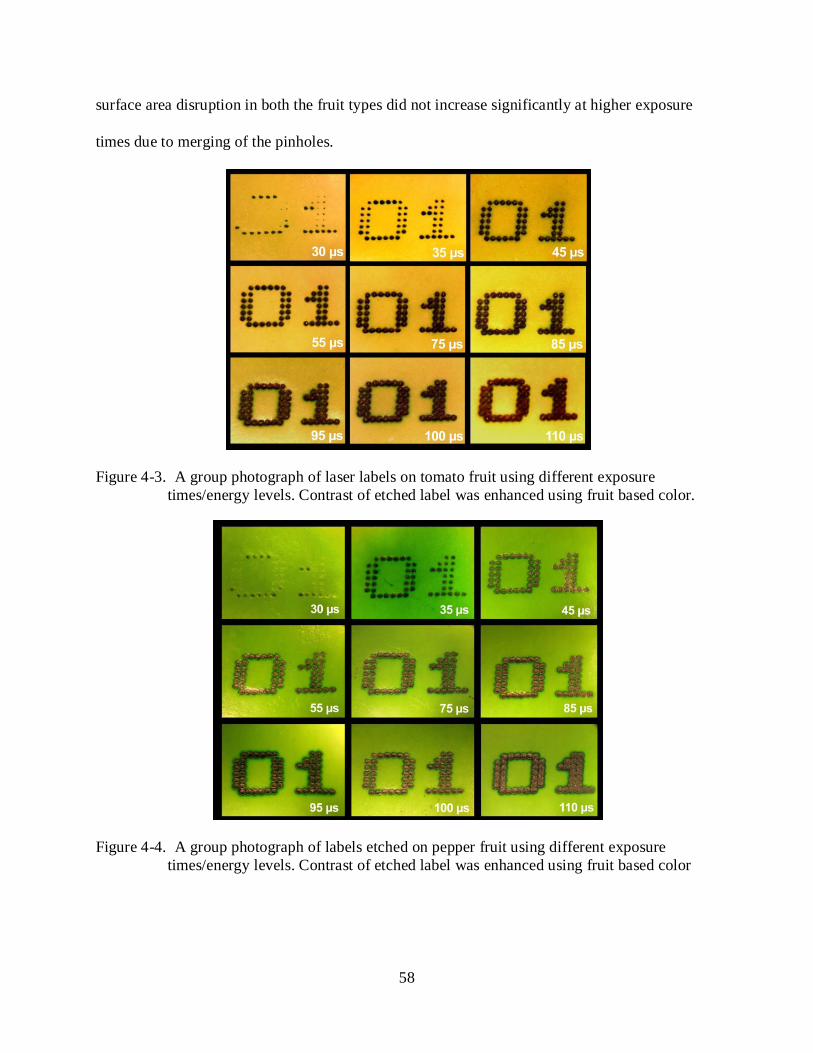
58
surface area disruption in both the fruit types did not increase significantly at higher exposure
times due to merging of the pinholes.
Figure 4-3. A group photograph of laser labels on tomato fruit using different exposure times/energy levels. Contrast of etched label was enhanced using fruit based color.
Figure 4-4. A group photograph of labels etched on pepper fruit using different exposure times/energy levels. Contrast of etched label was enhanced using fruit based color

59
Figure 4-5. Relationship between exposure time (30 to 120 µs) and laser-labeled surface area (covered by 100 dots) of tomato fruit. Each point represents the average of five replicates labeled at ambient temperature. Vertical lines represent the standard error.
Figure 4-6. Relationship between exposure time (30 to 120 µs) and laser-labeled surface area (covered by 100 dots) of pepper fruit. Each point represents the average of five replicates labeled at ambient temperature. Vertical lines represent the standard error
4.3.2 Measurements of Water Loss
Water loss from laser labeled surfaces was measured as a factor of exposure time and
pinhole size (Figure 4-7 and Figure 4-8). For this experiment, four different exposure times, 35
µs, 55 µs, 75 µs and 100 µs were selected. Water loss measurements were made immediately
y = -0.1174x2 + 37.354x - 1010.1R² = 0.8819
0
500
1000
1500
2000
2500
0 15 30 45 60 75 90 105 120
Surf
ace A
rea
(µm
2 \10
0dot
s)
Exposure time (µs)
y = 3.0718x1.4518
R² = 0.9142
0
500
1000
1500
2000
2500
3000
3500
4000
0 15 30 45 60 75 90 105 120 135
Surf
ace A
rea
(µm
2 \10
0dot
s)
Exposure time (µs)

60
after labeling. As shown in Figure 4-7, the rate of water loss from tomato fruit followed a nearly
linear pattern while pepper fruit (Figure 4-8), showed a rapid increase in the rate of water loss
between 35 and 55 µs. Afterwards, there was a negligible increase in the rate of water loss. The
results for both the fruits were represented using the same scale so as to provide for a better
comparison.
Figure 4-7. Water loss from laser-labeled tomato fruit peel using four different exposure times. Water loss from the labeled surface was measured at ambient temperature immediately after laser labeling 20 fruit per exposure time. Letters atop bars indicate statistical groupings. Bars with different letters are significantly different (P=0.05).
Figure 4-8. Water loss from laser-labeled pepper fruit peel using four different exposure times. Water loss from the laser labeled surface was measured at ambient temperature immediately after laser labeling 20 fruit per exposure time. Letters atop bars indicate statistical groupings. Bars with different letters are significantly different (P=0.05)
cb b
a
02468
101214161820
35 55 75 100
Eva
pora
tion
rate
(mm
ol/m
2 sec
)
Exposure time (µs)
c
b
ba
a
02468
101214161820
35 55 75 100
Eva
pora
tion
rate
(mm
ol\m
2 sec
)
Exposure time (µs)

61
4.3.3 Peel Stability
The potential effect of water loss from the etched area on the label stability during storage
was investigated at two levels of RH. To determine the physical effect on label stability a visual
scale was created (see Materials and Methods; Figure 4-1and Figure 4-2). As expected, degree
of label distortion increased with time and was inversely proportional to ambient RH (Figures 4-
7 and Figure 4-8). After just a week in storage, approximately 50% of laser labels in fruit at 95%
RH showed some degree of shrinkage, although most were classified as very low (Figure 4-9 and
Figure 4-11). On the contrary, storage at 65% RH resulted in substantial and rapid label
shrinkage with approximately 98% of the fruit affected (Figure 4-10 and Figure 4-12). The
results presented do not include the decayed fruit which were discarded during the evaluation.
There was a sharp contrast in the label stability of tomato and pepper fruit when compared
to citrus. Owing to the epidermal permeability of tomato and pepper fruit, there was a quick and
very high level of shrinkage of the laser labels and surrounding areas as compared to citrus fruit.
Table 4-1. Peel stability of laser labeled tomato fruit stored at 12.5oC and 65% RH Percentage of total fruit
Time after labeling (days) 1 (very low) 2(low) 3(medium) 4(high) 5(very high) 2 94 6 0 0 0 6 79.2 8.8 4.8 0 0 8 66 21.6 10.8 1.2 0 10 16 23
59.6 27.6 19.2
27.2 54.4 57.2
10 11.6 10.4
3.6 3.6 5.2
0 0 0
Table 4-2. Peel stability of laser labeled tomato fruit stored at 12.5oC and 95% RH
Percentage of total fruit Time after labeling (days) 1 (very low) 2(low) 3(medium) 4(high) 5(very high)
2 74.8 7.2 0 0 0 6 85.6 10 3.6 4.4 0 8 82.4 13.2 4.4 0 0 10 16 23
77.2 64.8 46.8
14 17.6 26.8
6.8 10.4 8.4
0 1.2 0
0 0 0

62
Figure 4-9. Peel shrinkage of laser labeled tomato fruit during storage at 12.5°C (55 °F) and 95% relative humidity. Shrinkage severity was determined on 250 unwaxed fruit per exposure time using a visual scale of 0 (very low or no shrinkage) to 5 (very high or total label collapse) depicted in Figure 4-1.
Figure 4-10. Peel shrinkage of laser labeled tomato fruit during storage at 12.5 °C (55 °F) and 65% relative humidity. Shrinkage severity was determined on 250 unwaxed fruit per exposure time using a visual scale of 0 (very low or no shrinkage) to 5 (very high or total label collapse) depicted in Figure 4-1.
0102030405060708090
100
2 6 8 10 16 23
% o
f tot
al fr
uit
Time after labeling (days)
1 (very low)2 (low)3 (medium)4 (high)5 (very high)
0102030405060708090
100
2 6 8 10 16 23
% o
f tot
al fr
uit
Time after labeling (days)
1 (very low)2 (low)3 (medium)4 (high)5 (very high)

63
Table 4-3. Peel stability of laser labeled pepper fruit stored at 7.5oC and 65% RH Percentage of total fruit
Time after labeling (days) 1 (very low) 2(low) 3(medium) 4(high) 5(very high) 4 3.32 19.4 62.4 1.98 0 7 0 0 49.8 44.2 2.4 11 0 0 35 48.4 5.8 14 18 21
0 0 0
0 0 0
0 0 0
19.6 19.8 2.6
34.6 36.6 18.4
Table 4-4. Peel stability of laser labeled pepper fruit stored at 7.5oC and 95% RH Percentage of total fruit
Time after labeling (days) 1 (very low) 2(low) 3(medium) 4(high) 5(very high) 4 15.8 54.6 23.8 0 0 7 0 14.2 72.8 5.2 0 11 0 3.2 46.8 35.6 1.2 14 18 21
0 0 0
1.2 1.2 0
34.4 15.8 7.2
41 37.6 34.4
6.4 11.8 18.4
Figure 4-11. Peel shrinkage of laser labeled pepper fruit during storage at 7°C (45 °F) and 95% relative humidity. Shrinkage severity was determined on 150 unwaxed fruit per exposure time using a visual scale of 0 (very low or no shrinkage) to 5 (very high or total label collapse) depicted in Figure 4-2
0102030405060708090
100
4 7 11 14 18 21
% o
f tot
al fr
uit
Time after labeling (days)
1 (very low)2 (low)3 (medium)4 (high)5 (very high)

64
Figure 4-12. Peel shrinkage of laser labeled pepper fruit during storage at 7°C (45 °F) and 65% relative humidity. Shrinkage severity was determined on 150 unwaxed fruit per exposure time using a visual scale of 0 (very low or no shrinkage) to 5 (very high or total label collapse) depicted in Figure 4-2.
Figure 4-13. Unwaxed and waxed laser labeled tomato fruit during storage.
0102030405060708090
100
4 7 11 14 18 21
% o
f tot
al fr
uit
Time after labeling (days)
1 (very low)2 (low)3 (medium)4 (high)5 (very high)

65
When stored for 7 days at 12.5 oC and 95% RH conditions, waxed laser labels maintained
the peel integrity as opposed to unwaxed labels which showed considerable shrinkage around the
labeled area (Figure 4-13).
4.3.4 Decay Study
Fruit decay was monitored for 3 weeks in packed tomato and pepper stored at their
respective optimum temperature and 95% RH. Close attention was placed to the sites of decay
with special emphasis on the labeled area. Although different kinds of decay were observed, for
simplification, only total decay is reported. Decay in fruits labeled with all four exposure times
was similar to control non-labeled fruit (Figure 4-14 and Figure 4-15). Most of the decay during
the 3-week storage period was independent from the labeled areas, the most common being soft
rot (Erwinia carotovora) in both tomato and pepper, and sour rot (Geotrichum candidum) in
tomato. Unlike citrus, laser labeled tomato and pepper fruit occasionally showed some decay
about 2-3 % of the total decay on and around the label. However, there may be varied reasons for
this observation. The high moisture content of the etched surface may provide entry sites for
pathogens as compared to citrus. Despite of having few fruits with decay on label, the overall
decay study results are in conformity to those of Yuk et al. (2007) who demonstrated a lack of
Salmonella migration and survival in tomato laser labels.
Table 4-5. Decay of non laser labeled and laser labeled tomato fruit using four different exposure time
Total Decay (%) Time after labeling
(days) Control 35 µs 55 µs 75 µs 100 µs
2 0 0 0.4 0 0 6 0 1.2 0.8 0 0 8 0 1.2 0.8 0 0 10 0 1.2 0.8 0.4 0 16 0.8 4.8 14.8 12.8 18.4 23 1.6 17.2 36.4 41.2 34.4

66
Figure 4-14. Total decay of labeled tomato fruit in storage. Fruit were labeled using 4 exposure
times (35 µs, 55 µs , 75 µs and 100 µs) at ambient temperature and stored at 12.5°C (55 °F) and 95% relative humidity. Each point represents the average of five boxes, each box containing 50 fruit
Table 4-6. Decay of non laser labeled and laser labeled pepper fruit using four different exposure time
Total Decay (%) Time after labeling (days) Control 35 µs 55 µs 75 µs 100 µs
2 1.3 0 1.3 0 0 4 3.9 5.3 3.9 0.6 6 7 13.2 7.3 5.9 2.6 9.3
11 16.5 17.3 11.2 10.6 12.6 14 21.8 19.9 15.2 15.9 21.2 18 57.8 30.5 31.8 40.5 31.2 21 62.4 47.8 58.4 62.5 72.5
Figure 4-15. Total decay of labeled pepper fruit in storage. Fruit were labeled using 4 exposure
times (35 µs, 55 µs , 75 µs and 100 µs) at ambient temperature and stored at 7°C (45 °F) and 95% relative humidity. Each point represents the average of five boxes, each box containing 30 fruit
-20
-10
0
10
20
30
40
50
2 6 8 10 16 23
Tot
al d
ecay
( %
)
Time after labeling (days)
control35 µs55µs75µs100µs
-20
-10
0
10
20
30
40
50
60
70
80
2 4 7 11 14 18 21
Tota
l dec
ay (
%)
Time after labeling(days)
control35 µs55µs75µs100µs

67
4.4 Discussion
Etching the required information in form of permanent dot matrix style alphanumerical
characters or letters causes the opening up of outer protective cuticular barrier. These pinhole
depressions created can serve as a potential site for water loss and pathogen invasion. However,
it appears that the low energy CO2 beam momentarily vaporizes the natural and commercial wax
accumulating in exposed cell walls, thus creating a repellent shield (Etxeberria et al, 2006).
The relationship between pinhole size and water loss was investigated to establish optimal
label range in terms of maximal readability with minimal water loss. Unlike citrus, tomato and
pepper peel provides a good contrast for laser labels. Therefore, no additional dyeing of the
labels is required. Tomatoes were laser labeled when mature green. The laser labels were faint in
the beginning due to the lack of contrast provided by green tomato peel. However, they became
clear and developed visual appeal with the time as the tomato ripened. The results showed that
increasing exposure time beyond 45 µs substantially increased water loss proportional to
perforation size in both tomato (Figure 4-3 and Figure 4-4) and pepper (Figure 4-5 and Figure 4-
6), while readability was optimal between 45 to 85 µs. Therefore, optimizing readability at the
lowest range of water loss between the range 45 to 55 µs can be achieved without substantial
amount of water loss.
Resistance to water movement is mainly offered by the natural cuticular layer (Ben
Yehoshua, 1969; Burg and Burg, 1965; Horrocks, 1964). Water permeabilities from cuticle vary
with plant species and organ (Becker et al, 1986). During packinghouse operations, commercial
waxes are applied to most horticultural commodities to alleviate undesirable water loss and
improve visual appeal. Furthermore, storage at high RH conditions (90-95%) helps in retaining
moisture in the tissue. Water loss from the etched areas alters the appearance of the label. The
present study results also showed fruit peel shrinkage on and around the label. The distortion of

68
the labels occurred rapidly in tomato and pepper as compared to citrus fruit. This faster and large
number of label shrinkage in laser labeled tomato and pepper peel could be likely due to higher
amount of water loss through the labeled areas.
Tomato is a climacteric fruit and mostly harvested in the mature green stage. Tomato fruit
is quite perishable in nature, and storage at optimum temperature and relative humidity is very
essential to maintain its quality postharvest. The mature green or partially ripe fruit can be stored
best at 12.7 to 15.5 oC for 2-4 weeks in contrast to ripe fruit which is best at 7.2 to 10 oC for
nearly 2 weeks. On the other hand, Pepper is best stored at 7.5 oC for maximum shelf life of 3-5
weeks (Kader, 2002). In general, these fruits are vulnerable to various decay organisms during
storage, especially Erwinia sp. and Geotrichum sp. Most pathogen requires the rupture of the
produce surfaces for penetration and growth. Laser generated pinhole depressions seemingly
provide the avenue for the pathogen invasion, although as noticed previously, citrus fruit held at
10 ºC and 95% RH for 5 weeks showed no decay symptoms associated with the laser labeled
area. Stored laser labeled tomatoes and peppers were stored for maximum of 3 weeks to monitor
decay. In the present study, we observed appreciable differences in the postharvest behavior of
laser labeled between tomato and pepper fruit especially on the extent of decay associated with
the label. Nearly 45-70% of tomato fruit showed decay symptoms as oppose to pepper with 25-
40% decay. These decay symptoms were not associated with the etching markings. Additionally,
these results were different than the citrus decay study results as the percentage of decayed
tomato and pepper fruit obtained was higher than that of citrus. In very few instances, laser
labeled tomato and pepper developed bacterial rot symptoms on the labels. These results were in
contrast to citrus fruit where there was no decay observed on and around the label. Further, some
inoculated fruits also developed bacterial ooze on the label during the storage. Despite of having

69
some decay fruits (2-3% of the total rots) with decay symptoms on the label; the overall decay
was not statistically associated with the etched areas. The disassociation between decay and
labeled area was further confirmed by exposing the fruit to their most common postharvest
organism. The fruit was also subjected to the worst conditions where inoculation was performed
immediately after laser labeling. As expected, there was no decay in either of the situations.
As evident from these results and the ones presented in previous chapters, this novel
technology could be a viable alternative to label produce. Besides being permanent, it does not
support pathogen invasion, incite decay and water loss, thereby keeping the fruit quality
maintained.

70
CHAPTER 5 CONCLUSIONS
The study reported here was aimed at determining the effects of laser labeling, an
emerging technology, on the overall storage quality of selected fruits and vegetables. The effects
of this technique on the storage quality vary with the crop type. According to the results, the
optimum laser energy for the entire selected commodities ranged between 40-55 µs. It was also
noticed that etched markings on tangerine and grapefruit require dyeing by a food based color as
the citrus peel does not provides a better contrast for the labels. Water loss measured from the
laser labels was proportional to the exposure time of laser beam in all the selected crops.
However, the rate of water loss was highest in laser labeled pepper fruit among all. Citrus, a
relatively non perishable crop when laser labeled and stored at optimum temperature (10 oC) and
relative humidity (95%) conditions for 4 weeks, exhibited negligible water loss throughout the
storage period. Additionally, the rate of water loss from waxed labels was no different than the
control (non laser labeled) in citrus fruit after 4-7 days of storage.
The laser labels were waxed using different kinds of commercial coatings. The data
showed that wax application on the labels subsequently diminishes the rate of water loss from
35% to 94 % in citrus fruit. Among all the waxes used, citrus wax shellac resulted in the highest
reduction of water loss. Further it was noticed that the water loss preserves the label appearance
in all selected commodities. A considerable portion of fruit with unwaxed labels showed some
level of shrinkage rendering the label unreadable. The shrinkage was proportional to relative
humidity and time of storage. The label distortion or shrinkage was more at low RH (65%) than
the higher RH (95%) conditions. Tomato and pepper fruit showed severe and quicker label
shrinkage than citrus at both the low and higher humidity conditions. However this label

71
distortion was negligible when wax is applied immediately after labeling as waxing helps in
sealing of the pinhole depressions for further water loss.
Fruit held at 95% relative humidity, storage conditions conducive for decay and their
respective optimum temperature, showed nearly no decay symptoms associated with the etched
areas. Although some decayed fruit were found in the laser labeled fruit samples in all the
selected crops however, were no different than the control (non-laser labeled) fruit samples. In
very few instances, laser labeled tomato and pepper developed decay symptoms on the labels.
Despite having some fruits with decay symptoms on the labels (2-3% of the total decay), the
overall decay was not statistically associated with the etched markings.
The lack of decay associated with inoculated etched areas also confirmed that laser
labeling does not facilitate decay. Whether coated with pathogen spores before laser labeling or a
layer of spores spread over the freshly etched areas, no fruit decay from the labeled area was
noticed in all the four selected commodities. This further corroborates the previous findings of
Yuk et al (2007) who challenged tomato fruit with Salmonella and found that laser labeling does
not cause sufficient damage to allow Salmonella infiltration. It can be assumed that, with time,
the accumulation of lignin and wax deposits in and around etched areas also provides a repellant
shield and prevents the penetration of decay organism through etched openings. Various studies
have shown previously that the deposition of lignin and other cell wall components in the wound
tissue provides resistance to the diseases. The fungal development was found to be arrested by
phenolic compounds and callose deposits in the cell walls of young tomato fruit inoculated with
Botrytis cinerea (Glazener, 1982).
There was indeed an appreciable difference in the postharvest behavior of laser labeled
fruit namely citrus, tomato and pepper. For example the optimum exposure time of laser beam

72
for tomato and pepper is shorter than citrus fruit The optimum range of exposure times with
minimum water loss while maintaining the readability of labels was 45-55µs in citrus fruit
whereas 35-45µs in tomato and pepper fruit. Additionally, the extent of laser label shrinkage
was higher in tomato and pepper as compared to citrus. All these differences are mainly
attributed to the peel morphology of the above selected crops. As depicted the thin skinned fruits
such as tomato and pepper suffer substantial amount of water loss at etched areas than the thick
peeled citrus fruit, as the thickness of the cuticle is directly related to the protection against
undesirable moisture loss, but this loss can be greatly diminished by applying wax coatings on
the label. Taking into account all these above mentioned results, this study suggests that laser
labeling could be a viable alternative to the current labeling system; provide individual
traceability without enhancing safety concerns. It was demonstrated that the fruit quality of the
laser labeled fruit remains high as the invasion of epidermis does not promote decay, provide
avenue for pathogens and water loss is easily controlled.

73
LIST OF REFERENCES
Arpaia, M.L. and Kader, A.A., 2006. Recommendations for maintaining postharvest quality. http://postharvest.ucdavis.edu/Produce/ProduceFacts/Fruit/mandarin.shtml.
Bartz, J.A. and Brecht, J.K., 2002. Postharvest physiology and pathology of vegetables. Marcel Dekker, New York.
Baudoin, A. and Eckert, J.W., 1985. Development of Resistance against Geotrichum-Candidum in Lemon Peel Injuries. Phytopathology 75:174-179.
Biale, J.B. and Young, R.E. 1981. Respiration and ripening in fruits: retrospect and prospect., London.
Blakeman, J.P. 1985. Ecological succession of leaf surface microorganisms in relation to biological control.
Bollen, A.K., Riden, C.P., and Opara, L.U., 2006. Traceability in postharvest quality management. International Journal of Postharvest Technology and Innovation. 1:93-105.
Brown, G.E., 1973. Development of Green Mold in Degreened Oranges. Phytopathology 63:1104-1107.
Brown, G.E., Ismail, M.A., and Barmore, C.R., 1979. Lignification of injuries to citrus fruit and susceptibility to green mold, p. 124-126, Proc. Fla. State Hort. Soc.
Burg, S.P. and Burg, E.A., 1965. Gas Exchange in Fruits. Physiol. Plant. 18:870
Cao, G.H., Sofic, E., and Prior, R.L., 1996. Antioxidant capacity of tea and common vegetables. J. Agric. Food Chem. 44:3426-3431.
Centers for Disease Control and Prevention.2006. Preliminary FoodNet data on the incidence of infection with pathogens transmitted commonly through food: 10 sites, United States, 2005. MMWR Morbid. Mortal. Wkly. Rpt. 55:392-395.
Center for Food Safety and Applied Nutrition.1998. Guide to minimize microbial food safety hazards for fresh fruits and vegetables. IX. Traceback. Guidance for food industry. U.S. Dept. Health and Human Serv., Food and Drug Administration. Oct.1998. Washington, D.C.
Chakraverty, A., Mujumdar, A.S., Raghaven, G.V.S., and Ramaswamy, H.S., 2003. Handbook of Postharvest Technology: Cereals, Fruits, Vegetables, Tea, and Spices CRC Press.
Chapagain, B.P. and Wiesman, Z., 2004. Effect of potassium magnesium chloride in the fertigation solution as partial source of potassium on growth, yield and quality of greenhouse tomato. Sci. Hortic. 99:279-288.
74
Cohen, J.H., Kristal, A.R., and Stanford, J.L., 2000. Fruit and vegetable intakes and prostate cancer risk. J. Natl. Cancer Inst. 92:61-68.
Delong, M.J., Prochaska, H.J., and Talalay, P., 1986. Induction of NAD (P) H-quinone reductase in murine hepatoma-cells by phenolic antioxidants, azo dyes, and other chemoprotectors-a model system for the study of anticarcinogens. Proc. Natl. Acad. Sci. U. S. A. 83:787-791.
Drouillard, G. and Rowland, R.W., 1997. Method of laser marking of produce. In: U.S.Department of Commerce, P. a. T. O., Washington, D.C. (ed.).
Eckert, J.W. and Brown, G.E., 1986. Postharvest citrus diseases and their control, p. 315-360. In: Wardowski, W. F., Nagy, S., and Grierson, W. (eds.), Fresh citrus fruits. AVI Publishing, Westport, CT, USA.
Etxeberria, E., Miller, W.M., and Achor, D., 2006. Anatomical and morphological characteristics of laser labeling depressions for fruit labeling. Horttechnology 16:527-532.
Forbes, J.C. and Watson, R.D., 1992. , p. 293. In: Forbes, J. C. and Watson, R. D. (eds.), Plants in agriculture. Cambridge University Press, Cambridge.
Florida Citrus Mutual. 2008. Annual statistical report for 2006-2007 Florida citrus harvesting season. http://www.flcitrusmutual.com/files/8d69285e-786f-4769-8.pdf.
Giovannoni, J.J., 2004. Genetic regulation of fruit development and ripening. Plant Cell 16:S170-S180.
Grierson, W., 1974. V.Chilling injury in tropical and subtropical fruit. Effect of harvest date, degreening, delay storage and peel color on chilling injury of grapefruit, p. 66-73, . Proc. Trop. Reg. Amer. Soc. Hort. Sci. .
Hagenmaier, R.D. and Shaw, P.E., 1991. Permeability of Shellac Coatings to Gases and Water-Vapor. J. Agric. Food Chem. 39:825-829.
Hecht, J., 1994. Understanding lasers. IEEE Press, New York.
Horrocks, R.L., 1964. Wax + Water Vapour Permeability of Apple Cuticle. Nature 203:547-&.
Kader, A.A., 2002. Postharvest biology and technology :overview, p. 39-48. In: Kader, A. A. (ed.), Postharvest Technology of Horticultural Crops. Regents of the University of California, Division of Agricultural and Natural Resources, Oakland, CA.
Kays, S.J., 1991. Postharvest physiology and handling of perishable plant products. Van Nostrand Reinhold Inc. New York.
Kays, S.J. and Paull, R.E., 2004. Postharvest Biology. Exon Press, Athens, GA.

75
Kidd, F. and West, C. 1925. The course of respiratory activity throughout the life of an apples. Great Britain department of science and Industry research, Food Investigation Board, London.
Kinay, P., Yildiz, F., Sen, F., Yildiz, M., and Karacali, I., 2005. Integration of pre- and postharvest treatments to minimize Penicillium decay of Satsuma mandarins. Postharvest Biol. Technol. 37:31-36.
Kinay, P., Yildiz, M., Yildiz, Y., Delen, N., and Tosun, N., 2001. Control of postharvest pencillium decay of citrus fruits with antagonistic yeast and chemical fungicides, p. 383-385. In: Arie, R. B. and Hadas, S. P. (eds.), Proc. 4th Int. Conference on Postharvest.
Knee, M., 2002. Fruit Quality and Its Biological Basis. Blackwell Publishing, UK.
Knee, M., Sargent, J.A., and Osborne, D.J., 1977. Cell-Wall Metabolism in Developing Strawberry Fruits. J. Exp. Bot. 28:377-396.
Lam, L.K.T., Li, Y., and Hasegawa, S., 1989. Effects of citrus limonoids on glutathione s-transferase activity in mice. J. Agric. Food Chem. 37:878-880.
Larson, R.A., 1988. The antioxidants of higher plants. Phytochemistry 27:969-978.
Mead, P.S., Slutsker, L., Dietz, V., McCaig, L.F., Bresee, J.S., Shapiro, C., Griffin, P.M., and Tauxe, R.V., 1999. Food-related illness and death in the UnitedStates. Emerg.Infect.Dis. 5:607-625.
Miller, E.G., Fanous, R., Riverahidalgo, F., Binnie, W.H., Hasegawa, S., and Lam, L.K.T., 1989. The effects of citrus limonoids on hamster buccal pouch carcinogenesis. Carcinogenesis 10:1535-1537.
Newhall, W.F. and Grierson, W., 1955. A low-cost self-polishing, fungicidal water wax for citrus fruit. Amer. Soc. Hort. Sci. Proc. 66:146-154.
Nuñes, M.C., 2007. Quality of fruits and vegetables. . Wiley-Blackwell Publishers, Indianapolis, Ind.
Pittenger, D.R., 2002. p. 5-28, California master garderner handbook. University of California, Agri and natural resources, Publication.
Produce Electronic Identification Board. 1995. Guide to coding fresh produce. PEIB, Newark, Del.
Radha, T. and Mathew, L., 2007. Fruit Crops. New Delhi Publishing Agency, New Delhi.
Rahman, M.S., 2007. Handbook of Food Preservation. Marcel Dekker Inc., New York.
Riederer, M. and Schreiber, L., 2001. Protecting against water loss: analysis of the barrier properties of plant cuticles. J. Exp. Bot. 52:2023-2032.

76
Robertson, G.L., 2005. Food Packaging. Marcel Dekker,New York.
Salunkhe, D.K. and Kadam, S.S., 1995. Handbook of Fruit Science and Technology: Production, Composition, Storage and Processing. Marcel Dekker, New York.
Sood, P., Ference, C., Narciso, J., and Etxeberria, E., 2008. Effect of laser labeling on the quality of tangerines during storage. , Proc. Fla. State Hort. Soc. .
Spurr, H.W., Jr., 1994. The microbial ecology of fruit and vegetable surfaces: Its relationship to postharvest biocontrol, p. 11-23, Biological control of postharvest diseases: Theory and practice. CRC Press, Inc.; CRC Press.
Stange, R.R., Jr. and Eckert, J.W., 1994. Influence of postharvest handling and surfactants on control of green mold of lemons by curing. Phytopathology 84:612-616.
Sudheer, K.P. and Indira, V., 2007. Postharvest technology of horticultural crops. New India Publishing Agency, New Delhi.
Thopmson, J.F., Mitchell, F.G., Rumsey, T.M., Kasmire, R.F., and Crisosto, C.H., 1998. The Commodity, p. 1-7, Commercial cooling of fruits, vegetables, and flowers. ANR Publications, University of California.
Varon, M.A. and Paddock, P.F., 1978. Apparatus for applying a label to an object. Patent no. 4,123,310. U.S Department of Commerce, Patent and Trademark Office, Washington, D.C.
Vegetables, 2000 summary. U.S Department of Agriculture. National Agricultural Statistics Service (NASS).
Verma, L.R. and Joshi, V.K., 2000. Postharvest technology of fruits and vegetables. Indus Publicating Co., New Delhi.
Walter, W.M., Randallschadel, B., and Schadel, W.E., 1990. Wound-Healing in Cucumber Fruit. J. Am. Soc. Hortic. Sci. 115:444-452.
Willis, R., McGlasson, B., Graham, D., and Joyce, D., 1998. Introduction, p. 1-14, Postharvest: An Introduction to the Physiology and Handling of Fruit, Vegetables and Ornamentals. UNSW Press Ltd., Sydney, Australia.
Yehoshua, B. and Rodov, V., 2002. Transpiration and water stress. In: Bartz, J. A. and Brecht, J. K. (eds.), Postharvest physiology and pathology of vegetables. Marcel-Dekker, New York.
Yuk, H.G., Warren, B.R., and Schneider, K.R., 2007. Infiltration and survival of Salmonella spp. on tomato surfaces labeled using a low-energy carbon dioxide laser device. HortTechnology 17:67-71.
Zhang, Y.H., Kramer, T.R., Taylor, P.R., and Li, J.Y., 1995. Possible immunological involvement of antoxidants in cancer prevention. American Journal of Clinical Nutrition. 62:1477-1482

77
BIOGRAPHICAL SKETCH
Preeti Sood was born in India. She obtained her Bachelor of Science in agriculture from
Punjab Agricultural University, Ludhiana, India in 2006. In May 2007, she started her master’s
program in horticulture at the University of Florida and successfully completed her degree in
2009.


![Pay Scales Er SK Sood[1]](https://img.pdfslide.us/doc/110x75/5469cc6aaf7959637e8b4b2e/pay-scales-er-sk-sood1.jpg)