Embed Size (px)
Citation preview
Computer Graphics, Vision and Mathematics
in co-operation with
EUROGRAPHICS
GraVisMa 2009
Abstract Proceedings
University of West Bohemia Plzen
Czech Republic
September 2-5, 2009
Co-Chairs Dietmar Hildenbrand, University of Darmstadt, Germany
Vaclav Skala, University of West Bohemia, Czech Republic
Edited by Dietmar Hildenbrand
Vaclav Skala
GraVisMa 2009 Proceedings Editor-in-Chief: prof.Ing.Vaclav Skala, CSc.
c/o University of West Bohemia, Univerzitni 8, Box 314 CZ 306 14 Plzen Czech Republic [email protected]
Managing Editor: Vaclav Skala Author Service Department & Distribution:
Vaclav Skala - UNION Agency Na Mazinách 9 CZ 322 00 Plzen Czech Republic
Printed: University of West Bohemia, Plzeň, Czech Republic Hardcopy: ISBN 978-80-86943-92-3
CONTENTS
PAGE 9:00 - 10:40 Session A Chair: Joan Lasenby
• Deul.C, Burger.M, Hildenbrand.D., Koch.A: Raytracing Point Clouds using Geometric Algebra A83
1
• Hasegawa,M.: A Study of 3-D Surface Registration Using Distance Map and 3-D Radon Transform B89
2
• Sabov,A., Krüger,J.: Virtual Reconstruction of 3D Scenes Based on Range Cameras A29
3
• Wörsdörfer,F., Stock,F., Bayro-Corrochano,E., Hildenbrand,D.: Using Geometric Algebra for Algorithms Calculating Convex Hull and Object Representation in 3D B07
4
• Dorst,L.: Conformal Geometric Algebra by Extended Vahlen Matrices B37 5
• Tachibana,K.: Motion Tracking with Geometric Algebra-valued Particle Filter B97 6
13:00 - 14:40 Session C Chair: Leo Dorst
• Cui,Y., Hildenbrand,D.: Pose Estimation Based on Geometric Algebra A59 7
• Lee,S.W., Nestler,A.: Spherical Offset B43 8
• Candy,L., Lasenby,J.: Inertial Navigation using Geometric Algebra B83 9
• Skala,V.: Duality and Computation in Projective Space B02 10
• Seeman,M., Zemcik,P.: Histogram Smoothing for Bilateral Filter C29 11
15:00 - 16:40 Session D - Communications Chair: Libor Vasa • Warszawski,K., Nikiel,S., Filipczuk,P.: Particle Systems for Riverbed Modeling
over Multilayer Height-field Data with Hardness B23 12
• Zemcik,P., Hanak,I.: Numerical Method for Accelerated Point Light Source Optical Field Calculation C05
13
• Drahoš,P.: Reusable Performance Driven Facial Animation System C07 14 • Lacko,J., Maričák,M.: Context Based Controlled Virtual Tours using Viewpoint
Entropy for Virtual Environments C17 15
• Bocek,J., Kolcun, A.: Shading of Bézier Patches B79 16
• Torrens,F., Castellano,G.: Macromolecular Structure Interrogation New Tool A47 17
• Sasipalli,V.S.R.: POSTER: Forecasting Strategy Changes in Organizations B17 44
9:00 - 10:40 Session E Chair: Dietmar Hildenbrand • Schwinn,C., Görlitz,A., Hildenbrand,D.: Geometric Algebra Computing on the
CUDA Platform A67 18
• Kooijman,A., Vergeest,J.: A GPU Supported Approach to the Partial Registration of 3D Scan Data A79
19
• Fassold,H., Rosner,J., Schallauer,P., Bailer,W.: Realtime KLT Feature Point Tracking for High Definition Video A89
20
• Urban,J., Vaněk,J.: Preprocessing of Microscopy Images via Shannon's Entropy A97
21
• Kurasova,O., Molyte,A.: Integrated Visualization of Vector Quantization by Multidimensional Scaling A53
22
• Amjoun,R., Strasser,W.: Adaptive Segmentation of Deforming Mesh Sequence into Near-Rigid Clusters C02
23
11:00 - 12:00 Session F - Keynote Chair: Anthony Lasenby • Benger,W., Hamilton,A., Folk,M., Koziol,Q., Su,S., Schnetter,E., Ritter,M.,
Ritter,G.: Using Geometric Algebra for Navigation in Riemannian and Hard Disc Space B73
24
13:00 - 14:40 Session G - Communications Chair: Alexej Kolcun
• Malpica,J.A., Alonso,M.C.: Goodness-of-fit Tests for Brightness Distribution in Grey Level Images B13
25
• Protopsaltou,A., Fudos,I.: Creating Editable 3D CAD Models from Point Cloud Slices B19
26
• Mashtalir,S., Putyatin,E.: Image Normalization under Projective Transforms B47 27 • Medvedev,V., Dzemyda,G.: Neural Network-Based Large Datasets Visualization
Using a Reduced Training Subset B53 28
• Anton,F., Aaneas,H., Kahl F.: The Three Point Perspective Pose Estimation Problem Revisited with Invariants Obtained from Polynomial Triangulation and Interval Analysis C03
42
• Treigys,P., Dzemyda,G., Veikutis,V.: POSTER: Investigation of Thermal Anisotropy from Thermovisual Video Data B59
45
15:00 - 16:00 Session H - Keynote Chair: Werner Benger
• Hitzer,E.: Fourier and Wavelet Transformations in Geometric Algebra C31 29
9:00 - 10:40 Session K Chair: Pavel Zemcik
• Hildenbrand,D.: Geometric Algebra Computers A31 30 • Dorst,L.: Determining an Even Versor in n-D Geometric Algebra from the Known
Transformation of n Vectors B31 31
• Simpson,L., Mullineux,G.: Exponentials and Motions in Geometric Algebra A37 32 • Cibura,C., Dorst,L.: From Exact Correspondence Data to Conformal
Transformations in Closed Form Using Vahlen Matrices B29 33
• Fleischmann,O., Wietzke,L., Sommer,G.: A Monogenic Signal on the Two-Sphere with Applications in Omnidirectional Vision B05
34
11:00 - 12:00 Session L - Keynote Chair: Dietmar Hildenbrand • Lasenby,A., Doran,C., Lasenby,R.: Rigid Body Motion and Conformal Geometric
Algebra C19 35
13:00 - 14:40 Session M - Communications Chair: Eckhard M.S.Hitzer
• Zemcik,P., Pribyl,B.: Precise Image Resampling Algorithm C13 36 • Marcinkevicius,V., Medvedev,V.: Mining and Visualizing Web Logs for the
Analysis of Users' Behavior B41 37
• Margenstern,M.: About Contour Words of Balls in Tessellations of the Hyperbolic Plane C47
38
• Carpentieri,B.: Hyperpectral Images: Compression and Visualization A73 39
• Kapec,P.: Hypergraph-based Software Visualization C11 40 • Tytkowski,K.T.: The BPT Algorithm (Brianchon - Point - Triangle) - Detecting
Conical Curves in Raster Graphics B03 41
Raytracing Point Clouds using Geometric AlgebraCrispin Deul1 Michael Burger1 Dietmar Hildenbrand1 Andreas Koch2
1Interactive Graphics Systems GroupComputer Science Department
TU Darmstadt, [email protected]
2Embedded Systems and ApplicationsComputer Science Department
TU Darmstadt, [email protected]
ABSTRACT
Geometric Algebra (GA) supports the geometrically intuitive development of an algorithm with its build-in geometric primitivessuch as points, lines, spheres or planes, but on the negative side GA has a huge computational footprint. In this paper we studyhow GA can compete with traditional methods from Linear Algebra (LA) in the field of raytracing. We examine the raytracingalgorithm for both GA and LA on the basis of primitive operations. Furthermore we benchmark implementations of bothalgebras with a framework for rendering point clouds based on GA. Our results show that depending on the microprocessorarchitecture like CPUs, FPGAs or GPUs Geometric Algebra and Linear Algebra can raytrace with comparable speed.
Keywords: FPGA, Geometric Algebra, GPGPU, Point Cloud, Raytracing.
1 EXTENDED ABSTRACTIn this paper we compare the speed of the raytracingalgorithm in Conformal Geometric Algebra (CGA) andLinear Algebra (LA). We use two approaches to get ananswer whether raytracing with CGA can compete withLA. First the computations in CGA and LA are ana-lyzed on the level of primitive operations with scalarslike multiplications and additions. Important parts ofthe rendering are the intersection of the viewing raywith the objects of the scene, the calculation of the sur-face normal at the intersection point and reflections,which are needed for lighting and shadow computa-tions. Furthermore we analyze how to parallelize thecomputations to achieve a speed-up on parallel hard-ware architectures. Raytracing in CGA on CPUs hasalready been investigated [1]. There are two startingpoints for our investigations. The first one is the prop-erty of the raytracing algorithms to compute the colourof each pixel independently from all the other ones inthe actual frame. The second one is that objects in CGAconsist of multivectors with 32 entries which can becomputed independent of each other.
Using Gaalop [3] we found two possibilities of opti-mizing the calculations listed above. On the one hand,the number of operations is minimized and costly oper-ations, such as square roots or divisions, are avoidedwhenever possible. On the other hand, we aim todecompose complex computations into simpler stepsthat can be executed in parallel or serially. Paral-lel calculations can be processed efficiently on SIMD-architectures like GPUs or appropriately configured FP-GAs. An efficient implementation of serial steps is pos-sible through using a pipeline architecture on a FPGA.
Beyond our work on the point cloud model wepresent a novel framework to raytrace point cloudsusing Conformal Geometric Algebra (CGA). Thesurface represented by a point cloud is locally approxi-
mated by splats consisting of a fitting and a boundingobject. To compute the fitting object we fit planes orspheres into the k-neighbourhood of a chosen fittingpoint. Prior work uses a sphere fit into a point cloudto approximate the surface of the cloud. But insteadof using the sphere only in an intermediate step [2] weuse the sphere directly to represent the surface. Usingthe k +1 points of the neighbourhood we have to solvethe eigenvector problem of a 5× 5 matrix. Takingthe eigenvector corresponding to the smallest positiveeigenvalue we get the coefficients of our fitting object.The advantage of this approach compared to linearalgebra is that, during the algorithm, we do not haveto consider whether the outcome of the fitting processwill be a sphere or a plane (all information is kept inthe resulting eigenvector).
We use the framework to benchmark CGA and LAimplementations on different hardware architectureslike the CPU and GPU to prove our theoratical con-siderations on the primitive operations in a real worldexample.
Our Results show that although CGA needs moreprimitive operations than LA in general, CGA and LAcan be comparable in speed depending on the micro-processor architecture. This is due to the parallel natureof the CGA multivector computations.
REFERENCES[1] L. Dorst, D. Fontijne, and S. Mann. Geometric Algebra for Com-
puter Science, An Object-Oriented Approach to Geometry. Mor-gan Kaufman, 2007.
[2] Gaël Guennebaud and Markus Gross. Algebraic point set sur-faces. In In Proceedings SIGGRAPH ’07, 2007.
[3] D. Hildenbrand and Joachim Pitt. The Gaalop home page.HTML document http://www.gaalop.de, 2008.
1 GraVisMa 2009
A Study of 3-D Surface Registration Using
Distance Map and 3-D Radon Transform
Makoto Hasegawa
Faculty of Engineering, Kinki University 1 Takayaumenobe, Higashihiroshima, Hiroshima, 739-2116 Japan
ABSTRACT A three-dimensional surface model registration method using distance map and three-dimensional Radon
transform is proposed. Phase-only matched filter can be applied into our three-dimensional surface model
registration just like conventional two-dimensional image registration. Our registration procedure is described
and executes simulations.
Keywords Surface registration, distance field map, Radon transform, R-transform, phase-only matched filter.
1. INTRODUCTION Three-dimensional surface model registration is an
important and fundamental topic in computer
graphics. Registration of two surface models means
matching between a template surface model and a
target surface model described many polygons and
vertices. Various methods are proposed. Chen and
Medioni propose the iterative closest point method,
which displace the surface model by the minimizing
the difference of the corresponded vertices [Che 91a].
We discuss a new method using distance map, and
three-dimensional Radon transform. Phase-only
matched filter can be applied into our three-
dimensional surface model registration just like
conventional two-dimensional image registration.
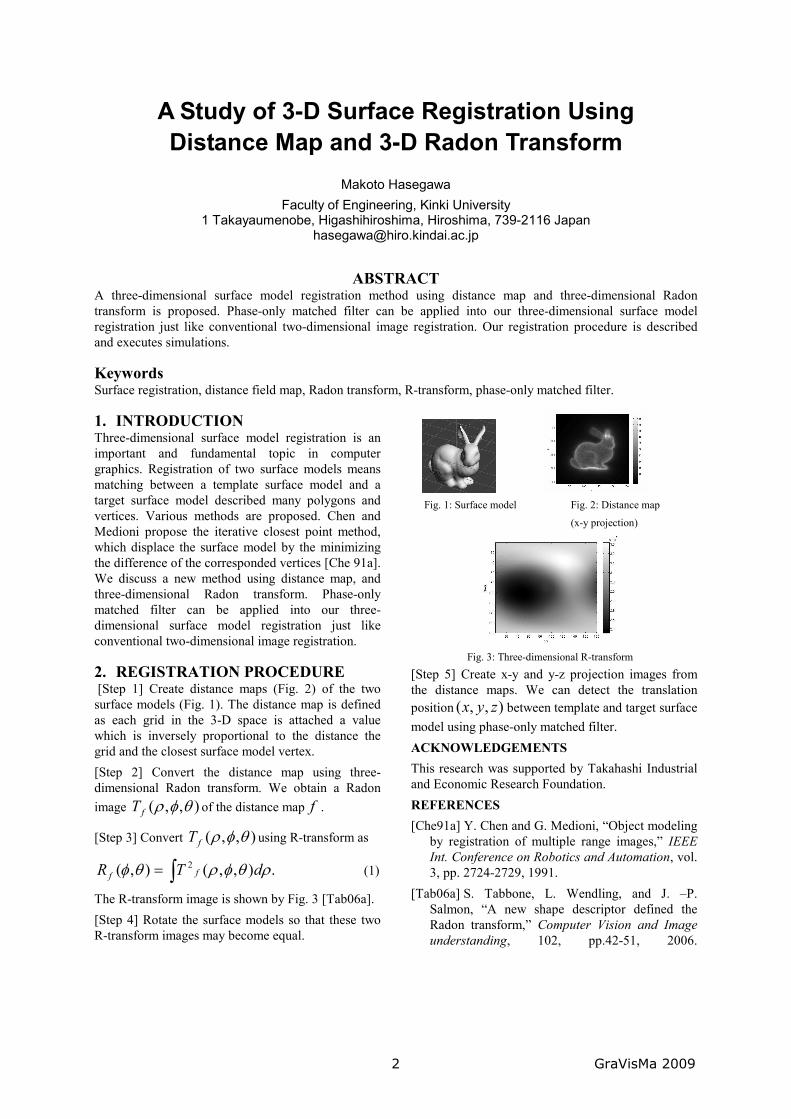
2. REGISTRATION PROCEDURE [Step 1] Create distance maps (Fig. 2) of the two
surface models (Fig. 1). The distance map is defined
as each grid in the 3-D space is attached a value
which is inversely proportional to the distance the
grid and the closest surface model vertex.
[Step 2] Convert the distance map using three-
dimensional Radon transform. We obtain a Radon
image ),,( θφρfT of the distance map f .
[Step 3] Convert ),,( θφρfT using R-transform as
.),,(),( 2∫= ρθφρθφ dTR ff (1)
The R-transform image is shown by Fig. 3 [Tab06a].
[Step 4] Rotate the surface models so that these two
R-transform images may become equal.
[Step 5] Create x-y and y-z projection images from
the distance maps. We can detect the translation
position ),,( zyx between template and target surface
model using phase-only matched filter.
ACKNOWLEDGEMENTS
This research was supported by Takahashi Industrial
and Economic Research Foundation.
REFERENCES
[Che91a] Y. Chen and G. Medioni, “Object modeling
by registration of multiple range images,” IEEE
Int. Conference on Robotics and Automation, vol.
3, pp. 2724-2729, 1991.
[Tab06a] S. Tabbone, L. Wendling, and J. –P.
Salmon, “A new shape descriptor defined the
Radon transform,” Computer Vision and Image
understanding, 102, pp.42-51, 2006.
Fig. 1: Surface model Fig. 2: Distance map
(x-y projection)
Fig. 3: Three-dimensional R-transform
2 GraVisMa 2009
Virtual Reconstruction of 3D Scenes Based
on Range Cameras
Alexander Sabov
Fraunhofer IPK Pascalstrasse 8-9
10587 Berlin, Germany
Jörg Krüger
Fraunhofer IPK Pascalstrasse 8-9
10587 Berlin, Germany
Keywords Virtual reconstruction, range imaging, image registration, time-of-flight
EXTENDED ABSTRACT
1. INTRODUCTION Virtual reconstruction of existing objects and
environments is needed in many different areas such
as the planning of building extensions, quality
assurance for production processes and city
reconstructions for geographic information systems.
Different scanner systems have been established
which meet the demands on the application. For
applications such as computer aided facility
management a short scanning time is the most
important factor instead of high precision. Range
cameras are a new generation of 3D scanners which
can measure distances to their environment directly
with a high frame rate. In this paper a reconstruction
method is presented which is specific to range camera
data.
2. RECONSTRUCTION Features are identified in the intensity images of the
camera with the Sobel edge detector [Xia08a]. 3D
coordinates of corresponding surface elements
(surfels) are calculated from the depth map. The
feature tracking and registration is based on the
iterative closest point method [Rus01a]. The nearest
neighbour surfel between two frames is the first
assumption for the new surfel position. An iterative
process calculates the corresponding transformation
matrix and determines the new neighbours for the
transformed data. During the registration, a feature
map and a surfel map are continuously constructed
and updated. For performance improvement, a
registration between two frames is done first and
provides an initial position to register the features and
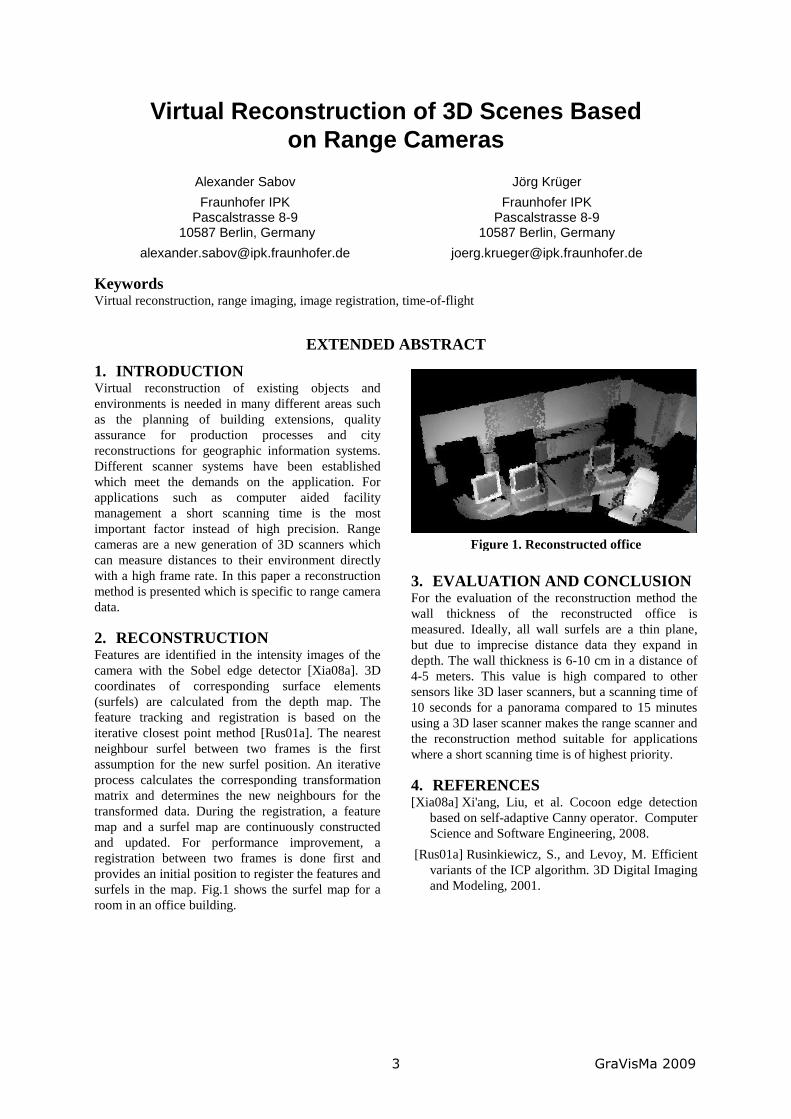
surfels in the map. Fig.1 shows the surfel map for a
room in an office building.
3. EVALUATION AND CONCLUSION For the evaluation of the reconstruction method the
wall thickness of the reconstructed office is
measured. Ideally, all wall surfels are a thin plane,
but due to imprecise distance data they expand in
depth. The wall thickness is 6-10 cm in a distance of
4-5 meters. This value is high compared to other
sensors like 3D laser scanners, but a scanning time of
10 seconds for a panorama compared to 15 minutes
using a 3D laser scanner makes the range scanner and
the reconstruction method suitable for applications
where a short scanning time is of highest priority.
4. REFERENCES [Xia08a] Xi'ang, Liu, et al. Cocoon edge detection
based on self-adaptive Canny operator. Computer
Science and Software Engineering, 2008.
[Rus01a] Rusinkiewicz, S., and Levoy, M. Efficient
variants of the ICP algorithm. 3D Digital Imaging
and Modeling, 2001.
Figure 1. Reconstructed office
3 GraVisMa 2009
Using Geometric Algebra for Algorithms CalculatingConvex Hull and Object Representation in 3D
Florian WörsdörferTU Darmstadt
(Germany), ComputerScience Department
DietmarHildenbrandTU Darmstadt
(Germany), ComputerScience Department
EduardoBayro-Corrochano
CINVESTAVGuadalajara (Mexico)[email protected]
Andreas KochTU Darmstadt
(Germany), ComputerScience Department
ABSTRACT
In this paper we present the use of geometric algebra for computations of the complex hull and the object representation ofunstructured points in 3D. We especially examine the performance of different implementations and the advantages of symbolicoptimizations by Gaalop for modern parallel platforms using GPGPU. The first algorithm described here calculates the convexhull of a set of unstructured points. The second one calculates its alpha shape using Delaunay triangulation. Because oftheir very geometric nature both algorithms take advantage of a description in geometric algebra. Not only are they easier tounderstand this way but also they can be optimized for the use with parallel platforms automatically.
Keywords: Geometric Algebra, Convex Hull, Object Representation, CUDA.
1 EXTENDED ABSTRACT
The problem of reconstructing the three-dimensionalshape of an object has been discussed using a varietyof different approaches and heuristics. Our goal is toshow the benefits this topic can gain from using con-formal geometric algebra . Therefor we use a combina-tion of well known techniques to compute the desiredresults and concentrate our work on using conformalgeometric algebra where it is appropriate. We exam-ine the advantages of geometric algebra over the morecommon vector algebra or linear algebra. One of theseadvantages is the ability to formulate our algorithms ina crisp and elegant way because most of our operationsrequire manipulations of basic geometric entities repre-sented by simple algebraic objects. Another advantageis the ability to generate high efficient source code forparallel platforms using the software Gaalop [4] and itscapability of performing symbolic optimizations.
The first algorithm described here computes the con-vex hull from a set of unstructured points and consistsof three parts. First redundant points are eliminated bydividing the xy plane into a regular grid and discardingunnecessary points while walking that grid. Then theremaining points are clustered using the k-means++ al-gorithm [1] and finally the complex hull is generatedfrom these clusters by the quickhull algorithm [2].
The second algorithm computes the object represen-tation from a set of unstructured points by performingtwo different steps. First the Delaunay triangulation [6]of the points is computed. We start with an initial tetra-hedron and incrementally add new points by buildingmore tetrahedrons. Each one of them is checked for theempty sphere criterion. If this criterion is violated thecorresponding tetrahedrons are changed by doing either
a triangle flip or an edge flip. Then in the second stepfrom that Delaunay triangulation the alpha shape [3] iscalculated as the final object representation.
After developing the above algorithms in the frame-work of conformal geometric algebra using CLUCalc[7] as an rapid prototyping tool we perform symbolicoptimizations with Gaalop to generate efficient C codeautomatically. From this C sources a CUDA implemen-tation is derived. Additionally we will give a C imple-mentation of the algorithms using standard vector alge-bra. Also we will refer to Gaigen 2 implementationsgiven in [5]. These different implementations are com-pared with respect to the achievable improvements inperformance.
REFERENCES[1] David Arthur and Sergei Vassilvitskii. k-means++: the advan-
tages of careful seeding. In SODA ’07: Proceedings of the eigh-teenth annual ACM-SIAM symposium on Discrete algorithms,pages 1027–1035, Philadelphia, PA, USA, 2007. Society for In-dustrial and Applied Mathematics.
[2] C. Bradford Barber, David P. Dobkin, and Hannu Huhdanpaa.The quickhull algorithm for convex hulls. ACM Transactions onMathematical Software, 22:469–483, 1995.
[3] Herbert Edelsbrunner and Ernst P. Mücke. Three-dimensional al-pha shapes. ACM Transactions on Graphics, 13(1):43–72, 1994.
[4] D. Hildenbrand and Joachim Pitt. The Gaalop home page.HTML document http://www.gaalop.de, 2008.
[5] L. Dorst and D. Fontijne and S. Mann. Geometric Algebra forComputer Science, An Object-Oriented Approach to Geometry.Morgan Kaufman, 2007.
[6] E. P. Mücke. A robust implementation for three-dimensionaldelaunay triangulations. In Proceedings of the 1st Interna-tional Computational Geometry Software Workshop, pages 70–73, 1995. To appear in the International Journal of Computa-tional Geometry & Applications.
[7] C. Perwass. The CLU home page. HTML documenthttp://www.clucalc.info, 2009.
4 GraVisMa 2009
Conformal Geometric Algebra by Extended Vahlen MatricesLeo Dorst
University of Amsterdam, The Netherlands, [email protected]
ABSTRACT
The conformal transformations in Rn (those that pre-serve angles) can be modeled conveniently as orthogo-nal transformations of the Minkowski space Rn+1,1 [1],and these in turn are representable as versors in geo-metric algebra (i.e., as geometric products of invertiblevectors) [3]. Using anti-symmetric combinations of ge-ometric products, an outer product can be introducedas the foundation for the Grassmann algebra of Rn+1,1.The outer product of (not necessarily invertible) vectorsspans subspaces of Rn+1,1; these ‘blades’ can be iden-tified with circles, spheres, planes and tangents (andmore) in the space Rn. The versors act on them in astructure-preserving manner.
Thus we get universal conformal operators, simpli-fying software, and as a consequence this conformalmodel (a.k.a. CGA, conformal geometric algebra [4])is beginning to be useful in computer science fields likegraphics, vision and robotics. In such fields, the maininterest is often in Euclidean similarities or rigid bodymotions, rather than the general conformal mappings ofwhich they are a special case.
On the other hand, conformal transformations havebeen studied in mathematics using Vahlen matrices, asa homogeneous representation of Möbius transforma-tions. Though originally defined for the complex plane,the Vahlen matrices have been extended to allow coeffi-cients from a Clifford algebra to permit the study of thegroup of n-dimensional conformal transformations [5].
In this paper, the two ideas meet, to lay the founda-tion for a fruitful interaction. To embed the full con-formal model we need to define the matrices that repre-sent the blades in geometric algebra – this gives us anextension of the matrix representation from represent-ing only transformations to being interpretable as geo-metric primitives. This is done by translating the outerproduct and contraction product constructions of suchgeometrical elements into matrix operations, throughthe intermediate step of writing them as linear combina-tions of geometric products. Moreover, the vector dif-ferentiation operation can be cast as an operator matrix.We provide a useful dictionary for this translation be-tween the elements of the conformal model and theirmatrix representation.
Using the dictionary, we show some examples of howthe two representations can interact to study propertiesof conformal transformations, with some emphasis onEuclidean similarities and motions.
• We derive Chasles’ theorem in a compact manner:first we focus on the general motion that preservesthe point at infinity; using the explicit representationof a line in matrix form from the dictionary, we de-termine its eigenlines. We then factor the originalmotion quantitatively in two terms, preserving theeigenline point-wise (a rotation around the line) andas a set (a translation along the line).
• We use Chasles’ theorem to give a closed form prin-cipal logarithm of a Euclidean motion, in its Vahlenmatrix representation, using the commutation prop-erties of the above factorization.
• We compute a table of commutation laws betweenthe four fundamental conformal motions: transla-tion, rotation, uniform scaling and transversion andtheir associated parameter changes. Especially thecommutation between translation and transversion isof interest (and may even be new).
• Using the basics presented here, we have been ableto give a closed-form solution to the determinationof a conformal transformation, based on exact trans-formation data of points and frames go [2].
We are beginning to find these new tools indispensablein solving such advanced problems. Although they arein principle fully equivalent to writing things out alge-braically, computations are more automatic in the ma-trix structure – which takes care of the additional eo, e∞
and eo ∧ e∞ bookkeeping at the heart of the conformalmodel, and leaves only straightforward n-dimensionalEuclidean geometric algebra computations.
Keywords: conformal transformations, rigid body mo-tions, geometric algebra, Vahlen matrix, Chasles’ theo-rem, logarithm, commutation, transversion.
REFERENCES[1] P. Anglès, Conformal Groups in Geometry and Spin
Structures, PMP 50, Birkhäuser, 2008.[2] C. Cibura, L. Dorst, From Exact Correspondence Data
to Conformal Transformations in Closed Form UsingVahlen Matrices, GRAVISMA 2009.
[3] L. Dorst, D. Fontijne, S. Mann, Geometric Algebra forComputer Science, Morgan Kaufmann, 2007.
[4] D. Hestenes, A. Rockwood, H. Li, U.S. Patent6,853,964, granted February 8, 2005
[5] P. Lounesto, Clifford Algebras and Spinors, LMSLNS286, Cambridge University Press, 2001.
5 GraVisMa 2009
Motion Tracking with Geometric Algebra-valued Particle Filter
Kanta Tachibana
Faculty of Informatics, Kogakuin University
1-24-2 Nishi-Shinjuku, 163-8677, Shinjuku-ku, Tokyo
ABSTRACT Choice of latent variables and likelihood function are important for three-dimensional time-series tracking. I propose motion tracking with high order geometric algebra-valued particle filter. The proposed method shows significant improvement compared to tracking with conventional Euler angles.
Keywords Geometric Algebra, Motion Tracking, Computer Vision
1. INTRODUCTION Inference of three-dimensional motion is an important task for computer vision. In this study, I discuss inference of rigid body motion when some feature points are observed by a monocular camera. I assume that feature points are observed at every timestep without occlusion but with measurement noise. For this task, I utilize particle filter (PF), a sequential Bayesian method. For PF to be applied to geometric problems, it is important to use appropriate latent variables. Some studies [e.g. Mar01] utilize quaternion instead of conventional Euler angels as latent variables for time-series three-dimensional inference. However, quaternion’s effect has not been clarified quantitatively yet. I furthermore introduce a new resampling step, in which hypotheses are evaluated, for particle filter. In the new resampling step, likelihood of hypothesis is calculated using not only single points but also circles each of which is a combination of three points. The aim of this study is to clarify effects of 1) representations of rotation with rotor components to such geometric inference and of 2) introducing high-order entities to resampling step.
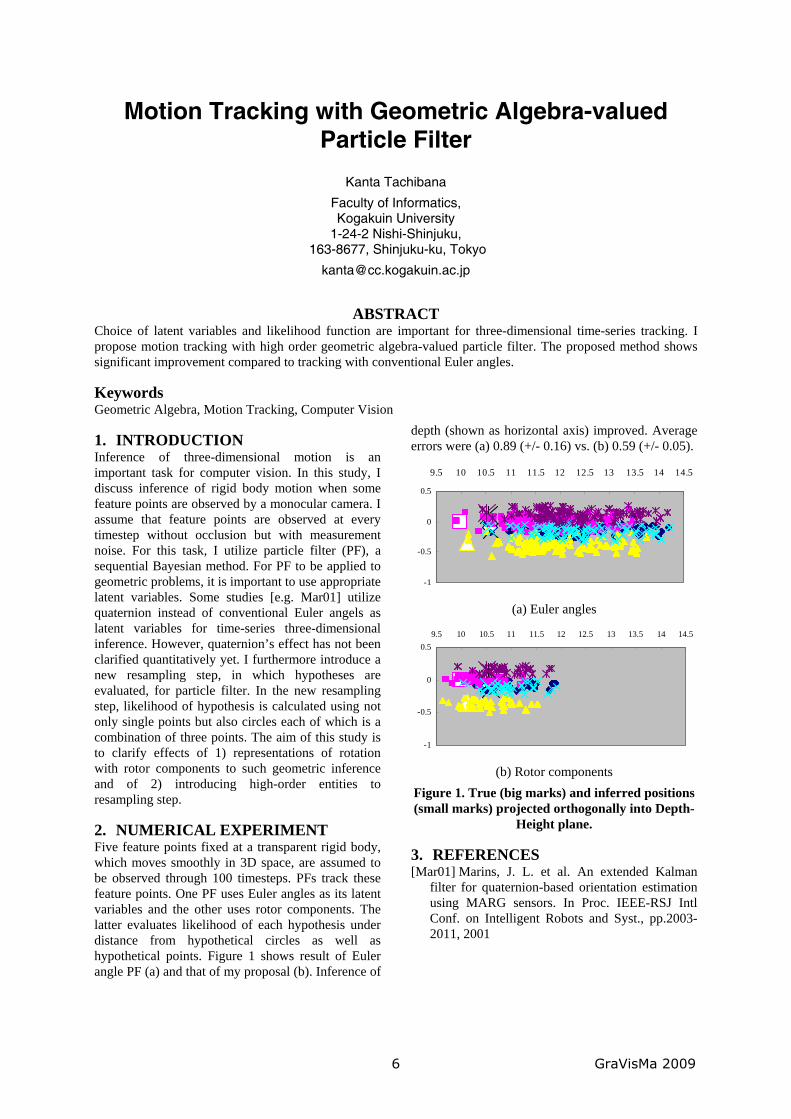
2. NUMERICAL EXPERIMENT Five feature points fixed at a transparent rigid body, which moves smoothly in 3D space, are assumed to be observed through 100 timesteps. PFs track these feature points. One PF uses Euler angles as its latent variables and the other uses rotor components. The latter evaluates likelihood of each hypothesis under distance from hypothetical circles as well as hypothetical points. Figure 1 shows result of Euler angle PF (a) and that of my proposal (b). Inference of
depth (shown as horizontal axis) improved. Average errors were (a) 0.89 (+/- 0.16) vs. (b) 0.59 (+/- 0.05).
-1
-0.5
0
0.5
9.5 10 10.5 11 11.5 12 12.5 13 13.5 14 14.5
(a) Euler angles
-1
-0.5
0
0.59.5 10 10.5 11 11.5 12 12.5 13 13.5 14 14.5
(b) Rotor components
Figure 1. True (big marks) and inferred positions (small marks) projected orthogonally into Depth-
Height plane.
3. REFERENCES [Mar01] Marins, J. L. et al. An extended Kalman
filter for quaternion-based orientation estimation using MARG sensors. In Proc. IEEE-RSJ Intl Conf. on Intelligent Robots and Syst., pp.2003-2011, 2001
6 GraVisMa 2009
Pose estimation based on Geometric AlgebraYan Cui
DFKITrippstadter Strasse. 122
67663 Kaiserslautern [email protected]
Dr. Dietmar HildenbrandTU Darmstadt
Hochschulstrasse. 1064283 Darmstadt Germany
ABSTRACT
2D-3D pose estimation is an important task for computer vision, ranging from robot navigation to medical intervention. In suchapplications as robot guidance, the estimation procedure should be fast and automatic, but in industrial metrology applications,the precision is typically a more important factor. In this paper, a new 3D approach for infrared data visualization preciselywith the help of 2D-3D pose estimation is proposed. The approach provides a user friendly interface, a flexible structure and aprecise result, which can be adjusted to almost all the geometrically complex objects.
Keywords: Geometric algebra, 2D-3D pose estimation, ICP algorithm.
EXTENDED ABSTRACTThe main goal of pose estimation is to estimate the rela-tive position and orientation of a known 3D object withrespect to a reference camera system. In other words,we search for a transformation (i.e. the pose) of the3D object such that the transformed object correspondsto 2D image data. Pose estimation is a subclass of themore general problem of registration which is one ofthe key problems in computer vision. In our scenario,there is a 3D object, which can contain different entitieslike 3D points, 3D lines, 3D spheres, 3D circles, kine-matic chain segments, boundary contours or contourparts. The 3D object in an image of a calibrated cam-era is observed. We can estimate the relative positionand orientation of the 3D object to the reference cam-era system with 2D-3D pose estimation method basedon Geometric Algebra [1].
In this paper we give two methods to solve thepose estimation by using features of the object (i.e.corners, edges) and by using free-form contourmodel. In the first method, the user should selectcorresponding features (i.e. corners, edges) between3D object and 2D image manually. Then with theequation λ
((MXM
)×e∧ (O∧ x)
)· e+ in Conformal
Geometric Algebra define the distance between 3Dobject point and the ray from the camera position tothe 2D image point, where X is the 3D object point inconformal space, M stands for the rigid motion of the3D object, O is the camera position, x is the 2D imagepoint. Construct a linear system to minimize the energyfunction that sum of the distances, afterward, we canget the rigid body motion parameter M. The finalresult will be affected by the features that user selected.We will improve the unstable result by method two.Firstly user can extract the silhouette of the 3D objectin the image with Chan and Vese model [2]. In thesame time the algorithm can find the free-form contour
automatically by Fourier descriptors, which enablea low-pass description of the 3D object contour, andis advantageously applied to the pose problem. Inorder to relate 2D image information to 3D entities, weinterpret a point on the 2D silhouette as a projectionray from the camera position in 3D space, construct asimilar cone shape. The aim is to find a best fit withthe cone shape. We use the Iterative Closest Point(ICP) algorithm [3] to solve the 2D to 3D registrationproblem. In order to avoid the local minimum, we tryto improve the ICP algorithm, define the error a sumof the distances between the posed object points andthe nearest rays. If the error is bigger than a suitablethreshold, we should rotate the 2D image some degreearound the camera view direction, until the error issmaller than the threshold. After finding the right posedposition of the 3D object, we try to map the texture ofthe 2D image to the 3D mode, test the triangles of the3D object are visible or not with ray-tracing algorithm.In this paper we try to implement the ray-tracingmethod based on the Geometric Algebra [4].
With the framework above, the developed approachcan deal with image time sequences from different viewpoints captured by the camera. The final visual resultsare high-precision and satisfied the requires of indus-trial metrology application.
REFERENCES[1] Rosenhahn B. and Sommer G. Pose Estimation in Conformal
Geometric Algebra Part I: The stratification of mathematicalspaces. Part II: Real-Time pose estimation using extended fea-ture concepts. Technical Report 0206, University Kiel, 2002.
[2] T. Chan and L. Vese. Active contours without edges. IEEE Tran-sations on Image Processing,10(2):266-277, 2001.
[3] Rusinkiewicz S. and Levoy M. Efficient variants of theICP algorithm. Available at http://www.cs.princeton.edu/smr/papers/fasticp/. Presented at Third International Confer-ence on 3D Digital Imaging and Modeling (3DIM), 2001.
[4] Leo Dorst. Geometric Algebra for Computer Science An Object-Oriented Approach to Geometry, Chapter 23.
7 GraVisMa 2009
Spherical Offset
Seok Won Lee*, Andreas Nestler Institute of Forming and Cutting Manufacturing Technology
Dresden University of Technology, D-01062, Dresden, Germany swlee,[email protected]
Keywords offset, geodesic offset, spherical geometry, visibility, visibility cone, tool path generation, multi axis milling, collision-free tool movement.
EXTENDED ABSTRACT
1. INTRODUCTION Numerically controlled (NC) milling is one of the most prevailing manufacturing processes. During milling the blank material is removed by geometry-defined cutters moving along given tool paths, so that the net shape of the target part is achieved in the end. In this paper, spherical offset algorithm is proposed which is applicable to generate tool path and to avoid collision between the cutting tool and the material.
2. SPHERICAL VISIBILITY MAP By definition, visibility is a synonym of a determination of the visible parts/polygons/lines of the scene from the viewpoint P. It is, however, diversely interpreted in various contexts such as shadow computation and hidden surface removal in computer graphics, finding accessible direction of a probe in metrology, scanning strategy in reverse engineering, motion planning in robotics, searching parting line in molds and dies and so on. Especially in CAD/CAM field visibility problem arises either in finding an accessible area of the tool with respect to a given part contour or in generating interference-free tool paths for 5 axis machining. Spherical visibility map projects a visible scene from the viewpoint in Euclidean space into the sphere S2, of center which is imaginarily located on the viewpoint. An intersection of the ray starting from the center with the scene is mapped onto S2. Then the boundary curve builds the visibility cone. Since a tool has a non-zero radius the visibility cone is needed to be offset inwards with a constant angular radius ρ on S2 to avoid gouges while a tool approaches the position P. The deepest point Q of the spherical offset is regarded as the most reliable tool access direction. To confirm that Q is the safe approach direction, the collision is checked between the tool and the local area around P finally.
3. SPHERICAL OFFSET AND ITS APPLICATION By definition, the offset is the locus of the points which are displaced with constant distance (or offset
radius) from the progenitor. Depending on the surface where the progenitor lies it is classified into plane offset and geodesic offset. The spherical offset belongs to the geodesic offset of which distance is measured along great circle on spherical surface S2. At the beginning we define the spherical geometry including point, circle, segment and polygon etc on S2 and its elementary geometric operations which are, for example, the intersection test, orientation test, tangency test etc. Next we introduce the algorithm to calculate the offset on S2 using piecewise spherical segment (PSS) method. The polygonal mesh in Euclidean space, which is composed of line segments, is projected into S2 and each line segment is mapped as a segment of great circle on S2. From the soup of segments the visibility cone is calculated while the intersection points between segments are found by adapted sweep line algorithm for the sphere and invalid segments are rejected. Then the irrelevant spherical segments to the offset building are discarded prior to true offset calculation so that the most numerical inconsistency could be prevented previously. Finally we take several implementation examples in CAD/CAM applications taking advantage of the spherical offset. First, the spherical offset could be used to calculate a collision-free approach direction of the tool taking the workpiece contour into consideration. The visibility cone of the workpiece is calculated from a viewpoint. The offset from visibility cone is built by the proposed spherical offset algorithm. The deepest point of the offset, say, the offset point with the largest angular offset radius ρmax, is regarded as the most reliable tool access direction. Another example using spherical offset could be found in the tool path generation to groove characters or curves on the spherical surface. The cutting tool follows along the tool paths which are comprised of the path of spherical offset itself and some linking paths so as that the contour of the world map, for instance, could be grooved on the spherical workpiece.
8 GraVisMa 2009
Inertial Navigation using Geometric Algebra
Liam CandyDepartment of Engineering
University of Cambridge, CB2 1PZ, UKand CSIR, Pretoria, South Africa
Joan LasenbyDepartment of Engineering
University of Cambridge, CB2 1PZ, [email protected]
Keywords: Inertial Navigation, Bortz Equation, Geometric Algebra, Conformal Algebra.
EXTENDED ABSTRACT
1 INTRODUCTIONIn strapdown inertial navigation systems (SDINS) theangular velocity measured in a body frame is used toupdate a rotation generator that relates the orientation ofthe body frame to some reference frame. Because theangular velocity measurements are made in the bodyframe, which changes its orientation relative to thereference frame, direct integration of the conventionaldirection cosine differential equation is an unsuitablemethod for tracking attitude. Bortz [Bor71] derived amethod of accounting for this effect by representing theactual finite rotation by an orientation vector φ(t) andobtaining an expression for φ(t). Bortz showed that φ
could be split into two parts, ω(t) and σ(t). ω(t) is theangular rate vector and σ(t) is a term arising due to thechange in the body coordinate system.
φ in terms of φ and ω is known as the Bortz Equa-tion – updating the quantity φ given the measurementsand then extracting the attitude, is known to be moreaccurate than direct integration of the dynamical equa-tions. In this paper we will use geometric algebra (GA)to show how the Bortz equation arises almost triviallyfrom the dynamical equations.
Recent contributions in the SDINS literature haveused dual quaternions, a concise representation for bothrotations and translations, to extend the Bortz equationto the more general case of simultaneously updatingboth attitude and position [YWL05]. The claim is thatthere is an equivalent Bortz equation which allows moreaccurate updating. Here we use the conformal geomet-ric algebra (CGA) [HS84] to investigate what a con-formal Bortz equation would look like and whether theclaims made for dual quaternions are valid.
The 3D and 5D Bortz equationsIf the angular velocity of the body wrt the referenceframe is written as a bivector in the body frame, Ωb,and the rotor which takes the reference frame to thebody frame at time t as R(t), the dynamical equationis R = − 1
2 RΩb
We define Φ as Φ = αB, where B is a unit bivectorand R = e−Φ/2, ie a rotation of α in the plane of B.Since Φ = αB + αB, and using expressions for α andB obtained by equating scalar and bivector parts of the
dynamical equation, we are able to write Φ as a bivectorequation (where Ωb is written as Ω for conciseness):
Φ = Ω+(
|Φ|2
cot|Φ|2
−1)[
Ω+(Ω·Φ)Φ|Φ|2
]− 〈ΦΩ〉2
2(1)
This is effectively the dual of the conventional Bortzequation.
Using the CGA framework we know that we can ex-press both rotations and translations as rotors – thuswe are able to define a new Φ in our 5D space asΦ = αB + tn, where αB gives the spatial rotation asbefore and t is related to the spatial translation. It is nothard to show that R = e−Φ/2 represents a rotation of α
in the plane of B followed by a translation of s whichis a function of both t and the spatial rotation. We thenalso show that the equivalent 5D angular velocity bivec-tor, Ω is given by Ω = Ω3 + nRα sRα , where Ω3 is the3D angular velocity bivector.
The 5D dynamical equation is again R = − 12 RΩ.
Equating scalar and spatial bivector parts gives expres-sions for α and B (indeed those obtained in the 3Dcase). Equating non-spatial bivector and 4-vector partssimply gives identities, thus confirming consistency.
We then form Φ = αB+αB+ tn in terms of Φ and Ω.However, the resulting equation is not as simple in formas the 3D equation, ie it is not simply a matter of re-placing φ and ω with their 5D counterparts. This there-fore calls into question the process of substituting a dualquaternion generator into the Bortz equation form andupdating the dual quaternion components. The paperwill discuss the differences and investigate the discrep-ancies via simulations.
REFERENCES[Bor71] J.E Bortz. A new mathematical formulation for strapdown
inertial navigation. IEEE Transactions on Aerospace andElectronic Systems, AES-7, no. 1:61–66, 1971.
[HS84] D Hestenes and G Sobczyk. Clifford Algebra to Geo-metric Calculus: A unified language for mathematics andphysics. 1984.
[YWL05] D. Hu T. Li Y. Wu, X. Hu and J. Lian. Strapdown inertialnavigation system algorithms based on dual quaternions.IEEE Transactions on Aerospace and Electronic Systems,41-4:110–132, 2005.
9 GraVisMa 2009
Duality and Computation in Projective Space
Vaclav Skala Department of Computer Science and Engineering
Faculty of Applied Sciences, University of West Bohemia Univerzitni 8, CZ 306 14 Plzen, Czech Republic
http://Graphics.zcu.cz
ABSTRACT This paper presents solutions of some selected problems that can be easily solved in the projective space. If the principle of duality is used, quite surprising solutions can be found and new useful theorems can be generated as well. Principle of duality can be used to derive an equation of a parametric line in E3 as an intersection of two planes. This new formulation avoids division operations and increases the robustness of computation.
Keywords Projective space, homogeneous coordinated, duality principle, intersection computation 1. PROJECTIVE GEOMETRY The homogeneous coordinates are mostly introduced with geometric transformations concepts and used for the projective space representation. Nevertheless, geometrical interpretation is missing in nearly all publications. Conversion from the homogeneous coordinates to the Euclidean coordinates is defined for E2 case as: X = x / w Y = y / w (1) where: w ≠ 0, point x = [ x, y, w]T and x∈P2, X = [X, Y]T and X∈E2, if w = 0 then x represents “an ideal point”, that is a point in infinity. The cross-product of two vectors x1, x2∈E2, if given in the homogeneous coordinates, is defined as
222
11121
wyxwyxkji
xx =× (2)
The cross-product of three vectors x1, x2 and x3 is defined in the homogeneous coordinates as:
3333
2222
1111321
wzyxwzyxwzyxlkji
xxx =×× (3)
Let three points x1, x2, x3 be given in the projective space. Then a plane ρ∈E3 defined by those three points is determined as: ρ = x1 × x2 × x3 (4) As a point is dual to a plane, a plane is dual to a point in E3 we can use the principle of duality directly, now. Let three planes ρ1, ρ2 and ρ3 be given in the projective space. Then a point x, which is defined
as the intersection point of those three planes, is determined as: x = ρ1 × ρ2 × ρ3 (5) The computations can be extended to the projective space as follows:
( )11
22
1121212121
YXYXwwww
kjixxXX =×=× (6)
Let X2 – X1 = ω and X1 × X2 = v. A point on the line q(t) = q1 + ω t is defined as:
( ) tt ωω
ω +
×=
2vq ( )
⎥⎥⎦
⎤
⎢⎢⎣
⎡ +×= 2
2
ω
ωωω tt
vq) (7), (8)
The Eq.7 defines a line q(t) in the E3 by two points x1 and x2 given in the homogeneous coordinates. Of course, we can avoid the division operation easily using homogeneous notation for a scalar value ( )tq) , Eq.8 and the resulting line is defined directly in the projective space P3. Let us imagine that we have to solve the second problem, i.e. a line defined as an intersection of two given planes ρ1 and ρ2 in the Euclidean space: ρ1 = [a1, b1, c1, d1]T ρ2 = [a2, b2, c2, d2]T (9) Now we can apply the principle of duality as we can interchange the terms “point” and “plane” and exchange v and ω in the Eq.7.8 and we get:
( ) tt vv
vq +×
=2
ω ( )⎥⎥⎦
⎤
⎢⎢⎣
⎡ +×= 2
2
v
vvvq
tt
ω) (10), (11)
If 0=v then the given planes are parallel. This means that using a duality principle in projective space we get robust computation. Similar approach can be applied in the Geometry Algebra case as well.
10 GraVisMa 2009
Histogram smoothing for bilateral filter
Michal Seeman Faculty of Information Technology
Brno University of Technology Bozetechova 2
CZ 612 66, Brno, Czech Rep. [email protected]
Pavel Zemcik Faculty of Information Technology
Brno University of Technology Bozetechova 2
CZ 612 66, Brno, Czech Rep. [email protected]
Keywords bilateral filtering, histogram, signal filtering, resampling
EXTENDED ABSTRACT
1. INTRODUCTION Bilateral filtering described and named by Tomasi
and Manduchi [Tom98] is the core of several
graphics and image processing algorithms. For
example, several HDR processing mechanisms do
exploit bilateral filtering.
2. HISTOGRAM CONVOLVED WITH
GAUSSIAN One of the possible methods to speed-up the bilateral
filtering is through sampling the features of local
neighborhoods in the image. The features of the
neighborhoods can then be described by histograms.
The histograms must be gathered and then convolved
with a Gaussian. As the Gaussian has limited
spectrum (works, in fact, as a low-pass filter), a space
exists to subsample the representation of the
histogram in the computer without a loss of precision
of the final output.
The Gaussian could be approximated as a linear
combination of exponential curves. Convolution with
an exponential function could be computed in linear
time (but histogram size doesn’t grow with image
size), because each convolved item could be
retrieved from the previous item as follows:
While simulating exact Gaussian is not necessary
(rough filter approximation use even rectangular core
instead), the result has to be convolution by the same
core for any input data. The reason is that different
parts of bilateral-filter equation are convolved with
the same Gaussian. The exponential curves linear
combination fulfills this condition, and therefore
ideally fits histogram smoothing needs.
3. HISTOGRAM RESAMPLING Before applying the convolution, the histogram can
be subsampled. For accelerating the computation,
already subsampled histogram is gathered. Splitting
histogram contribution into several neighboring bins
can perform as precise resampling, however high
frequency artifacts caused by cheap (e.g. linear
resampling) are damped by Gaussian convolution,
which works as a low-pass filter.
Retrieval of the values from the subsampled
histogram could be done by done by some precise
resampling filter (e.g. Lanczos) or again by fast
bilinear interpolation (bilateral filter computation
needs random access to the histogram, so complex
interpolation method accelerating is limited.
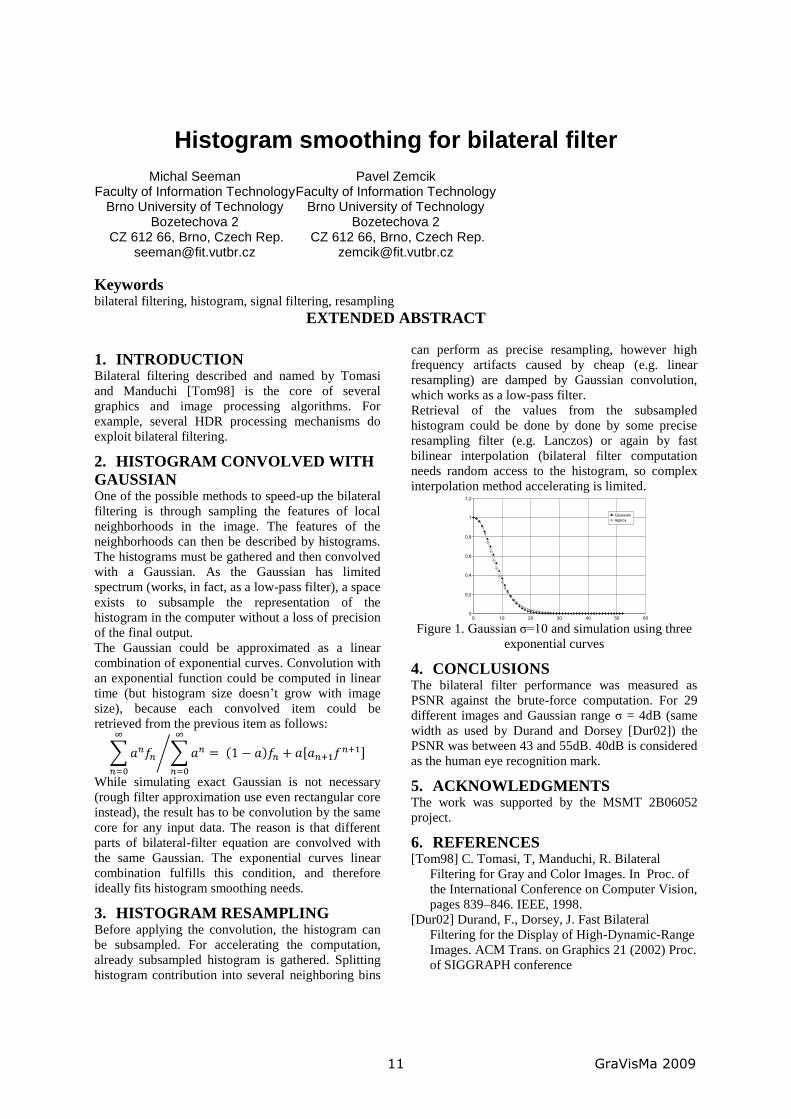
Figure 1. Gaussian σ=10 and simulation using three
exponential curves
4. CONCLUSIONS The bilateral filter performance was measured as
PSNR against the brute-force computation. For 29
different images and Gaussian range σ = 4dB (same
width as used by Durand and Dorsey [Dur02]) the
PSNR was between 43 and 55dB. 40dB is considered
as the human eye recognition mark.
5. ACKNOWLEDGMENTS The work was supported by the MSMT 2B06052
project.
6. REFERENCES [Tom98] C. Tomasi, T, Manduchi, R. Bilateral
Filtering for Gray and Color Images. In Proc. of
the International Conference on Computer Vision,
pages 839–846. IEEE, 1998.
[Dur02] Durand, F., Dorsey, J. Fast Bilateral
Filtering for the Display of High-Dynamic-Range
Images. ACM Trans. on Graphics 21 (2002) Proc.
of SIGGRAPH conference
0 10 20 30 40 50 600
0,2
0,4
0,6
0,8
1
1,2
GaussianApprox.
11 GraVisMa 2009
Particle systems for riverbed modeling over
multilayer height-field data with hardness
Korneliusz Warszawski
University of Zielona Gora ul. Podgorna 50,
65-246 Zielona Gora, Poland
Slawomir Nikiel
University of Zielona Gora ul. Podgorna 50
65-246 Zielona Gora, Poland
Pawel Filipczuk
University of Zielona Gora ul. Podgorna 50
65-246 Zielona Gora, Poland
Keywords Particle Systems, Terrain Surface Modeling, Riverbed Generation, Virtual Reality.
EXTENDED ABSTRACT Striking forms of virtual landscapes are possible
when developers, artists and virtual world builders
can spend a lot of time manually deforming polygon-
nets. Alternatively an acceptable visual level of
geological models can be obtained much faster by
automated techniques. Several applications of
procedural methods have been used in simulation and
visualization systems. Virtual terrain is ‘a must‘
element of environment modeling in digital
entertainment and game development.
Applying particle systems to terrain surface modeling
constitute very efficient alternative for currently used
methods. In addition, this technique makes it possible
to generate very complex height-field data, similar to
mountains or island-like forms and to deform pre-
defined (imported from file or pre-generated)
landscape structures and to enrich them with canyons
or riverbeds. This paper proposes a method that
applies particle systems to modify height-field based
landscapes with generation of hydrological erosion
caused by fast flowing spout. We present the
construction of particle system terrain generator/
modifier, its main attributes and how they influence
the final product of the modeling process. The key
structure for modeled landscape is a typical height-
field data, based on the two dimensional array. Each
cell represents altitude at the coordination point
defined by rows and columns of this array. Such kind
of data structure enables fast and simple
implementation of terrain deformation and can be
relatively easily rendered by any of virtual reality
systems. It can be a plain height-map or one imported
from external file of real landscape data, e.g.: Digital
Elevation Map (DEM). It can be also initially
modeled by any automated method, e.g.: Midpoint
Displacement, Fault Formation or modeled entirely
by the Particle System. For our simulation, we
assume that the base terrain consists of several layers
of materials with different erosion vulnerability.
Furthermore, each layer is also assembled with
various materials of the kind. Similar to height-field
data, information about hardness of materials, which
given landscape is constructed of, can be obtained
from geological data. Alternatively, for virtual terrain
we can simulate this type of data, by one of
previously mentioned height-field generation
algorithms.
The proposed system behaves like in a classical
particle system, it uses emitters as elements that
control starting location, direction and quantity of
particles in a given simulation environment. For our
simulation process, we select the main attributes for
the emitter as: its position and orientation in virtual
space and the size of emission window. The emitter
starting location should be set at a side and directed
to the based landscape. Its emission window
determines the area (plane or space) where new
particles can be only injected into the simulation
system environment. A single particle is defined by
Reeves as a dynamic point in three-dimensional
space. In our work, we organize particles as
a collection of parameterized objects. We choose
parameters for particles such as: the current position,
directional angle, linear velocity, rotation angle,
rotation velocity and the size which define its zone of
influence for landscape modification processes. Each
emitted particle is moving (rolling) over the surface
of terrain structure making deformations at its current
position. Scale of the modifications depends on
particle parameters and landscape susceptibility for
modifications process under a particle influence zone.
In the paper we discuss basic problems of landscape
hydrological erosion deformations and propose a fast
alternative to algorithms based on Computational
Fluids Dynamic (CFD) or rainfall erosion. Proposed
method is not intended to simulate physically erosion
process but focuses on its results for exploitation in
virtual environments in real-time simulations and
rapid prototyping of terrains.
12 GraVisMa 2009
Numerical Method for Accelerated Calculation of Point Light Source Optical Field
Pavel Zemcik
Faculty of Information Technology Brno University of Technology
Bozetechova 2 CZ 612 66, Brno, Czech Republic
Ivo Hanak
Faculty of Information Technology Brno University of Technology
Bozetechova 2 CZ 612 66, Brno, Czech Republic
ABSTRACT This contribution describes a method for calculation of a coherent point light source optical field. The optical
field calculation is the key part of hologram synthesis methods. Hologram synthesis methods present are
extremely computationally extensive and many of them use superposition of point light sources to construct a
scene. In a previous work by the authors, an approximation has been introduced that uses fixed point type most of
the time and does not impose distance limitations. Speedup gain with no loss of flexibility was achieved. In the
presented contribution, it is shown that the approximation can be simplified even further and the resulting error
does not impose any additional restrictions and can lead in an additional speedup. Furthermore, the numerical
aspects of the new approach are shown and precision and data format considerations are discussed.
Keywords Spherical wave, optical field, point light source, differential computational scheme
1. INTRODUCTION Optical field synthesis is a crucial step in hologram
synthesis. Even though a hologram can be calculated
directly, the focus of the contribution is on optical
field calculation because it can be used for generation
of several varieties of holograms. This contribution
focuses on geometrical aspects of the problem with
an aim to calculate the columns of optical field of a
point light source (PLS). More details of the
application/background will be shown in the full text.
2. OPTICAL FIELD EQUATION In the case concerned, an optical field is represented
as a uniform grid of samples. Each sample represents
a complex value. The scene consists of PLS, each of
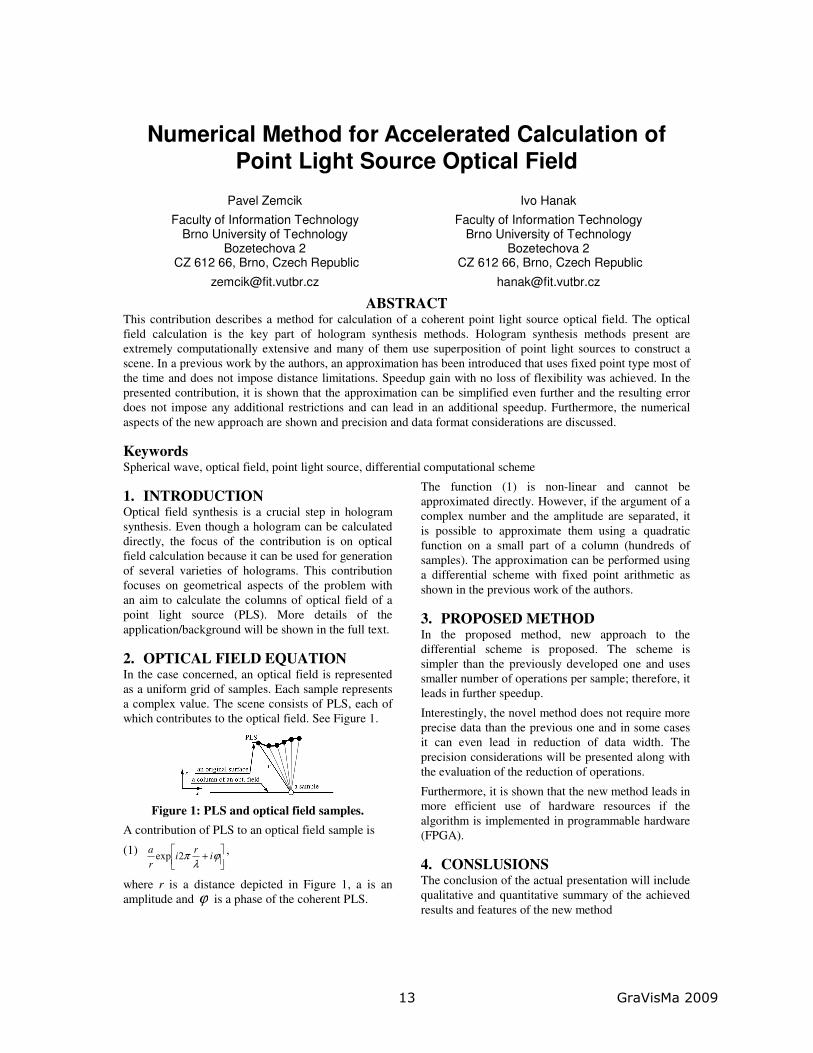
which contributes to the optical field. See Figure 1.
Figure 1: PLS and optical field samples.
A contribution of PLS to an optical field sample is
(1)
+ ϕ
λπ i
ri
r
a2exp
,
where r is a distance depicted in Figure 1, a is an
amplitude and ϕ is a phase of the coherent PLS.
The function (1) is non-linear and cannot be
approximated directly. However, if the argument of a
complex number and the amplitude are separated, it
is possible to approximate them using a quadratic
function on a small part of a column (hundreds of
samples). The approximation can be performed using
a differential scheme with fixed point arithmetic as
shown in the previous work of the authors.
3. PROPOSED METHOD In the proposed method, new approach to the
differential scheme is proposed. The scheme is
simpler than the previously developed one and uses
smaller number of operations per sample; therefore, it
leads in further speedup.
Interestingly, the novel method does not require more
precise data than the previous one and in some cases
it can even lead in reduction of data width. The
precision considerations will be presented along with
the evaluation of the reduction of operations.
Furthermore, it is shown that the new method leads in
more efficient use of hardware resources if the
algorithm is implemented in programmable hardware
(FPGA).
4. CONSLUSIONS The conclusion of the actual presentation will include
qualitative and quantitative summary of the achieved
results and features of the new method
13 GraVisMa 2009
Reusable performance driven facial animation system
Peter Drahoš
Faculty of Informatics and information Technologies,
Slovak University of Technology Ilkovičova 3
842 16, Bratislava
Keywords facial modeling, facial expression generation, facial animation, GPU shaders
EXTENDED ABSTRACT
1. INTRODUCTION Facial animation is and always has been one of the most interesting topics in computer graphics. Modern virtual worlds and games already take advantage of the high performance of modern GPUs and use limited facial animation systems to enrich the user experience. This paper describes modern approach to implementation of a practical reusable animation system for use in generic applications such as: e-learnig, language learning, communication and others. Importance is placed on reusability, ease of use and performance at the expense of the anatomical correctness of animation.
Realistic synthesis of human faces is one of the most interesting and certainly one of the most difficult problems in computer graphics. First publications on the problem can be seen back in early 70’s [Par72]. Facial expressions can enhance believability, clarity and involvement of users in communication. Existing implementations and systems have to find optimal balance between realistic models and performance to achieve interactive response.
2. FACE MODEL Ease of model setup and preparation for animation is important to us. Facial models must be easy to obtain and interchangeable in order to make the system reusable. To achieve real-time performance we use classic polygonal representation of the face, either scanned or synthetic, with a simple color texture for rendering. Mesh deformation and animation is achieved using customized virtual muscles [Wat87] implemented using vertex shaders. The user only needs to set up the facial muscle structure using a simple editor.
3. RENDERING Visual quality and performance of the system is highly dependent on the rendering process. Modern GPUs are capable or rendering very high detail models at interactive frame rates and can deliver wide range of effects that improve realism [Gem07].
Subsurface light scattering and soft shadows are created using pixel shaders. Skin deformation and wrinkles are dynamically generated from virtual muscle contractions to improve results even further.
Additional details such as hair, eyes, teeth and tongue have to be rendered in real-time and provide additional performance challenges on the rendering process and affect overall performance and quality.
4. ANIMATION Facial expressions are determined by sets of virtual muscle contraction parameters. Animation is achieved using dynamically generated sets of these muscle contraction parameters, which can be obtained from various sources including: video processing, speech synthesis and classic key frame animation or animation between expression sets.1
5. REFERENCES [Gem07] d’Eon, E. and Luebke, D. GPU Gems 3,
Addison-Wesley Professional, Chapter 14, August 2007.
[Par72] Parke, I.F. Computer Generated Animation of Faces, Proc. ACM, August 1972.
[Wat87] Waters, K. A Muscle Model for Animating Three-Dimensional Facial Expression, SIGGRAPH 87, vol. 21, pp. 17–24., July 1987
1 This work was supported by VG 1/0822/08 grant:
Intelligent embedded systems.
14 GraVisMa 2009
Context based controlled Virtual Tours using Viewpoint Entropy for Virtual Environments
RNDr. Ján Lacko [email protected]
Faculty of Mathematics, Physics and Informatics Comenius University Bratislava
Mlynská dolina 842 48 Bratislava, Slovakia
Marian Maričák [email protected]
Faculty of Mathematics, Physics and Informatics Comenius University Bratislava
Mlynská dolina 842 48 Bratislava, Slovakia
Keywords Viewpoint entropy, virtual environment, virtual tour.
EXTENDED ABSTRACT
1. INTRODUCTION In the field of computer graphics, one of the most important parts is creation of virtual environments. In the last years there is a big interest in creation of virtual cities. Man can visit a “real” city using various services (e.g. Google Earth, Microsoft Virtual Earth …). There is a question: How to create an automatic virtual tour with respecting virtual space of environment and best viewpoints for scene parts. In our method we combine viewpoint entropy for obtain the best views and context method for combine the fist n views into virtual tour.
2. VIEWPOINT ENTROPY Viewpoint entropy is low level method based on Shannon entropy. Viewpoint entropy is ratio of relative sizes of visible triangles and surface of bounding sphere.
Where S is scene, p is viewpoint, Nf is number of polygons in the scene and Ai/At is visibility of surface regarding to viewpoint p. In our method we use as bounding object hemisphere because in the virtual cities we are limited by ground.
3. CONTEXT METHOD We can use the hemisphere viewpoint entropy for standalone objects, but if we want to use it in the context of 3D virtual city, we are strongly limited by position of the objects. It is important to find only that camera positions where:
a) The whole object is visible b) The bounding box (hemisphere) is cut by
another and the number of viewpoints at hemisphere is reduced
If both conditions are executed, we can find the first n best views around the objects. Than we find the path around the objects using the Voronoi diagram, because there is a condition, that path from one viewpoint in first object to another viewpoint in second object, must lie outside the objects of the whole scene. There are also other conditions for construction of camera path. In our method there is possibility of adding some information to object (object weight) and for surfaces (surface weight) and use this information from e.g. reconstruction process to control the path of virtual tour through scene.
4. ACKNOWLEDGEMENTS This paper was supported by VEGA grant
No. 1/0763/09
15 GraVisMa 2009
Shading of Bézier Patches
Jan Bocek
University of Ostrava 30 dubna 22
701 03 Ostrava, Czech Republic
Alexej Kolcun
IG AS CR Studentská 1768
702 00 Ostrava, Czech Republic
Keywords Beziér patch, shading, normal vector surface.
EXTENDED ABSTRACT
1. INTRODUCTION There are well known shading algorithms (Gouraud, Phong) for the surfaces shading. The problem is that such algorithms just approximate the real shading. Precise shading algorithms require the values of normal vectors at all points of rendered surface. Computation of normal vector for Cartesian and triangular parametric surfaces is presented in the paper.
2. CARTESIAN SURFACES In [Yam] the normal vector surface for Cartesian Bézier surface of degree (n,m) is derived and it is expressed as a Bézier surface of degree (2n-1,2m-1). According to this rule normal vector surface for bilinear surface is again a bilinear surface. In [Boc] it is shown, that for normal vector surface in Bézier form
( ) ( ) ijjjm
n
i
m
j
iin Nttssin
jm
tsN −
= =
− −−⎟⎟⎠
⎞⎜⎜⎝
⎛⎟⎟⎠
⎞⎜⎜⎝
⎛= ∑∑ )1(1,
0 0
the control normal vectors ijN fulfil the equation
0)1(0 0
=−⎟⎠⎞⎜
⎝⎛⎟⎠⎞⎜
⎝⎛ +
= =∑∑ ij
jin
i
m
jNj
min . (1)
From (1) we can prove that for bilinear surface the surface of the normal vectors is a plane. It means that the normal vectors of bilinear surface we can construct as a linear interpolation of normal vectors in control points. Conclusion of this fact is that Phong's shading model is an exact shading model for bilinear surfaces.
3. TRIANGULAR SURFACES The idea of the presentation of the normal vector surface for Bézier triangular surface as a Bézier triangular surface is presented here. Degree of resulting normal vector surface is 22 −n . So, from the point of view of effective visualization, quadratic Bézier triangles seems to be interesting, so as
• they are natural generalization of planar triangles,
• they are able to model smooth surfaces, • normal vector surface is also quadratic.
As the quadratic Bézier triangle is the simplest generalization of (planar) triangle, this approach generalizes Phong's shading model. The results of Phong's and our approach to shading are compared and shown in simple testing rectangular bilinear and triangular quadratic surfaces.
4. ACKNOWLEDGMENTS The paper has been supported by grant projects AVOZ 30860518 and Internal Fund of Faculty of Science, University of Ostrava.
5. REFERENCES [Boc] Bocek, J., Effective visualization of Bézier
surfaces, MSc. Thesis, University of Ostrava, 2007. (in Czech)
[Jin] Jin, S., Lewis, R.,R., West, D.: A comparison of Algorithms for Vertex Normal Computation. The Visual Computer Vol. 21, No.1-2, 2005 pp.71-82.
[Yam] Yamaguchi, Y. Bézier normal vector surface and its applications, SMA '97, p.26, 1997.
16 GraVisMa 2009
Macromolecular structure interrogation new tool
Francisco Torrens
Institut Universitari de Ciència Molecular,Universitat de València
Edifici d’Instituts de Paterna, P. O. Box 22085 Spain 46071, València
Gloria Castellano
Insto. M. Ambiente y CC. Marinas, UniversidadCatólica de Valencia San Vicente Mártir
Guillem de Castro-942nd line of address
Spain 46003, València
ABSTRACTOur program BABELPDB allows browsing and interrogating the native and derived structural features ofbiological macromolecules using data obtained from the Protein Data Bank (PDB). Major features ofBABELPDB are: (1) convert from PDB to other formats, (2) add or remove H atoms, (3) strip the crystallizationwater molecules and (4) separate the -carbons (C ). The coordinates obtained with BABELPDB permitcharacterizing the presence of hydrogen bonds (H-bond). The algorithm for detecting H-bonds is implemented inour program TOPO for the theoretical simulation of the molecular shape. An example is given to illustrate thecapabilities of the software: the calculation of the fractal dimension of the lysozyme molecule with (1.908) andwithout (1.920) H atoms. The numbers compare well with reference calculations performed with our version ofthe GEPOL program and with the results from Pfeifer et al. For proteins, the C skeleton extracted withBABELPDB allows drawing the ribbon image, which determines the secondary structure of proteins.
KeywordsInformation retrieval, Chemical structure, Secondary structure, Solvation water, -Carbon skeleton.
1. INTRODUCTIONOur program BABELPDB includes subprograms thatallows the following options to examine a particularPDB structure: (1) convert from PDB to otherformats; (2) add or remove H atoms; (3) strip thewater molecules of crystallization and (4) separate Catoms [Tor01]. BABELPDB would seem particularlysuited to educational purposes and an example ofhow it might be used is given.
2. COMPUTATIONAL METHODProgram BABELPDB allows browsing–interrogatingnative–derived structural features of biologicalmacromolecules using data obtained from the ProteinData Bank (PDB). The coordinates obtained withBABELPDB allow characterizing the presence ofhydrogen bonds (H-bonds). The algorithm fordetecting H-bonds is implemented in program TOPOfor the theoretical simulation of the molecular shape.
3. RESULTS AND DISCUSSIONAn example illustrates the capabilities, i.e.,calculation of the fractal dimension of lysozyme withand /without H atoms. The numbers compare withreference calculations performed with programGEPOL. For proteins, C skeleton allows drawingribbons image, which determines secondary structure.
Provisional conclusions follow.
1. Our program BABELPDB has been written for thesearch, retrieval, analysis and display of informationfrom database PDB. Several options are allowed.
2. The fractal dimension of lysozyme has beencalculated with and without H atoms.
3. For proteins, the C skeleton extracted withBABELPDB allows drawing the ribbon image,which determines the secondary structure of proteins.
4. It is still to be explored the methodologicalapplication of these computational programsenriching the present teaching techniques.
4. REFERENCE[Tor01] Torrens, F., and Castellano, G., A new tool
for interrogation of macromolecular structure inchemical education, in: Seijas, J.A., and VázquezTato, M.P. (eds.). Synthetic Organic Chemistry,MDPI, Basel (Switzerland), Vol. 12, pp. 1-17,2008.
Permission to make digital or hard copies of all or partof this work for personal or classroom use is grantedwithout fee provided that copies are not made ordistributed for profit or commercial advantage andthat copies bear this notice and the full citation on thefirst page. To copy otherwise, or republish, to post onservers or to redistribute to lists, requires priorspecific permission and/or a fee.
17 GraVisMa 2009
Geometric Algebra Computing on the CUDA Platform
Christian SchwinnTU Darmstadt, Germany
Department of Computer [email protected]
darmstadt.de
Andreas GörlitzTU Darmstadt, Germany
Department of Computer [email protected]
Dietmar HildenbrandTU Darmstadt, Germany
Department of Computer [email protected]
darmstadt.de
ABSTRACTGeometric Algebra (GA) is a mathematical framework that allows a compact, geometrically intuitive description ofgeometric relationships and algorithms. These algorithms require significant computational power because of theintrinsically high dimensionality of geometric algebras. Algorithms in an n-dimensional GA require 2n elementsto be computed for each multivector. GA is not restricted to a maximum of dimensions, so arbitrary geometricalgebras can be constructed over a vector space Vn. Since computations in GA can be highly parallelized, thebenefits of a parallel computing architecture lead to a significant speed-up compared to standard CPU implemen-tations, where elements of the algebra have to be calculated sequentially. An upcoming approach of coping withparallel computing is to use general-purpose computation on graphics processing units (GPGPU). In this paper,we focus on the Compute Unified Device Architecture (CUDA) from NVIDIA [2]. We present a code generatorthat takes as input the description of an arbitrary geometric algebra and produces an efficient implementation ofgeometric products for the underlying algebra on the CUDA platform.
Keywords: Geometric Algebra, Geometric Computing, GPU, CUDA.
1 INTRODUCTION
Geometric Algebra (GA) has become more and morepopular in different fields of research. Due to its abovementioned properties it is possible to develop very com-pact algorithms while keeping them intuitive. One ma-jor drawback is the reduced performance when apply-ing GA algorithms without further processing. But re-cent research has shown that it is possible to speed upGA algorithms drastically by means of static code op-timization and switching to parallel computing archi-tectures like field-programmable gate arrays (FPGA)or CUDA, which even leads to performance improve-ments compared to standard implementations [1].
Many applications of GA require a very large numberof calculations to be processed, e.g. feature extractionalgorithms [3]. In most cases it is necessary to definehighly customized non-standard algebras in order to fitthe problem statement. What these problems have incommon is a remarkable amount of parallelization re-quired to fulfill the constraints of reduction. In theory,this can lead to virtually infinite operations which haveto be executed concurrently in order to decrease the or-der of time complexity.
In this paper, we investigate the potential of execut-ing GA operations on parallel architectures. We focuson the implementation of arbitrary geometric productson the CUDA platform as a means for evaluating theperformance of parallel computing in GA compared tostandard implementations. We implement the calcula-tion of the geometric product without any restrictions tothe underlying algebra and associated metric and signa-
ture. We exploit the property that elements of the re-sult multivector can be easily computed in parallel, e.g.each one in a separate (parallel) thread on a CUDA-enabled GPU. Therefore, we present a code generatorthat produces the CUDA code which calculates the ge-ometric product of the related algebra and can be em-bedded in order to speed up algorithms.
Our approach takes as input the description of ann-dimensional algebra in terms of a metric or signa-ture and calculates a data structure describing the el-ementary product of all possible combinations of ba-sis blades. This can be seen as a lookup table thatis first optimized according to GA simplifications andthen used to generate expressions for the individual re-sult multivector components that only depend on thecoefficients of the input multivectors to be multiplied.Finally, these expressions are translated into parallelCUDA code that calculates the result multivector andcan be used for efficient calculation of the geometricproduct.
As a result, we evaluate the performance of the par-allelized geometric product to get an estimation on theimpact of parallel computing on problems in GA.
REFERENCES[1] H. Lange, F. Stock, D. Hildenbrand, and A. Koch. Acceleration
and Energy Efficiency of a Geometric Algebra Computation us-ing Reconfigurable Computers and GPUs. FCCM, 2009.
[2] NVIDIA. The CUDA home page. http://www.nvidia.com/object/cuda\_home.html, 2009.
[3] M. T. Pham, K. Tachibana, E. M. S. Hitzer, T. Yoshikawa, andT. Furuhashi. Classification and Clustering of Spatial Patternswith Geometric Algebra. AGACSE, 2008.
18 GraVisMa 2009
A GPU Supported Approach to Partial Registration of 3D Scan Data
Adrie Kooijman / Joris Vergeest
Delft University of Technology Faculty of Industrial Design Engineering
Landbergstraat 15 2628CE, Delft, the Netherlands
[email protected] / [email protected]
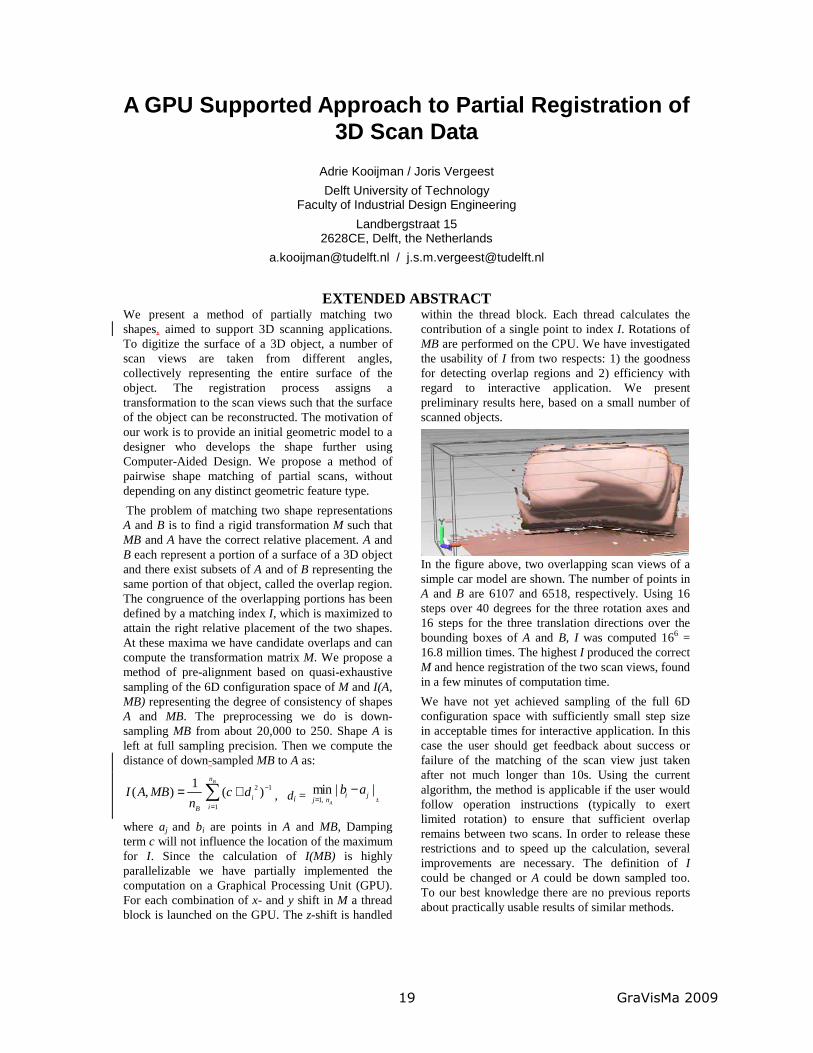
EXTENDED ABSTRACT We present a method of partially matching two shapes, aimed to support 3D scanning applications. To digitize the surface of a 3D object, a number of scan views are taken from different angles, collectively representing the entire surface of the object. The registration process assigns a transformation to the scan views such that the surface of the object can be reconstructed. The motivation of our work is to provide an initial geometric model to a designer who develops the shape further using Computer-Aided Design. We propose a method of pairwise shape matching of partial scans, without depending on any distinct geometric feature type.
The problem of matching two shape representations A and B is to find a rigid transformation M such that MB and A have the correct relative placement. A and B each represent a portion of a surface of a 3D object and there exist subsets of A and of B representing the same portion of that object, called the overlap region. The congruence of the overlapping portions has been defined by a matching index I, which is maximized to attain the right relative placement of the two shapes. At these maxima we have candidate overlaps and can compute the transformation matrix M. We propose a method of pre-alignment based on quasi-exhaustive sampling of the 6D configuration space of M and I(A, MB) representing the degree of consistency of shapes A and MB. The preprocessing we do is down-sampling MB from about 20,000 to 250. Shape A is left at full sampling precision. Then we compute the distance of down-sampled MB to A as:
2 1
1
1( , ) ( )
Bn
iiB
I A MB c dn
−
=
= +∑ , di = 1,min | |
A
i jj n
b a=
− ,
where aj and bi are points in A and MB, Damping term c will not influence the location of the maximum for I. Since the calculation of I(MB) is highly parallelizable we have partially implemented the computation on a Graphical Processing Unit (GPU). For each combination of x- and y shift in M a thread block is launched on the GPU. The z-shift is handled
within the thread block. Each thread calculates the contribution of a single point to index I. Rotations of MB are performed on the CPU. We have investigated the usability of I from two respects: 1) the goodness for detecting overlap regions and 2) efficiency with regard to interactive application. We present preliminary results here, based on a small number of scanned objects.
In the figure above, two overlapping scan views of a simple car model are shown. The number of points in A and B are 6107 and 6518, respectively. Using 16 steps over 40 degrees for the three rotation axes and 16 steps for the three translation directions over the bounding boxes of A and B, I was computed 166 = 16.8 million times. The highest I produced the correct M and hence registration of the two scan views, found in a few minutes of computation time.
We have not yet achieved sampling of the full 6D configuration space with sufficiently small step size in acceptable times for interactive application. In this case the user should get feedback about success or failure of the matching of the scan view just taken after not much longer than 10s. Using the current algorithm, the method is applicable if the user would follow operation instructions (typically to exert limited rotation) to ensure that sufficient overlap remains between two scans. In order to release these restrictions and to speed up the calculation, several improvements are necessary. The definition of I could be changed or A could be down sampled too. To our best knowledge there are no previous reports about practically usable results of similar methods.
19 GraVisMa 2009
Realtime KLT feature point tracking
for High Definition video
Hannes Fassold1 Jakub Rosner2 [email protected] [email protected]
Peter Schallauer1 Werner Bailer1 [email protected] [email protected]
EXTENDED ABSTRACT
1 JOANNEUM RESEARCH, Institute of Information Systems & Information Management, Steyrergasse 17-19, 8010 Graz,
Austria 2 Silesian University of Technology, Faculty of Automatic Control and Robotics, Ulica Academicka 2, 44-100 Gliwice,
Poland
The automatic detection and reliable tracking of feature points is an important part of many computer vision methods. It is used e.g. in algorithms for computing structure from motion, camera calibration, camera motion estimation and in a variety of other computer vision fields. One of the most widely used algorithms for feature point detection and tracking is the KLT tracker proposed by Kanade, Lucas and Tomasi. Although this algorithm provides good quality tracking results, its computational complexity limits its usage to standard definition video for realtime applications when implemented in software. For realtime feature point tracking in high definition video an alternative technology needs to be considered. Because of its tremendous computation capabilities Graphic Processing Units (GPU’s) gain significant attention for computer vision tasks. In this paper we report experiences and results of porting the KLT tracker to the GPU. We use the “Compute Unified Device Architecture” (CUDA), a C-like programming language for general-purpose GPU programming proposed by NVIDIA. The two key components of the KLT tracker are feature point detection and feature point tracking. The feature point detection takes into account only corner-like feature points which are well suited for reliable tracking. Detected points are then tracked by calculating the translation which minimizes the dissimilarity between point-centered windows in two consecutive images. For the feature point detection, we propose to do all steps of the detection process, except the last one, on the GPU. The first steps can
be ported efficiently to the GPU as they are good parallelizable. In contrast, the last step, which enforces a certain minimum distance of each feature point to the others, is not well suited for execution on the GPU as it is inherently serial. The feature point tracking is done on a multi-resolution image representation (pyramid) to allow for large motion. The calculation of the pyramid, and also the tracking itself is done completely on the GPU. The tracking is well suited for parallelization, as for each pyramid level the estimation of the optical flow for one feature point can be done independently from the others. We compare the CUDA implementation with the highly optimized OpenCV KLT tracking functions in terms of quality and speed. A significant speedup with respect to the OpenCV routines can be noticed. Furthermore, some additional experiments are done to evaluate the influence of different paremeterization (window size, number of tracked points, etc.) on the runtime of the GPU routine. Our GPU implementation achieves realtime (> 25 frames per second) performance for High Definition (HD) video sequences, successfully tracking several thousands of points. As nearly the entire work for feature point detection and tracking is done on the GPU, the CPU is free for doing higher-level computer vision tasks, e.g. for estimating the camera motion from the tracked points. In summary, the GPU implementation achieves a significant speedup compared with an optimized CPU implementation, which allows the analysis of high resolution video sequences in realtime.
Keywords KLT, feature point tracking, Lucas Kanade, corner detection, optical flow, motion estimation, GPU, CUDA
20 GraVisMa 2009
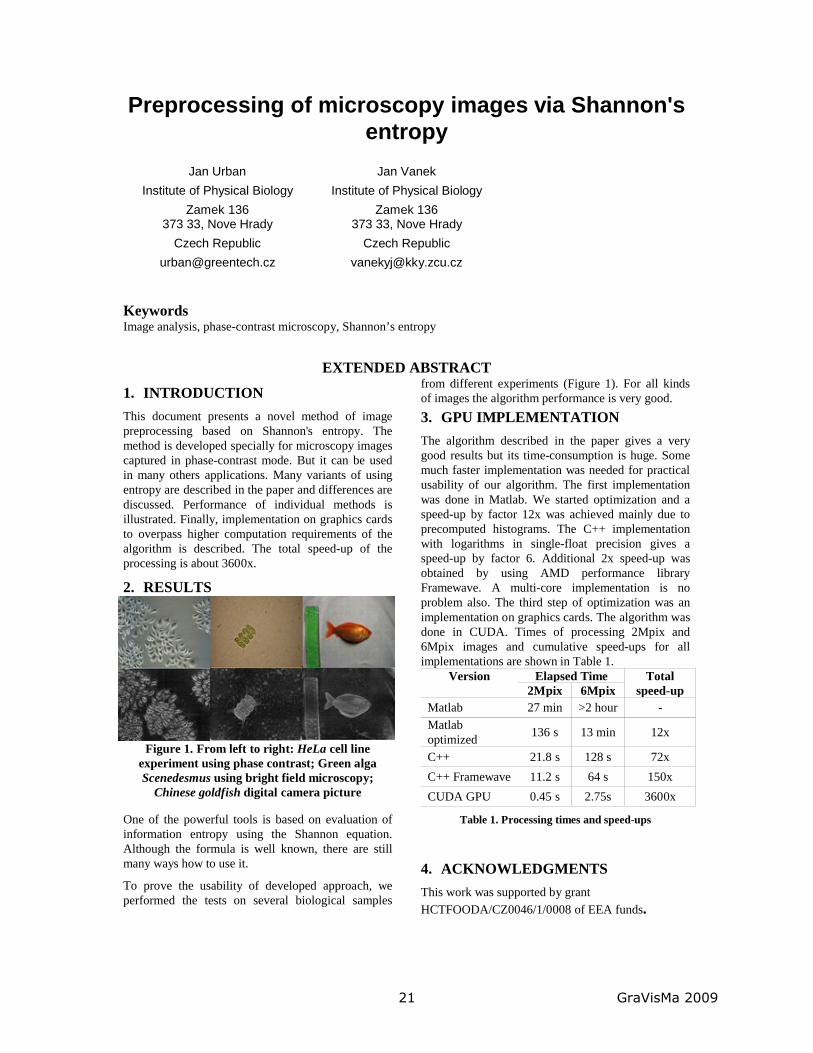
Preprocessing of microscopy images via Shannon's entropy
Jan UrbanInstitute of Physical Biology
Zamek 136373 33, Nove Hrady
Czech [email protected]
Jan VanekInstitute of Physical Biology
Zamek 136373 33, Nove Hrady
Czech [email protected]
KeywordsImage analysis, phase-contrast microscopy, Shannon’s entropy
EXTENDED ABSTRACT
1. INTRODUCTIONThis document presents a novel method of image preprocessing based on Shannon's entropy. The method is developed specially for microscopy images captured in phase-contrast mode. But it can be used in many others applications. Many variants of using entropy are described in the paper and differences are discussed. Performance of individual methods isillustrated. Finally, implementation on graphics cards to overpass higher computation requirements of the algorithm is described. The total speed-up of the processing is about 3600x.
2. RESULTS
Figure 1. From left to right: HeLa cell line experiment using phase contrast; Green alga Scenedesmus using bright field microscopy;
Chinese goldfish digital camera picture
One of the powerful tools is based on evaluation of information entropy using the Shannon equation. Although the formula is well known, there are still many ways how to use it.
To prove the usability of developed approach, weperformed the tests on several biological samples
from different experiments (Figure 1). For all kindsof images the algorithm performance is very good.3. GPU IMPLEMENTATIONThe algorithm described in the paper gives a verygood results but its time-consumption is huge. Some much faster implementation was needed for practical usability of our algorithm. The first implementation was done in Matlab. We started optimization and a speed-up by factor 12x was achieved mainly due to precomputed histograms. The C++ implementationwith logarithms in single-float precision gives a speed-up by factor 6. Additional 2x speed-up was obtained by using AMD performance library Framewave. A multi-core implementation is no problem also. The third step of optimization was an implementation on graphics cards. The algorithm was done in CUDA. Times of processing 2Mpix and 6Mpix images and cumulative speed-ups for all implementations are shown in Table 1.
Version Elapsed Time Totalspeed-up2Mpix 6Mpix
Matlab 27 min >2 hour -Matlab optimized 136 s 13 min 12x
C++ 21.8 s 128 s 72xC++ Framewave 11.2 s 64 s 150xCUDA GPU 0.45 s 2.75s 3600x
Table 1. Processing times and speed-ups
4. ACKNOWLEDGMENTSThis work was supported by grant HCTFOODA/CZ0046/1/0008 of EEA funds.
21 GraVisMa 2009
Integrated visualization of vector quantization by multidimensional scaling
Olga Kurasova
Institute of Mathematics and Informatics Akademijos str. 4
LT-08663, Vilnius, Lithuania [email protected]
Alma Molytė Institute of Mathematics and Informatics
Akademijos str. 4 LT-08663, Vilnius, Lithuania
Keywords Vector quantization, multidimensional data visualization, integrated visualization.
EXTENDED ABSTRACT Visualization is a powerful tool, assisted for a human being in the process of knowledge discovery in large data sets. The data represented in a visual form are more informative then the raw numeric data. Here we combine vector quantization and visualization. Vector quantization is a classical approximation method that usually forms a quantized approximation to the distribution of the input data vectors n
lX R , 1,...,l m , using a finite number
of codebook vectors niM R , 1,...,i N , here N is
the number of codebook vectors. Once the codebook is chosen, the approximation of Xl means finding the codebook vector (neuron) Mi closest to Xl [Koh01]. Here two methods based on neural networks are analyzed: self-organizing map (SOM) [Koh01] and neural gas (NG) [Mar91]. After the networks training, n-dimensional input vectors Xl have been mapped – each input vector is related to the nearest neuron. The neurons related with the input vectors are called neurons-winners. In the case of the rectangular topology of SOM, we can draw a simple table with cells corresponding to the neurons. However, the table does not answer the question, how much the vectors of the neighbouring cells are close in the n-dimensional space. A natural idea arises to apply the distance-preserving method to an additional visualization of the neurons-winners. Multidimensional scaling may be used for this purpose. Multidimensional scaling (MDS) refers to a group of methods that are widely used for a dimensionality reduction and visualisation of multidimensional data. The starting point of the multidimensional scaling is a matrix consisting of pairwise proximities
of the data. The goal of MDS is to find lower-dimensional vectors, such that the distances between the vectors in the lower-dimensional space were be as close to the original distances (or other proximities) as possible [Bor05]. In [Dze06], the integrated combination of SOM and the MDS-type method is proposed and discussed. Multidimensional vectors are visualized by MDS taking into account the process of SOM training. It is shown that smaller quantization errors are obtained by NG than SOM [Kur09], so it is purposeful to combine NG with MDS, too. In this paper, we propose the integrated combination of neural gas and multidimensional scaling.
REFERENCES [Dze06] Dzemyda, G., and Kurasova, O. Heuristic
Approach for Minimizing the Projection Error in the Integrated Mapping. European Journal of Operat. Research, 171(3), pp. 859–878, 2006.
[Bor05] Borg, I., and Groenen, P. Modern Multidimensional Scaling, Springer, 2005.
[Koh01] Kohonen, T. Self-Organizing Maps, 3rd ed, Springer Series in Information Science, 30. Springer, 2001.
[Kur09] Kurasova, O., and Molytė, A. Combination of Vector Quantization and Visualization. In: Perner, P. (ed.,) Machine Learning and Data Mining in Pattern Recognition, LNAI, 5632, pp. 29–43, 2009.
[Mar91] Martinetz, T.M., Schulten, K. J. A Neural-Gas Network Learns Topologies. In: Kohonen, T., Mäkisara, K., Simula, O., Kangas J. (eds.) Artificial Neural Networks, pp. 397–402, 1991.
22 GraVisMa 2009
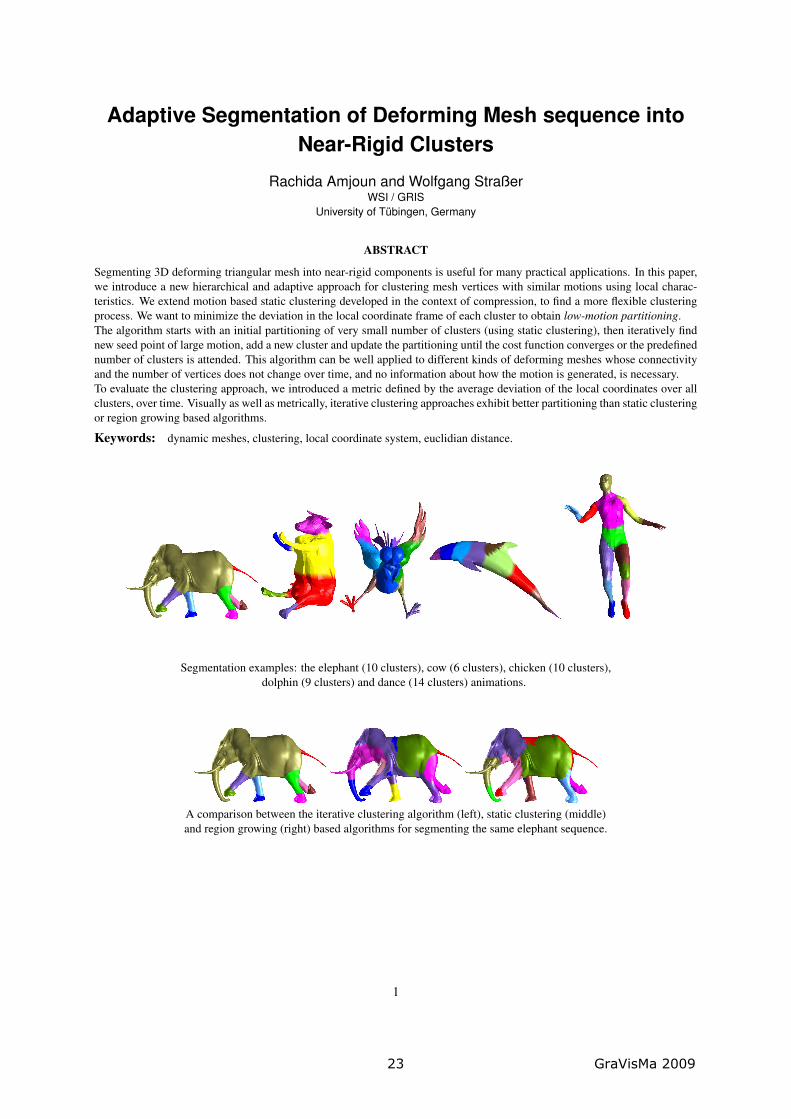
Adaptive Segmentation of Deforming Mesh sequence intoNear-Rigid Clusters
Rachida Amjoun and Wolfgang StraßerWSI / GRIS
University of Tübingen, Germany
ABSTRACT
Segmenting 3D deforming triangular mesh into near-rigid components is useful for many practical applications. In this paper,we introduce a new hierarchical and adaptive approach for clustering mesh vertices with similar motions using local charac-teristics. We extend motion based static clustering developed in the context of compression, to find a more flexible clusteringprocess. We want to minimize the deviation in the local coordinate frame of each cluster to obtain low-motion partitioning.The algorithm starts with an initial partitioning of very small number of clusters (using static clustering), then iteratively findnew seed point of large motion, add a new cluster and update the partitioning until the cost function converges or the predefinednumber of clusters is attended. This algorithm can be well applied to different kinds of deforming meshes whose connectivityand the number of vertices does not change over time, and no information about how the motion is generated, is necessary.To evaluate the clustering approach, we introduced a metric defined by the average deviation of the local coordinates over allclusters, over time. Visually as well as metrically, iterative clustering approaches exhibit better partitioning than static clusteringor region growing based algorithms.
Keywords: dynamic meshes, clustering, local coordinate system, euclidian distance.
Segmentation examples: the elephant (10 clusters), cow (6 clusters), chicken (10 clusters),dolphin (9 clusters) and dance (14 clusters) animations.
A comparison between the iterative clustering algorithm (left), static clustering (middle)and region growing (right) based algorithms for segmenting the same elephant sequence.
1
23 GraVisMa 2009
Using Geometric Algebra for Navigation in Riemannian and Hard Disc Space
Werner Benger
Center for Comp. & Technology Louisiana State University
239 Johnston Hall Baton Rouge, LA 70803, USA
Andrew Hamilton Center for Astrophysics and Space Astronomy
JILA, University of Colorado Boulder, CO 80309, USA
Mike Folk / Quincey Koziol The HDF Group
1901 So. First St. Suite C-2
Champaign, IL 61820. USA [email protected]
Simon Su Princeton Institute for
Computational Science and Engineering
345 Peter B. Lewis Library Princeton, NJ 08544, USA
Erik Schnetter Center for Comp. & Technology Dept. of Physics & Astronomy
Louisiana State University Baton Rouge, LA 70803, USA
Marcel Ritter / Georg Ritter Department of Computer Science
University of Innsbruck Technikerstrasse 21a
A-6020 Innsbruck, Austria [email protected]
A “vector” in 3D computer graphics is commonly understood synonymous to a triplet of three floating point numbers, eventually equipped with a set of functions operating on them. This hides the fact that there are actually different kinds of vectors, each of them with different algebraic properties and consequently different sets of functions. In this article we will discuss what meta-information is required to uniquely identify a specific type of vector in addition to its purely numerical values. Differential Geometry (DG) and Geometric Algebra (GA) are the appropriate mathematical theories to describe these different types of “vectors”. They consistently define the proper set of operations attached to each class of “floating point triplet”. We shortly review the various types of “vectors” in 3D computer graphics such as “normal” and “axial” vectors, their relations to rotations and quaternions, and connect these to the terminology of co-vectors and bi-vectors in DG and GA. We will elaborate on less known facts about the use of bi-quaternions in relativity, allowing for instance a more insightful formulation to determine the Newman-Penrose pseudo scalars from the Weyl tensor. We will show the concrete application of these concepts in two independently developed computer graphic software packages, where Geometric Algebra is used for navigating the camera position in space and time. It will be demonstrated that use of GA and the sometimes mystified concept of spinors eases implementation and intuition significantly. Another application example is given by a simulation code solving Einstein’s equation in general relativity numerically on supercomputers, outputting the Newman-Penrose pseudo scalars as primary quantities of interest to study gravitational waves, both for visualization and observational verification.
Beyond using these data types internally within an application in volatile memory, we will also describe how the metadata information required per “vector” can be provided in persistent storage, such as for writing datasets of vectors archived within files. Large datasets being expensively collected or generated by simulations requiring millions of CPU hours, it is increasingly important and difficult to be able to share and correctly interpret such datasets years after their generation, across different research groups from different fields of science. A unique, standardized, extensible identification of the geometric properties of the dataset elements is a necessary pre-requisite for this. Apart from visualization, post-processing and further analysis of existing or newly generated datasets is important in the high performance community (HPC). Frequently, different tools expecting different data formats have to be coupled in this analysis chain. Data have to be transferred between different HPC or data centers, and have to be converted to different file formats. A standard way of expressing geometric properties of non-scalar (vector or tensor) values can prevent conversion errors, similar to the way in which the IEEE standard for floating point values enables sharing floating point values. We utilize the mechanisms as provided by the HDF5 library here, a generic self-describing file format developed for large datasets as used in high performance computing. It allows specifying metadata in addition to the purely numerical data, providing an abstraction layer for specifying the mathematical properties on top of the lower-level binary layout. We will give concrete examples on how to use this abstraction layer to formulate vector properties for DG and GA, and discuss the benefits and potential that lays in this approach.
24 GraVisMa 2009
Goodness-of-fit tests for brightness distribution in grey level images
Jose A. Malpica Alcala University
Mathematics Department Escuela Politecnica E-225
Campus Universitario 28871 Madrid, Spain
Maria C. Alonso Alcala University
Mathematics Department Escuela Politecnica E-227
Campus Universitario 28871 Madrid, Spain
Keywords Kolmogorov-Smirnov test, low-level image similarity, Monte Carlo Sobol sequence, image retrieval.
EXTENDED ABSTRACT
1. INTRODUCTION The important of images analysis is increasing in many real world applications. Among the many operations that could be done with images, retrieval and matching are very common. Text-based image retrieval is used but its main limitation comes from the difficulty in describing an image with a limited, generally sort, number of words. An alternative is Content-Based Image Retrieval, which try to reinforce the low level visual feature analysis with the richness of human semantics. In the last few years many paper have being published in this area, a review can be seen in [Liu07]. They conclude that there is not a generic approach for high level semantic-based image retrieval. The research is on the specific application with limited results. A lot more research is needed in the characteristic of images; obtaining relevant in the low level feature could be crucial for the semantic level. Our paper concentrates on looking for good measurement for image matching and retrieval in the low level.
2. THE KS TEST The statistical comparison of distributions is important for data analysis. One popular method of comparing two empirical distributions is the test of Kolmogorov-Smirnov (KS) ([Kol33] , [Smi39]). This is a non-parametric tests relate to the greatest discrepancy between two cumulative distributions. The KS test was extended for data in two dimensions by Peacock (1983). Unlike for the one-dimensional case where the work of Kolmogorov gave a good yield for theoretical grounds, the Peacock´s KS test for two dimensions has no theoretical justification for asymptotic convergence; therefore the significance of
some parameters has to be found from numerical experimentation.
3. APLICATION TO IMAGES The KS test has been used in this paper to compare the brightness of two images, and a parameter is given in order to say if two images are similar or not. The test is performed in order to see if the values in the two images are coming from the same distribution and therefore are similar images. To do this the Sobol quasi-random sequence for two dimensions is used.
4. RESULTS The method is straightforward in the sense that there is not parameter tuning. Given the two images the method is going to tell is the images are similar or different to a signification level. The limitations are that is not rotational, translation or scale invariance.
5. REFERENCES [Kol33] Kolmogorov, A.N. Sulla determinizione
empirica di una legge di distribuzione (On the derivation of a distribution law) Giornale del´Istituto Italiano degli Attuari, 4, pp. 83-91, 1933.
[Liu07] Liu Y., D. Zhang, G. Lu and W.-Y. Ma. 2007. A survey of content-based image retrieval with high-level semantics. Pattern Recognition 40, No. 1, pp. 262-282, 2007.
[Smi39] Smirnov N.V. On the estimation of the discrepancy between empirical curves of distribution function for two independent samples. Bulletin of Mathematics University of Moscow, 2, pp 3-14, 1939.
25 GraVisMa 2009
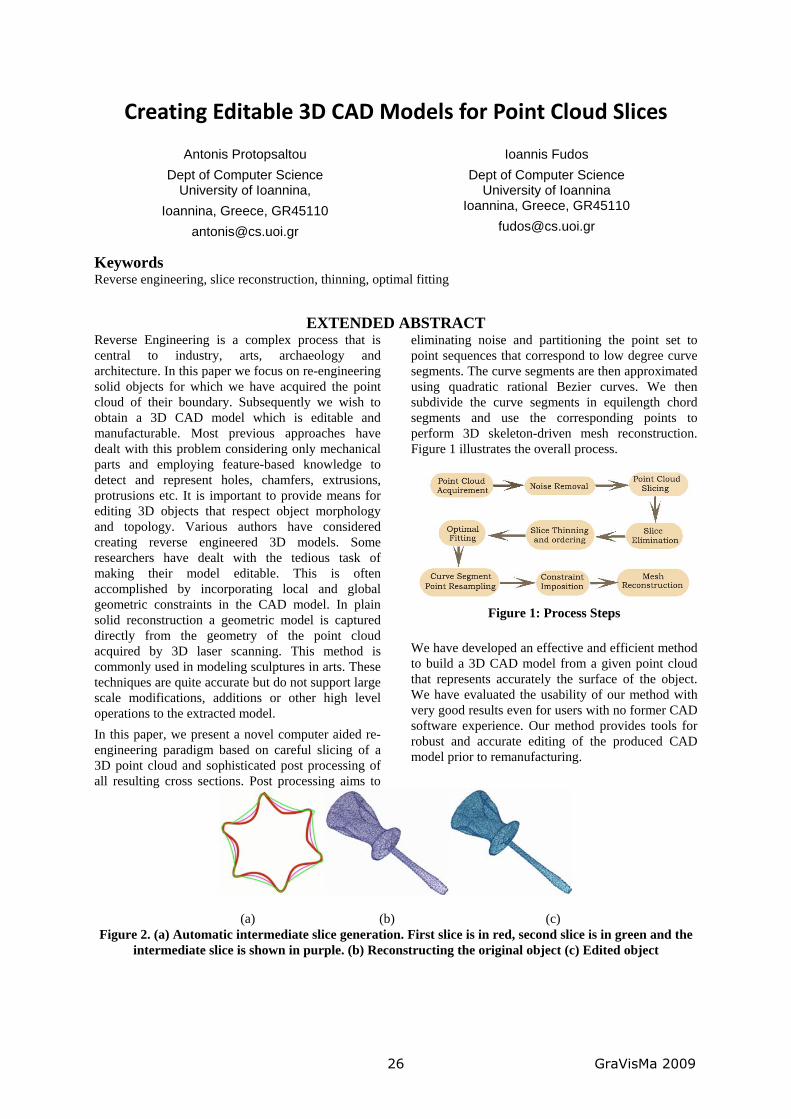
Creating Editable 3D CAD Models for Point Cloud Slices
Antonis Protopsaltou Dept of Computer Science
University of Ioannina, Ioannina, Greece, GR45110
Ioannis Fudos Dept of Computer Science
University of Ioannina Ioannina, Greece, GR45110
Keywords Reverse engineering, slice reconstruction, thinning, optimal fitting
EXTENDED ABSTRACT Reverse Engineering is a complex process that is central to industry, arts, archaeology and architecture. In this paper we focus on re-engineering solid objects for which we have acquired the point cloud of their boundary. Subsequently we wish to obtain a 3D CAD model which is editable and manufacturable. Most previous approaches have dealt with this problem considering only mechanical parts and employing feature-based knowledge to detect and represent holes, chamfers, extrusions, protrusions etc. It is important to provide means for editing 3D objects that respect object morphology and topology. Various authors have considered creating reverse engineered 3D models. Some researchers have dealt with the tedious task of making their model editable. This is often accomplished by incorporating local and global geometric constraints in the CAD model. In plain solid reconstruction a geometric model is captured directly from the geometry of the point cloud acquired by 3D laser scanning. This method is commonly used in modeling sculptures in arts. These techniques are quite accurate but do not support large scale modifications, additions or other high level operations to the extracted model. In this paper, we present a novel computer aided re-engineering paradigm based on careful slicing of a 3D point cloud and sophisticated post processing of all resulting cross sections. Post processing aims to
eliminating noise and partitioning the point set to point sequences that correspond to low degree curve segments. The curve segments are then approximated using quadratic rational Bezier curves. We then subdivide the curve segments in equilength chord segments and use the corresponding points to perform 3D skeleton-driven mesh reconstruction. Figure 1 illustrates the overall process.
Figure 1: Process Steps
We have developed an effective and efficient method to build a 3D CAD model from a given point cloud that represents accurately the surface of the object. We have evaluated the usability of our method with very good results even for users with no former CAD software experience. Our method provides tools for robust and accurate editing of the produced CAD model prior to remanufacturing.
(a) (b) (c) Figure 2. (a) Automatic intermediate slice generation. First slice is in red, second slice is in green and the
intermediate slice is shown in purple. (b) Reconstructing the original object (c) Edited object
26 GraVisMa 2009
Image normalization under projective transforms
Mashtalir Sergey
ass. prof. of Computer Science Department Kharkov National Univercity of Radio Electronics
Lenin Ave, 14 Ukraine, 61166, Kharkov
Putyatin Evgeniy
prof., chief of Computer Science Department Kharkov National Univercity of Radio Electronics
Lenin Ave, 14 Ukraine, 61166, Kharkov
Keywords Projective group, geometric image transformation, normalization
EXTENDED ABSTRACT 1. INTRODUCTION Image processing under geometrical transformations induced by change of a mutual location and/or orientation of object and video sensor has been widely considered for the last half of the century. Depending on the viewing conditions next models of transformations were used: translation, scaling, rotation, skewing, Euclidian motion, Euclidean similarities, Affine and projective groups of transformations. Starting with pioneer works [Hu62a, Ama66a], the progress development took two directions. First (the basic one) is a construction of invariants to the given kind of deformations. Second, named as image normalization, provides search of the transformation parameters and alignment (by back propagation) of the image to template. This approach besides recognition via comparing with the template, provides spatial transformations evaluations, i.e. perform the image tracking. It should be noted that the most valuable results have been obtained for the linear geometrical transformations. For the nonlinear image transformations till now the acceptable results were obtained in [Kin03a, Put90a] for separate subgroups of projective group only. In this paper on the base of groups representation theory a method for image projective transformations normalizators synthesis is proposed.
2. PROJECTIVE TRANSFORM The task is formulated as following. Let image B( , )x y be connected with some template 0B ( , )x y by the projective group effect, i.e.
011 12 13 21 22 23
31 32 33 31 32 33B ( , ) B( , )a x a y a a x a y ax y
a x a y a a x a y a+ + + +
=+ + + +
or in the homogeneous coordinates T T0 1B ( , , ) B(A( , , ) )z=u v z u v z= ,
where z , zx u y v= = , A is a projective transformation matrix, A 0det ≠ . Search of the
matrix parameters provides image normalization (alignment to the template). Projective transformations of the distortions are represented by the action of SL(3, ) group. The core of matrix A search method consists in constructing the equivariant mapping from the image space into the set of the homogeneous polynomials of second and forth order, and then quadratic form pairs. In other words images projective transformation are replaced by linear transformation and unknown parameters are defined by reducing the quadratic forms pair to canonical form. Unfortunately computational model of this procedure is rather complicated. Specifically for the concomitant constructing the images second derivatives are used, what tends to the significant reduce of stability. Nevertheless despite of the number of the limitations using the finite-dimensional representations of the geometrical transformations groups has certain perspectives for 3D object transformations evaluations.
REFERENCES [Ama66a] Amari, S. Theory of Normalization of
Pattern Signals in Feature Spaces. Electronic and Communication in Japan, Vol. 49, No. 7, pp.104-113, 1966.
[Hu62a] Hu, M.K. Visual pattern recognition by moment invariants, in IRE Transaction on Information Theory, Vol. IT-8, No. 2, pp.179-187, 1962.
[Kin03a]Kinoshenko D., Mashtalir V., Orlov A., Yegorova E. Method of Creating of Functional Invariants under One-Parameter Geometric Image Transformations. Pattern Recognition. Lecture Notes in Computer Science. Berlin-Heidelberg: Springer-Verlag. Vol. 2781, pp.68–75, 2003.
[Put90a]Putyatin Ye. P., Averin S.I. Image process-ing in robotics. Mashinostroyeniye, 1990, 319p.
27 GraVisMa 2009
Neural Network-Based Large Datasets Visualization Using a Reduced Training Subset
Viktor Medvedev
Institute of Mathematics and Informatics Akademijos str. 4
LT-08663 Vilnius, Lithuania
Gintautas Dzemyda
Institute of Mathematics and Informatics Akademijos str. 4
LT-08663 Vilnius, Lithuania
Keywords Neural Network, Visualization, SAMANN, Large Multidimensional Datasets, Parallel Computing.
EXTENDED ABSTRACT
1. INTRODUCTION The research area of this work is visualization of
large multidimensional datasets. Visualization is a
useful tool for data analysis, especially when the data
are unknown. However, if the dimension is huge, it is
difficult to produce robust visualization. Therefore,
the dimensionality reduction technique is needed.
The aim of the projection method is to represent the
input data items in a lower-dimensional space so that
certain properties of the structure of the data set were
preserved as faithfully as possible.
This paper focuses on dimensionality reduction
methods as a tool for the visualization of large
multidimensional datasets. The most common
methods allocate a representation of each data point
in a lower-dimensional space and try to optimize
these representations so that the distances between
them were as similar as possible to the original
distances of the corresponding data items.
2. DATA VISUALIZATION USING
NEURAL NETWORK SAMANN [Mao95], [Med06] is an unsupervised
backpropagation algorithm for training a multilayer
feed-forward neural network in order to perform
Sammon„s projection [Sam69]. This algorithm
preserves all the interpattern distances as well as
possible. The SAMANN network offers a
generalization ability of projecting new
multidimensional data, which are not present in the
original Sammon‟s algorithm.
A drawback of using SAMANN is that the training
process is extremely slow. The ways of speeding up
the network training process are: a) to use parallel
computing; b) to train the network by a subset of the
primary (multidimensional) datasets.
The investigations of the visualization quality using
the SAMANN neural network with sets of different
sizes of the primary datasets have showed that it is
possible to train the network using only a part of the
analyzed dataset without loss of accuracy. In this
work real datasets were used to investigate the ability
to visualize large multidimensional datasets using
SAMANN.
The results of experiments have shown that it is
suffices to form a subset of 5–10% of the analyzed
dataset for training the SAMANN network. In such
case, lower projection errors are obtained faster
(more than 10 times) than by training with all the
points of the set.
The usage of the reduced dataset for SAMANN
training enabled us to process large datasets and to
get good enough results within reasonable time.
Parallel computing has been used in the experiments
to find the optimal subset for the neural network
training.
3. ACKNOWLEDGEMENT The research is partially supported by the Lithuanian
State Science and Studies Foundation project
“Information technology tools of clinical decision
support and citizens wellness for e.Health system”
(No. B-07019).
4. REFERENCES [Sam69] Sammon, J.W. A Nonlinear Napping for
Data Structure Analysis, IEEE Transactions on
Computers 18, pp. 401–409, 1969.
[Mao95] Mao, J. and Jain, A.K. Artificial Neural
Networks for Feature Extraction and Multivariate
Data Projection, IEEE Trans. Neural Networks
Vol. 6, pp. 296–317, 1995.
[Med06] Medvedev, V. and Dzemyda, G.
Optimization of the SAMANN network training.
Journal of Global Optimization, Springer, Vol.
35(4), pp. 607–623, 2006.
28 GraVisMa 2009
Fourier and Wavelet Transformations in Geometric Algebra
Eckhard Hitzer
Department of Applied Physics University of Fukui
3-9-1 Bunkyo Japan 910-8507, Fukui
Keywords Clifford geometric algebra, quaternions, space-time algebra, multivector-valued functions, Clifford Fourier transform, Clifford wavelet transform, Clifford Gabor wavelets, uncertainty principle
EXTENDED ABSTRACT
First we introduce basic Geometric Algebra (GA) multivector functions. For these functions we define the coordinate independent vector differential and the vector derivative. This includes explicit examples and basic differential geometric calculus rules.
Then we motivate and define the GA Fourier Transformation (GA FT) for the GA of real Euclidean 3-space and give examples of its application. We give an overview of its most important properties (higher dimensional geometric generalizations of scalar complex Fourier Transformation properties). We show how to generalize the GA FT to higher dimensions and explain what role characteristic GA non-commutativity plays. Known applications include uncertainty, LSI filters (smoothing, edge detection), signal analysis, image processing, fast (multi)vector pattern matching, visual flow analysis, sampling, (multi)vector field analysis. GA FTs can be discretised and fast GA FT algorithms are available.
Next we introduce several types of socalled Quaternion Fourier Transformations (QFT). We explain their mutual relations, genuine 2D phase properties, their geometric transformation properties, discrete versions and fast numerical implementations. Applications include, partial differential systems, colour image processing, filtering, etc. Geometric Algebra relationships enable wide ranging higher dimensional generalizations. As an example we generalize to a Spacetime Fourier Transform, which naturally leads to multivector wave packet analysis in physics, and directional uncertainty, now with additional geometric insight.
While the GA FT is global, we introduce in the last part the local GA wavelet concept in the GA of real Euclidean 2-space and Euclidean 3-space, using 2D (3D) translations, dilations and rotations combined in the similitude group SIM(2), or SIM(3), respectively. Multivector mother wavelet functions need to fulfill the admissibility condition, which includes an admissibility constant with scalar and vector parts. We define the invertible GA wavelet transformation and discuss its main properties. An explicit example is the GA Gabor multivector wavelet. Generalizations to n = 2,3(mod 4) and in Cl0,n to n = 1,2 (mod 4) are straight forward.
ACKNOWLEDGMENTS Soli deo gloria. I do thank my dear family, B. Mawardi, A. Hayashi, D. Hildenbrand, V. Skala.
REFERENCES [Hitz07] Hitzer, E. Quaternion Fourier Transform on
Quatern. Fields and Generalizations, Adv. in Appl. Clifford Algebras, 17(3), pp. 497-517 (2007).
[Hitz08] Hitzer, E., and Mawardi, B. Clifford Fourier Transform on Multivector Fields and Uncertainty Principles for Dimensions n = 2 (mod 4) and n = 3 (mod 4), in P. Angles (ed.), Adv. App. Cliff. Alg. Vol. 18(S3,4), pp. 715-736 (2008).
[Hitz09] Hitzer, E. Real Clifford Algebra Cln,0, n = 2,3(mod 4) Wavelet Transform, submitted to T. E. Simos et al., (eds.), Proc. of ICNAAM 2009.
[Maw07] Mawardi, B. and Hitzer, E. Clifford Algebra Cl(3,0)-valued Wavelet Transf., Clifford Wavelet Uncertainty Inequality and Clifford Gabor Wavelets, Int. J. of Wavelets, Multires. and Inf. Proc., 5(6), pp. 997-1019 (2007).
29 GraVisMa 2009
Geometric Algebra Computers
Dietmar HildenbrandTU Darmstadt, Germany
ABSTRACT
In this paper, we investigate computers suitable for geometric algebra algorithms. While these geometric algebra computersare working in parallel, the algorithms can be described on a high level without thinking about how to parallelize them. In thiscontext two recent developments are important. On one hand, there is a recent development of geometric algebra to an easyhandling of engineering applications, especially in computer graphics, computer vision and robotics. On the other hand, thereis a recent development of computer platforms from single processors to parallel computing platforms which are able to handlethe high dimensional multivectors of geometric algebra in a better way.Geometric algebra covers a lot of other mathematical systems like vector algebra, complex numbers, Plücker coordinates,quaternions etc. and it is geometrically intuitive to work with. Furthermore there is a lot of potential for optimization and paral-lelization. We present our geometric algebra compilation approach for current and future hardware platforms like reconfigurablehardware, multi-core architectures as well as modern GPGPUs.
Keywords: Geometric algebra, GPGPU, multi-core-architecture, Verilog, OpenCL, CUDA, OpenMP, Ct, Larrabee.
1 EXTENDED ABSTRACT
The foundation of geometric algebra was laid in 1844by Hermann Grassmann whose 200th birthday we arecelebrating this year. His work was continued by theEnglish mathematician W. K. Clifford in 1878. Due tothe early death of Clifford, the vector analysis of Gibbsand Heaviside dominated most of the 20th century,and not the geometric algebra. Geometric algebra hasfound its way into many areas of science, since DavidHestenes treated the subject in the ’60s. In particular,his aim was to find a unified language for mathematics,and he went about to show the advantages that couldbe gained by using geometric algebra in many areas ofphysics and geometry. Many other researchers followedand showed that applying geometric algebra in theirfield of research can be advantageous, e.g. in engineer-ing areas like computer graphics, computer vision androbotics. During the past decades, especially from 1986until 2002, processor performance doubled every 18months. Currently, this improvement law is no longervalid because of technical limitations. Now, we can rec-ognize a shift to parallel systems and most likely thesesystems will dominate the future. Thanks to multi-corearchitectures or powerful graphics boards for instancebased on the CUDA technology from NVIDIA or onthe future Larrabee technology of INTEL, one can ex-pect impressive results using the powerful language ofgeometric algebra.
There is already a very advanced pure software solu-tion called Gaigen as well as some pure hardware so-lutions geometric algebra algorithms (see a survey in[2]).
We propose to combine the advantages of both soft-ware and hardware solutions. We use a two-stage com-
pilation approach for geometric algebra algorithms. Ina first step we optimize geometric algebra algorithmswith the help of symbolic computing. This kind of op-timization results in very basic algorithms leading tohighly efficient software implementations. These algo-rithms, foster a highly degree of parallelization whichare then used for hardware optimizations in a secondstep. As examples for geometric algebra computers wepresent
• a FPGA(field programmable gate array) implemen-tation of an inverse kinematics algorithm. This so-lution is about 300 times faster [1] (3 times by soft-ware optimization and 100 times by additional hard-ware optimization) than the conventional softwareimplementation.
• examples on how to implement geometric algebraalgorithms on multi-core architectures. Multivec-tors of a n-dimensional geometric algebra are 2n-dimensional. Since all of their coefficients can becomputed in parallel, arbitrary geometric productsbenefit a lot from highly parallel structures.
• a OpenCL/CUDA implementation for arbitrary geo-metric products.
REFERENCES[1] Dietmar Hildenbrand, Holger Lange, Florian Stock, and Andreas
Koch. Efficient inverse kinematics algorithm based on confor-mal geometric algebra using reconfigurable hardware. In GRAPPconference Madeira, 2008.
[2] Dietmar Hildenbrand, Joachim Pitt, and Andreas Koch. Gaalop- high performance parallel computing based on conformal ge-ometric algebra. In Eduardo Bayro-Corrochano and GeraldScheuermann, editors, Geometric Algebra Computing for Engi-neering and Computer Science. Springer, 2009.
30 GraVisMa 2009
Determining an Even Versor in n-D Geometric Algebrafrom the Known Transformation of n Vectors
Leo DorstUniversity of Amsterdam, The Netherlands, [email protected]
ABSTRACTSuppose we only know of some elements how an evenversor transforms them, how do we then solve for theunknown versor V ? We present a method that worksin n-D geometric algebra for n exactly known vectorcorrespondences.
The method is based on the definition of a quantityDk, defined as the sum of reconstructions of the projec-tions of the versor V on basis k-blades:
Dk = ∑(nk ) basis k-blades X
X r (XcV )/V,
where X r denotes the reciprocal of X on the chosen ba-sis.
• On the one hand, we demonstrate that this quantityDk can be computed from the data for any k, whenone knows the correspondence “ xi goes to x′i ” be-tween n independent vectors (i = 1, · · · ,n).
The crucial step is to show that any k-blade X inthe expression (XcV )/V is expressible as a weightedsum of geometric products of the xi and x′i. To bespecific, for k = 1 this is:
(xicV )/V = 12 (xi V −V xi)/V = 1
2 (xi− x′i),
in which we recognize the chord xi under the trans-formation; for k = 2 it is:
((xi∧ x j)cV )/V = 14 (xi x j− xi x′j + x j x′i− x′j x′i).
The computability of Dk for other k is demonstratedby giving an iterative recipe.
• On the other hand, Dk can be shown to be directlyrelated to weighted sum of the parts of various gradeVK of the versor V :
Dk =n
∑K=0,2,···
(Kk )VK/V,
using result (2.41) from [4].
We demonstrate that from these equivalences, one canalways construct a set of independent linear equationsto find the VK/V from the measured correspondences,and with that exactly determine the original versor V(modulo an irrelevant scale) through:
V/V0 = (1−∑K
VK/V )−1.
This method leads to a closed form solution for V/V0for any dimension n. As such, it is more structuralthan an ad hoc method for low-dimensional cases in [4](their pg. 111).
We show that our method includes the useful spe-cial case (from [6]) that the rotor in R3 rotating aframe (e1,e2,e3) to a frame (e′1,e
′2,e′3) is proportional
to 1 + ∑i e′i eri (where the superscript r denotes the re-
ciprocal).But we can apply the method much beyond that: in
the conformal model of geometric algebra for instance[1, 3, 5], it can be used to determine a Euclidean mo-tion in 3-D from a frame correspondence. The required5 conformal vector correspondences are then: the framelocation, the three frame directions, and the invarianceof the point at infinity. We prove that this rigid bodymotion versor is proportional to 8− 5D1 + 2D2, orequivalently to 1−D2 +5D4 (among several alternativeforms).
However, the method can not be applied to determinean arbitrary conformal transformation from point andframe data alone, since crucial weight information onthe versor transformation is then lacking. In that case,one should use [2] instead (which incidentally uses ourn-D Euclidean result for part of its computation).
Keywords: geometric algebra, versor, correspondencedata, conformal model, Euclidean motion, rigid bodymotion
REFERENCES[1] P. Anglès, Conformal Groups in Geometry and Spin
Structures, PMP 50, Birkhäuser, 2008.[2] C. Cibura, L. Dorst, From Exact Correspondence Data
to Conformal Transformations in Closed Form UsingVahlen Matrices, GRAVISMA 2009.
[3] L. Dorst, D. Fontijne, S. Mann, Geometric Algebra forComputer Science, Morgan Kaufmann, 2007.
[4] D. Hestenes, G. Sobczyk, Clifford Algebra to Geomet-ric Calculus,
[5] D. Hestenes, A. Rockwood, H. Li, System for encod-ing and manipulating models of objects, U.S. Patent6,853,964, granted February 8, 2005
[6] J. Lasenby, A.N. Lasenby, C.J.L. Doran, W.J. Fitzger-ald, New Geometric Methods for Computer Vision: anapplication to structure and motion estimation, IJCV36(3), pp.191-213, 1998.
31 GraVisMa 2009
Exponentials and Motions in Geometric Algebra
Leon Simpson
Department of Mechanical Engineering University of Bath
Bath BA2 7AY, United Kingdom [email protected]
Glen Mullineux
Department of Mechanical Engineering University of Bath
Bath BA2 7AY, United Kingdom [email protected]
ABSTRACT The use of geometric algebra to generate rigid body motions is investigated. In particular, means for handling the exponential function within the algebra are presented and used to create smooth motions.
Keywords Geometric algebra, exponential function, smooth motion, interpolation.
1. EXPONENTIALS AND MOTIONS The ideas of geometric (Clifford) algebras have been known since the 1800’s. However they fell into disuse, and interest was only regained in the last ten years or so. Now they are used in a number of areas, including quantum physics and computer vision. One particular application is in describing smooth motions, such as the kinematics of robotic systems and mechanisms [Etz99]. In this context, and in others, the use of geometric algebra is closely related to the use of quaternions and dual quaternions [Pur08].
A consequently relevant question is whether it is possible to use geometric algebra to represent rigid body transforms (translations and rotations) in the same form. This has been shown to be possible [Mul04] provided that the square of one of the basis vectors is either infinite or zero. The former approach is effected by treating infinity as the reciprocal of a small real scalar which is allowed to become vanishingly small. The geometry thus modelled is a projective geometry, in this case RP3.
One of the reasons why quaternions, in particular, are now used regularly for rotations in computer graphics is the ability to interpolate using them in equal steps [Sho85]. This has given rise to the construction known as the slerp, which effectively makes use of the exponential function. Exponentials can also be used in a similar fashion in conformal geometric algebra [War08] and with matrix representations of transforms [Ozg07].
The aim of this paper is to investigate the use of the exponential function in the geometric algebra model of projective geometry, and in particular how to deal with the vanishingly small terms.
The exponential is constructed in two equivalent ways. The first makes use of an isomorphic representation of the algebra as matrices over the quaternions. The second is a direct application of the power series, making allowance for the fact that more than one even grade element can induce the same rigid body transform. Use is made of Chasles’s theorem to obtain the logarithm function.
Finally, the use of the exponential function to obtain smooth motions interpolating points is described.
2. REFERENCES [Etz99] Etzel, K. R. and McCarthy, J. M.
Interpolation of spatial displacements using the Clifford algebra of E4. Journal of Mechanical Design, 121, pp. 39-44, 1999.
[Mul04] Mullineux, G. Modelling spatial displacements using Clifford algebra. Journal of Mechanical Design, 126, pp. 420-424, 2004.
[Ozg07] Özgören, M. K. Kinematics analysis of spatial mechanical systems using exponential rotation matrices. Journal of Mechanical Design, 129, pp. 1144-1152, 2007.
[Pur08] Purwar, A., Jin, Z. and Ge, Q. J. Rational motion interpolation under kinematic constraints of spherical 6R closed chains. Journal of Mechanical Design, 130, pp 062301:1-9, 2008.
[Sho85] Shoemake, K. Animating rotation with quaternion curves. ACM Siggraph, 19, pp. 245-254, 1985.
[War08] Wareham, R. and Lasenby, J. Mesh vertex pose and position interpolation using geometric algebra. In: Articulated Motion and Deformable Objects, Springer, pp. 122-131, 2008.
32 GraVisMa 2009
From Exact Correspondence Data to ConformalTransformations in Closed Form Using Vahlen Matrices
Carsten CiburaUniversiteit van Amsterdam
Leo DorstUniversiteit van Amsterdam
ABSTRACT
1 ABSTRACT
In the present paper we will derive a method to deter-mine a conformal transformation in 3D in closed formgiven exact correspondences between data. We willshow that a minimal dataset needed for correspondencein arbitrary-dimensional Euclidean space is a localizedvector frame and an additional point.
In order to determine the conformal transformationwe will use the representation of the conformal modelof geometric algebra by Vahlen matrices [1].
Conformal transformations are locally angle-preserving. They map circles to circles and are closelyrelated to analytic - that is (complex) differentiable -functions. Classically, they are studied in the complexplane, which somewhat restricts their applicability tocomplex-valued or two-dimensional problems. How-ever, there is a framework that seems naturally suitedfor conformal transformations in arbitrary dimensions:the conformal model of geometric algebra (CGA).
First and foremost it employs geometric algebra,which introduces the invertible but non-commutinggeometric product between vectors in order to establisha graded algebra over a given vector space. Secondly,it enhances a Euclidean vector space Rn of arbitrarydimension n to a Minkowski space Rn+1,1 of dimensionn + 2 and signature (n + 1,1). As a result vectors andmultivectors from that geometric algebra G (Rn+1,1)can be thought of as representing geometric objects inthe n-dimensional Euclidean space. Moreover, certainelements of CGA, so-called even versors, can be usedto perform conformal transformations on the objectsrepresented in this way.
More specifically, given an object x and an even ver-sor s, the conformally transformed object x′ is givenby x′ = sxs−1. If, in this equation, we treat the versors as a variable to be determined from correspondencedata x and x′, we encounter a number of complications.First of all, while the geometric product is linear, theMinkowski signature of the base space makes straight-forward application of well-established methods fromlinear algebra impossible. Secondly, since the geo-metric product is not commutative, the two-sided ver-sor product makes it difficult to isolate s and solve for
it. Also, the higher dimension of the enhanced vectorspace slightly increases the complexity of the problem.
Crucial insights on how to solve this problem aregained from the study of Möbius transformations andVahlen matrices [3]. The most general conformal trans-formation can be expressed as the most general Möbiustransformation acting on points by fractional lineartransformation. I.e. in the complex case, it can be ex-pressed as C 3 z 7→ z′ = az+b
cz+d ∈ C with a, b, c, d beingcomplex valued constants. This makes the transforma-tions accessible by matrix algebra. Enhancing a com-plex number by homogeneous coordinates, we can rep-resent z' ( z
1) and find z′ '(
z′1
)'
(az+bcz+d
)=
(a bc d
)( z
1).The matrix M =
(a bc d
)representing the Möbius trans-
formation - i.e. fulfilling a number of constraints - withentries a,b,c,d ∈ C is called a Vahlen matrix.
The concept of Vahlen matrices can be extended toCGA. Then the versor equation can be expressed in ma-trix notation. By introducing intermediate transforma-tions with very simple matrix representations and en-forcing the algebraic conditions for a Vahlen matrix wecan reduce the problem to finding a Euclidean rotor thataligns two given vector frames by pure rotation.
Thus, the result is a reversion to the n-dimensionalEuclidean base space and a decomposition of the nec-essary equations into geometrically meaningful parts.By this we are able to present an algorithm for a closedform solution for the even versor s given data corre-spondences x and x′ as in the equation above. A count-ing argument on the degrees of freedom present in thecorrespondence data and the generality of the formulasused suggests that our method is applicable in arbitrarydimensions n employing methods introduced in [2].
Keywords: Geometric Algebra, Versors, Closed-FormSolution, Conformal Mappings, Conformal Transfor-mations, Differentiable, Vahlen
REFERENCES[1] Leo Dorst. Conformal geometric algebra by extended vahlen
matrices. In GraVisMa, 2009.
[2] Leo Dorst. Determining an even versor in n-d geometric algebrafrom the known transformation of n vectors. In GraVisMa, 2009.
[3] Udo Hertrich-Jeromin. Introduction to Möbius Differential Ge-ometry. Cambridge University Press, 2003.
33 GraVisMa 2009
A Monogenic Signal on the Two-Sphere with Applications inOmnidirectional Vision
Oliver FleischmannCognitive Systems Group
University of Kiel, [email protected]
Lennart WietzkeCognitive Systems Group
University of Kiel, [email protected]
Gerald SommerCognitive Systems Group
University of Kiel, [email protected]
ABSTRACT
The analytic signal and its two-dimensional extension, the monogenic signal, are valuable representations in signal processingand are able to detect the features local phase, local orientation and local amplitude. They are based on the Hilbert transformon the real line and the Riesz transform in the upper half plane. Problems incomputer vision require the analysis of sphericalsignals but so far no analogue to the monogenic signal exists on the sphere. We use the Hilbert transform on the two-sphereknown from Clifford analysis to construct a monogenic signal on the two-sphere and a corresponding Poisson scale space. Itsinterpretation is given by an expansion into spherical harmonics which allows the rotation invariant detection of the featureslocal orientation, local phase and local amplitude on the two sphere. We provide a scale invariant feature detector on thetwo-sphere in terms of the new spherical monogenic signal and apply it toomnidirectional images obtained by catadioptriccameras.
Keywords: Feature detection, Scale invariant features, Spherical signals, Spherical convolution, Clifford analysis, Scalespace, Cauchy transform, Hilbert transform
1 INTRODUCTIONAn important task in low-level signal processing is the de-tection of certain features, depending on a chosen signalmodel. In one-dimensional signal processing the propertieslocal phase and local amplitude of a sinuoid signal are valu-able features that describe the signal structure. They are ob-tained by the analytic signal [3], which is based on the Hilberttransform of the signal. The extension of the analytic sig-nal to the Euclidean plane is known as the monogenic sig-nal [2]. The underlying signal model are intrinsically one-dimensional signals in the plane. In addition to the featureslocal amplitude and local phase it is able to determine thelocal orientation of these signals. Instead of relying on theone-dimensional Hilbert transform, it is based on its two-dimensional extension also known as the Riesz transform.Computer vision tasks often require the processing of spher-ical input signals like omnidirectional images. It is thereforedesirable to construct a monogenic signal on the two-sphere.We construct a monogenic signal on the sphere with the helpof the Hilbert transform on the two-sphere known from Clif-ford analysis [1].
2 PRELIMINARIESIn the Clifford analysis setting, the classical Hilbert transformarises as the non-tangential boundary value of the Cauchytransform in the upper half plane with the real line as itsboundary. This concept can be extended to the upper halfspaceR
n+ where it is known as the Riesz transform. In the
Fourier domain they act as multipliers which allow an intu-itive interpretation in the frequency space. Furthermore theCauchy transforms naturally provides a scale space concept,the Poisson scale space. The Hilbert transform on the two-sphere can also be defined as the non-tangential boundaryvalue of the Cauchy transform in the unit ball. Nonetheless,in its convolution integral nature, it prohibits an intuitive in-terpretation.
3 OUR WORKWe interpret the Hilbert transform as a group convolution overthe rotation groupSO(3) and expand it into a Fourier series.We obtain a Fourier series expansion of the convolution ker-nels in terms of its spherical harmonic coefficients. It turnsout that the components of the Hilbert transform on the two-sphere act as angular derivative operators on the solution ofthe Dirichlet problem in the unit ball with respect to the az-imuthal and zenithal angles. Therefore we obtain, in analogueto Gaussian derivatives which arise as derivatives of the heatequation solution, derivatives in the Poisson scale space con-cept. The resulting features that can be obtained by this modelare local orientation, local phase and local amplitude of thesignal projected to plane tangent to the sphere at the point ofinterest. We construct a feature detector on the two-sphere.Instead of the Gaussian scale space we use the Poisson scalespace which arises naturally from the Cauchy transform. Pos-sible applications are image matching and object detection inomnidirectional images.
REFERENCES[1] R. Delanghe. On some properties of the Hilbert transform in
Euclidean space.Bull. Belg. Math. Soc. Simon Stevin, 11(2):163–180, 2004.
[2] M. Felsberg and G. Sommer. The monogenic signal.IEEE Trans-actions on Signal Processing, 49(12):3136–3144, 2001.
[3] D. Gabor. Theory of communication.Journal of the IEE (Lon-don), 93:429–457, 1946.
1
34 GraVisMa 2009
Rigid body motion and conformal geometric algebra
Anthony LasenbyUniversity of Cambridge
Astrophysics GroupCavendish Laboratory
Cambridge, CB3 0HE, [email protected]
Chris DoranUniversity of Cambridge
and Geomerics Ltd.Sidney Sussex College
Cambridge, [email protected]
Robert LasenbyUniversity of Cambridge
St. John’s CollegeCambridge
CB2 1TP, [email protected]
KeywordsConformal geometric algebra; rigid body dynamics; fast frictional dynamics.
EXTENDED ABSTRACT
1 INTRODUCTIONRigid body dynamics is a still-thriving field of classicalmechanics. Modern applications include not just real-world objects, but objects inside a computer. The abilityto be able to calculate rigid body motion quickly and ef-ficiently is important, for example, in computer graph-ics and gaming. In the extension to the case where rigidbodies interact via contact forces and friction, very so-phisticated effects are possible if many bodies and theirinteractions can be treated simultaneously via an under-lying fast method.
The idea of the work described here is to look atthe Conformal Geometric Algebra (CGA) approach torigid body dynamics, where we work in an overall spacethat is 2 dimensions higher than the base 3d Euclideanspace. The CGA as a tool for geometry was first in-troduced by David Hestenes [Hes01], and has been de-veloped by several others (e.g. [Las05, DL03]). Like-wise the application to rigid bodies has been pursuedby many. However, in our view there are still somegaps in this which mean that it is useful to attempt acoherent unified treatment, based on a Lagrangian for-mulation, and with the idea of covariance under rigidtranslations and rotations at its heart. Furthermore, theapplication is not limited to non-interacting rigid bod-ies, but seeks to parallel the fast treatment of multipleinteracting rigid bodies developed in [KEP05] knownas ‘Fast Frictional Dynamics’ (FFD).
Our setup has three positive square basis vectors, e1,e2, e3, with two extra vectors adjoined, e and e, satisfy-ing e2 = +1, e2 =−1. (See [DL03] for notation, whichdiffers from that in [Hes01].) From these we form thenull vectors n = e+ e and n = e− e. The representationfunction we will use has the origin as −n/2, i.e.
X =1
2λ 2
(x2n+2λx−λ
2n)
where x is the ordinary position vector in Euclidean 3-space, and λ is a positive scalar giving the dimensionsof length.
The overall idea is to set up a Lagrangian which is co-variant with respect to the 5d geometry, but for which
the energy is just the ordinary 3d rigid body energy.Then we should get equations of motion which are cor-rect at the 3d level, but covariantly expressed in 5d.Additionally, the way we will express the current stateof the rigid body configuration is via a combined rota-tion/translation rotor, so that translations and rotationsare integrated as much as possible. Expressing positionX in space in terms of position on a reference body Xref,via X = ψXrefψ , where ψ is a 5d spinor, we find that thecorrect Lagrangian is the scalar part of
−12
ΩB·I(ΩB)−µ(ψψ −1)− IUψψ −V (ψnψ −n)
where µ is a scalar, I the 5d pseudoscalar, U and V aregeneral 5d vectors appearing as Lagrange multipliersand I(ΩB) is the 5d ‘inertia tensor’, which is a functionof the body angular velocity (again in 5d) ΩB.
From these beginnings, we show how motion undergravity can be incorporated, and then consider the ef-fects of external forces and torques, which are unifiedwithin the 5d representation. Interacting bodies are thenconsidered, and some details given of adapting thesemethods to parallel the FFD development of [KEP05].Finally video demonstrations showing how the motionsof large numbers of interacting bodies can be computedsuccessfully in real-time in this approach will be given.
REFERENCES[DL03] C. Doran and A.N. Lasenby. Geometric Algebra for Physi-
cists. Cambridge University Press, 2003. Paperback edi-tion, 2007.
[Hes01] D. Hestenes. Old wine in new bottles: a new algebraicframework for computational geometry. In E. Bayro-Corrochano and G. Sobczyk, editors, Geometric Algebrawith Applications in Science and Engineering, page 3.Birkauser, Boston, 2001.
[KEP05] Danny M. Kaufman, Timothy Edmunds, and Dinesh K.Pai. Fast frictional dynamics for rigid bodies. In SIG-GRAPH ’05: ACM SIGGRAPH 2005 Papers, pages 946–956, New York, NY, USA, 2005. ACM.
[Las05] A.N. Lasenby. Recent applications of conformal geometricalgebra. In H. Li, P.J. Olver, and G. Sommer, editors, Com-puter Algebra and Geometric Algebra with Applications(Lecture Notes in Computer Science), page 298. Springer,Berlin, 2005.
35 GraVisMa 2009
Precise Image Resampling Algorithm
Pavel Zemcik
Faculty of Information Technology Brno University of Technology
Bozetechova 2 CZ 612 66, Brno, Czech Republic
Bronislav Pribyl
Faculty of Information Technology Brno University of Technology
Bozetechova 2 CZ 612 66, Brno, Czech Republic
ABSTRACT This contribution introduces a precise image resampling image intended for corrections of image distortions
caused by lenses or similar devices. The algorithm is intended for correction of small distortions in terms of pixel
displacement but with very high subpixel precision. The geometrical description of the correction is through a
square mesh with a displacement specified for each node of the mesh and bi-linear position interpolation is used
inside the squares. The contribution describes the algorithms itself, its features, implementation issues and data
formats and also discusses implementation issues specifically for programmable hardware (FPGA).
Keywords Image resampling, lens distortion, subpixel resampling.
1. INTRODUCTION Image acquisition processes are often affected
through imperfections of lenses or other image
acquisition equipment. The geometry of such image
distortions is often known or can be measured. In
some applications, the knowledge of the distortion
can be used at some point of the algorithm fro
compensation, in other algorithms this approach is
difficult or impossible and it is necessary to “correct”
the raster image. The correction process, however, is
relatively difficult to define and sometimes it can be
time-consuming. This contribution introduces a
precise subpixel resampling algorithm that is possible
to implement in software and also in programmable
hardware, such as FPGA. The full contribution will
describe more application and mathematics
background and literature references.
2. RESAMPLING METHOD The resampling method introduced here is intended
for small changes in the image geometry. Therefore,
angular changes in the image are not expected. The
resampling is performed through application of 2D
FIR convolution core. For performance reasons, only
separable FIR convolution cores are considered. The
convolution cores are selected for each output pixel
separately (from a table) based on the subpixel
position of the center of pixel in the original iamge.
While this approach presents a small limitation in
resampling core features, it allows for much higher
implementation efficiency comparing to the cores that
are not separable. The maximum considered
resampling core is 7x7 samples. While this is not
critical in the principle, the size limit is reasonable
from the point of view of preserving the frequency
features of the resulting image (limitation of
maximum spatial frequency) and also from the point
of implementation.
The actual contribution will introduce description of
the convolution cores used and their features as well
as the mathematics background.
3. IMPLEMENTATION ISSUES Implementation issues of the presented algorithm are
critical from the point of view of performance and
precision.
First, the discussion of the pixel formats will be
shown. The pixel formats (bit width) has an important
effect on the necessary precision of the intermediate
values on the algorithm. Next, the precision of the
pixel co-ordinates will be given. This is important
from the point of view of FIR core selection. Also,
the overall efficient structure of the algorithm and its
possible block diagram will be shown. Finally, the
results of FPGA implementation of the algorithm will
be shown. The current status indicates that
implementation in FPGA capable of processing of 50
MPixels/s or more is possible.
4. CONCLUSIONS In the conclusions, the contribution will summarize
the results and applications along with the intended
future implementation work. Additionally, the
literature references will be included.
36 GraVisMa 2009
Mining and Visualizing Web Logs for Users Behavior Analysis
Virginijus Marcinkevčius
Institute of Mathematics and Informatics
Akademijos str. 4 LT-08663 Vilnius, Lithuania
Viktor Medvedev
Institute of Mathematics and Informatics
Akademijos str. 4 LT-08663 Vilnius, Lithuania
Keywords Web Logs, Data Mining, Visualization, Users Behavior.
EXTENDED ABSTRACT
1. INTRODUCTION Web sites access logs contain substantial data about
user access patterns. Properly exploited, the logs can
reveal useful information about each user’s interests
in a site; but restructuring a site’s structure to
individual user interests increases the computation at
the Web server to an impractical degree. One way to
solve this problem is to group users on the basis of
their Web interests and then organize the site’s
structure according to the needs of different groups.
The visualization methods play an important role in
exploratory data analysis, where visual
representations can help to build up an understanding
of the content [Kei02]. Most of the currently
availably Web site analysis tools provide only
explicitly and statistical information without real
useful knowledge.
Knowledge discovery in databases (KDD) process
can be used for this purpose. KDD process consists
of two main phases: Web log preprocessing in order
to get multidimensional data and data mining. In this
paper for data mining we are using clustering, pattern
discovery, classification methods to transform
multidimensional data into suitable form for
investigation. In this paper for investigation we use a
data visualization methods to discover hidden
relationships among the Web Logs data. The
clustering and visualization algorithms (unsupervised
learning algorithm Self Organizing Map (SOM),
SAMANN) [Bri07, Med07] can be used to discover
usage patterns from Web logs. The introduced
methods perform clustering of input data and map it
to a two-dimensional space, doing analysis and
visualization at the same time. In our approach, with
the Web usage data from high dimensional input data
a two-dimensional projection (map) of Web usage
patterns with different clusters could be formed
The main goal of this paper is to use these clusters to
analyze visitors of the website and characterize or
distinguish them in way to improve the structure of
the website. We extracted some features from the
web logs and used combined data mining methods
(clustering and visualization) for this purpose.
The data used for the paper are the web pages and
corresponding access logs of the Institute of
Mathematics and Informatics: www.mii.lt
2. ACKNOWLEDGMENTS The research is partially supported by the Lithuanian
State Science and Studies Foundation project
“Information technology tools of clinical decision
support and citizens wellness for e.Health system”
(No. B-07019).
3. REFERENCES [Bri07] P. Britos, D. Martinelli, H. Merlino, and R.
Garcia-Martinez. Web usage mining using self
organized maps. IJCSNS International Journal of
Computer
Science and Network Security, 7(6):45–50, 2007
[Kei02] D. A. Keim. Information visualization and
visual data mining. IEEE Transactions on
Visualization and Computer Graphics, 8(1):1–8,
2002.
[Med07] V. Medvedev. Tiesioginio sklidimo
neuroniniu tinklu taikymo daugiamaciams
duomenims vizualizuoti tyrimai. PhD thesis,
Matematikos ir informatikos
institutas, 2007
37 GraVisMa 2009
About contour words of balls in tessellations of thehyperbolic plane
Maurice MargensternUniversite Paul Verlaine− Metz
LITA, EA 3097, UFR-MIMIle du Saulcy, 57045 METZ Cedex, FRANCE
Email: [email protected] automata, iterated pushdown automata, tilings, hyperbolic plane, tessellations, contour words.
1. INTRODUCTION
In this paper, we give an application of iterated push-down automata to contour words of balls in infinitely manytilings of the hyperbolic plane. We extend this result to thetiling 5, 3, 4 of the hyperbolic3D space and to the tiling5, 3, 3, 4 of the hyperbolic4D space as well. These twolatter applications cannot be generalized to any dimensionas,starting from dimension 5, there is no tiling of the hyperbolicspace which would be a tessellation generated by a regularpolytope.
2. ITERATED PUSHDOWN AUTOMATA
Here, we follow the notations of [1] where references oniterated pushdown automata can be found. We refer to thispaper and to [4] for formal definitions and an illustrativeexample on the language of the words1fn , wherefn is theFibonacci sequence withf0 = f1 = 1.
Intuitively, an iterated pushdown automaton is defined fromthe notion of iterated satck. Ank+1-iterated stack is a stackof k-iterated stacks, where a 0-stack is reduced to the emptyword. The i-stacks are labelled by the elements of a finitealphabetΓ, fixed in advance.
We are provided with a functiontopsym which gives the topof the stack and, recursively, as the content of the top is aniterated stack, the top of the just stored stack. Similarly,wecan pop any element which is accessed by functiontopsymas well aspush a new element on the tops accessed by thefunction.
A k-iterated pushdown automaton is a finite automatonwhich works with ak-iterated stack. Each time it reads a letterof the imput word, the automaton performs an operation,popor push on the iterated stack,ǫ-transition being allowed. Aword is accepted if, when completely read, the stack is empty.The recognized language is the set of accepted words.
3. COUNTOUR WORDS IN TESSALLATIONS OFTHE HYPERBOLIC PLANE
We assume the reader to be familiar with hyperbolic geome-try. We also refer him/her to [2], [3] for both an introduction to
this field with suitable references and the definition of specifictools underlying the proofs of the result stated in the paper.
A tessellation is a tiling generated from a regular polygonby reflection in its sides and, recursively, of the images in theirsides. In the Euclidean case, there are only three tessellationsup to similarities. In the hyperbolic plane, there are infinitelymany of them denoted byp, q, wherep is the number ofsides of the polygon andq is the number of them needed toexactly cover a small enough neighbour of any vertex. Weshall focus on the tilingsp, 4 andp+2, 3.
In this setting, a path joining two tilesP andQ is a finitesequence of tilesTi0≤i≤n with T0 = P , Tn = Q and Ti
sharing a side withTi+1 for 0 ≤ i < n. The distance betweenthe tiles is the length of a shortest path. A ball of radiusk
around a tileA is the set of tiles whose distance fromA isat mostk. Denote it byBk(A). Its border,∂Bk(A), is the setof tiles whose distance fromA is k. Let wk be the number oftiles on∂Bk(A). Then, acontour word of a ball in the tilingp, 4 or p+2, 3 is a word of the form1wk .
Then, we can state:Theorem 1: see [4]− The language of the contour words
of the balls in p, 4 and that of the balls in p+2, 3 canbe recognized by a 2-iterated pushdown automaton. This isalso the case for the balls in 5, 3, 4, the tessellation ofthe hyperbolic 3D space by the rectangular dodecahedron,and also for the balls in 5, 3, 3, 4, the tessellation of thehyperbolic 4D space by the 120-cell.
ACKNOWLEDGMENT
The author would like to thank Professor Vaclav Skala forinviting him to present this work atGraVisMa’2009.
REFERENCES
[1] Fratani S., Senizergues G., Iterated pushdown automata and sequences ofrational numbers,Annals of pure and applied logic, 141, (2006), 363-411.
[2] Margenstern M., Cellular Automata in Hyperbolic Spaces, Volume 1,Theory,OCP, Philadelphia, (2007), 422p.
[3] Margenstern M., Cellular Automata in Hyperbolic Spaces, Volume 2,Implementation and computations,OCP, Philadelphia, (2003), 360p.
[4] Margenstern M., Iterated pushdown automata and hyperbolic contourwords,arXiv:0907.4957, (2009), 15p.
38 GraVisMa 2009
Hyperspectral Images: Compression and Visualization
Bruno Carpentieri D.I.A. - Università di Salerno 84081 Fisciano (SA), Italia
Keywords Hperspectral Images, Data Compression, Visualization
EXTENDED ABSTRACT Remote acquisition of high definition electro-optic images has been increasingly used in military and civilian applications. These air-borne and space-borne acquired hyperspectral images are used to recognize objects and to classify materials on the surface of the earth. It is possible to recognize the materials pictured in the hyperspectral image by analyzing the spectrum of the reflected light. Hyperspectral detector technologies have made possible the recording a large number of spectral bands over the visible and reflected infrared region. These instruments have sufficient spectral resolution to allow an accurate characterization of the spectral reflectance curve of a given spatial area. As an example, the images acquired with the NASA JPL’s Airborne Visible/Infrared Imaging Spectrometer (AVIRIS) have pixels covering an area of approximately 20x20 meters, with reflectance decomposed into 224 narrow bands, approximately 10nm wide each, in the range 400 to 2,500nm, the spectral components are represented with a 16 bits precision. Higher resolution, space-borne spectrometers will be available in the near future. In fact, increasing the number of bands, i.e. the spectral resolution, allows for more sophisticated analysis and increases the data rate by only a linear amount. The acquisition of hyperspectral images produces huge amounts of highly correlated data (e.g., in the range 140MB to 1GB for AVIRIS images) that are stored as a two dimensional image matrix where each pixel consists of many components, one for each spectral band (e.g., 224 16-bit values for a pixel in an AVIRIS image). This brings an important need for efficient compression. Since hyperspectral imagery is acquired at significant cost and often used in delicate tasks (for instance classification or target detection), compression algorithms that provide lossless or near lossless quality are generally required. Moreover it may be desirable to have low complexity that allows efficient on board implementation with limited hardware, when the compression task has to be
carried out on an airplane or a satellite before transmitting the data to the base. Remote sensed images, like AVIRIS, show two forms of correlation: spatial (the same material tends to be present in many adjacent pixels) and spectral (one band can be fully or partly predicted from other bands). For hyperspectral images the spectral correlation is much stronger than the spatial correlation. Furthermore, dynamic range and noise levels (instrument noise, reflection interference, aircraft movements, etc.) of AVIRIS data are higher than those in photographic images. For these reasons the standard image compression techniques, as for instance the spatial predictor of LOCO I, fail on this kind of data. Spectral oriented Least SQuares (SLSQ) is a lossless hyperspectral image compressor that uses least squares to optimize the predictor for each pixel and each band. In this paper we describe SLSQ and show experimental results with AVIRIS images. SLSQ is the current state of the art in hyperspectyral image compression. Each band in an hyperspectral image can be seen as a two-dimensional image. By visualizing the content of each band it becomes clear that the spectral correlation is high between most of the bands, but it is also clear that a few consecutive bands are not strongly spectrally correlated. This can lead to improvements to the SLSQ algorithm if we take into account the possibility of using different predictors for different bands.
REFERENCES [NASA] NASA, “AVIRIS home page,”
http://popo.jpl.nasa.gov , February 2003. [Rizzo et al.] F. Rizzo, B. Carpentieri, G. Motta, and
J. A. Storer, “Low Complexity Lossless Compression of Hyperspectral Imagery via Linear Prediction”, IEEE Signal Processing Letters, Vol. 12, n.. 2, pp. 138-141, February 2005, ISSN:1070-9908.
39 GraVisMa 2009
Hypergraph-based software visualization
Peter Kapec
Faculty of Informatics and Information Technologies Slovak University of Technology
Ilkovičova 3 842 16, Bratislava, Slovakia
Keywords Software visualization, hypergraphs, zoom interface
EXTENDED ABSTRACT
1. INTRODUCTION In this paper an alternative approach to software visualization is presented based on hypergraph representation of software artifacts. Our approach builds upon known techniques that rely on graphs for visualization. Using hypergraph formalism offers significant advantages not only in the visualization process but also in data preparation, filtering and context retrieval. Our aim is to create a unified graphical environment that is capable to visualize relations between various levels of software artifacts, ranging from source code up to the project management tasks.
2. SOFTWARE VISUALIZATION Software visualization is an ongoing research direction. Although in past twenty-thirty years many software visualization systems were created, current software engineers program in textual languages and use standard 2D GUI interfaces. Several fully visual programming languages have been developed, but their usability in practice is very limited and questionable. However the benefits of software visualization in software comprehension were already shown [Lew02]. Many software visualization systems use graphs to present software in a more understandable way. Our aim is to generalize the visualization process by using hypergraphs instead.
3. HYPERGRAPHS Hypergraphs are generalized graphs in which an edge can connect more than two nodes [Aui02]. This property allows us to represent more complicated relations between several objects for which standard graphs would require several additional nodes and edges. In our approach nodes represent different software artifacts and edges represent different relations between them. Using hypergraphs as data repositories allows us to look at software as knowledge. This unified structure enables us to query
relevant information and visualize results directly. Query syntax is also based on hypergraph notation and queries always produce hypergraphs as results.
4. VISUALIZATION Software artifacts and their relations represented through hypergraphs can be visualized using common graph visualization techniques, because hypergraphs can be transformed into bipartite graphs. For the purpose of our context sensitive GUI we plan to use force directed layout algorithms [Coh92]. Instead of using graphical programming languages we use common text editors embedded in hypergraph nodes displayed in 3D space. The text editors are also positioned using the force directed layout algorithm and are displayed as billboards floating in space. This is more familiar for developers and allows us to use existing programming languages. Developers can quickly zoom out for overview, focus on nodes for relations and may edit code if needed – all in the spirit of information seeking mantra principle [Shn04]. 1
5. REFERENCES [Aui02] Auillans, e.a. A formal model for topic maps.
ISWC '02, Springer-Verlag, pp. 69-83, 2002.
[Coh92] Cohen, F.R. A Framework for Dynamic Graph Drawing, Congressus Numerantium, vol. 42, pp 149-160, 1992.
[Lew02] Lewerentz, C., Simon, F. Metrics-based 3D Visualization of Large Object-Oriented Programs. Proc. VISSOFT'02, 2002.
[Shn04] Shneiderman, B., and Plaisant, C. Designing the User Interface: Strategies for Effective Human-Computer Interaction (4th Edition). Pearson Addison Wesley, 2004
1This work was partially supported by the grant VG 1/0822/08: Intelligent embedded systems.
40 GraVisMa 2009
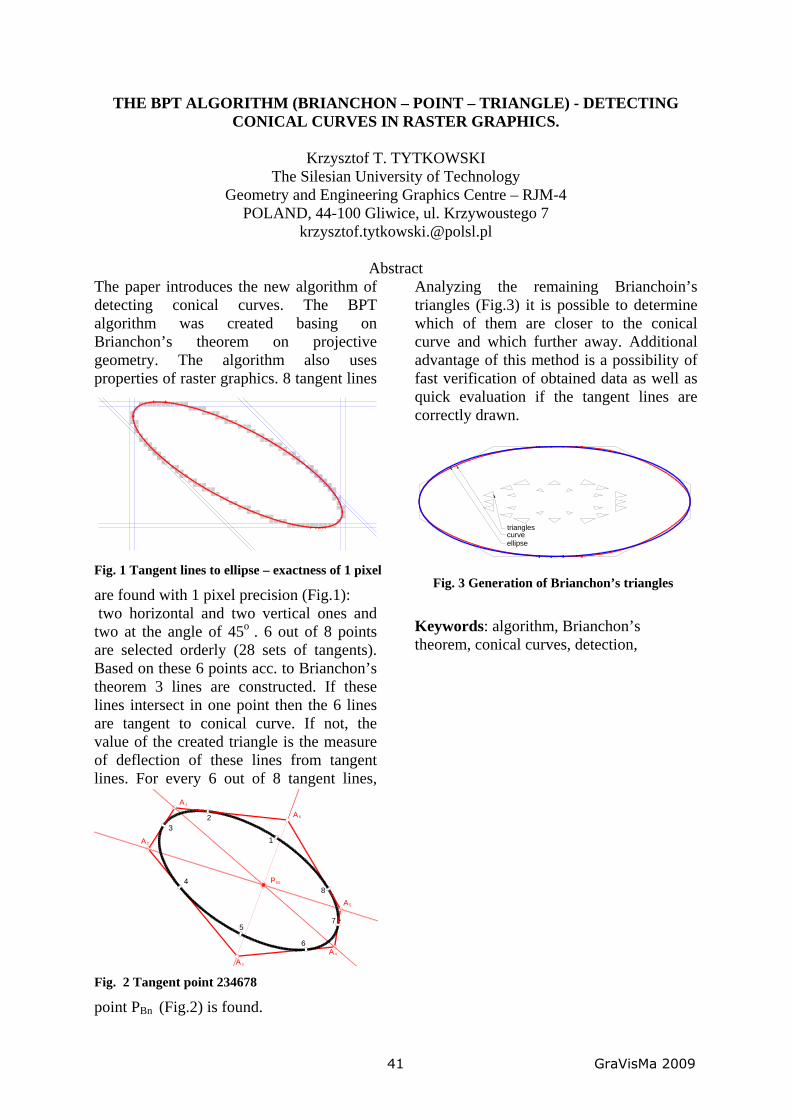
THE BPT ALGORITHM (BRIANCHON – POINT – TRIANGLE) - DETECTING CONICAL CURVES IN RASTER GRAPHICS.
Krzysztof T. TYTKOWSKI
The Silesian University of Technology Geometry and Engineering Graphics Centre – RJM-4
POLAND, 44-100 Gliwice, ul. Krzywoustego 7 [email protected]
Abstract
The paper introduces the new algorithm of detecting conical curves. The BPT algorithm was created basing on Brianchon’s theorem on projective geometry. The algorithm also uses properties of raster graphics. 8 tangent lines
are found with 1 pixel precision (Fig.1): two horizontal and two vertical ones and two at the angle of 45o . 6 out of 8 points are selected orderly (28 sets of tangents). Based on these 6 points acc. to Brianchon’s theorem 3 lines are constructed. If these lines intersect in one point then the 6 lines are tangent to conical curve. If not, the value of the created triangle is the measure of deflection of these lines from tangent lines. For every 6 out of 8 tangent lines,
point PBn (Fig.2) is found.
Analyzing the remaining Brianchoin’s triangles (Fig.3) it is possible to determine which of them are closer to the conical curve and which further away. Additional advantage of this method is a possibility of fast verification of obtained data as well as quick evaluation if the tangent lines are correctly drawn.
Keywords: algorithm, Brianchon’s theorem, conical curves, detection,
Fig. 1 Tangent lines to ellipse – exactness of 1 pixel
A6
A1
A4
A5
1
23
4
5
6
7
8
A2
PB1
Fig. 2 Tangent point 234678
curveellipse
triangles
Fig. 3 Generation of Brianchon’s triangles
41 GraVisMa 2009
The Three Point Perspective Pose Estimation Problem revisited with invariants obtained from polynomial triangulation and interval analysis
François AntonTechnical University of DenmarkDepartment of Informatics and
Mathematical ModellingRichard Petersens Plads
2800 Kongens Lyngby, [email protected]
Henrik AanæsTechnical University of DenmarkDepartment of Informatics and
Mathematical ModellingRichard Petersens Plads
2800 Kongens Lyngby, [email protected]
Fredrik KahlLund University
Centre for Mathematics, Division of Mathematics,
PO Box 118, 221 00 Lund, Sweden
Extended Abstract
A very common reference cited in many publications that deal with the three point perspective pose estimation problem is revisited in this paper. Our main contribution is first a methodology for automated derivation of
invariants from the triangulation of the algebraic system defining the three point perspective pose estimation problem, then the application of this methodology to get an exhaustive analysis of the geometrical invariants that
intervene in the three point perspective pose estimation problem, and finally it is the use of an hybrid methodology combining the triangularized system obtained by Wu's algorithm and interval analysis to get the
actual solving of the three point perspective pose estimation problem in a concrete case.
Keywordsthree point perspective pose, invariants, Gröbner bases, interval analysis, Wu's algorithm
1. INTRODUCTION
In this paper the three point perspective pose (finding the position of a camera from three known points) is revisited [HLON94]. Three point perspective pose is one of the fundamental problems of photogrammetry and computer vision, e.g. a cornerstone of robot navigation. To the best of our knowledge, there does not exist a comprehensive treatment of the geometrical invariants involved in the three point perspective pose estimation problem. Also, there does not seem to exist an automated methodology to get the geometrical invariants from a given system of algebraic equations. There have been some specialized methodologies to get the invariants for specific problems. Our main contribution is twofold: the automated derivation of geometrical invariants from a system of algebraic equations and the application of this methodology to the exhaustive analysis of the geometrical invariants of the three point perspective pose estimation problem.
2. METHODOLOGY
Starting from the system of equations defining the zero-dimensional algebraic set of the problem, we are following Wu's algorithm or Buchberger's algorithm to transform the initial system into an equivalent system such that at least one variable of the problem has been eliminated from the two polynomials having the lowest leading monomials in the graded reverse lexicographic order. By regrouping all the formal coefficients for each monomial, we get polynomials that are invariants for the given problem. We rewrite the original system by replacing the invariant polynomials by new formal coefficients. We repeat the process until the system has been triangularized. We apply it to the three point perspective pose estimation problem where the triangularized system is solved using interval analysis. We obtain the syzygies of the invariants by applying the Buchberger or Wu's algorithm on the invariants.
42 GraVisMa 2009

Posters
43 GraVisMa 2009
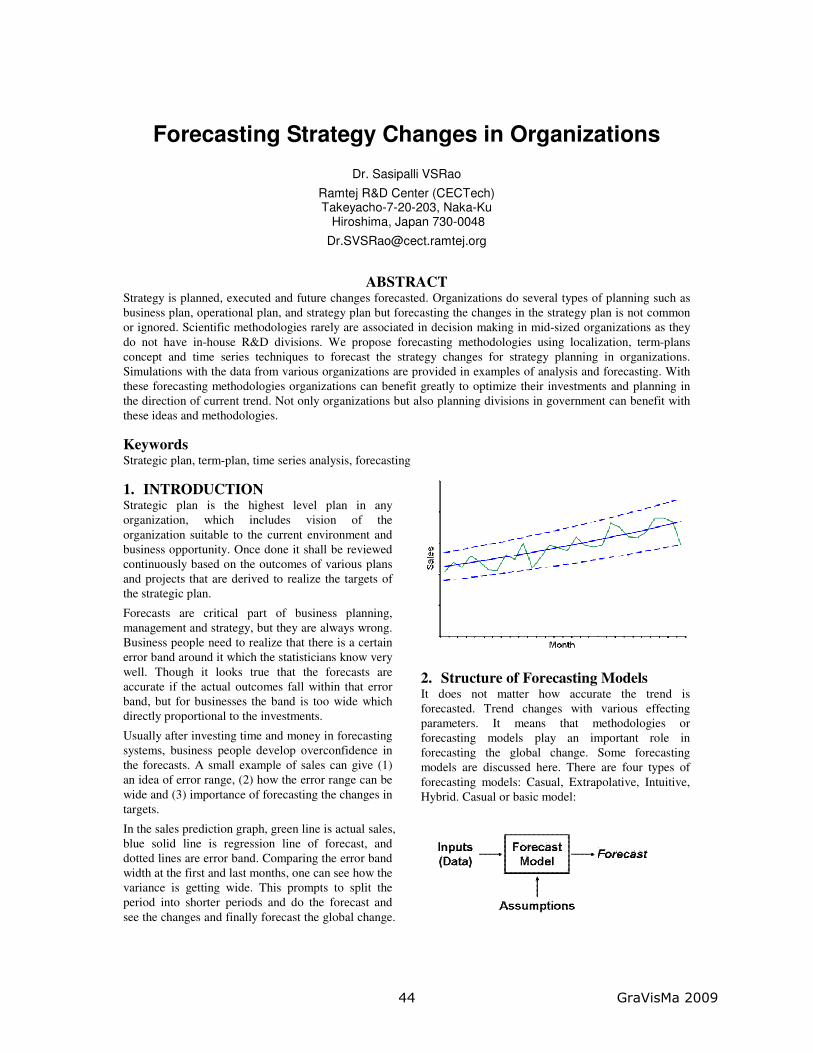
Forecasting Strategy Changes in Organizations
Dr. Sasipalli VSRao Ramtej R&D Center (CECTech) Takeyacho-7-20-203, Naka-Ku Hiroshima, Japan 730-0048 [email protected]
ABSTRACT Strategy is planned, executed and future changes forecasted. Organizations do several types of planning such as business plan, operational plan, and strategy plan but forecasting the changes in the strategy plan is not common or ignored. Scientific methodologies rarely are associated in decision making in mid-sized organizations as they do not have in-house R&D divisions. We propose forecasting methodologies using localization, term-plans concept and time series techniques to forecast the strategy changes for strategy planning in organizations. Simulations with the data from various organizations are provided in examples of analysis and forecasting. With these forecasting methodologies organizations can benefit greatly to optimize their investments and planning in the direction of current trend. Not only organizations but also planning divisions in government can benefit with these ideas and methodologies.
Keywords Strategic plan, term-plan, time series analysis, forecasting
1. INTRODUCTION Strategic plan is the highest level plan in any organization, which includes vision of the organization suitable to the current environment and business opportunity. Once done it shall be reviewed continuously based on the outcomes of various plans and projects that are derived to realize the targets of the strategic plan.
Forecasts are critical part of business planning, management and strategy, but they are always wrong. Business people need to realize that there is a certain error band around it which the statisticians know very well. Though it looks true that the forecasts are accurate if the actual outcomes fall within that error band, but for businesses the band is too wide which directly proportional to the investments.
Usually after investing time and money in forecasting systems, business people develop overconfidence in the forecasts. A small example of sales can give (1) an idea of error range, (2) how the error range can be wide and (3) importance of forecasting the changes in targets.
In the sales prediction graph, green line is actual sales, blue solid line is regression line of forecast, and dotted lines are error band. Comparing the error band width at the first and last months, one can see how the variance is getting wide. This prompts to split the period into shorter periods and do the forecast and see the changes and finally forecast the global change.
2. Structure of Forecasting Models It does not matter how accurate the trend is forecasted. Trend changes with various effecting parameters. It means that methodologies or forecasting models play an important role in forecasting the global change. Some forecasting models are discussed here. There are four types of forecasting models: Casual, Extrapolative, Intuitive, Hybrid. Casual or basic model:
44 GraVisMa 2009
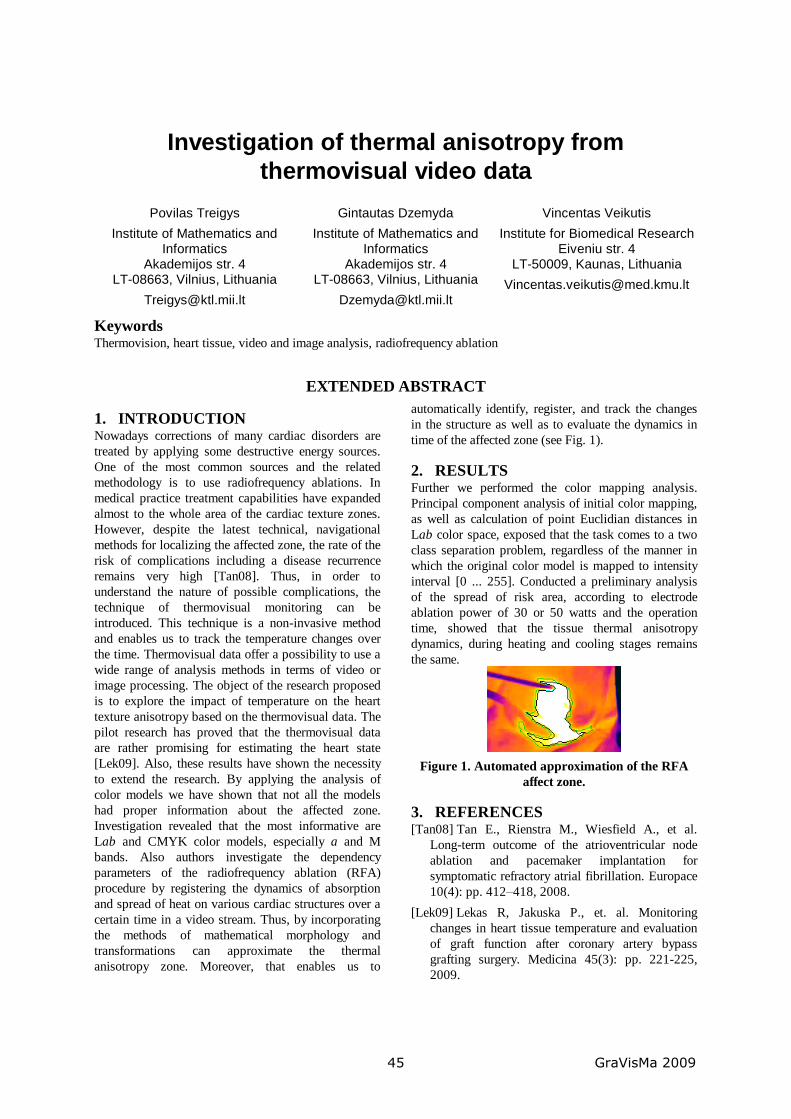
Investigation of thermal anisotropy from
thermovisual video data
Povilas Treigys
Institute of Mathematics and Informatics
Akademijos str. 4 LT-08663, Vilnius, Lithuania
Gintautas Dzemyda
Institute of Mathematics and Informatics
Akademijos str. 4 LT-08663, Vilnius, Lithuania
Vincentas Veikutis
Institute for Biomedical Research Eiveniu str. 4
LT-50009, Kaunas, Lithuania
Keywords Thermovision, heart tissue, video and image analysis, radiofrequency ablation
EXTENDED ABSTRACT
1. INTRODUCTION Nowadays corrections of many cardiac disorders are
treated by applying some destructive energy sources.
One of the most common sources and the related
methodology is to use radiofrequency ablations. In
medical practice treatment capabilities have expanded
almost to the whole area of the cardiac texture zones.
However, despite the latest technical, navigational
methods for localizing the affected zone, the rate of the
risk of complications including a disease recurrence
remains very high [Tan08]. Thus, in order to
understand the nature of possible complications, the
technique of thermovisual monitoring can be
introduced. This technique is a non-invasive method
and enables us to track the temperature changes over
the time. Thermovisual data offer a possibility to use a
wide range of analysis methods in terms of video or
image processing. The object of the research proposed
is to explore the impact of temperature on the heart
texture anisotropy based on the thermovisual data. The
pilot research has proved that the thermovisual data
are rather promising for estimating the heart state
[Lek09]. Also, these results have shown the necessity
to extend the research. By applying the analysis of
color models we have shown that not all the models
had proper information about the affected zone.
Investigation revealed that the most informative are
Lab and CMYK color models, especially a and M
bands. Also authors investigate the dependency
parameters of the radiofrequency ablation (RFA)
procedure by registering the dynamics of absorption
and spread of heat on various cardiac structures over a
certain time in a video stream. Thus, by incorporating
the methods of mathematical morphology and
transformations can approximate the thermal
anisotropy zone. Moreover, that enables us to
automatically identify, register, and track the changes
in the structure as well as to evaluate the dynamics in
time of the affected zone (see Fig. 1).
2. RESULTS Further we performed the color mapping analysis.
Principal component analysis of initial color mapping,
as well as calculation of point Euclidian distances in
Lab color space, exposed that the task comes to a two
class separation problem, regardless of the manner in
which the original color model is mapped to intensity
interval [0 ... 255]. Conducted a preliminary analysis
of the spread of risk area, according to electrode
ablation power of 30 or 50 watts and the operation
time, showed that the tissue thermal anisotropy
dynamics, during heating and cooling stages remains
the same.
Figure 1. Automated approximation of the RFA
affect zone.
3. REFERENCES [Tan08] Tan E., Rienstra M., Wiesfield A., et al.
Long-term outcome of the atrioventricular node
ablation and pacemaker implantation for
symptomatic refractory atrial fibrillation. Europace
10(4): pp. 412–418, 2008.
[Lek09] Lekas R, Jakuska P., et. al. Monitoring
changes in heart tissue temperature and evaluation
of graft function after coronary artery bypass
grafting surgery. Medicina 45(3): pp. 221-225,
2009.
45 GraVisMa 2009