Embed Size (px)
Citation preview
© 2007 Thomson South-Western

© 2007 Thomson South-Western
Consumers, Producers and the Efficiency of Markets
• Revisiting the Market Equilibrium – Do the equilibrium price and quantity maximize
the total welfare of buyers and sellers?– Market equilibrium reflects the way markets
allocate scarce resources. – Whether the market allocation is desirable can be
addressed by welfare economics.

© 2007 Thomson South-Western
Consumers, Producers and the Efficiency of Markets
• Welfare Economics– Welfare economics is the study of how the
allocation of resources affects economic well-being.
– Buyers and sellers receive benefits from taking part in the market.
– The equilibrium in a market maximizes the total welfare of buyers and sellers.

© 2007 Thomson South-Western
Consumers, Producers and the Efficiency of Markets • Welfare Economics
– Equilibrium in the market results in maximum benefits, and therefore maximum total welfare for both the consumers and the producers of the product.

© 2007 Thomson South-Western
Consumers, Producers and the Efficiency of Markets
• Welfare Economics– Consumer surplus measures economic welfare
from the buyer’s side.– Producer surplus measures economic welfare from
the seller’s side.

© 2007 Thomson South-Western
CONSUMER SURPLUS• Willingness to pay is the maximum amount
that a buyer will pay for a good.
• It measures how much the buyer values the good or service.
© 2007 Thomson South-Western
CONSUMER SURPLUS
• Consumer surplus is the buyer’s willingness to pay for a good minus the amount the buyer actually pays for it.
© 2007 Thomson South-Western
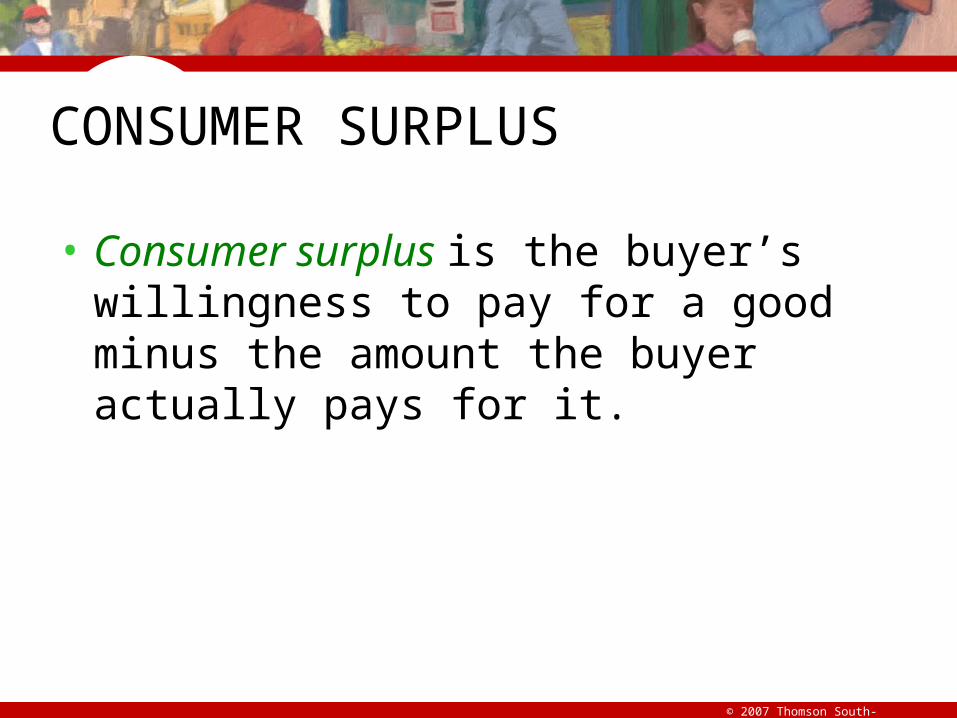
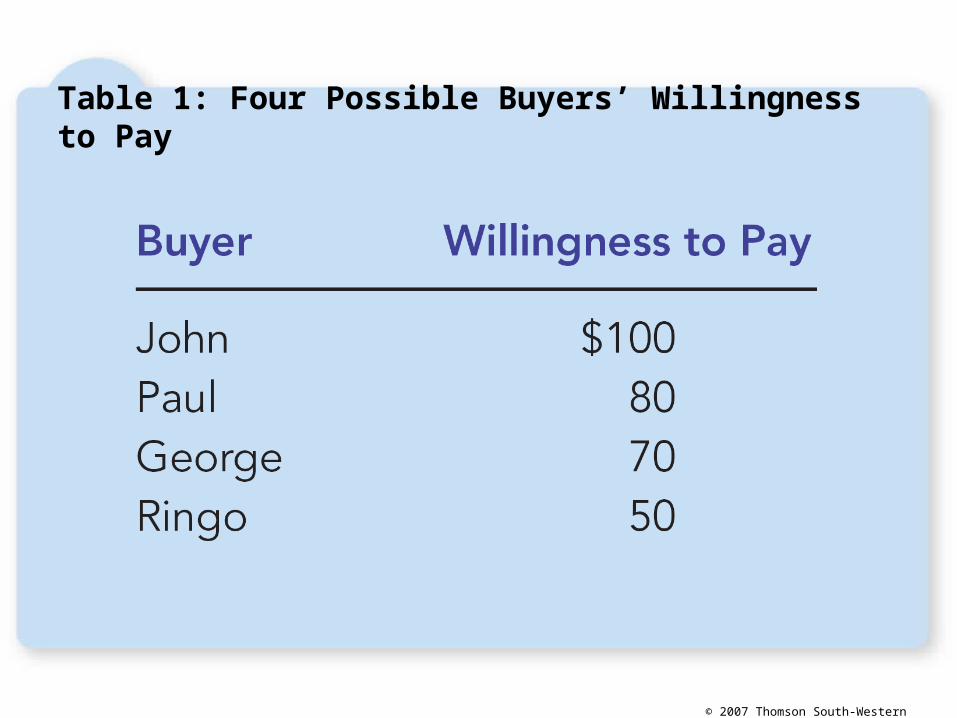
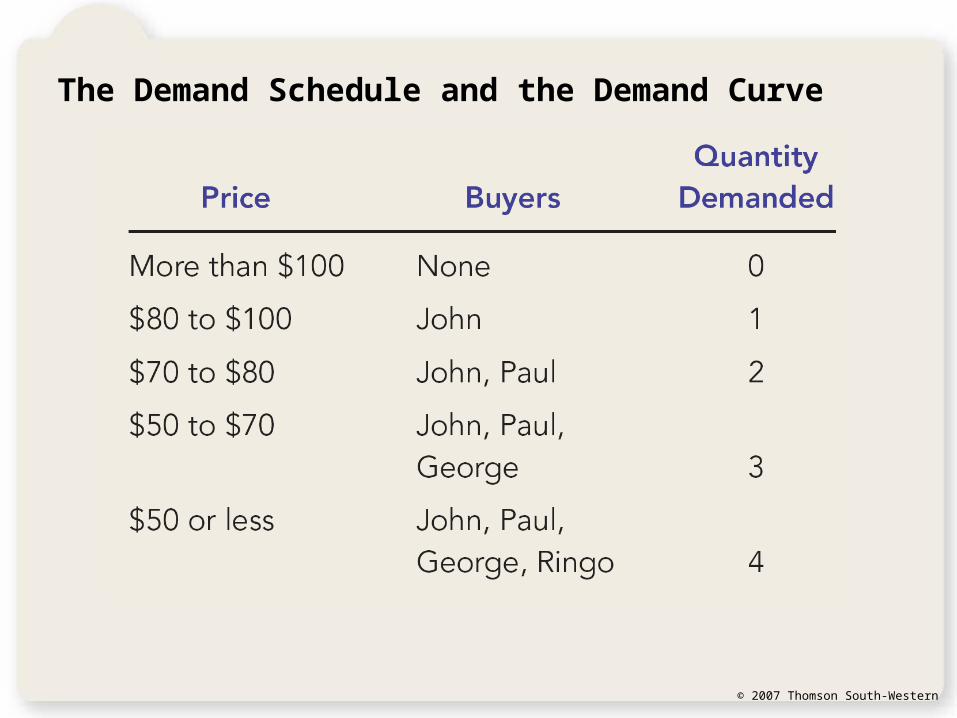
Table 1: Four Possible Buyers’ Willingness to Pay
© 2007 Thomson South-Western
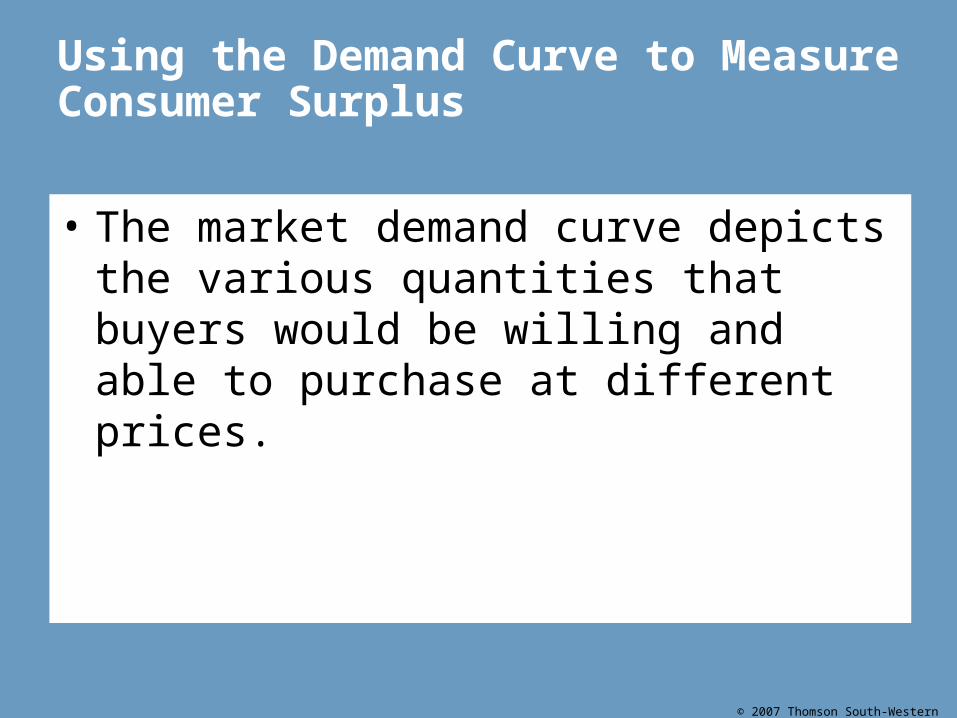
Using the Demand Curve to Measure Consumer Surplus
• The market demand curve depicts the various quantities that buyers would be willing and able to purchase at different prices.
© 2007 Thomson South-Western
The Demand Schedule and the Demand Curve
© 2007 Thomson South-Western
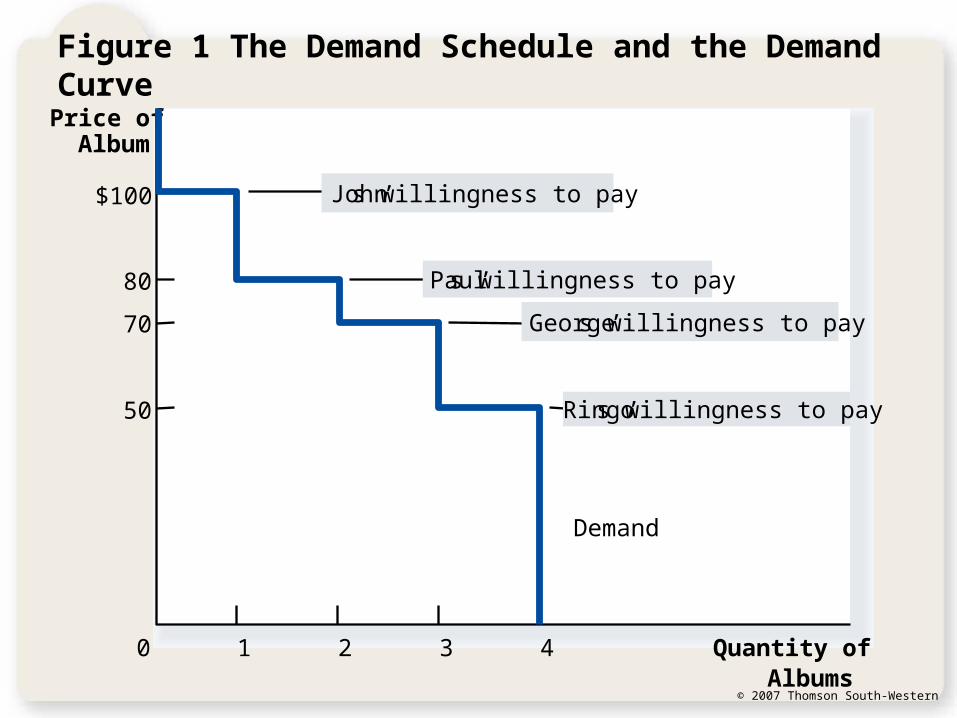
Figure 1 The Demand Schedule and the Demand Curve
Price ofAlbum
0 Quantity ofAlbums
Demand
1 2 3 4
$100 John’s willingness to pay
80 Paul’s willingness to pay
70 George’s willingness to pay
50 Ringo’s willingness to pay
© 2007 Thomson South-Western
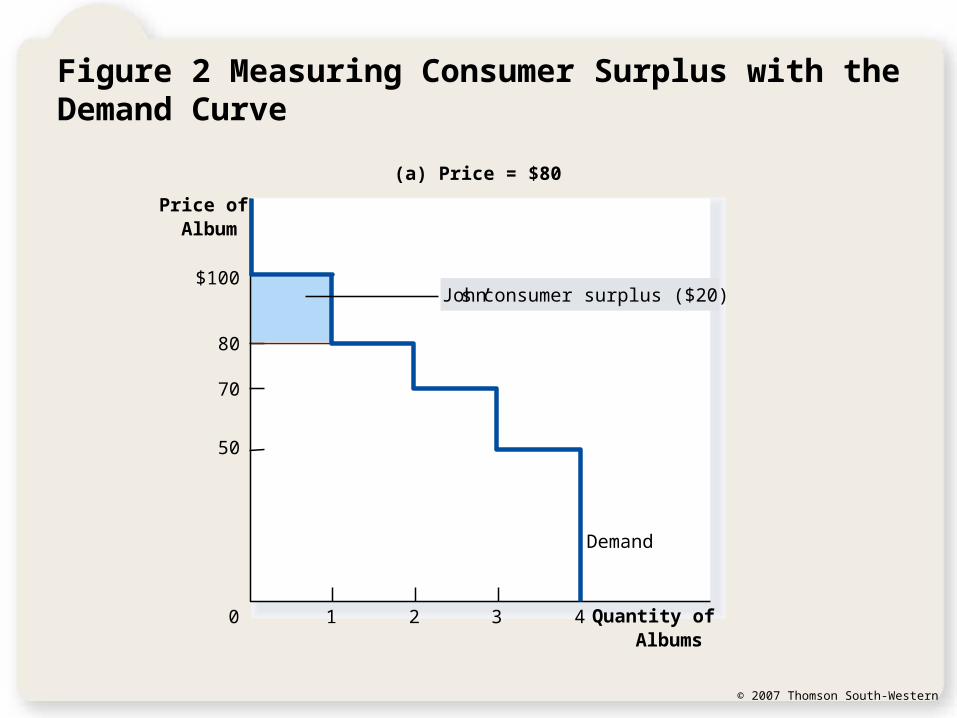
Figure 2 Measuring Consumer Surplus with the Demand Curve
(a) Price = $80
Price ofAlbum
50
70
80
0
$100
Demand
1 2 3 4 Quantity ofAlbums
John’s consumer surplus ($20)
© 2007 Thomson South-Western
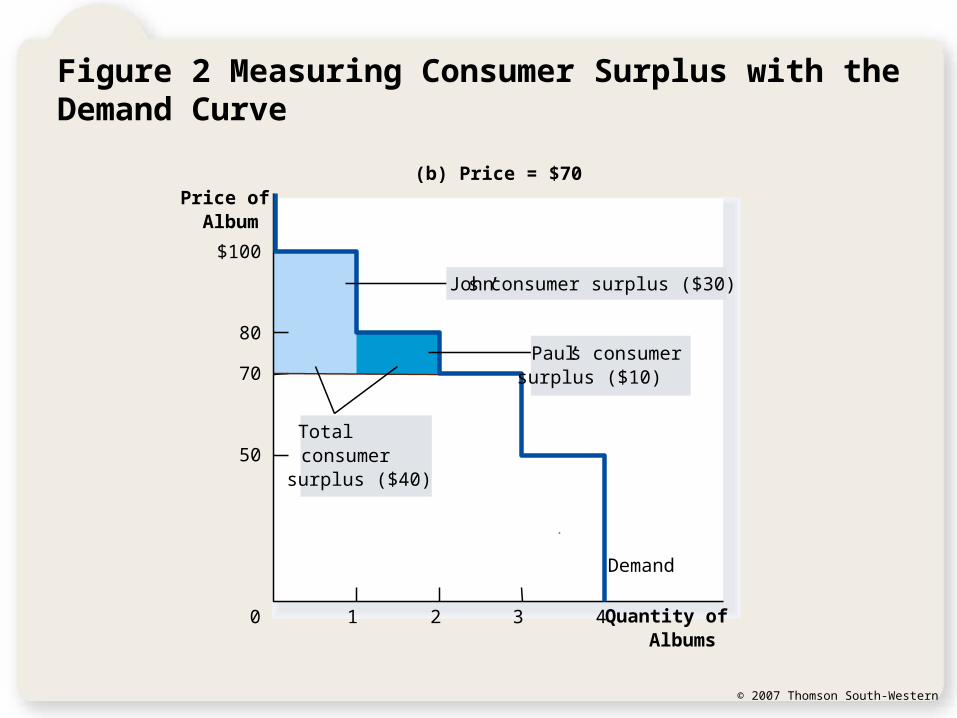
Figure 2 Measuring Consumer Surplus with the Demand Curve
(b) Price = $70Price of
Album
50
70
80
0
$100
Demand
1 2 3 4
Totalconsumersurplus ($40)
Quantity ofAlbums
John’s consumer surplus ($30)
Paul’s consumersurplus ($10)
© 2007 Thomson South-Western
Using the Demand Curve to Measure Consumer Surplus
• The area below the demand curve and above the price measures the consumer surplus in the market.
© 2007 Thomson South-Western
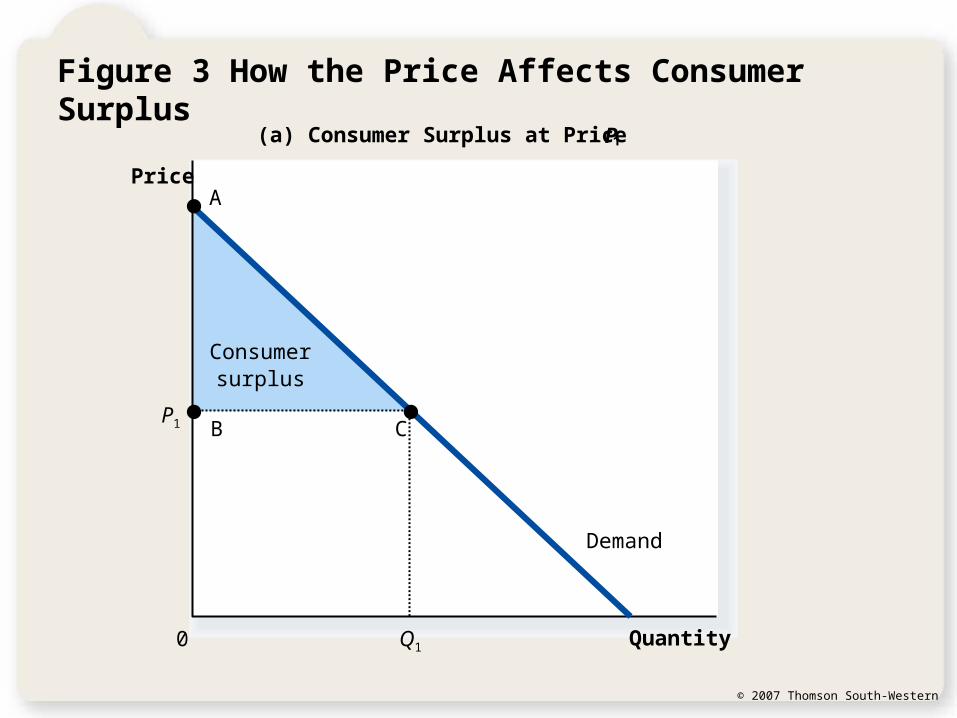
Figure 3 How the Price Affects Consumer Surplus
Consumersurplus
Quantity
(a) Consumer Surplus at Price P
Price
0
Demand
P1
Q1
B
A
C
© 2007 Thomson South-Western
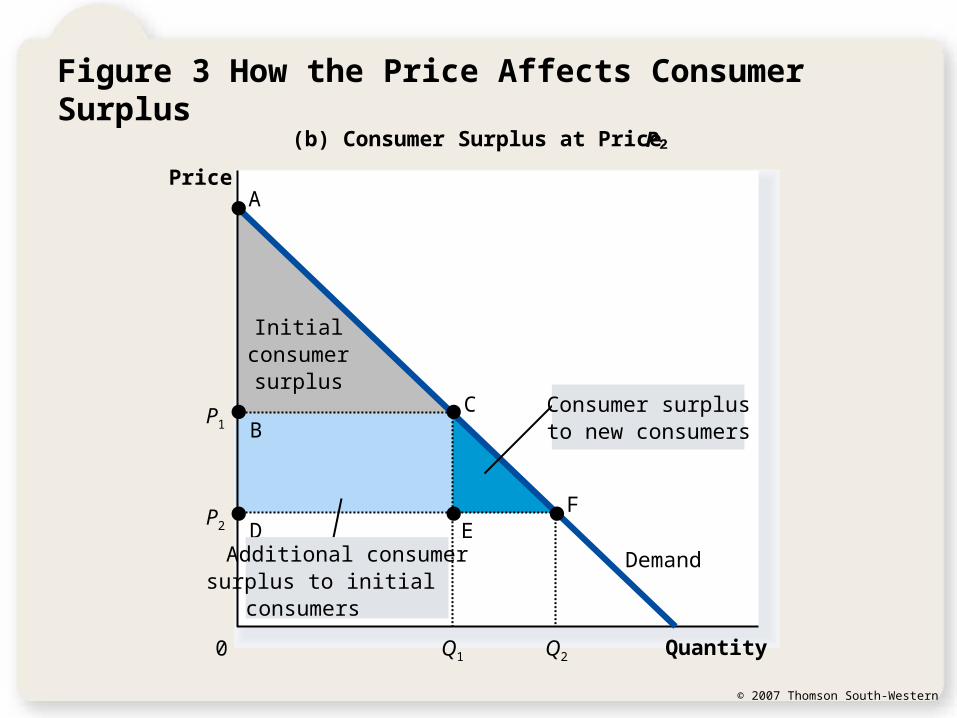
Figure 3 How the Price Affects Consumer Surplus
Initialconsumer
surplus
Quantity
(b) Consumer Surplus at Price P
Price
0
Demand
A
BC
D EF
P1
Q1
P2
Q2
Consumer surplusto new consumers
Additional consumersurplus to initial consumers

© 2007 Thomson South-Western
What Does Consumer Surplus Measure?
• Consumer surplus, the amount that buyers are willing to pay for a good minus the amount they actually pay for it, measures the benefit that buyers receive from a good as the buyers themselves perceive it.
© 2007 Thomson South-Western
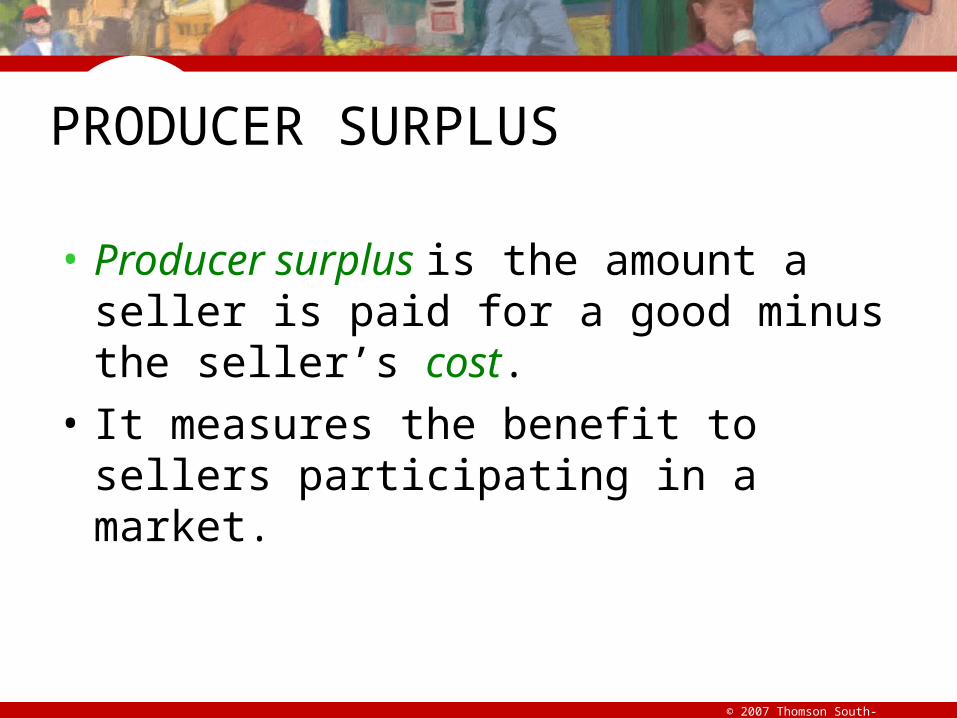
PRODUCER SURPLUS
• Producer surplus is the amount a seller is paid for a good minus the seller’s cost.
• It measures the benefit to sellers participating in a market.
© 2007 Thomson South-Western
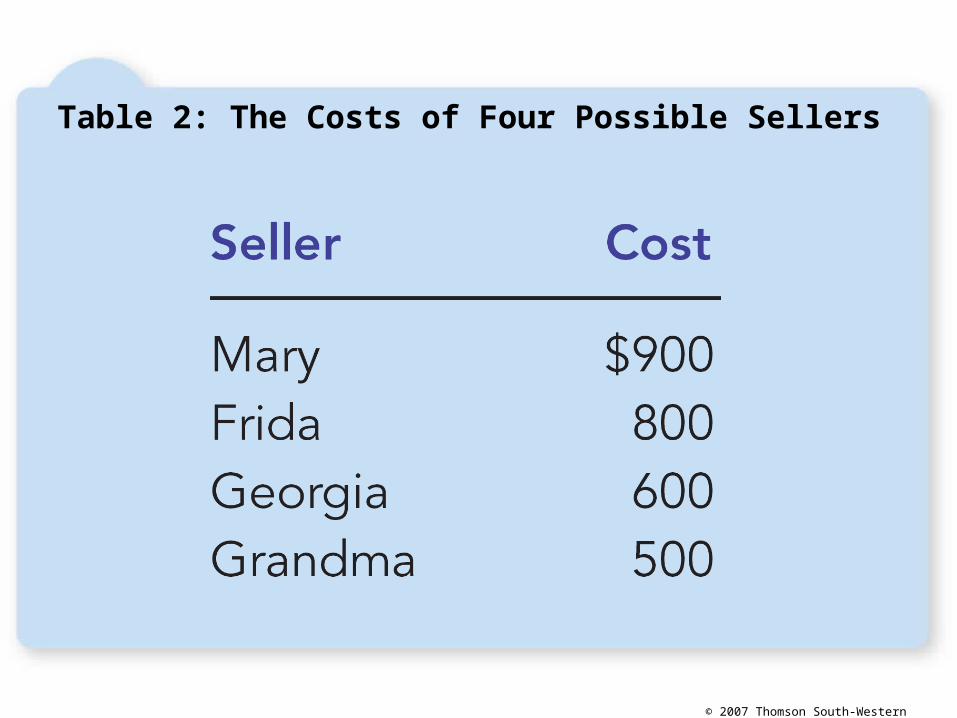
Table 2: The Costs of Four Possible Sellers
© 2007 Thomson South-Western
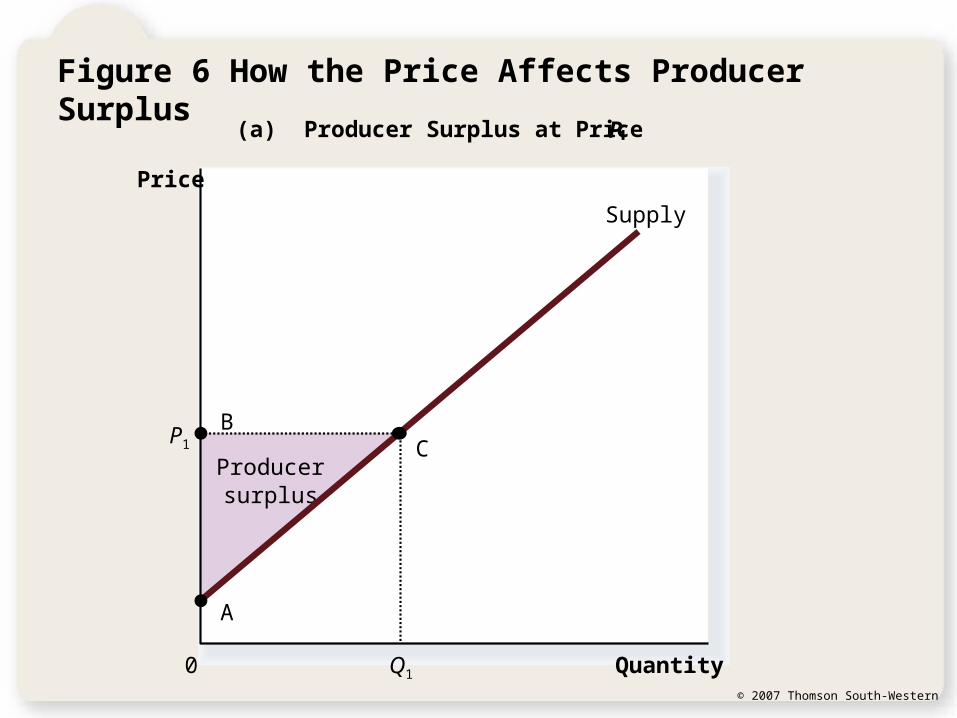
Using the Supply Curve to Measure Producer Surplus
• Just as consumer surplus is related to the demand curve, producer surplus is closely related to the supply curve.
© 2007 Thomson South-Western
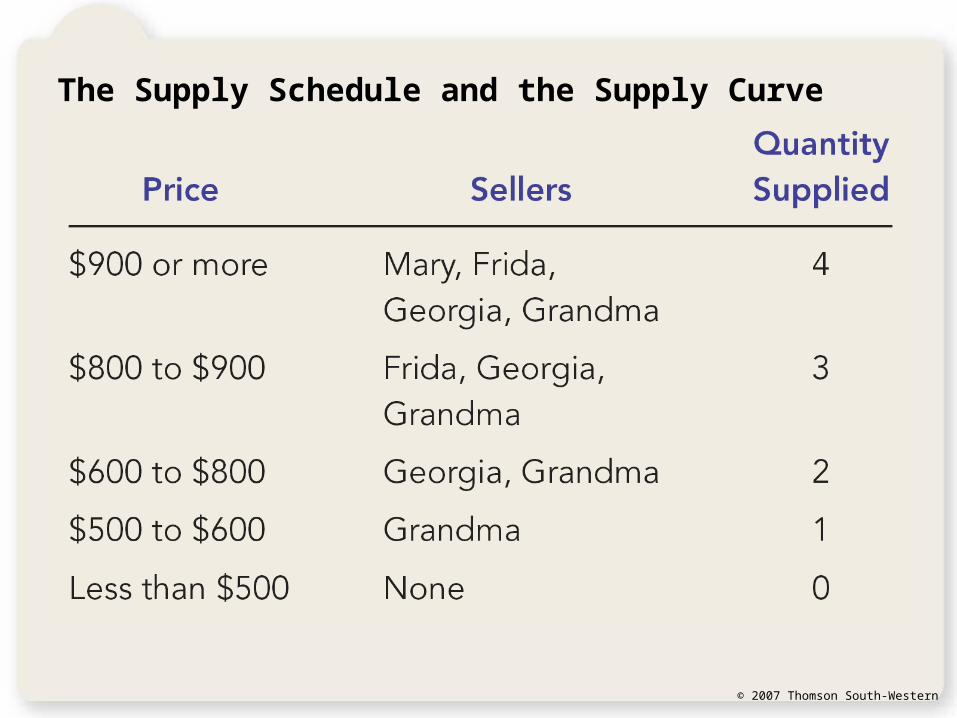
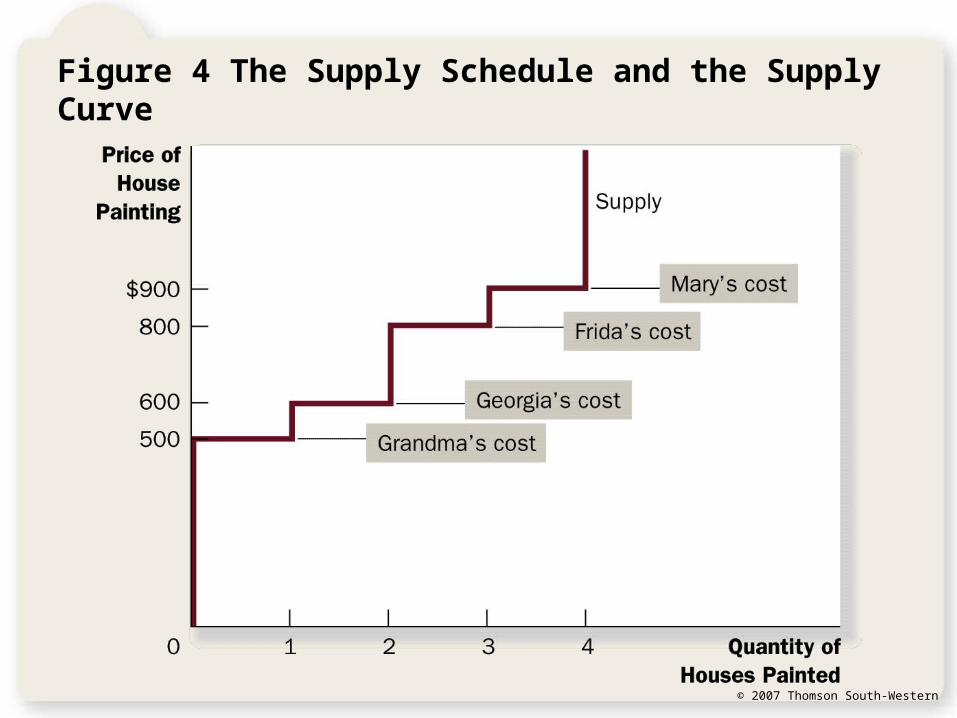
The Supply Schedule and the Supply Curve
© 2007 Thomson South-Western
Figure 4 The Supply Schedule and the Supply Curve
© 2007 Thomson South-Western
Using the Supply Curve to Measure Producer Surplus
• The area below the price and above the supply curve measures the producer surplus in a market.
© 2007 Thomson South-Western
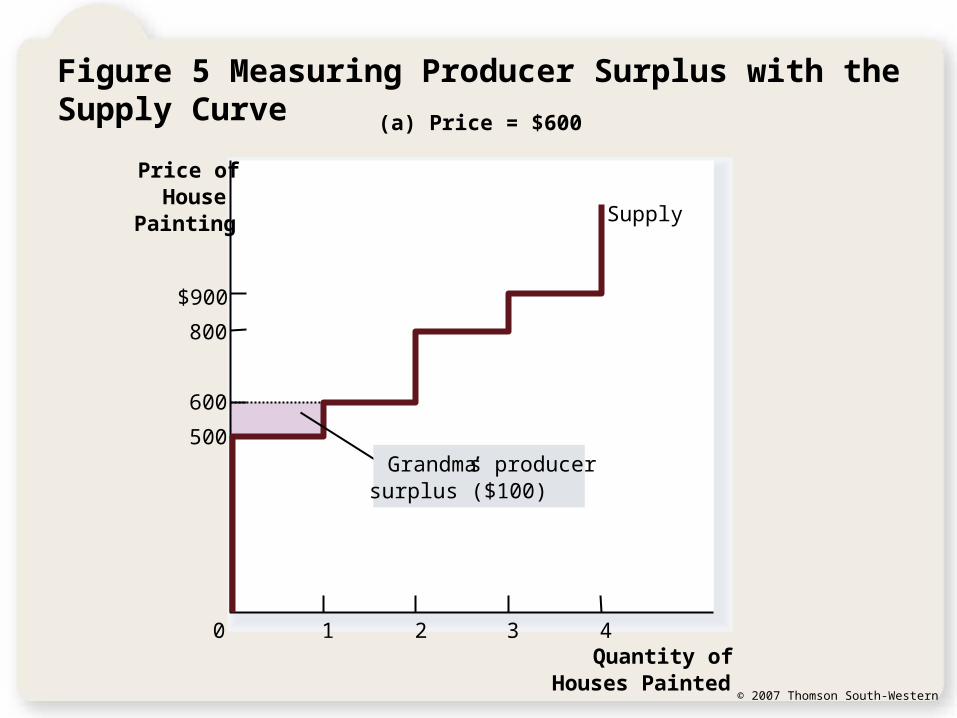
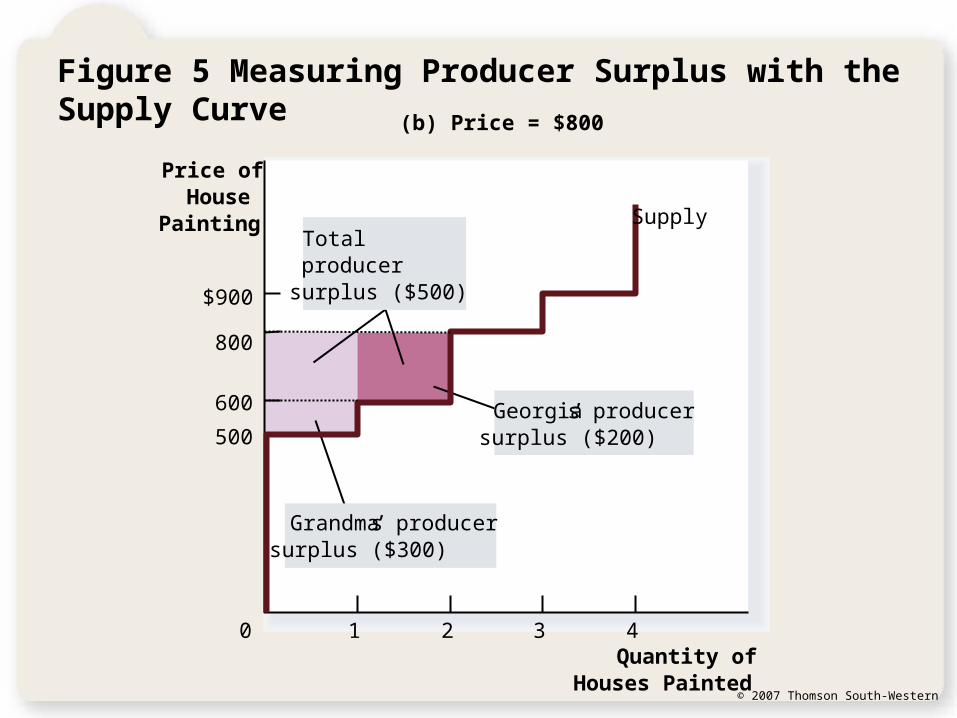
Figure 5 Measuring Producer Surplus with the Supply Curve
Quantity ofHouses Painted
Price ofHouse
Painting
500
800
$900
0
600
1 2 3 4
(a) Price = $600
Supply
Grandma’s producersurplus ($100)
© 2007 Thomson South-Western
Figure 5 Measuring Producer Surplus with the Supply Curve
Quantity ofHouses Painted
Price ofHouse
Painting
500
800
$900
0
600
1 2 3 4
(b) Price = $800
Georgia’s producersurplus ($200)
Totalproducersurplus ($500)
Grandma’s producersurplus ($300)
Supply
© 2007 Thomson South-Western
Figure 6 How the Price Affects Producer Surplus
Producersurplus
Quantity
(a) Producer Surplus at Price P
Price
0
Supply
B
A
C
Q1
P1
© 2007 Thomson South-Western
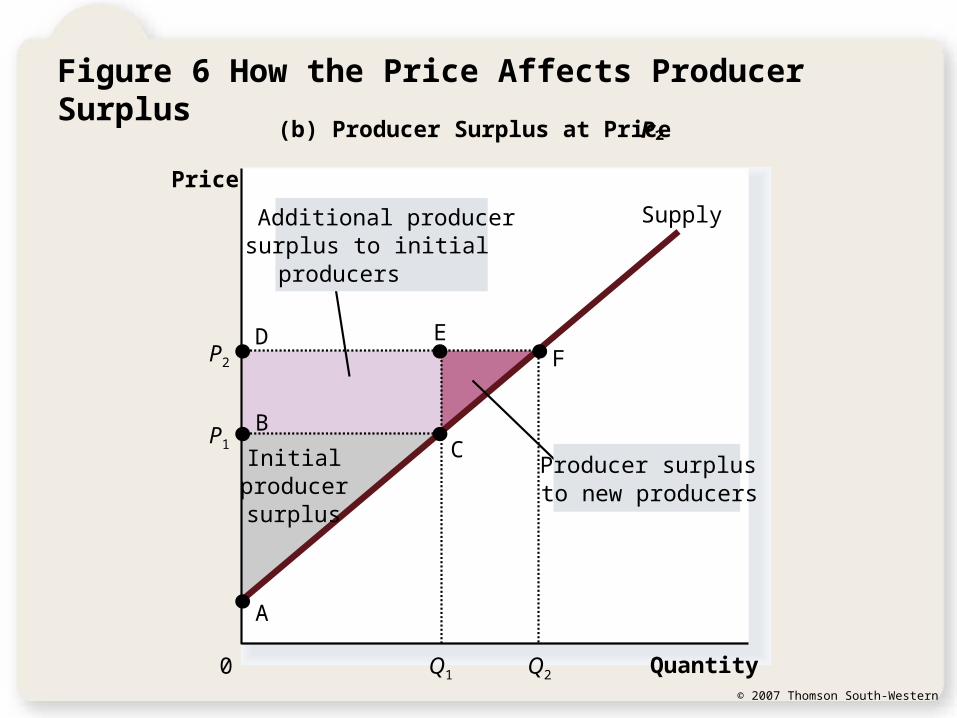
Figure 6 How the Price Affects Producer Surplus
Quantity
(b) Producer Surplus at Price P
Price
0
P1B
C
Supply
A
Initialproducersurplus
Q1
P2
Q2
Producer surplusto new producers
Additional producersurplus to initialproducers
D EF
© 2007 Thomson South-Western
MARKET EFFICIENCY• Consumer surplus and producer surplus may
be used to address the following question:– Is the allocation of resources determined by free
markets in any way desirable?
© 2007 Thomson South-Western
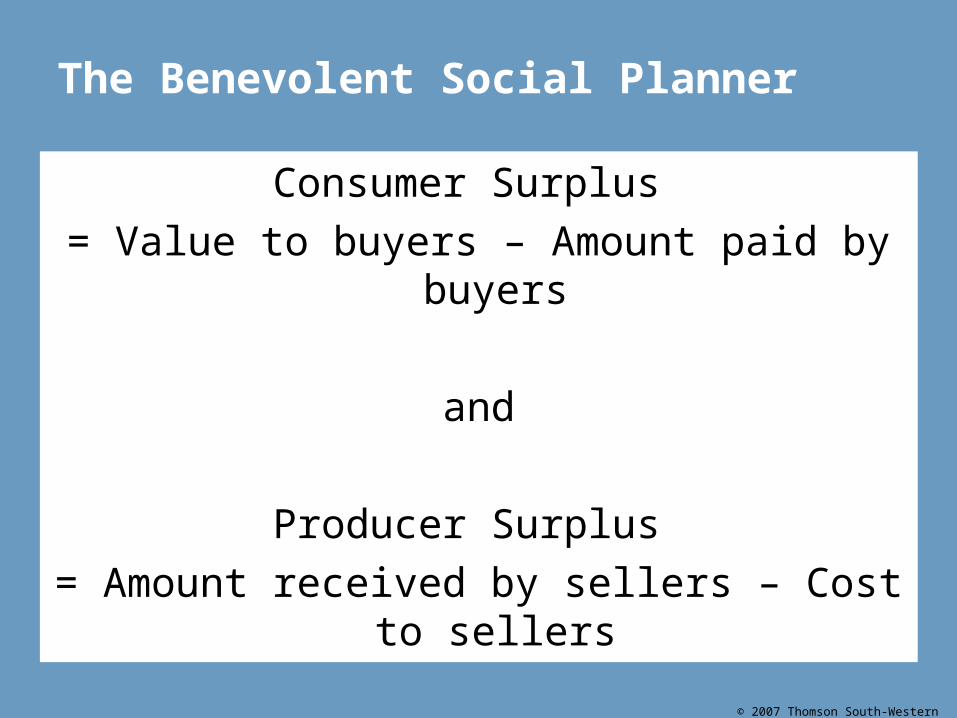
The Benevolent Social Planner
Consumer Surplus
= Value to buyers – Amount paid by buyers
and
Producer Surplus
= Amount received by sellers – Cost to sellers
© 2007 Thomson South-Western
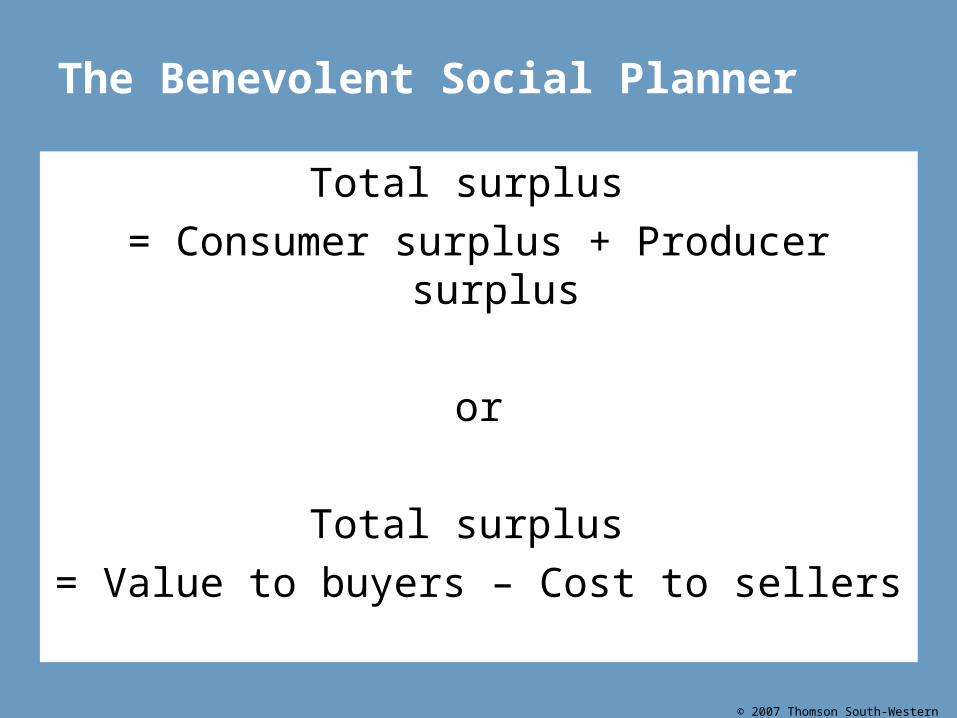
The Benevolent Social Planner
Total surplus
= Consumer surplus + Producer surplus
or
Total surplus
= Value to buyers – Cost to sellers

© 2007 Thomson South-Western
The Benevolent Social Planner
• Efficiency is the property of a resource allocation of maximizing the total surplus received by all members of society.

© 2007 Thomson South-Western
The Benevolent Social Planner
• In addition to market efficiency, a social planner might also care about equity – the fairness of the distribution of well-being among the various buyers and sellers.
© 2007 Thomson South-Western
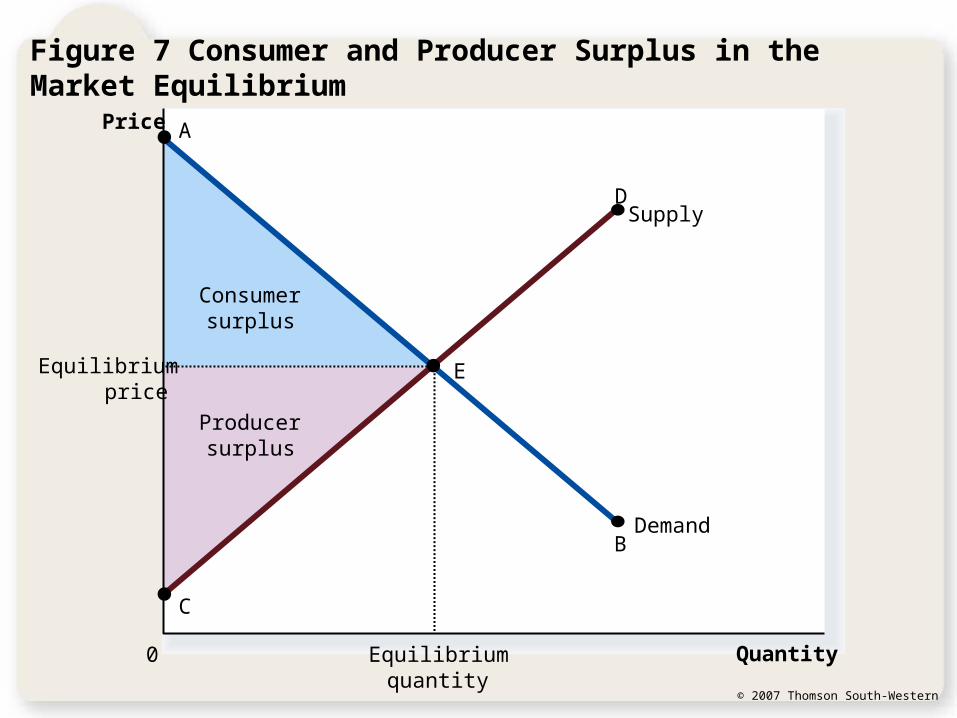
Figure 7 Consumer and Producer Surplus in the Market Equilibrium
Producersurplus
Consumersurplus
Price
0 Quantity
Equilibriumprice
Equilibriumquantity
Supply
Demand
A
C
B
D
E
© 2007 Thomson South-Western
Evaluating the Market Equilibrium
• Three Insights Concerning Market Outcomes• Free markets allocate the supply of goods to the
buyers who value them most highly, as measured by their willingness to pay.
• Free markets allocate the demand for goods to the sellers who can produce them at least cost.
• Free markets produce the quantity of goods that maximizes the sum of consumer and producer surplus.
© 2007 Thomson South-Western
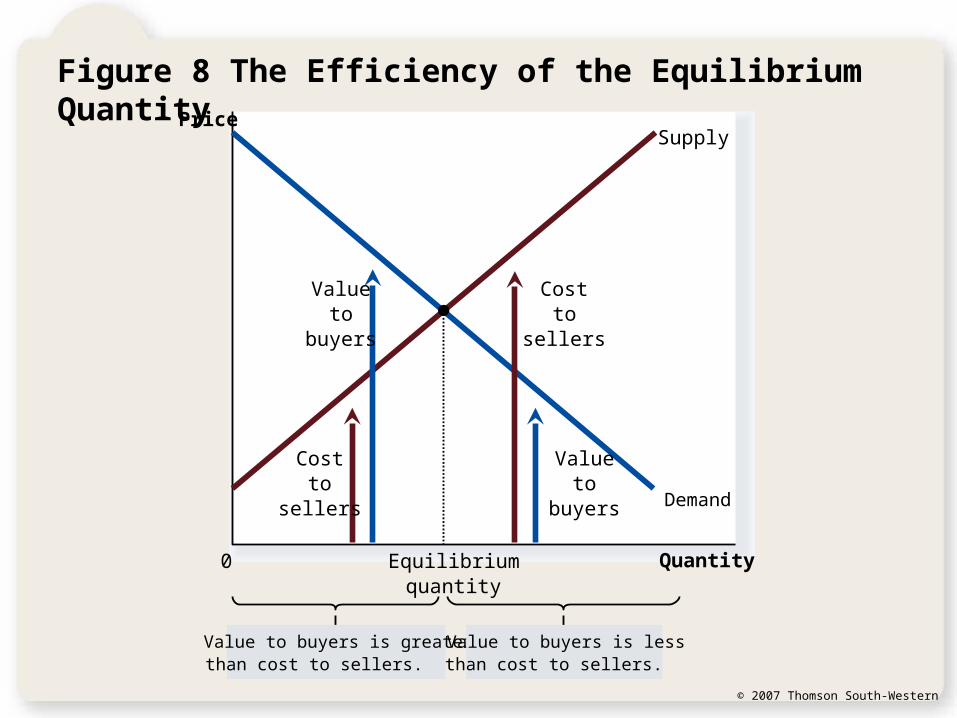
Figure 8 The Efficiency of the Equilibrium Quantity
Quantity
Price
0
Supply
Demand
Costto
sellers
Costto
sellers
Valueto
buyers
Valueto
buyers
Value to buyers is greaterthan cost to sellers.
Value to buyers is lessthan cost to sellers.
Equilibriumquantity

© 2007 Thomson South-Western
Evaluating the Market Equilibrium
• Because the equilibrium outcome is an efficient allocation of resources, the social planner can leave the market outcome as he/she finds it.
• This policy of leaving well enough alone goes by the French expression laissez faire.
© 2007 Thomson South-Western
Evaluating the Market Equilibrium
• Market Power• If a market system is not perfectly competitive,
market power may result.• Market power is the ability to influence prices.
• Market power can cause markets to be inefficient because it keeps price and quantity from the equilibrium of supply and demand.
© 2007 Thomson South-Western
Evaluating the Market Equilibrium
• Externalities• created when a market outcome affects individuals
other than buyers and sellers in that market.• cause welfare in a market to depend on more than
just the value to the buyers and cost to the sellers.
• When buyers and sellers do not take externalities into account when deciding how much to consume and produce, the equilibrium in the market can be inefficient.
Summary
© 2007 Thomson South-Western
• Consumer surplus equals buyers’ willingness to pay for a good minus the amount they actually pay for it.
• Consumer surplus measures the benefit buyers get from participating in a market.
• Consumer surplus can be computed by finding the area below the demand curve and above the price.
Summary
© 2007 Thomson South-Western
• Producer surplus equals the amount sellers receive for their goods minus their costs of production.
• Producer surplus measures the benefit sellers get from participating in a market.
• Producer surplus can be computed by finding the area below the price and above the supply curve.
Summary
© 2007 Thomson South-Western
• An allocation of resources that maximizes the sum of consumer and producer surplus is said to be efficient.
• Policymakers are often concerned with the efficiency, as well as the equity, of economic outcomes.
Summary
© 2007 Thomson South-Western
• The equilibrium of demand and supply maximizes the sum of consumer and producer surplus.
• This is as if the invisible hand of the marketplace leads buyers and sellers to allocate resources efficiently.
• Markets do not allocate resources efficiently in the presence of market failures.