Embed Size (px)
Citation preview

2-1
***
1-1McGraw-Hill/IrwinUnderstanding Business, 8e © 2008 The McGraw-Hill Companies, Inc., All Rights
Reserved.
Nickels McHugh McHughNickels McHugh McHugh
**How Economics
Affects Business:
The Creation and Distribution
of Wealth 2
CH
AP
TE
R*
* *

2-2
***
LLearning goalsearning goals
• CCompare and contrast the economics of despair with ompare and contrast the economics of despair with the economics of growth.the economics of growth.
• EExplain what capitalism is and how free markets work.xplain what capitalism is and how free markets work.
• DDiscuss the major differences between socialism and iscuss the major differences between socialism and communism.communism.
• EExplain the trend toward mixed economies.xplain the trend toward mixed economies.
• DDiscuss the economic system of the united states, iscuss the economic system of the united states, including the significance of key economic indicators including the significance of key economic indicators (GDP), productivity, and the business cycle.(GDP), productivity, and the business cycle.
• DDefine fiscal policy and monetary policy, and explain efine fiscal policy and monetary policy, and explain how each affect the economy.how each affect the economy.

2-3
***
Economics: Create Economics: Create WealthWealth
• Study of how society chooses to Study of how society chooses to employ resources to produce employ resources to produce goods & services and distribute goods & services and distribute them among competing them among competing groups/individualsgroups/individuals
• Micro v. MacroMicro v. Macro
• Resource DevelopmentResource Development

2-4
***
Four “What’s” ofFour “What’s” of an Economic Systeman Economic System
$ What is produced?What is produced?
$ What amount is produced?What amount is produced?
$ What is the method of output What is the method of output distribution?distribution?
$ What is the rate of economic What is the rate of economic growth?growth?
Adapted from:Adapted from: Edwin Mansfield Economics (New York: W.W. Norton, 1976), p.8
2-5
***
Economic TheoriesEconomic Theories
• Thomas Malthus (Early 1800s)Thomas Malthus (Early 1800s)• “ “Dismal Science”Dismal Science”
• Too many people Too many people
• Adam Smith (1776)Adam Smith (1776)• Freedom is vitalFreedom is vital
• ““Invisible Hand”Invisible Hand”

2-6
***
Circular Flow ModelCircular Flow Model

2-7
***
Three Economic SystemsThree Economic Systems
CommunismCommunism
SocialismSocialism
CapitalismCapitalism
(Highly Controlled(Highly Controlled)) (Little Control(Little Control))
MixedMixed

2-8
***
Free-Market CapitalismFree-Market Capitalism
• Private PropertyPrivate Property
• Business Ownership/ ProfitsBusiness Ownership/ Profits
• Freedom of CompetitionFreedom of Competition
• Freedom of ChoiceFreedom of Choice

2-9
***
Supply CurveSupply Curve
Quantity(S)Quantity(S)
HighHigh
HighHighLowLow
Price(P)Price(P)
SS

2-10
***
Demand CurveDemand Curve
Price(P)
Quantity(D)
High
HighLow
D

2-11
***
Quantity
High
HighLow
Price
Equilibrium Point
Market Equilibrium
S D
Surplus
Shortage

2-12
***
Free-Market CompetitionFree-Market Competition
SellersSellers
OneOne ManyMany
MonopolyMonopoly
OligopolyOligopoly
Monopolistic Monopolistic
CompetitionCompetition
Perfect Perfect CompetitionCompetition

2-13
***
Perfect CompetitionPerfect Competition
BuyerBuyer
SellersSellers

2-14
***
Monopolistic Competition:Monopolistic Competition: Many Sellers With Many Sellers With PerceivedPerceived Differences Differences
• Fast FoodFast Food
• CollegesColleges

2-15
***
Oligopoly: Few SellersOligopoly: Few Sellers
• AutomobilesAutomobiles
• TobaccoTobacco

2-16
***
Monopoly: One SellerMonopoly: One Seller
• UtilitiesUtilities
• Microsoft?Microsoft?
2-17
***
Limits of Free-MarketsLimits of Free-Markets
• Inequality of Wealth- Causes Inequality of Wealth- Causes National & World TensionNational & World Tension
• Greed Compromises EthicsGreed Compromises Ethics
• Limitations Push Country Limitations Push Country towards Socialism = towards Socialism = Government RegulationGovernment Regulation

2-18
***
Industrialized Nations’Industrialized Nations’ Top Individual Tax RateTop Individual Tax Rate
0% 10% 20% 30% 40% 50% 60% 70%
Denmark
Austria
France
Spain
Italy
Germany
Japan
U.S.
Source: www.worldwide-tax.com, May 9, 2006
2-19
***
SocialismSocialism• Private & Public Ownership Private & Public Ownership
• Some Choices are LimitedSome Choices are Limited
• Creates Social EqualityCreates Social Equality
• Reduces Individual Incentive Reduces Individual Incentive - Brain Drain- Brain Drain
2-20
***
CommunismCommunism
• Public OwnershipPublic Ownership• Almost all major factors of Almost all major factors of
productionproduction
• Central Planning/Controlled Central Planning/Controlled EconomyEconomy
• Shortages of food and other products Shortages of food and other products may developmay develop• Lack of motivation to work hard for Lack of motivation to work hard for business peoplebusiness people

2-21
***
Mixed EconomiesMixed Economies
• Free-Market Economy = CapitalismFree-Market Economy = Capitalism
• Command EconomyCommand Economy• SocialismSocialism
• CommunismCommunism
• Trend Results in Blend/MixTrend Results in Blend/Mix• Capitalism > SocialismCapitalism > Socialism
• Socialism > CapitalismSocialism > Capitalism

2-22
***
Why is the U.S.Why is the U.S. an Economic Success?an Economic Success?
Major ReasonMajor Reason PercentPercent**
ConstitutionConstitution 8585
Free ElectionsFree Elections 8484
Free Enterprise SystemFree Enterprise System 8181
Abundant ResourcesAbundant Resources 7878
Cultural DiversityCultural Diversity 7171* Respondents could choose more than one.* Respondents could choose more than one.
Source: Investors Business Daily Survey
2-23
***
U.S. EconomyU.S. Economy
• Key Economic IndicatorsKey Economic Indicators
• Productivity in the U.S.Productivity in the U.S.
• Productivity in the Service SectorProductivity in the Service Sector
• Business CyclesBusiness Cycles• RecessionRecession
• DepressionDepression
• RecoveryRecovery
• StabilizationStabilization• Fiscal PolicyFiscal Policy
• National DebtNational Debt
• Economic Growth through Monetary PolicyEconomic Growth through Monetary Policy
2-24
***
Key Economic IndicatorsKey Economic Indicators
• Gross Domestic Product (GDP)Gross Domestic Product (GDP)
• Unemployment RateUnemployment Rate
• Price IndexesPrice Indexes• Consumer Price Index (CPI)Consumer Price Index (CPI)
• Producer Price Index (PPI)Producer Price Index (PPI)

2-25
***
U.S. GrossU.S. Gross Domestic ProductDomestic Product
0
2,000
4,000
6,000
8,000
10,000
12,000
14,000
1940 1950 1960 1970 1980 1990 2000 2002 2005
In Billions of U.S. $In Billions of U.S. $
Source: U.S. Dept. of Commerce, Bureau of Economic Analysis
***
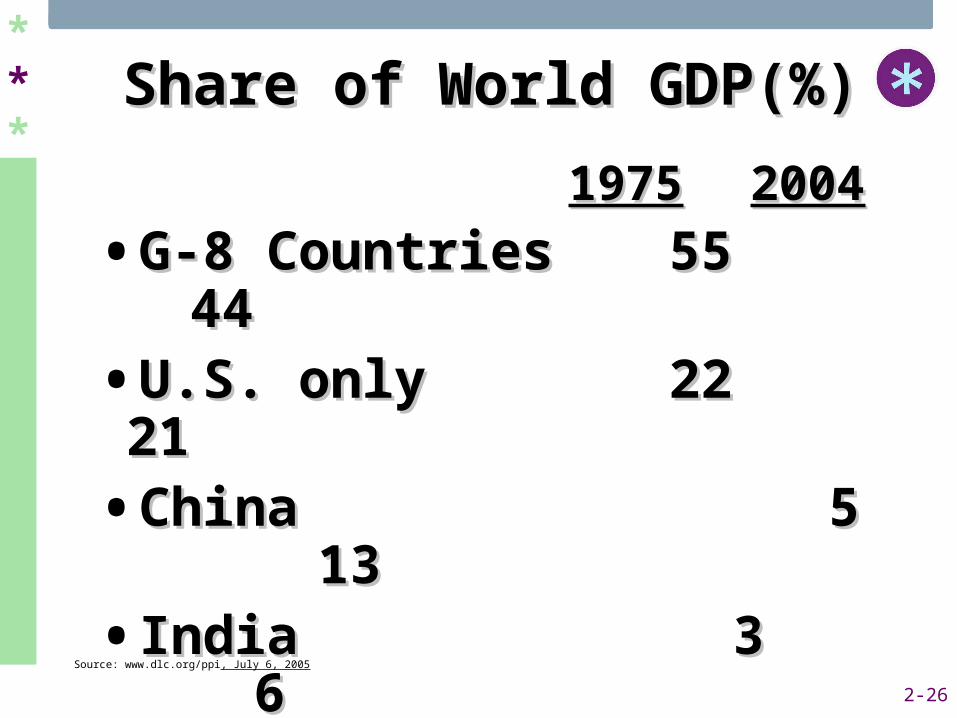
19751975 20042004
•G-8 CountriesG-8 Countries 55 4455 44
•U.S. onlyU.S. only 2222 21 21
•ChinaChina 5 13 5 13
•IndiaIndia 3 6 3 6
•Latin AmericaLatin America 7 6 7 6
•AfricaAfrica 3 3 33
Share of World GDP(%)Share of World GDP(%)
Source: www.dlc.org/ppi, July 6, 2005
2-26

2-27
***
U.S. Unemployment (%)U.S. Unemployment (%)
Source: U.S. Bureau of Labor Statistics
0
2
4
6
8
10
12
14
16
1940 1950 1960 1970 1980 1990 2000 2002 2005
Source:Source: U.S. Bureau of Labor Statistics
2-28
***
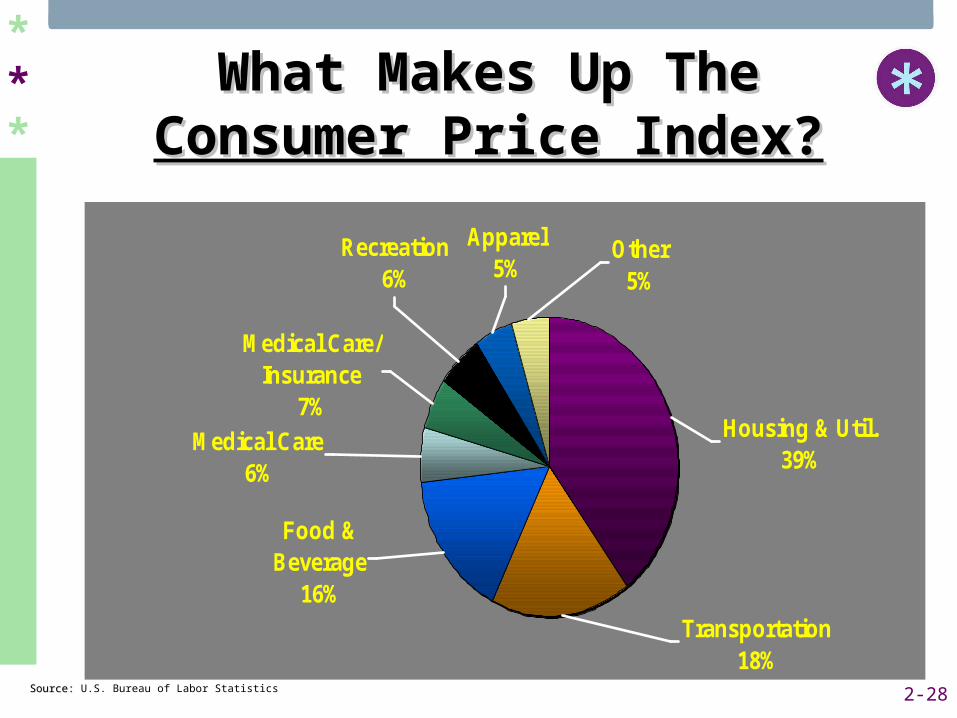
What Makes Up TheWhat Makes Up TheConsumer Price Index?Consumer Price Index?
Transportation18%
Other5%
Medical Care6%
Food & Beverage
16%
Housing & Util.39%
Recreation6%
Medical Care/ Insurance
7%
Apparel5%
Source:Source: U.S. Bureau of Labor Statistics
2-29
***
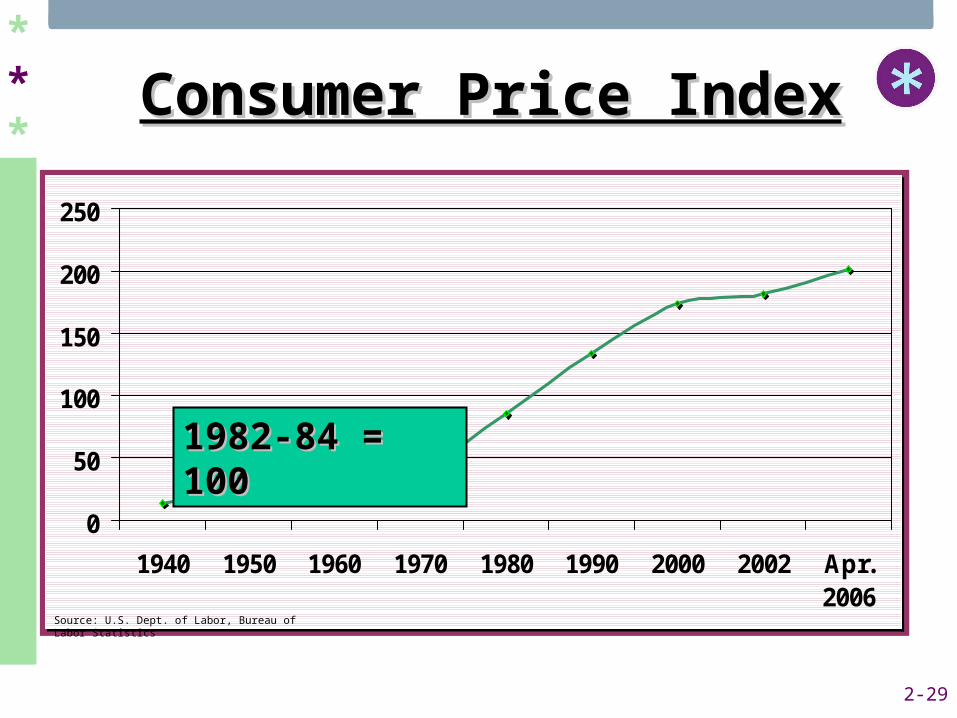
Consumer Price IndexConsumer Price Index
0
50
100
150
200
250
1940 1950 1960 1970 1980 1990 2000 2002 Apr.2006
1982-84 = 1001982-84 = 100
Source: U.S. Dept. of Labor, Bureau of Labor Statistics

2-30
***
Percent Change in LaborPercent Change in Labor Productivity- U.S.Productivity- U.S.
-10123456789
1950 1960 1970 1980 1990 2000 2002 Q1 -2006
Source: U.S. Dept. of Commerce, Bureau of Labor Statistics
2-31
***
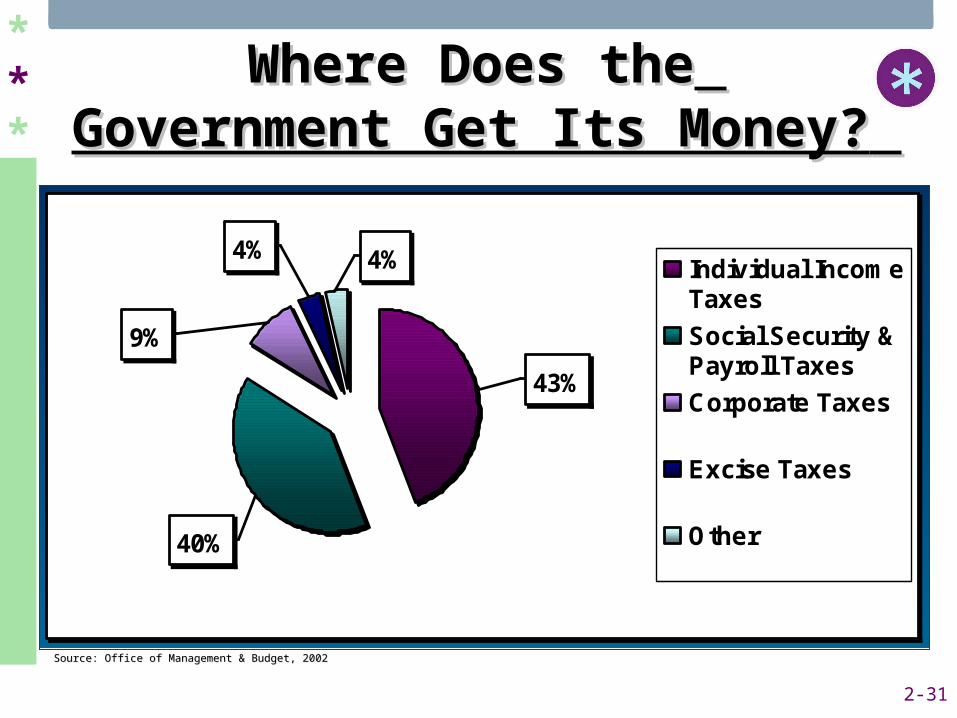
Where Does theWhere Does the Government Get Its Money?Government Get Its Money?
Source: Office of Management & Budget, 2002Source: Office of Management & Budget, 2002
4%4%
9%
40%
43%
Individual IncomeTaxes
Social Security &Payroll Taxes
Corporate Taxes
Excise Taxes
Other
2-32
***
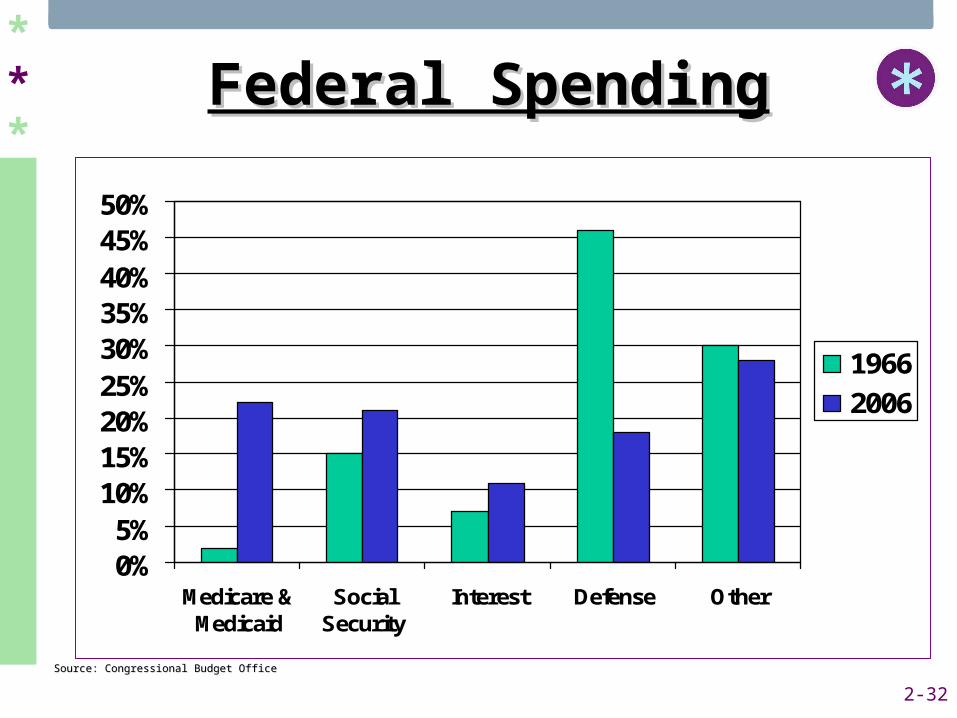
Federal SpendingFederal Spending
0%5%
10%15%20%25%30%35%40%45%50%
Medicare &Medicaid
SocialSecurity
Interest Defense Other
1966
2006
Source: Congressional Budget OfficeSource: Congressional Budget Office

2-33
***
Biggest Economic Biggest Economic ChallengesChallenges
• Over the Next 3-5 years the U.S. can be Over the Next 3-5 years the U.S. can be expected to face these challenges:expected to face these challenges:
• Pension & Health care costsPension & Health care costs
• The Federal DeficitThe Federal Deficit
• High Energy and Commodity CostsHigh Energy and Commodity Costs
• Balance of paymentsBalance of payments
• TerrorismTerrorism
Source: Investors Business Daily January 9, 2006

2-34
***
Healthcare Expenditure Healthcare Expenditure Projections Projections
(Percent of National GDP)(Percent of National GDP)
14.00%
14.50%
15.00%
15.50%
16.00%
16.50%
17.00%
17.50%
18.00%
2004 2006 2008 2010 2012
% of GDP
Source: FORTUNE May 3, 2004
2-35
***
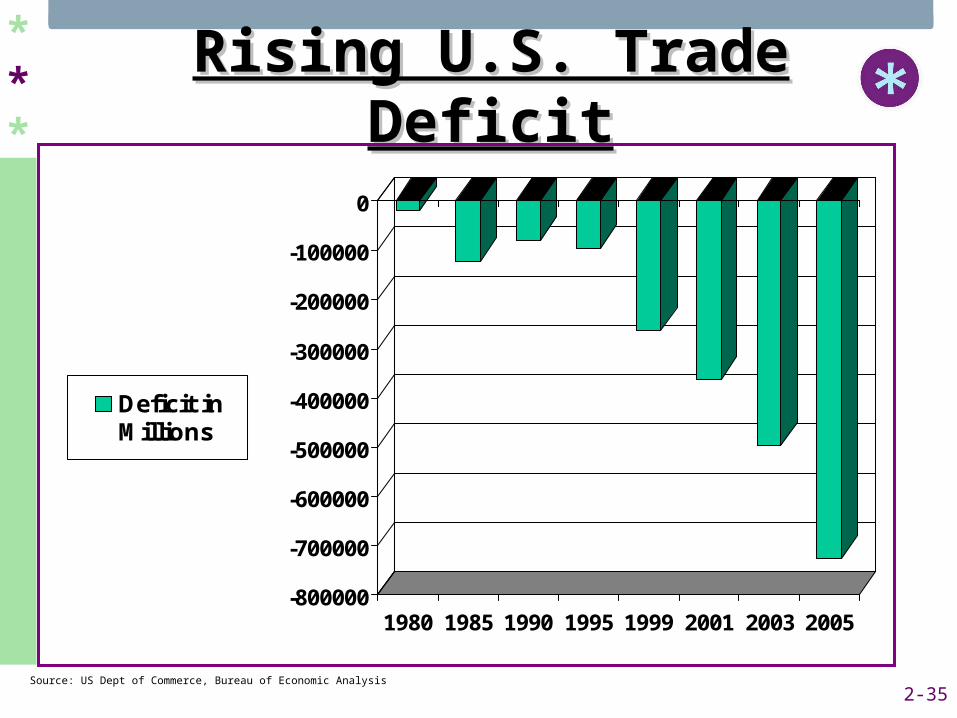
Rising U.S. Trade DeficitRising U.S. Trade Deficit
-800000
-700000
-600000
-500000
-400000
-300000
-200000
-100000
0
1980 1985 1990 1995 1999 2001 2003 2005
Deficit inMillions
Source: US Dept of Commerce, Bureau of Economic Analysis

2-36
***
Where are the HomelandWhere are the Homeland Security Dollars Spent?Security Dollars Spent?
0
2
4
6
8
10
12
14
Border & PortSecurity
Aviation Security ImmigrationEnforcement
BioDefense InfrastructureProtection
Source: Business Week June 14, 2004Source: Business Week June 14, 2004

2-37
***
• The debt has reached $8.36 The debt has reached $8.36 trillion+ (May 2006)trillion+ (May 2006)
• If $1,000 bills were stacked:If $1,000 bills were stacked:• $1 Million = 4.29 $1 Million = 4.29 InchesInches
• $1 Billion = $1 Billion = 357.5357.5 FeetFeet
• $1 Trillion = 67$1 Trillion = 67MilesMiles
• The debt is equal to The debt is equal to 560.1 miles560.1 miles in in $1,000 bills$1,000 bills
• National Debt Clock- National Debt Clock- http://http://www.brillig.com/debt_clockwww.brillig.com/debt_clock//
What is the National Debt?What is the National Debt?