Embed Size (px)
Citation preview
17-1
***
1-1McGraw-Hill/IrwinUnderstanding Business, 8e © 2008 The McGraw-Hill Companies, Inc., All Rights
Reserved.
Nickels McHugh McHughNickels McHugh McHugh
**Understanding
FinancialInformation
andAccounting 17
CH
AP
TE
R*
* *

17-2
***
Importance ofImportance of Accounting InformationAccounting Information
• Definition- Definition- AccountingAccounting
• AudiencesAudiences
• ManagersManagers
• GovernmentGovernment
• Investors, Investors, Suppliers & Suppliers & CreditorsCreditors

17-3
***
The Accounting SystemThe Accounting System

17-4
***
The Influence ofThe Influence of Accounting InformationAccounting Information
• ManagersManagers- Financial reports pinpoint - Financial reports pinpoint problems/opportunitiesproblems/opportunities
• GovernmentGovernment- assists with tax collection- assists with tax collection
• Investors, Suppliers, & CreditorsInvestors, Suppliers, & Creditors- provides a - provides a means to analyze businessmeans to analyze business

17-5
***
Areas of AccountingAreas of Accounting
• Managerial Managerial AccountingAccounting
• Inside Inside OrganizationOrganization
• C.M.A. C.M.A.
• Tax AccountingTax Accounting
• Government & Government & Not-for-profit Not-for-profit AccountingAccounting
• Financial Financial AccountingAccounting
• Annual ReportAnnual Report
• Private Private AccountantAccountant
• Public Public AccountantAccountant
• C.P.A.C.P.A.
• AuditingAuditing
17-6
***
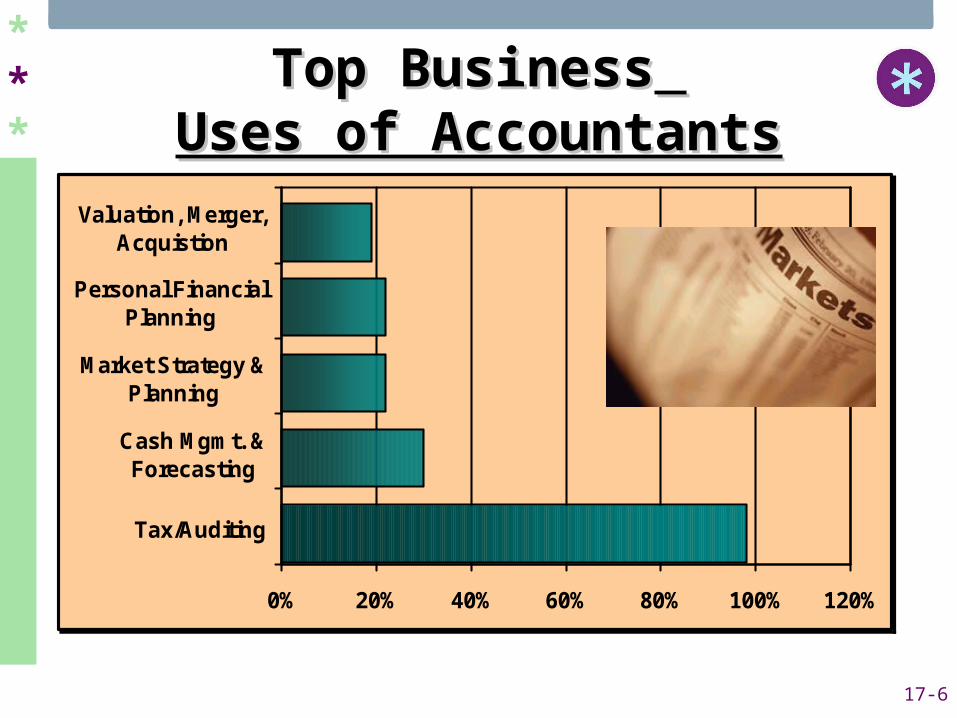
0% 20% 40% 60% 80% 100% 120%
Tax/Auditing
Cash Mgmt. &Forecasting
Market Strategy &Planning
Personal FinancialPlanning
Valuation, Merger,Acquistion
Top BusinessTop Business Uses of AccountantsUses of Accountants
17-7
***
How to Read aHow to Read a Corporate Annual ReportCorporate Annual Report
• Read management’s discussion of changes in operations. Try to identify strengths or weaknesses.
• Review the firm’s consolidated balance sheet. (Its assets, liabilities, and owners’ equity.)
• Analyze the Income Statement. Look beyond the year. (Sales drops can spell trouble.)
• Review the statement of changes in cash flows.
• Review auditor’s opinion.

17-8
***
PublicPublic• AuditingAuditing
• Tax Consulting Tax Consulting & Compliance& Compliance
• Management Management ConsultingConsulting
PrivatePrivate• Management Management
AccountingAccounting
• Government Government AccountingAccounting
• AcademiaAcademia
Types of AccountantsTypes of Accountants

17-9
***
““Cooking the Books”Cooking the Books”
• Early Recognition of RevenueEarly Recognition of Revenue
• Late Recognition of ExpenseLate Recognition of Expense
• Inadequate Reserves for Bad Inadequate Reserves for Bad Debts, Returns, & LiabilitiesDebts, Returns, & Liabilities
• Changing Inventory Valuation Changing Inventory Valuation Methods- 1 Time Boost to IncomeMethods- 1 Time Boost to Income
• Phony Transactions With Phony Transactions With PartnershipsPartnerships
Courtesy of B. Lilly- De Anza College
17-10
***
5 Tips To Be Ahead of 5 Tips To Be Ahead of Sneaky Accountant TricksSneaky Accountant Tricks
1.1. Who’s whoWho’s who
2.2. Pick out the bad applesPick out the bad apples
3.3. Don’t fall for rapid refundDon’t fall for rapid refund
4.4. Know their loyaltyKnow their loyalty
5.5. Watch what you signWatch what you sign
Source: CNNMoney.com, March 17, 2006

17-11
***
5 Ways to Avoid 5 Ways to Avoid More EnronsMore Enrons
1.1. Bring hidden liabilities back onto the Bring hidden liabilities back onto the balance sheetbalance sheet
2.2. Highlight the things that matterHighlight the things that matter
3.3. List the risks and assumptions built List the risks and assumptions built into the numbersinto the numbers
4.4. Standardize operating incomeStandardize operating income
5.5. Provide aid in figuring free-cash flowProvide aid in figuring free-cash flow
Source: Business Week, February 18, 2002

17-12
***
Sarbanes-Oxley TimelineSarbanes-Oxley Timeline
EffectiveEffective RequirementsRequirements
July 30, 2002July 30, 2002Prohibit personal loans to officers/directors.Prohibit personal loans to officers/directors.
CEOs/CFOs return incentive-based CEOs/CFOs return incentive-based compensation after erroneous financial report.compensation after erroneous financial report.
August 29, 2002August 29, 2002CEOs/CFOs must certify annual/quarterly CEOs/CFOs must certify annual/quarterly reports. Officers must make certifications reports. Officers must make certifications
regarding company’s internal controls.regarding company’s internal controls.
January 26, 2003January 26, 2003Responsibilities for attorneys/audit firms Responsibilities for attorneys/audit firms
increased. Disclosure requirements for off-increased. Disclosure requirements for off-balance sheets transactions tightened. balance sheets transactions tightened.
April 26, 2003April 26, 2003Audit committees must: be independent Audit committees must: be independent
directors, be responsible for compensation & directors, be responsible for compensation & oversight of certifying accountants.oversight of certifying accountants.
17-13
***
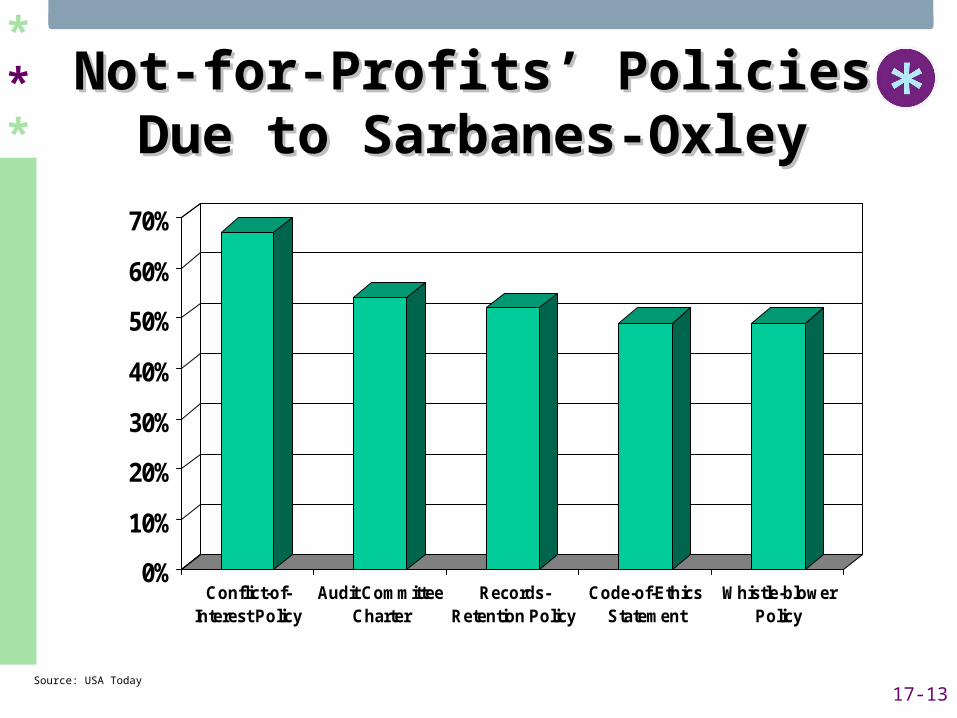
Not-for-Profits’ Policies Not-for-Profits’ Policies Due to Sarbanes-Oxley Due to Sarbanes-Oxley
0%
10%
20%
30%
40%
50%
60%
70%
Conflict-of-Interest Policy
Audit CommitteeCharter
Records-Retention Policy
Code-of-EthicsStatement
Whistle-blowerPolicy
Source: USA Today

17-14
***
How can Sarbanes-OxleyHow can Sarbanes-Oxley be Improved? be Improved?
0%
10%
20%
30%
40%
50%
60%
70%
80%
No changes Exempt smallercompanies
Scale it back orremove it
completely
Separatepervasive
control matters
Provide betterguidance
Source: USA Today
17-15
***
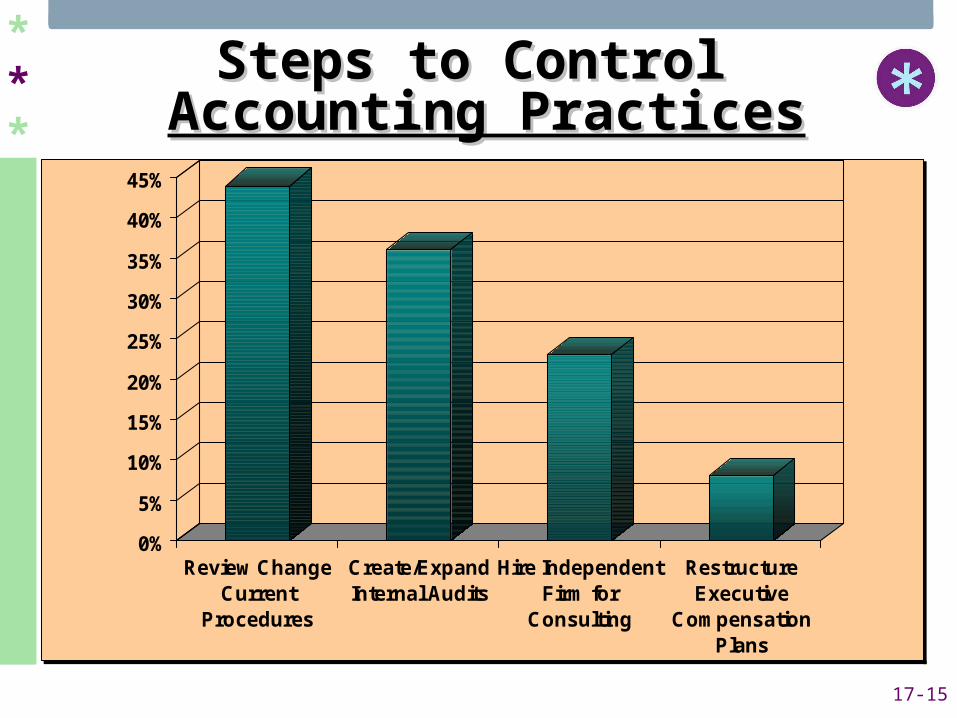
Steps to Control Steps to Control Accounting PracticesAccounting Practices
Source: USA Today, “Snapshots”, Section B, pg. 1, March 26, 2003
0%
5%
10%
15%
20%
25%
30%
35%
40%
45%
Review ChangeCurrent
Procedures
Create/ExpandInternal Audits
Hire IndependentFirm for
Consulting
RestructureExecutive
CompensationPlans

17-16
***
Bookkeeping vs. AccountingBookkeeping vs. Accounting
BookkeepingBookkeeping
• Start of AccountingStart of Accounting
• Record/JournalizeRecord/Journalize
AccountingAccounting
• AnalyzeAnalyze
• RecommendRecommend

17-17
***
Steps In TheSteps In The Accounting CycleAccounting Cycle
Analyze Source Documents
Record Transactions
in Journals
Post Journal Entries to Ledger
Take a Trial Balance
Prepare Financial
Statements
Analyze Financial
Statements

17-18
***
Computers & AccountingComputers & Accounting
• Tool Not Decision MakerTool Not Decision Maker
• SimplificationSimplification
• Accounting PackagesAccounting Packages
• Up-To-the-Minute Up-To-the-Minute InformationInformation
• Less MonotonyLess Monotony

17-19
***
Financial StatementsFinancial Statements
• Balance Sheet- Statement of Financial Balance Sheet- Statement of Financial PositionPosition
• Income Statement- Statement of Income Statement- Statement of Revenues & ExpensesRevenues & Expenses
• Statement of Cash Flows – Statement Statement of Cash Flows – Statement of Cash Receipts & Disbursementsof Cash Receipts & Disbursements

17-20
***
Accounting EquationAccounting Equation
AssetsAssets Liabilities + Owner’s Liabilities + Owner’s EquityEquity
OwneOwnedd
Owed + Owner’s Owed + Owner’s ClaimsClaims
==
==
$826,00$826,0000
== $613,00$613,0000
++ $213,00$213,0000
Very Vegetarian Company
17-21
***
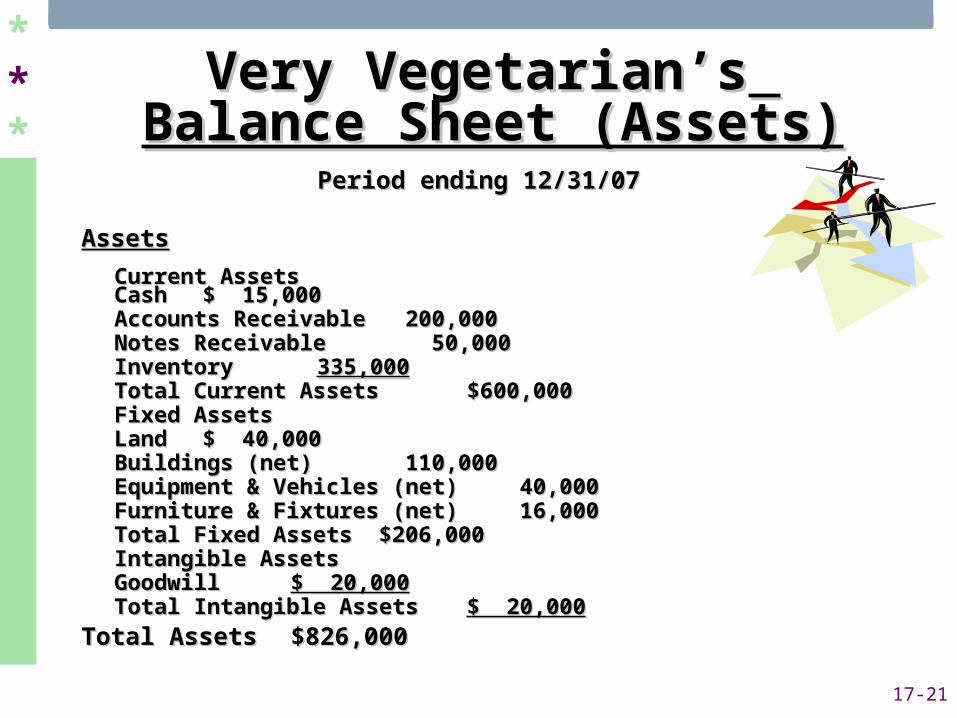
Very Vegetarian’sVery Vegetarian’s Balance Sheet (Assets)Balance Sheet (Assets)
Period ending 12/31/07Period ending 12/31/07
AssetsAssets
Current AssetsCurrent AssetsCashCash $ 15,000$ 15,000Accounts ReceivableAccounts Receivable 200,000 200,000Notes ReceivableNotes Receivable 50,000 50,000InventoryInventory 335,000335,000Total Current AssetsTotal Current Assets $600,000$600,000
Fixed AssetsFixed AssetsLandLand $ 40,000$ 40,000Buildings (net)Buildings (net) 110,000 110,000Equipment & Vehicles (net)Equipment & Vehicles (net) 40,000 40,000Furniture & Fixtures (net)Furniture & Fixtures (net) 16,000 16,000Total Fixed AssetsTotal Fixed Assets $206,000$206,000
Intangible AssetsIntangible AssetsGoodwillGoodwill $ 20,000$ 20,000Total Intangible AssetsTotal Intangible Assets $ 20,000$ 20,000
Total AssetsTotal Assets $826,000$826,000
17-22
***
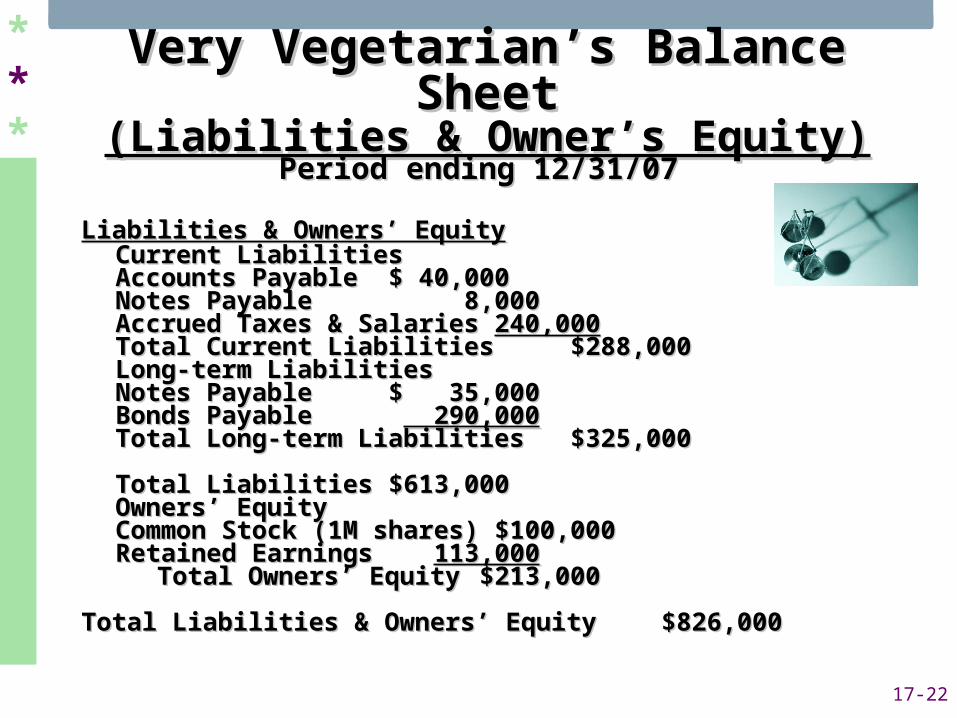
Very Vegetarian’s Balance Very Vegetarian’s Balance SheetSheet
(Liabilities & Owner’s Equity)(Liabilities & Owner’s Equity)Period ending 12/31/07Period ending 12/31/07
Liabilities & Owners’ EquityLiabilities & Owners’ EquityCurrent LiabilitiesCurrent Liabilities
Accounts PayableAccounts Payable $ 40,000$ 40,000Notes PayableNotes Payable 8,000 8,000Accrued Taxes & SalariesAccrued Taxes & Salaries 240,000240,000Total Current LiabilitiesTotal Current Liabilities $288,000$288,000
Long-term LiabilitiesLong-term LiabilitiesNotes PayableNotes Payable $ 35,000$ 35,000Bonds PayableBonds Payable 290,000 290,000Total Long-term LiabilitiesTotal Long-term Liabilities $325,000$325,000
Total LiabilitiesTotal Liabilities $613,000$613,000Owners’ EquityOwners’ Equity
Common Stock (1M shares)Common Stock (1M shares) $100,000 $100,000Retained EarningsRetained Earnings 113,000113,000
Total Owners’ EquityTotal Owners’ Equity $213,000$213,000
Total Liabilities & Owners’ EquityTotal Liabilities & Owners’ Equity $826,000$826,000
17-23
***
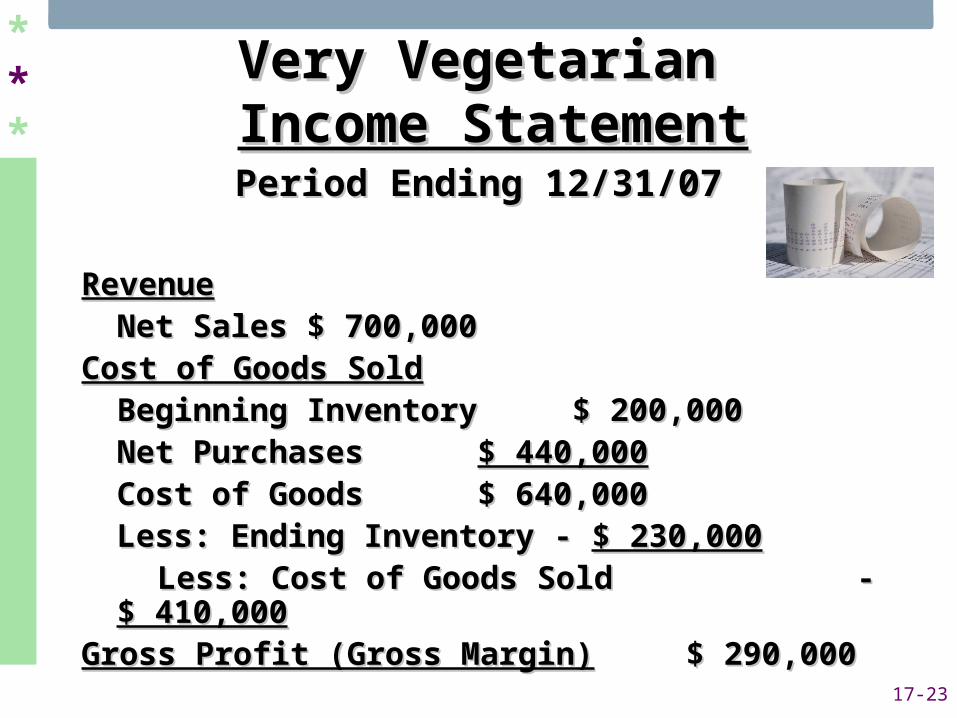
Very Vegetarian Very Vegetarian Income StatementIncome Statement
Period Ending 12/31/07Period Ending 12/31/07
RevenueRevenueNet SalesNet Sales $ 700,000$ 700,000
Cost of Goods SoldCost of Goods SoldBeginning InventoryBeginning Inventory $ 200,000 $ 200,000Net PurchasesNet Purchases $ 440,000$ 440,000Cost of Goods Cost of Goods $ 640,000 $ 640,000Less: Ending Inventory - Less: Ending Inventory - $ 230,000$ 230,000
Less: Cost of Goods SoldLess: Cost of Goods Sold - - $ 410,000$ 410,000Gross Profit (Gross Margin)Gross Profit (Gross Margin) $ 290,000$ 290,000

17-24
***
Very Vegetarian’s Very Vegetarian’s Income Statement (cont’d)Income Statement (cont’d)
Gross Profit Gross Profit $290,000$290,000Operating ExpensesOperating Expenses
Selling ExpensesSelling ExpensesSalariesSalaries $ 90,000$ 90,000Advertising & SuppliesAdvertising & Supplies $ 20,000$ 20,000
Total Selling ExpensesTotal Selling Expenses $ 110,000$ 110,000General ExpensesGeneral Expenses
Office SalariesOffice Salaries $ 67,000$ 67,000DepreciationDepreciation $ 1,500$ 1,500InsuranceInsurance $ 1,500$ 1,500RentRent $ 28,000$ 28,000UtilitiesUtilities $ 12,000$ 12,000MiscellaneousMiscellaneous $ 2,000$ 2,000
Total General ExpensesTotal General Expenses $ 112,000$ 112,000Less: Total Operating ExpensesLess: Total Operating Expenses - - $ 222,000$ 222,000
Net Income (Profit) Before TaxesNet Income (Profit) Before Taxes $ 68,000$ 68,000Less: Income Tax ExpensesLess: Income Tax Expenses - - $ 19,000$ 19,000Net Income (Profit) After TaxesNet Income (Profit) After Taxes $ 49,000$ 49,000

17-25
***
Very Vegetarian’sVery Vegetarian’sStatement of Cash FlowStatement of Cash Flow
Net Cash Flow from OperationsNet Cash Flow from Operations $ 52,000$ 52,000
Net Cash Flows from InvestmentsNet Cash Flows from Investments ( 6,000)( 6,000)Net Cash Flow from FinancingNet Cash Flow from Financing (19,000)(19,000)Net Change in Cash & EquivalentsNet Change in Cash & Equivalents $ $ 27,00027,000Beginning Cash BalanceBeginning Cash Balance ( 2,000)( 2,000)Ending Cash BalanceEnding Cash Balance $ 25,000$ 25,000
==================

17-26
***
Liquidity RatiosLiquidity Ratios
Current AssetsCurrent Liabilities
Quick (Acid-Test) RatioQuick (Acid-Test) Ratio
Cash + Marketable Securities + Cash + Marketable Securities + ReceivablesReceivables
Current LiabilitiesCurrent Liabilities
Current RatioCurrent Ratio

17-27
***
Very Vegetarian Very Vegetarian Current RatioCurrent Ratio
$600,000$600,000$288,000$288,000
== 2.082.08
$265,000$265,000$288,000$288,000 == 0.920.92
Quick (Acid-Test) RatioQuick (Acid-Test) Ratio
17-28
***
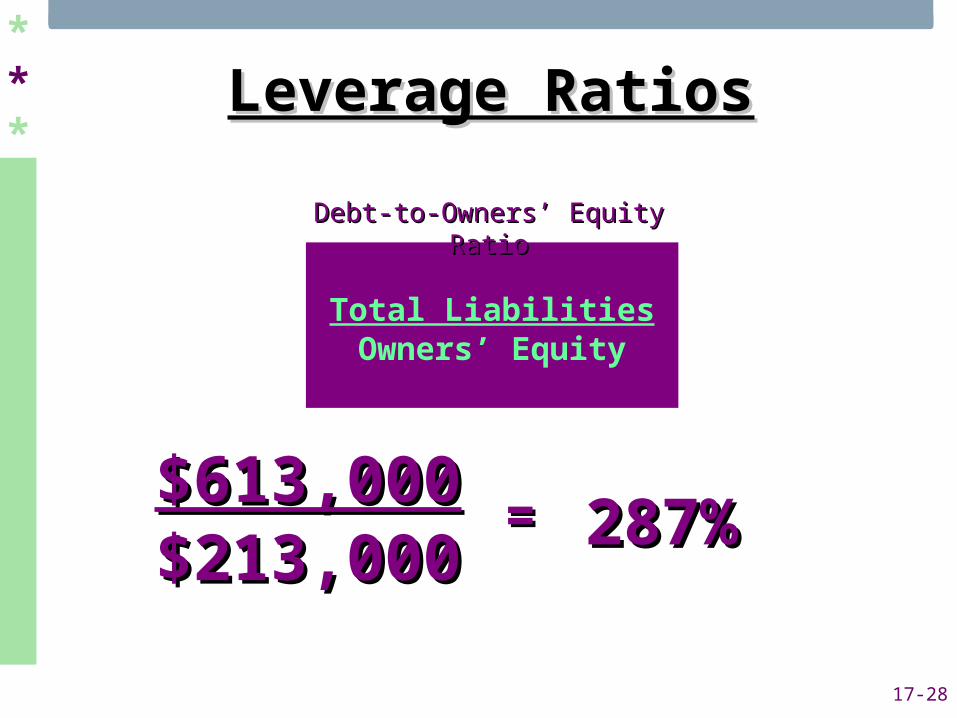
Leverage RatiosLeverage Ratios
Total LiabilitiesOwners’ Equity
Debt-to-Owners’ Equity RatioDebt-to-Owners’ Equity Ratio
$613,000$613,000$213,000$213,000
== 287%287%
17-29
***
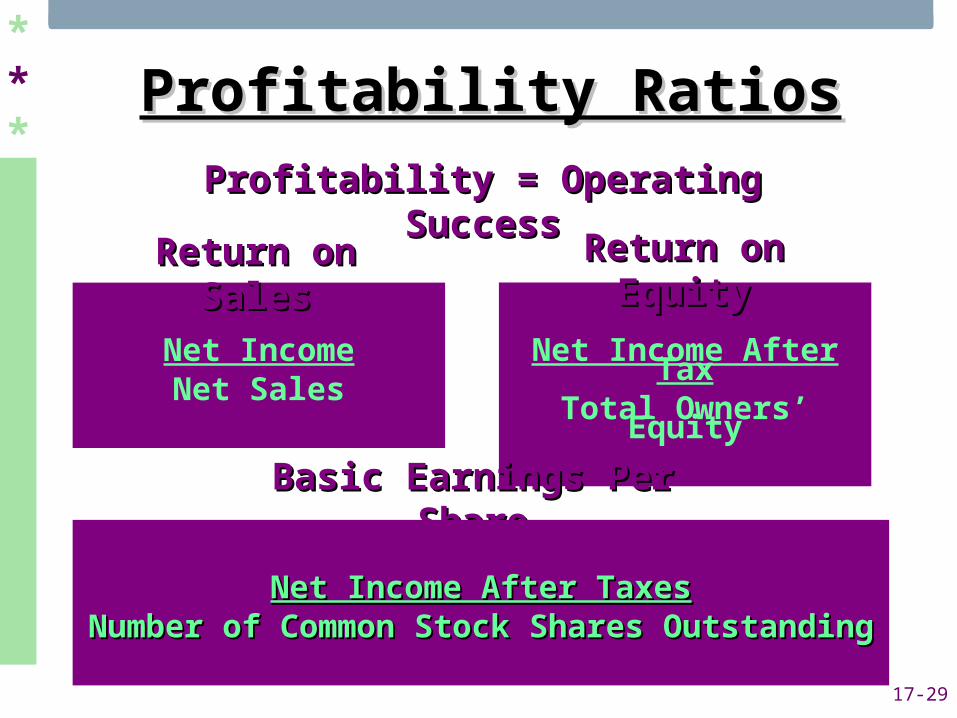
Profitability RatiosProfitability Ratios
Net Income After Tax
Total Owners’ Equity
Basic Earnings Per Basic Earnings Per ShareShare
Net Income After TaxesNet Income After TaxesNumber of Common Stock Shares Number of Common Stock Shares
OutstandingOutstanding
Return on Return on EquityEquity
Net IncomeNet Sales
Return on Return on SalesSales
Profitability = Operating Profitability = Operating SuccessSuccess
17-30
***
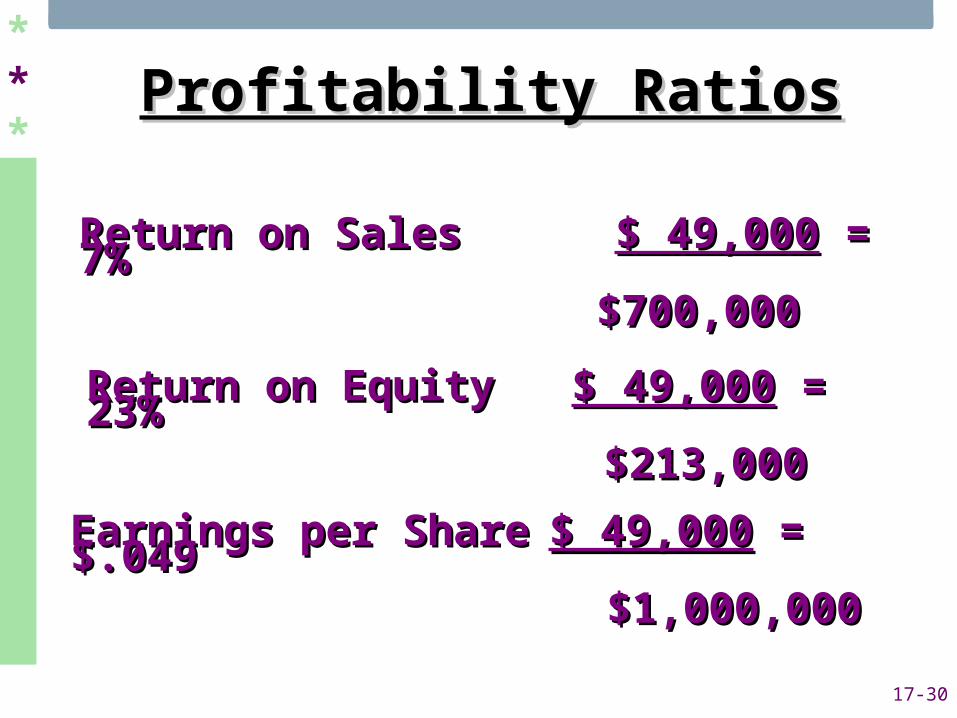
Profitability RatiosProfitability Ratios
Earnings per ShareEarnings per Share $ 49,000$ 49,000 = = $.049$.049
$1,000,000$1,000,000
Return on Sales Return on Sales $ 49,000$ 49,000 = = 7%7%
$700,000$700,000
Return on Equity Return on Equity $ 49,000$ 49,000 = = 23%23%
$213,000$213,000

17-31
***
Activity RatiosActivity Ratios
Inventory Turnover Inventory Turnover $410,000$410,000 = = 1.91.9
$215,000$215,000
Cost of Goods SoldAverage Inventory
Inventory TurnoverInventory Turnover