Embed Size (px)
Citation preview

9.3.2015
Kim Yukyeong
Photovoltaic Power Applicationsin UK
For FinSolar ProjectAalto University School of Business
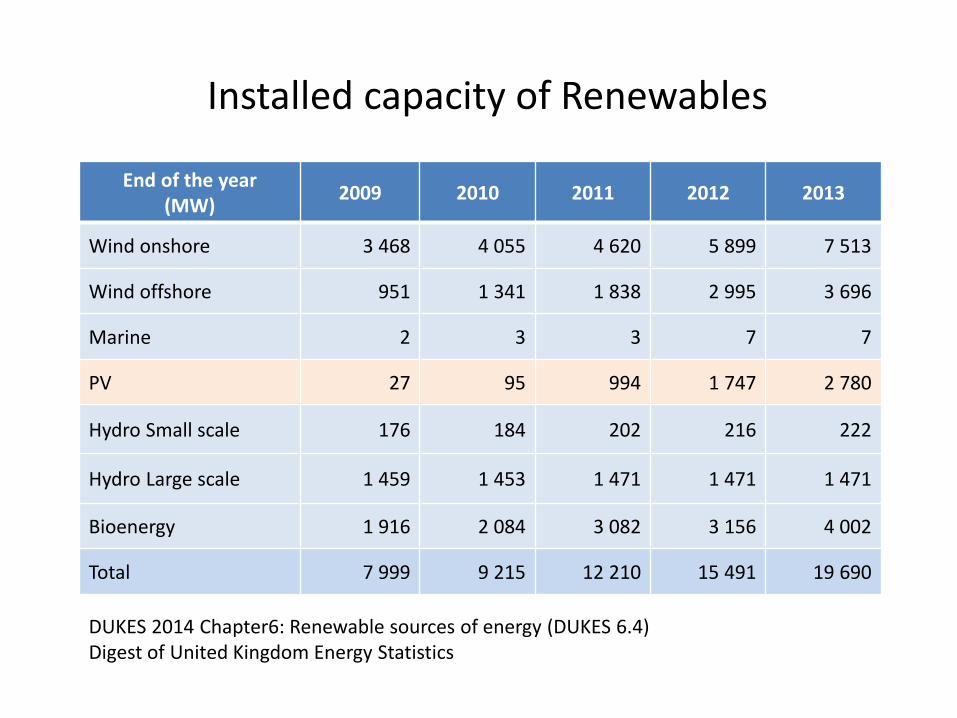
Installed capacity of Renewables
End of the year(MW)
2009 2010 2011 2012 2013
Wind onshore 3 468 4 055 4 620 5 899 7 513
Wind offshore 951 1 341 1 838 2 995 3 696
Marine 2 3 3 7 7
PV 27 95 994 1 747 2 780
Hydro Small scale 176 184 202 216 222
Hydro Large scale 1 459 1 453 1 471 1 471 1 471
Bioenergy 1 916 2 084 3 082 3 156 4 002
Total 7 999 9 215 12 210 15 491 19 690
DUKES 2014 Chapter6: Renewable sources of energy (DUKES 6.4) Digest of United Kingdom Energy Statistics

Generated electricity from Renewables
During the year(GWh)
2009 2010 2011 2012 2013
Wind onshore 7 529 7 136 10 347 12 111 16 992
Wind offshore 1 754 3044 5 126 7 550 11 441
Marine 1 2 1 4 6
PV 20 40 244 1 351 2 036
Hydro 5 231 3 568 5 682 5 285 4 698
Bioenergy 10 674 11 996 13 098 14 914 18 494
Total renewables 25 208 25 785 34 498 41 214 53 667
*All technologies 376 718 381 772 367 251 363 407 379 531
https://www.gov.uk/government/statistics/energy-trends-section-6-renewables (DUKES 6.4)*Electricity Generated from all generating companies, Historical electricity data: 1920 to 2013from https://www.gov.uk/government/statistical-data-sets/historical-electricity-data-1920-to-2011
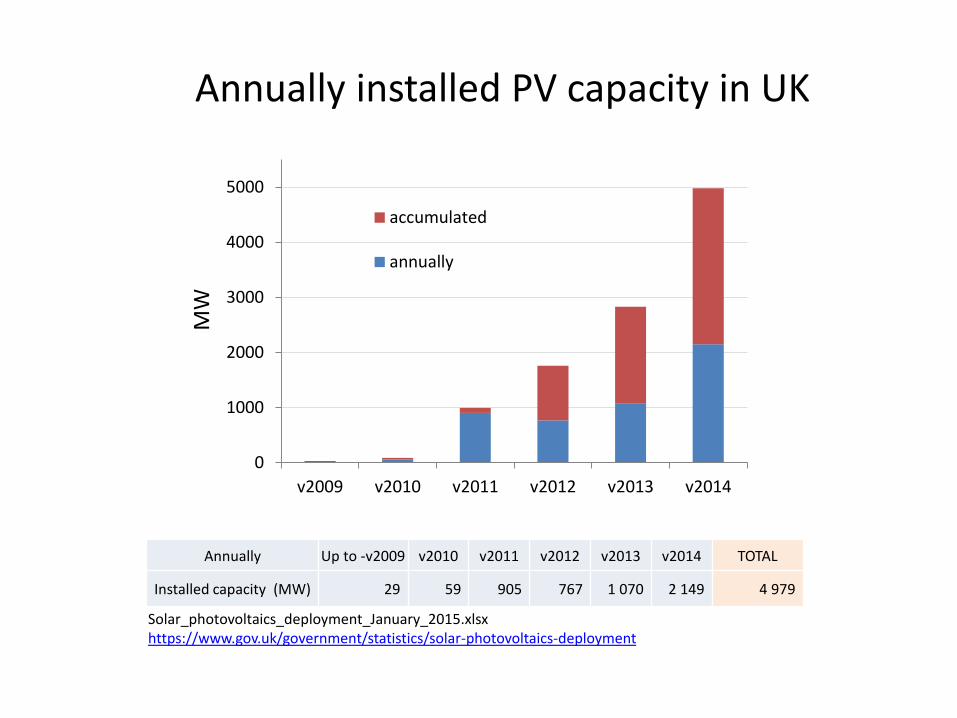
Annually installed PV capacity in UK
MW
0
1000
2000
3000
4000
5000
v2009 v2010 v2011 v2012 v2013 v2014
accumulated
annually
Annually Up to -v2009 v2010 v2011 v2012 v2013 v2014 TOTAL
Installed capacity (MW) 29 59 905 767 1 070 2 149 4 979
Solar_photovoltaics_deployment_January_2015.xlsxhttps://www.gov.uk/government/statistics/solar-photovoltaics-deployment
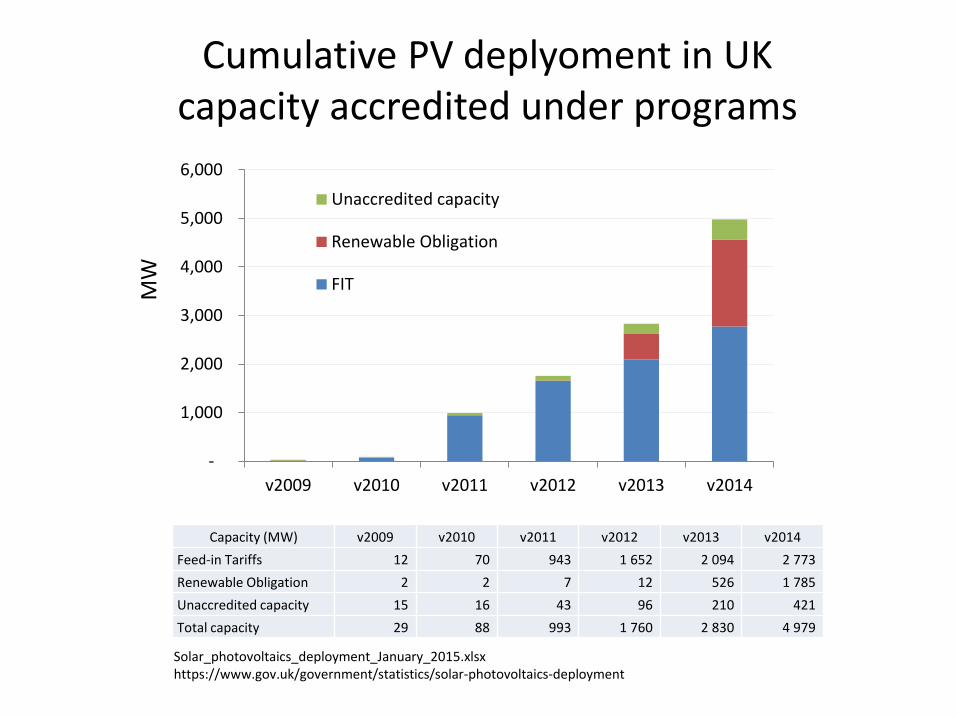
Cumulative PV deplyoment in UKcapacity accredited under programs
-
1,000
2,000
3,000
4,000
5,000
6,000
v2009 v2010 v2011 v2012 v2013 v2014
Unaccredited capacity
Renewable Obligation
FIT
Capacity (MW) v2009 v2010 v2011 v2012 v2013 v2014
Feed-in Tariffs 12 70 943 1 652 2 094 2 773
Renewable Obligation 2 2 7 12 526 1 785
Unaccredited capacity 15 16 43 96 210 421
Total capacity 29 88 993 1 760 2 830 4 979
Solar_photovoltaics_deployment_January_2015.xlsxhttps://www.gov.uk/government/statistics/solar-photovoltaics-deployment
MW
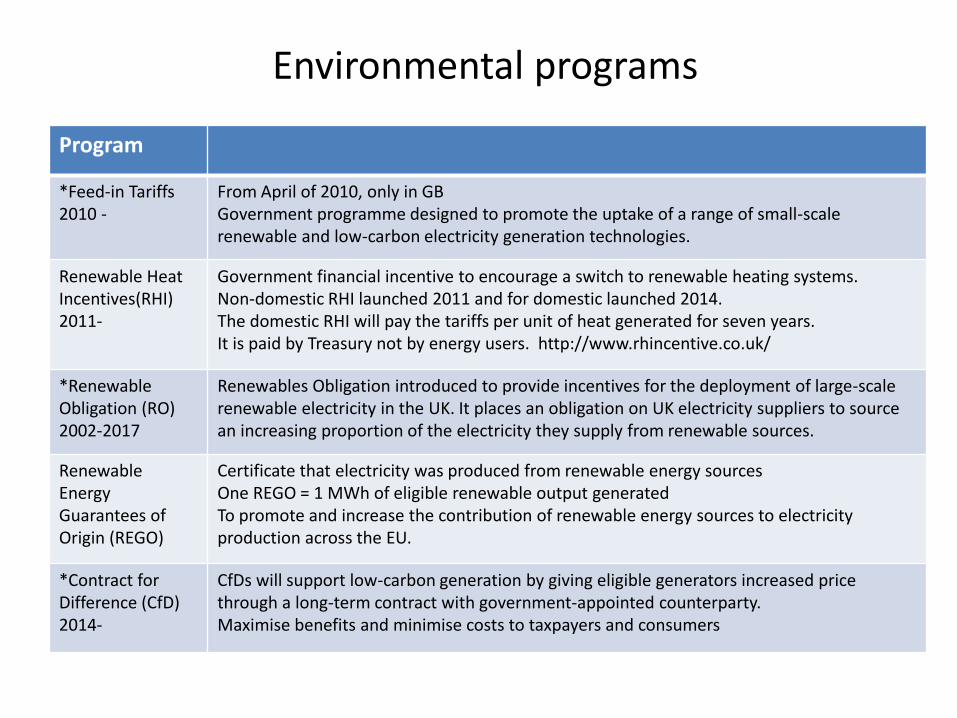
Environmental programs
Program
*Feed-in Tariffs2010 -
From April of 2010, only in GBGovernment programme designed to promote the uptake of a range of small-scale renewable and low-carbon electricity generation technologies.
Renewable HeatIncentives(RHI)2011-
Government financial incentive to encourage a switch to renewable heating systems.Non-domestic RHI launched 2011 and for domestic launched 2014. The domestic RHI will pay the tariffs per unit of heat generated for seven years.It is paid by Treasury not by energy users. http://www.rhincentive.co.uk/
*RenewableObligation (RO)2002-2017
Renewables Obligation introduced to provide incentives for the deployment of large-scale renewable electricity in the UK. It places an obligation on UK electricity suppliers to source an increasing proportion of the electricity they supply from renewable sources.
Renewable Energy Guarantees of Origin (REGO)
Certificate that electricity was produced from renewable energy sourcesOne REGO = 1 MWh of eligible renewable output generated To promote and increase the contribution of renewable energy sources to electricity production across the EU.
*Contract for Difference (CfD)2014-
CfDs will support low-carbon generation by giving eligible generators increased price through a long-term contract with government-appointed counterparty. Maximise benefits and minimise costs to taxpayers and consumers

Feed-in Tariffs
Great Britain launched in April 2010 for incentivise the uptake and deployment of small scale renewable technologies.
Individual tariff rates are assigned, depending on the technology, size, and eligibility of the installation
• Photovoltaics (PV) up to total installed capacity of 5MW
• Wind up to 5MW
• Hydro up to 5MW
• Anaerobic Digestion up to 5MW
• Micro CHP plants with a maximum total installed capacity of up to 2kW
Who pay? Energy suppliers
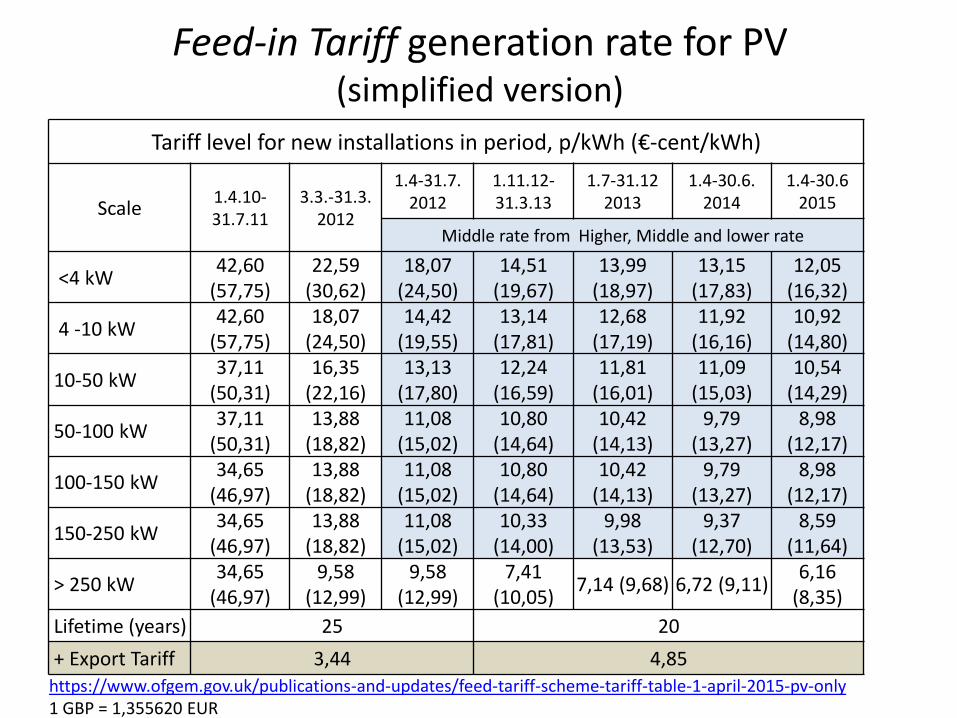
Feed-in Tariff generation rate for PV(simplified version)
Tariff level for new installations in period, p/kWh (€-cent/kWh)
Scale1.4.10-31.7.11
3.3.-31.3.2012
1.4-31.7.2012
1.11.12-31.3.13
1.7-31.122013
1.4-30.6.2014
1.4-30.62015
Middle rate from Higher, Middle and lower rate
<4 kW42,60
(57,75)22,59
(30,62)18,07
(24,50)14,51
(19,67)13,99
(18,97)13,15
(17,83)12,05
(16,32)
4 -10 kW42,60
(57,75)18,07
(24,50)14,42
(19,55)13,14
(17,81)12,68
(17,19)11,92
(16,16)10,92
(14,80)
10-50 kW37,11
(50,31)16,35
(22,16)13,13
(17,80)12,24
(16,59)11,81
(16,01)11,09
(15,03)10,54
(14,29)
50-100 kW37,11
(50,31)13,88
(18,82)11,08
(15,02)10,80
(14,64)10,42
(14,13)9,79
(13,27)8,98
(12,17)
100-150 kW34,65
(46,97)13,88
(18,82)11,08
(15,02)10,80
(14,64)10,42
(14,13)9,79
(13,27)8,98
(12,17)
150-250 kW34,65
(46,97)13,88
(18,82)11,08
(15,02)10,33
(14,00)9,98
(13,53)9,37
(12,70)8,59
(11,64)
> 250 kW34,65
(46,97)9,58
(12,99)9,58
(12,99)7,41
(10,05)7,14 (9,68) 6,72 (9,11)
6,16 (8,35)
Lifetime (years) 25 20
+ Export Tariff 3,44 4,85https://www.ofgem.gov.uk/publications-and-updates/feed-tariff-scheme-tariff-table-1-april-2015-pv-only1 GBP = 1,355620 EUR
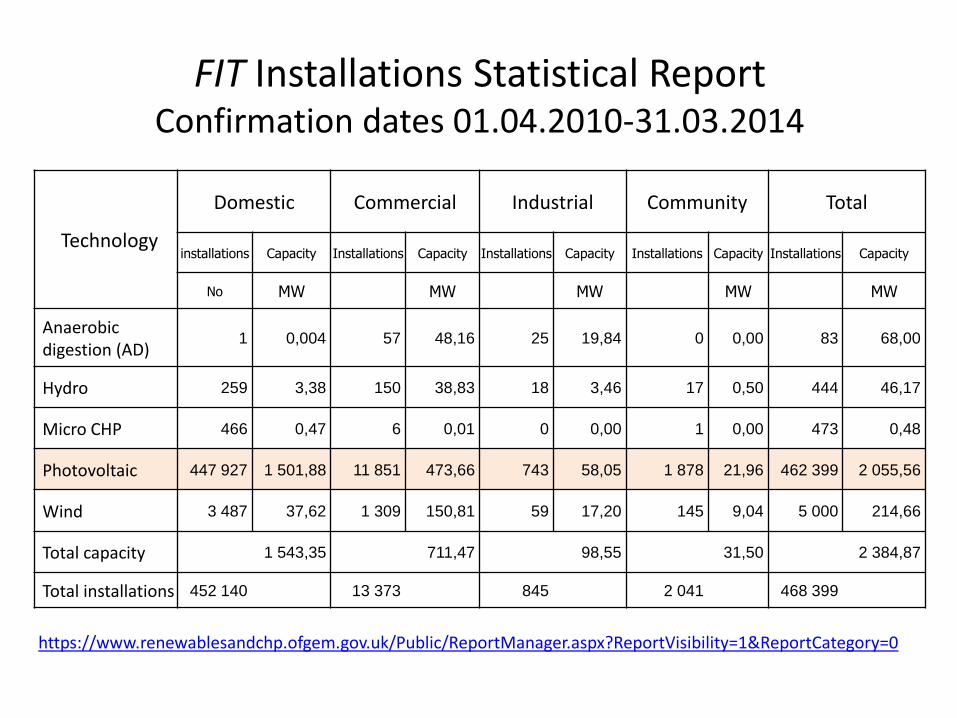
FIT Installations Statistical ReportConfirmation dates 01.04.2010-31.03.2014
Technology
Domestic Commercial Industrial Community Total
installations Capacity Installations Capacity Installations Capacity Installations Capacity Installations Capacity
No MW MW MW MW MW
Anaerobicdigestion (AD)
1 0,004 57 48,16 25 19,84 0 0,00 83 68,00
Hydro 259 3,38 150 38,83 18 3,46 17 0,50 444 46,17
Micro CHP 466 0,47 6 0,01 0 0,00 1 0,00 473 0,48
Photovoltaic 447 927 1 501,88 11 851 473,66 743 58,05 1 878 21,96 462 399 2 055,56
Wind 3 487 37,62 1 309 150,81 59 17,20 145 9,04 5 000 214,66
Total capacity 1 543,35 711,47 98,55 31,50 2 384,87
Total installations 452 140 13 373 845 2 041 468 399
https://www.renewablesandchp.ofgem.gov.uk/Public/ReportManager.aspx?ReportVisibility=1&ReportCategory=0
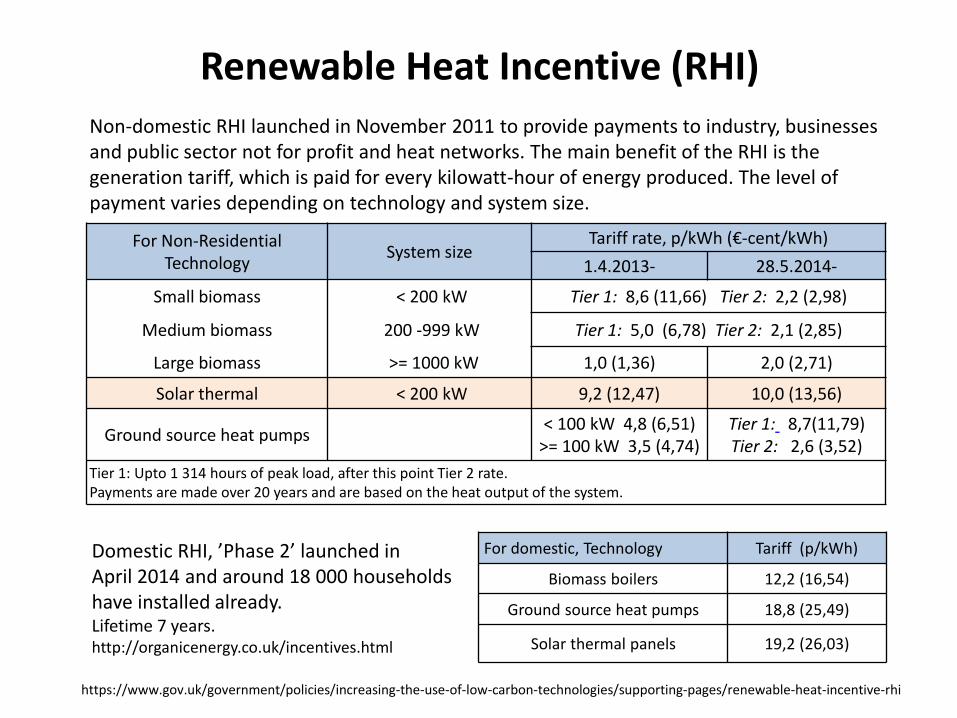
Renewable Heat Incentive (RHI)
Non-domestic RHI launched in November 2011 to provide payments to industry, businesses and public sector not for profit and heat networks. The main benefit of the RHI is the generation tariff, which is paid for every kilowatt-hour of energy produced. The level of payment varies depending on technology and system size.
For Non-ResidentialTechnology
System sizeTariff rate, p/kWh (€-cent/kWh)
1.4.2013- 28.5.2014-
Small biomass < 200 kW Tier 1: 8,6 (11,66) Tier 2: 2,2 (2,98)
Medium biomass 200 -999 kW Tier 1: 5,0 (6,78) Tier 2: 2,1 (2,85)
Large biomass >= 1000 kW 1,0 (1,36) 2,0 (2,71)
Solar thermal < 200 kW 9,2 (12,47) 10,0 (13,56)
Ground source heat pumps< 100 kW 4,8 (6,51)
>= 100 kW 3,5 (4,74)Tier 1: 8,7(11,79)Tier 2: 2,6 (3,52)
Tier 1: Upto 1 314 hours of peak load, after this point Tier 2 rate. Payments are made over 20 years and are based on the heat output of the system.
Domestic RHI, ’Phase 2’ launched in April 2014 and around 18 000 householdshave installed already. Lifetime 7 years.http://organicenergy.co.uk/incentives.html
For domestic, Technology Tariff (p/kWh)
Biomass boilers 12,2 (16,54)
Ground source heat pumps 18,8 (25,49)
Solar thermal panels 19,2 (26,03)
https://www.gov.uk/government/policies/increasing-the-use-of-low-carbon-technologies/supporting-pages/renewable-heat-incentive-rhi
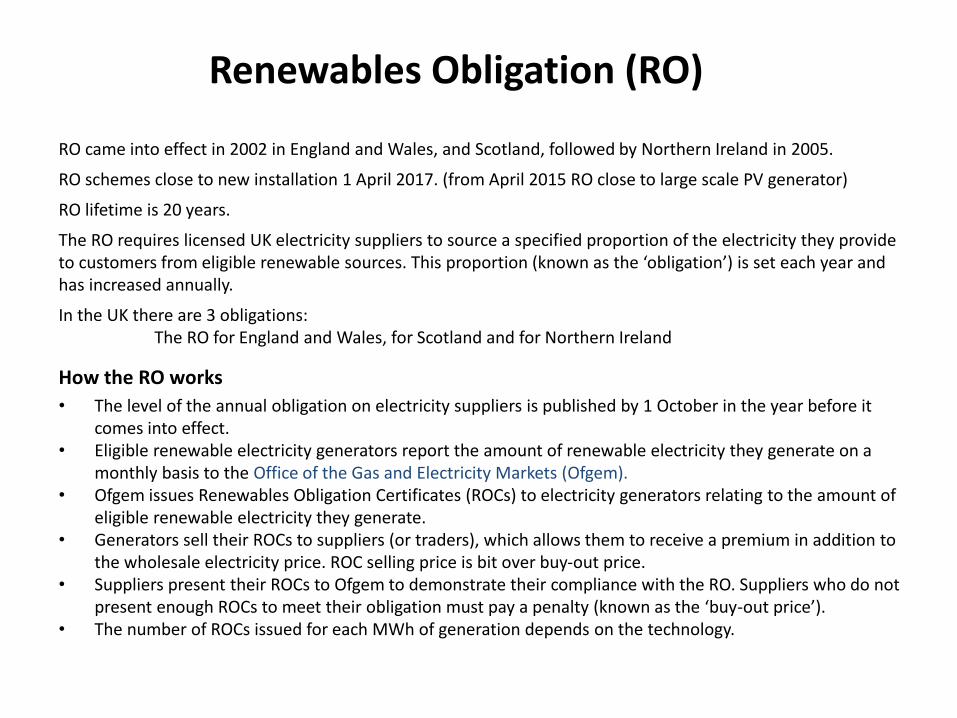
Renewables Obligation (RO)
RO came into effect in 2002 in England and Wales, and Scotland, followed by Northern Ireland in 2005.
RO schemes close to new installation 1 April 2017. (from April 2015 RO close to large scale PV generator)
RO lifetime is 20 years.
The RO requires licensed UK electricity suppliers to source a specified proportion of the electricity they provide to customers from eligible renewable sources. This proportion (known as the ‘obligation’) is set each year and has increased annually.
In the UK there are 3 obligations: The RO for England and Wales, for Scotland and for Northern Ireland
How the RO works
• The level of the annual obligation on electricity suppliers is published by 1 October in the year before it comes into effect.
• Eligible renewable electricity generators report the amount of renewable electricity they generate on a monthly basis to the Office of the Gas and Electricity Markets (Ofgem).
• Ofgem issues Renewables Obligation Certificates (ROCs) to electricity generators relating to the amount of eligible renewable electricity they generate.
• Generators sell their ROCs to suppliers (or traders), which allows them to receive a premium in addition to the wholesale electricity price. ROC selling price is bit over buy-out price.
• Suppliers present their ROCs to Ofgem to demonstrate their compliance with the RO. Suppliers who do not present enough ROCs to meet their obligation must pay a penalty (known as the ‘buy-out price’).
• The number of ROCs issued for each MWh of generation depends on the technology.
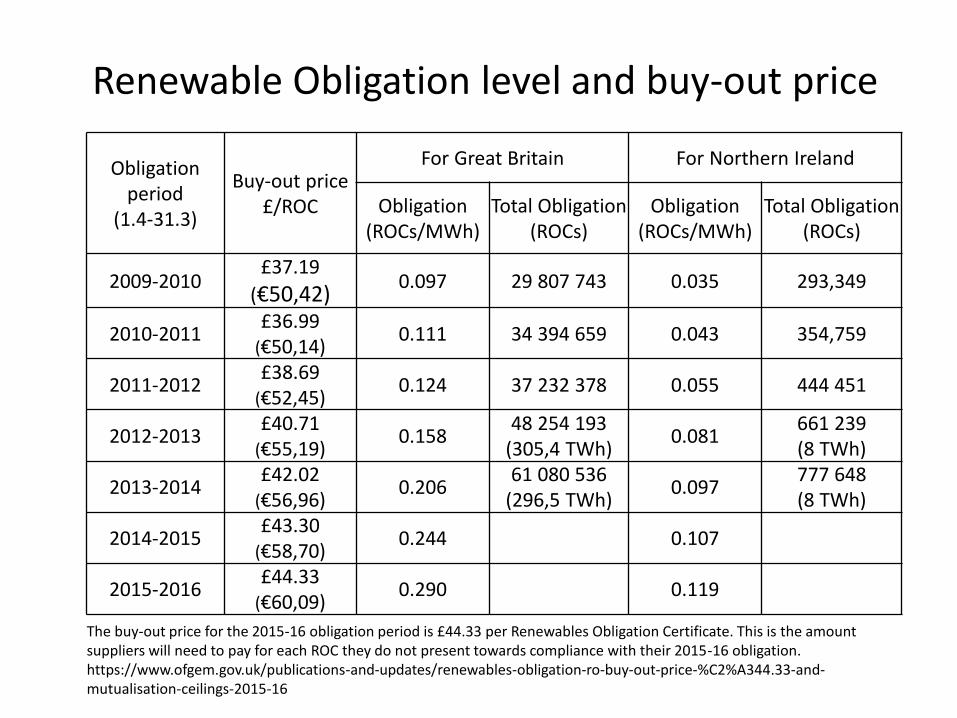
Renewable Obligation level and buy-out price
Obligation period
(1.4-31.3)
Buy-out price£/ROC
For Great Britain For Northern Ireland
Obligation (ROCs/MWh)
Total Obligation(ROCs)
Obligation (ROCs/MWh)
Total Obligation (ROCs)
2009-2010£37.19
(€50,42)0.097 29 807 743 0.035 293,349
2010-2011£36.99
(€50,14)0.111 34 394 659 0.043 354,759
2011-2012£38.69
(€52,45)0.124 37 232 378 0.055 444 451
2012-2013£40.71
(€55,19)0.158
48 254 193(305,4 TWh)
0.081661 239(8 TWh)
2013-2014£42.02
(€56,96)0.206
61 080 536(296,5 TWh)
0.097777 648(8 TWh)
2014-2015£43.30
(€58,70)0.244 0.107
2015-2016£44.33
(€60,09)0.290 0.119
The buy-out price for the 2015-16 obligation period is £44.33 per Renewables Obligation Certificate. This is the amount suppliers will need to pay for each ROC they do not present towards compliance with their 2015-16 obligation.https://www.ofgem.gov.uk/publications-and-updates/renewables-obligation-ro-buy-out-price-%C2%A344.33-and-mutualisation-ceilings-2015-16
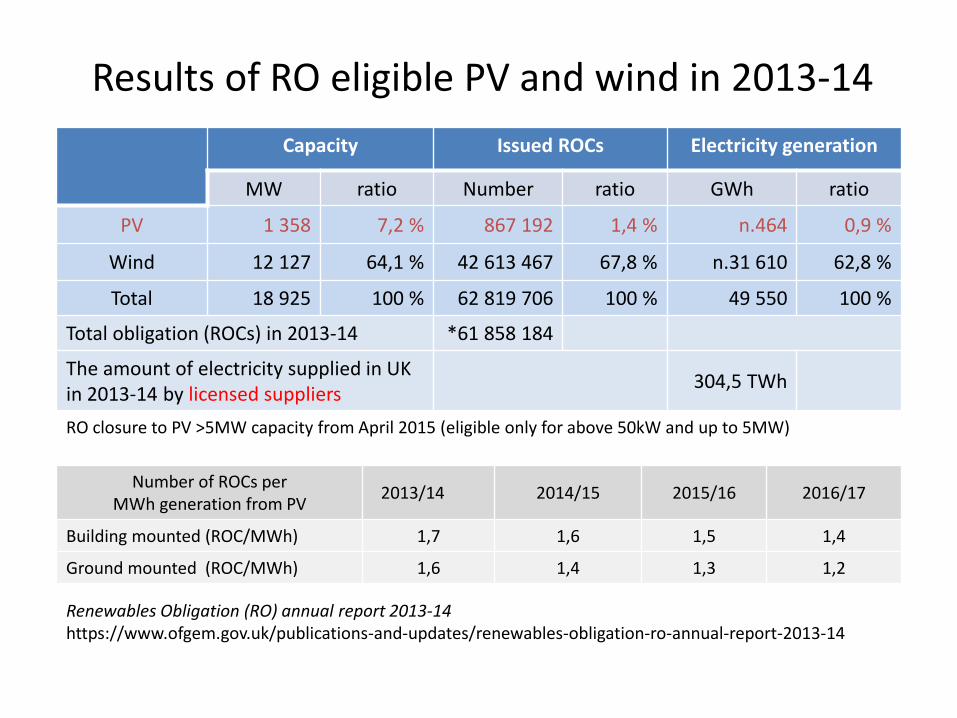
Results of RO eligible PV and wind in 2013-14
Capacity Issued ROCs Electricity generation
MW ratio Number ratio GWh ratio
PV 1 358 7,2 % 867 192 1,4 % n.464 0,9 %
Wind 12 127 64,1 % 42 613 467 67,8 % n.31 610 62,8 %
Total 18 925 100 % 62 819 706 100 % 49 550 100 %
Total obligation (ROCs) in 2013-14 *61 858 184
The amount of electricity supplied in UKin 2013-14 by licensed suppliers
304,5 TWh
RO closure to PV >5MW capacity from April 2015 (eligible only for above 50kW and up to 5MW)
Number of ROCs per MWh generation from PV
2013/14 2014/15 2015/16 2016/17
Building mounted (ROC/MWh) 1,7 1,6 1,5 1,4
Ground mounted (ROC/MWh) 1,6 1,4 1,3 1,2
Renewables Obligation (RO) annual report 2013-14https://www.ofgem.gov.uk/publications-and-updates/renewables-obligation-ro-annual-report-2013-14
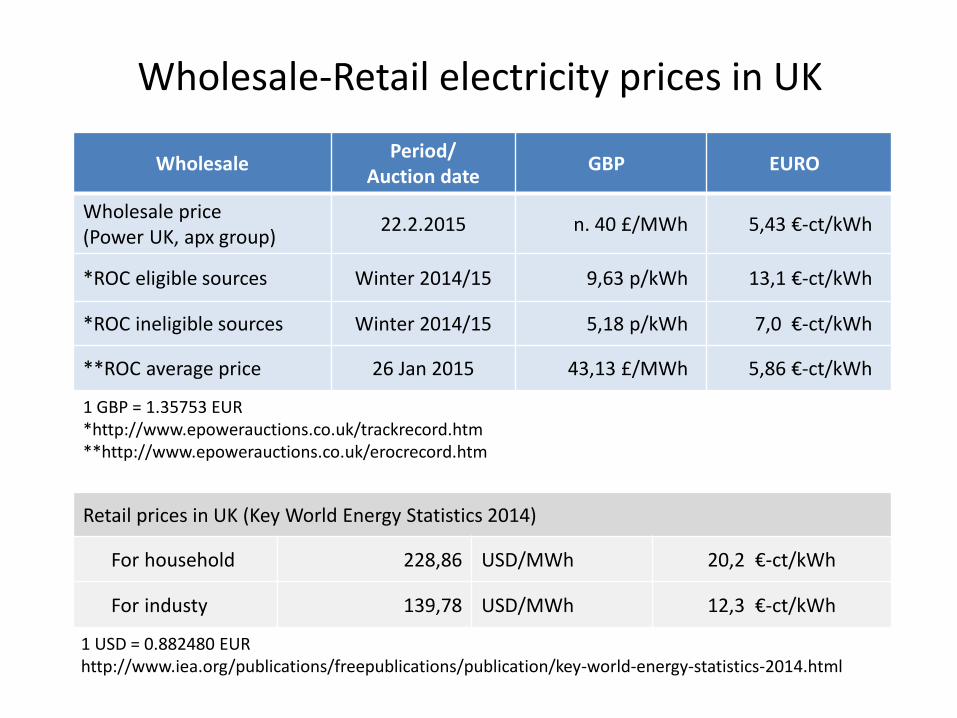
Wholesale-Retail electricity prices in UK
WholesalePeriod/
Auction dateGBP EURO
Wholesale price(Power UK, apx group)
22.2.2015 n. 40 £/MWh 5,43 €-ct/kWh
*ROC eligible sources Winter 2014/15 9,63 p/kWh 13,1 €-ct/kWh
*ROC ineligible sources Winter 2014/15 5,18 p/kWh 7,0 €-ct/kWh
**ROC average price 26 Jan 2015 43,13 £/MWh 5,86 €-ct/kWh
1 GBP = 1.35753 EUR*http://www.epowerauctions.co.uk/trackrecord.htm**http://www.epowerauctions.co.uk/erocrecord.htm
Retail prices in UK (Key World Energy Statistics 2014)
For household 228,86 USD/MWh 20,2 €-ct/kWh
For industy 139,78 USD/MWh 12,3 €-ct/kWh
1 USD = 0.882480 EURhttp://www.iea.org/publications/freepublications/publication/key-world-energy-statistics-2014.html

Contracts for Difference (CfD)
• Key part of the Government’s Electricity Market Reform programme, to secure the significant investment required to replace the generation capacity closing this decade and deliver low-carbon electricity system and also to minimise costs to consumers.
• The Renewables Obligation is the existing financial support for large-scale renewable generation. RO close to new generators in 2017.
• CfDs will support low-carbon generation by giving increased price through a long-term contract. Generators will receive revenue from selling their electricity into the market. If the market price is below pre-agreed strike price, government-appointed counterparty pay the difference to the generator. If the market price is over the strike price then the generator must pay back the difference to the counterparty.
• CfD budget divided into two groups
– Pot 1. mature technology: PV, Onshore wind, Hydro, Energy from waste with CHP …
– Pot 2. less extablished technology: Offshore wind, Tide etc.
• Pot 1 group generators will compete to get a grant through auction, competitive price reduces costs to consumers.
• CfDs lifetime is 15 years.
• Applications for Allocation Round One began October 2014 and outcome of the first CfDallocation round published in 26 Feb 2015

CfD’ budget and strike prices
Budget, £m (€m) 2015/16 2016/17 2017/18 2018/19 2019/20
CfD annual budget (2014)50
(67,78)220
(298,24)325
(440,58)325
(440,58)325
(440,58)
*Pot 1. established technologies50
(67,78)65
(88,12)65
(88,12)65
(88,12)65
(88,12)
Pot 2. less established technologies -155
(210,12)260
(352,46)260
(352,46)260
(352,46)
https://www.gov.uk/government/publications/cfd-budget-notice*Pot 1. Group will have to compete in auction, bid price no higher than administative strike price.
Strike prices 2012, £/MWh(€/MWh) 2014/15 2015/16 2016/17 2017/18 2018/19
*Onshore wind (> 5MW)95 (128,78) 95 (128,78) 95 (128,78) 90 (128,78) 90 (128,78)
*PV (> 5MW) 120 (162,67)
120 (162,67)
115 (115,90)
110 (149,12)
110 (149,12)
*Hydro (>5MW, <50MW) 100 (135,56)
100 (135,56)
100 (135,56)
100 (135,56)
100 (135,56)
Offshore wind 155 (210,12)
155 (210,05)
150 (203,28)
140 (189,73)
140 (189,73)
Tidal / Wave 305 (413,33)
305 (413,33)
305 (413,33)
305 (413,33)
305 (413,33)
https://www.gov.uk/government/publications/electricity-market-reform-delivery-planCfD’ allocation round one, application closing date 30 October 2014

CfD Allocation Round One OutcomeSuccessful applicantsProject name
TechnologyCapacity
MW
Strike price£/MWh
(€/MWh)Delivery year
BHEG WalsallAdvanced
conversion Tech26 114,39 (155,02) 2018-2019
Wren Power and PulpEnergy from Waste
with CHP 49,75 80,00 (108,41) 2018-2019
EA 1 (Scottishpower Renewables(UK) Limited )
Offshore wind 714,0 119,89 (167,47) 2017-2018*
Dorenell Wind Farm Onshore wind 177 82,50 (111,80) 2018-2019
Wick Farm Solar Park Solar PV 19,1 50,00 (67,76) 2015-2016
Charity Farm Solar PV 14,67 79,23 (107,37) 2016-2017
Royston Solar Farm Solar PV 13,78 50,00 (67,76) 2015-2016
Netley Landfill Solar Solar PV 12 79,23 (107,37) 2016-2017
Triangle Farm Solar Park Solar PV 12 79,23 (107,37) 2016-2017
Total 27 projects selected in Allocation Round Onehttps://www.gov.uk/government/uploads/system/uploads/attachment_data/file/407059/Contracts_for_Difference_-_Auction_Results_-_Official_Statistics.pdf
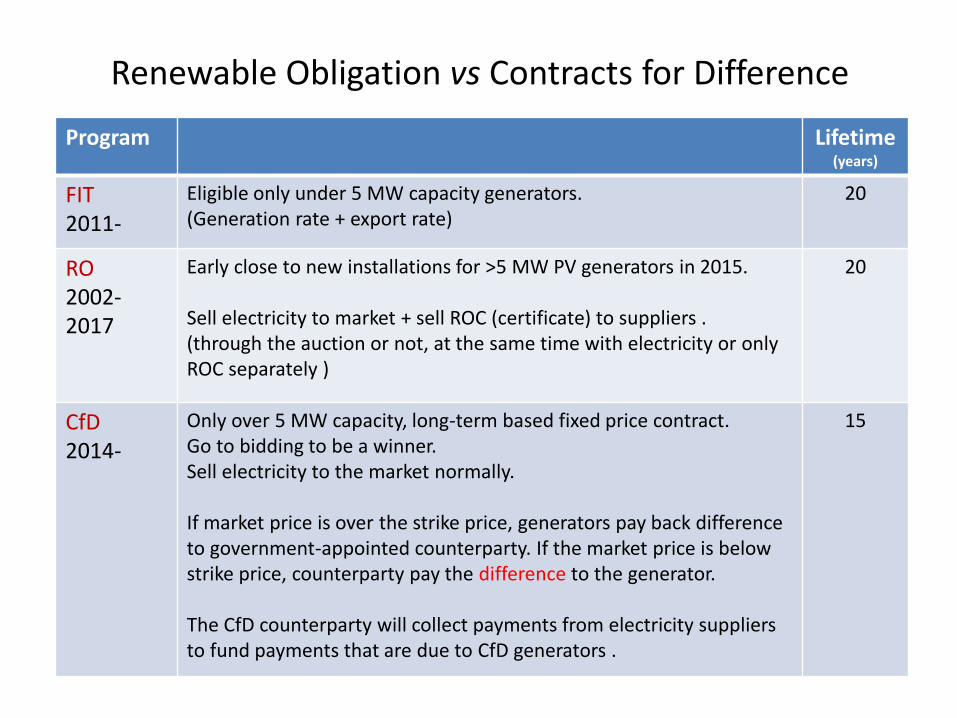
Renewable Obligation vs Contracts for Difference
Program Lifetime(years)
FIT2011-
Eligible only under 5 MW capacity generators.(Generation rate + export rate)
20
RO2002-2017
Early close to new installations for >5 MW PV generators in 2015.
Sell electricity to market + sell ROC (certificate) to suppliers .(through the auction or not, at the same time with electricity or onlyROC separately )
20
CfD2014-
Only over 5 MW capacity, long-term based fixed price contract.Go to bidding to be a winner.Sell electricity to the market normally.
If market price is over the strike price, generators pay back differenceto government-appointed counterparty. If the market price is below strike price, counterparty pay the difference to the generator.
The CfD counterparty will collect payments from electricity suppliers to fund payments that are due to CfD generators .
15
LinksGoverment UK statistics; electricity, renewables and PV deploymenthttps://www.gov.uk/government/statistics/renewable-sources-of-energy-chapter-6-digest-of-united-kingdom-energy-statistics-dukes
https://www.gov.uk/government/statistics/solar-photovoltaics-deployment
Ofgem E-servicehttps://www.renewablesandchp.ofgem.gov.uk/Public/ReportManager.aspx?ReportVisibility=1&ReportCategory=0
Ofgem Environmental programshttps://www.ofgem.gov.uk/environmental-programmes
Feed-in Tariff, Tariff table for PVhttps://www.ofgem.gov.uk/publications-and-updates/feed-tariff-scheme-tariff-table-1-april-2015-pv-only
http://www.fitariffs.co.uk/FITs/
Renewable Obligationshttps://www.ofgem.gov.uk/environmental-programmes/renewables-obligation-ro
https://www.gov.uk/calculating-renewable-obligation-certificates-rocs
Contracts for Difference (CfD)https://www.gov.uk/government/publications/electricity-market-reform-delivery-plan
https://www.gov.uk/government/uploads/system/uploads/attachment_data/file/43164/7077-electricity-market-reform-annex-a.pdf
Report Key world energy statistics 2014 http://www.iea.org/publications/freepublications/publication/key-world-energy-statistics-2014.html