Embed Size (px)
Citation preview

1
Putting Voice-of-the-Customer
Analytics at the Center of
Your Marketing Strategy
Alpha Restaurant Case Study
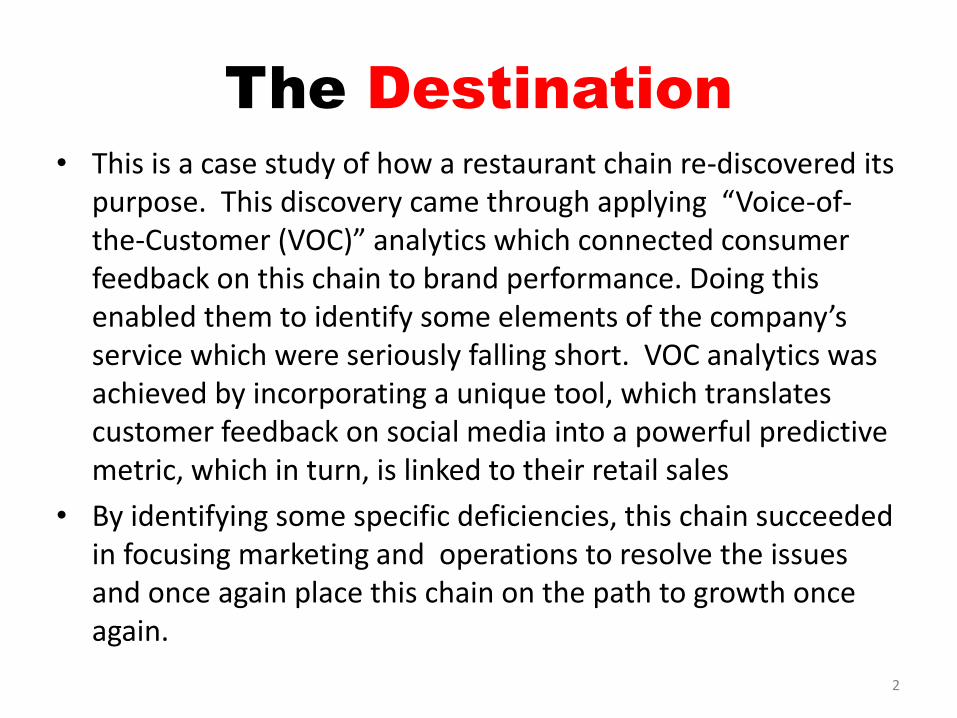
The Destination
• This is a case study of how a restaurant chain re-discovered its purpose. This discovery came through applying “Voice-of-the-Customer (VOC)” analytics which connected consumer feedback on this chain to brand performance. Doing this enabled them to identify some elements of the company’s service which were seriously falling short. VOC analytics was achieved by incorporating a unique tool, which translates customer feedback on social media into a powerful predictive metric, which in turn, is linked to their retail sales
• By identifying some specific deficiencies, this chain succeeded in focusing marketing and operations to resolve the issues and once again place this chain on the path to growth once again.
2
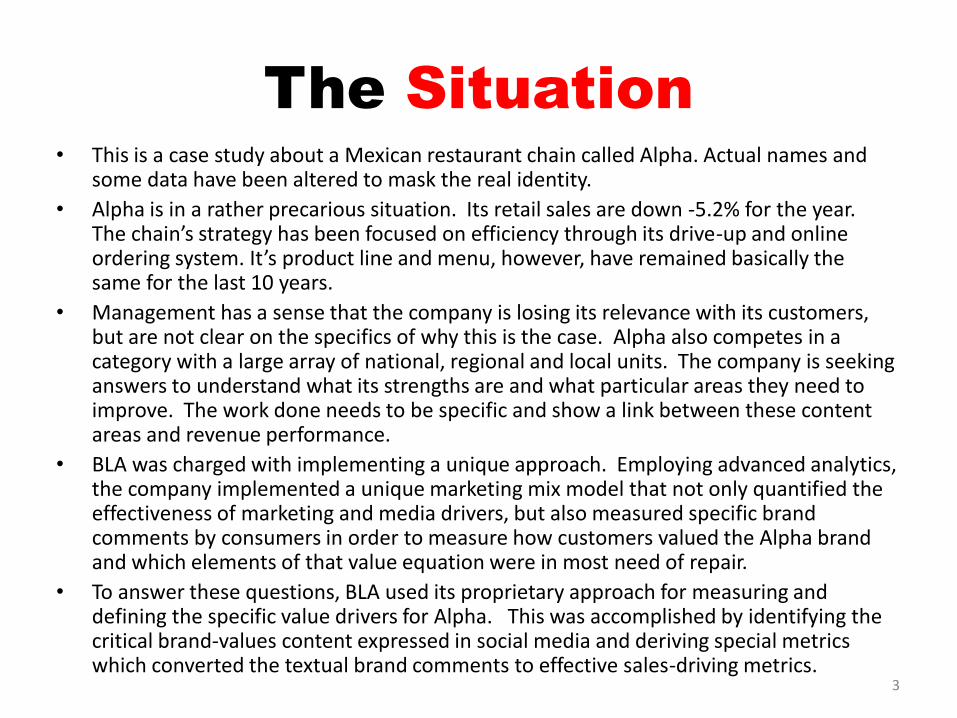
The Situation
• This is a case study about a Mexican restaurant chain called Alpha. Actual names and some data have been altered to mask the real identity.
• Alpha is in a rather precarious situation. Its retail sales are down -5.2% for the year. The chain’s strategy has been focused on efficiency through its drive-up and online ordering system. It’s product line and menu, however, have remained basically the same for the last 10 years.
• Management has a sense that the company is losing its relevance with its customers, but are not clear on the specifics of why this is the case. Alpha also competes in a category with a large array of national, regional and local units. The company is seeking answers to understand what its strengths are and what particular areas they need to improve. The work done needs to be specific and show a link between these content areas and revenue performance.
• BLA was charged with implementing a unique approach. Employing advanced analytics, the company implemented a unique marketing mix model that not only quantified the effectiveness of marketing and media drivers, but also measured specific brand comments by consumers in order to measure how customers valued the Alpha brand and which elements of that value equation were in most need of repair.
• To answer these questions, BLA used its proprietary approach for measuring and defining the specific value drivers for Alpha. This was accomplished by identifying the critical brand-values content expressed in social media and deriving special metrics which converted the textual brand comments to effective sales-driving metrics.
3
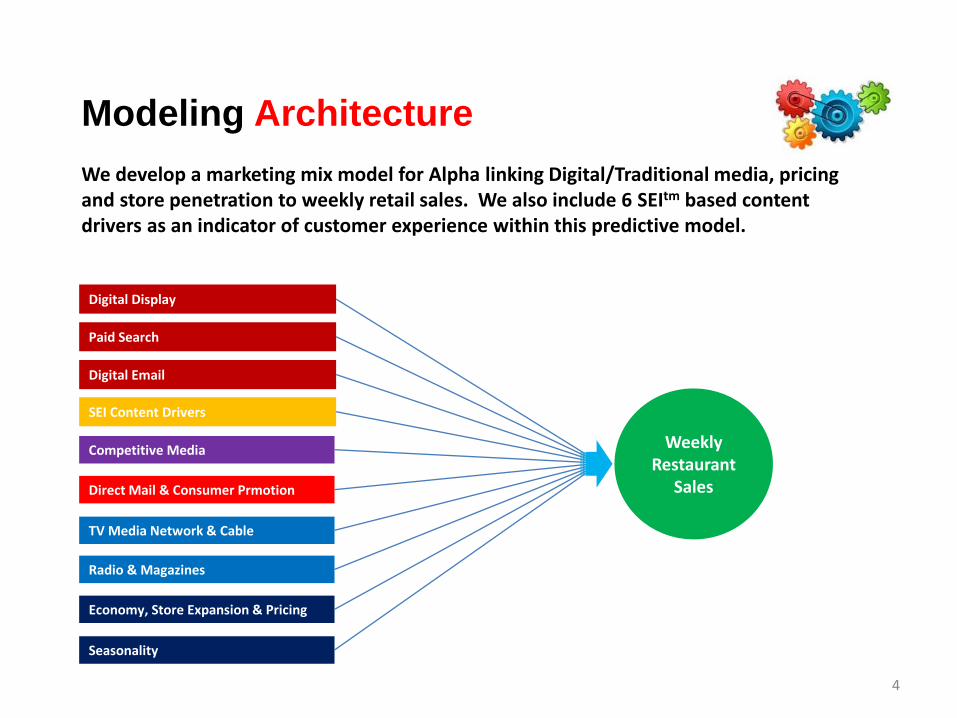
Modeling Architecture
We develop a marketing mix model for Alpha linking Digital/Traditional media, pricing and store penetration to weekly retail sales. We also include 6 SEItm based content drivers as an indicator of customer experience within this predictive model.
Digital Display
SEI Content Drivers
Paid Search
Digital Email
Competitive Media
Direct Mail & Consumer Prmotion
TV Media Network & Cable
Radio & Magazines
Economy, Store Expansion & Pricing
Seasonality
Weekly Restaurant
Sales
4
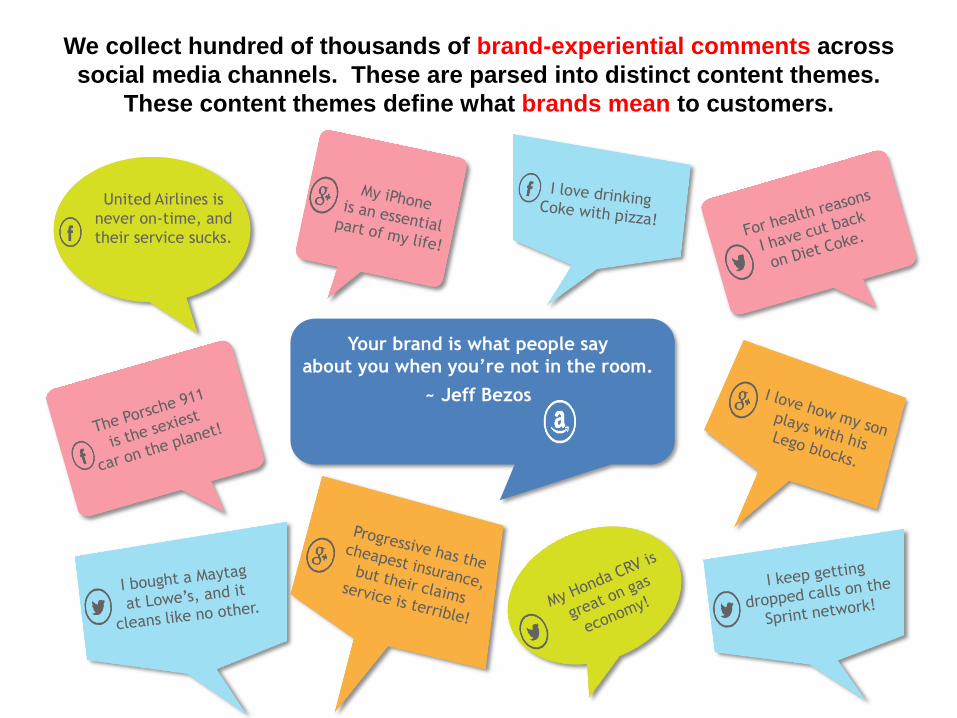
We collect hundred of thousands of brand-experiential comments across
social media channels. These are parsed into distinct content themes.
These content themes define what brands mean to customers.
United Airlines is
never on-time, and
their service sucks.
Your brand is what people say
about you when you’re not in the room.
~ Jeff Bezos
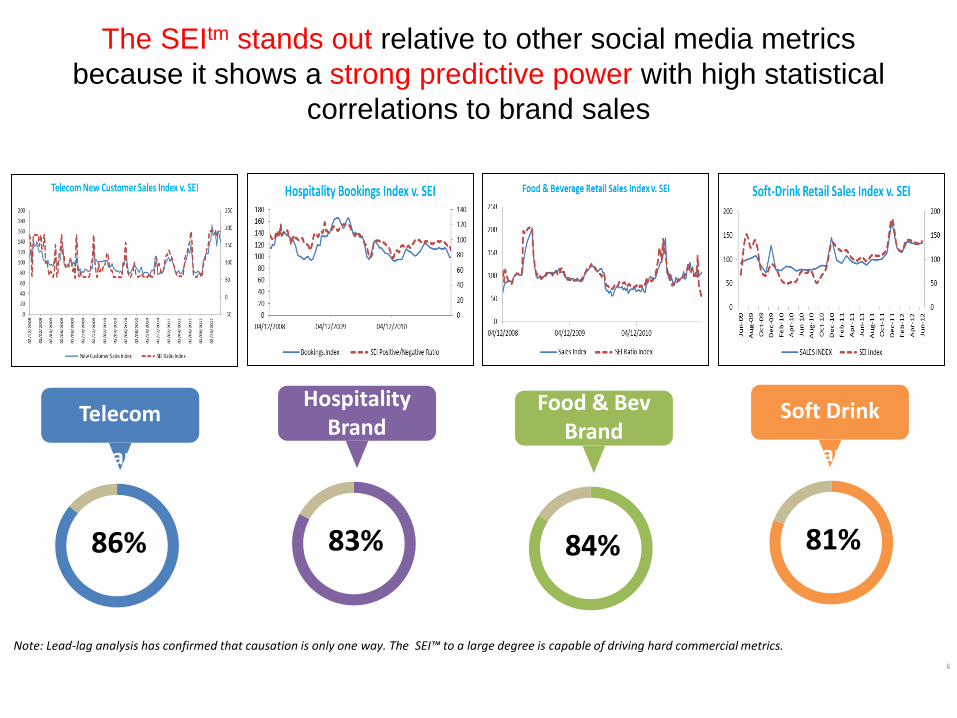
The SEItm stands out relative to other social media metrics
because it shows a strong predictive power with high statistical
correlations to brand sales
6
Note: Lead-lag analysis has confirmed that causation is only one way. The SEI™ to a large degree is capable of driving hard commercial metrics.
86%
Telecom
Brand
81%
Soft Drink
Brand
84%
Food & BevBrand
83%
Hospitality Brand

Alpha Total Retail Sales and SEItm
- 0.50 1.00 1.50 2.00 2.50 3.00 3.50 4.00
-
50,000
100,000
150,000
200,000
250,000
09
.17
.11
10
.17
.11
11
.17
.11
12
.17
.11
01
.17
.12
02
.17
.12
03
.17
.12
04
.17
.12
05
.17
.12
06
.17
.12
07
.17
.12
08
.17
.12
09
.17
.12
10
.17
.12
11
.17
.12
12
.17
.12
01
.17
.13
Tota
l SEI
Sale
s
Weeks
Retail Sales 000 SEI Ratio
Alpha’s overall SEI demonstrated strong predictive capability with a correlation to sales of 80 percent.
7
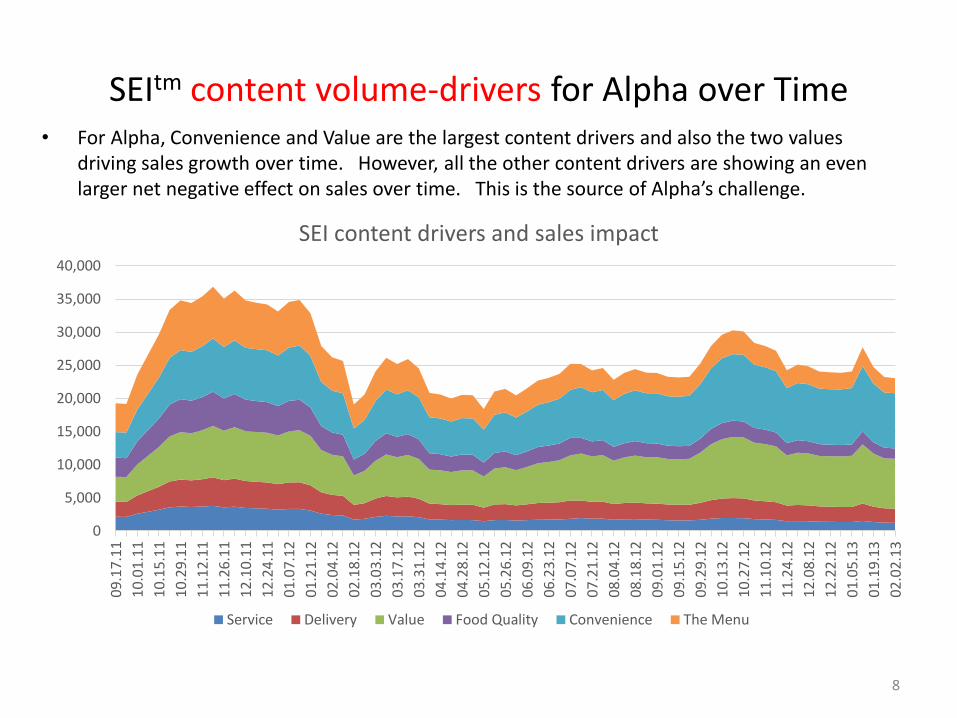
SEItm content volume-drivers for Alpha over Time
0
5,000
10,000
15,000
20,000
25,000
30,000
35,000
40,000
09
.17
.11
10
.01
.11
10
.15
.11
10
.29
.11
11
.12
.11
11
.26
.11
12
.10
.11
12
.24
.11
01
.07
.12
01
.21
.12
02
.04
.12
02
.18.
12
03
.03
.12
03
.17
.12
03
.31
.12
04
.14
.12
04
.28
.12
05
.12
.12
05
.26
.12
06
.09
.12
06
.23.
12
07
.07
.12
07
.21
.12
08
.04
.12
08
.18
.12
09
.01
.12
09
.15
.12
09
.29
.12
10
.13
.12
10
.27
.12
11
.10
.12
11
.24
.12
12
.08
.12
12
.22
.12
01
.05
.13
01
.19
.13
02
.02
.13
SEI content drivers and sales impact
Service Delivery Value Food Quality Convenience The Menu
8
• For Alpha, Convenience and Value are the largest content drivers and also the two values driving sales growth over time. However, all the other content drivers are showing an even larger net negative effect on sales over time. This is the source of Alpha’s challenge.
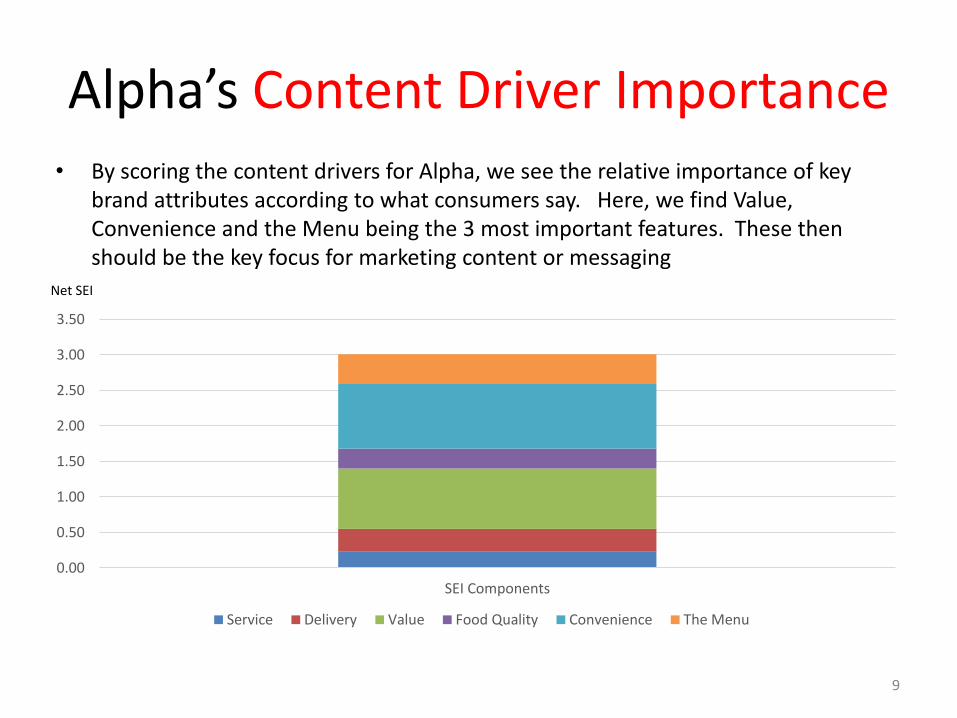
Alpha’s Content Driver Importance
0.00
0.50
1.00
1.50
2.00
2.50
3.00
3.50
SEI Components
Service Delivery Value Food Quality Convenience The Menu
• By scoring the content drivers for Alpha, we see the relative importance of key brand attributes according to what consumers say. Here, we find Value, Convenience and the Menu being the 3 most important features. These then should be the key focus for marketing content or messaging
9
Net SEI
-4 -2 0 2 4 6 8
Menu
Service
Food Quality
Value
Convenience
Delivery
Negative SEI Net SEI Positive SEI 10
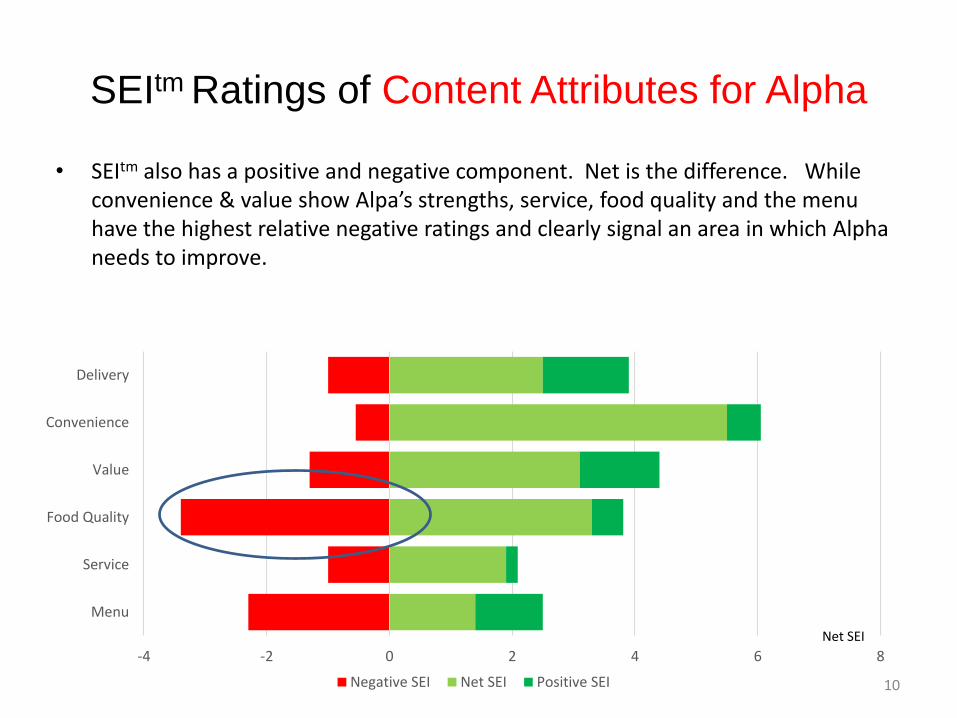
SEItm Ratings of Content Attributes for Alpha
• SEItm also has a positive and negative component. Net is the difference. While convenience & value show Alpa’s strengths, service, food quality and the menu have the highest relative negative ratings and clearly signal an area in which Alpha needs to improve.
Net SEI
Mexican Restaurants Competitive Positioning & Image
Great tasting Food
Personable Friendly employees
Treats you like a valued customer
Authentic Mexican Food
High Quality Ingredients
Food from scratch
Chain 4
Chain 3
Clean/comfortable atmosphere
Food prepared how you want it
Modern up to date
Has large portions
Healthy nutritious items
Gets order right
Chain 5
Chain 6
Chain 7
Chain 12
Chain 2
Simple Menu
Good value for money
Low prices
Open late night/24 hours
Chain 10Chain 11
Alpha
Crave menu items
Food timely/fast
Convenient nearby location
Variety of menu items
Chain 9
Has drive-thru
Chain 8
Food Quality
Service & Delivery
The Menu
Convenience
Value
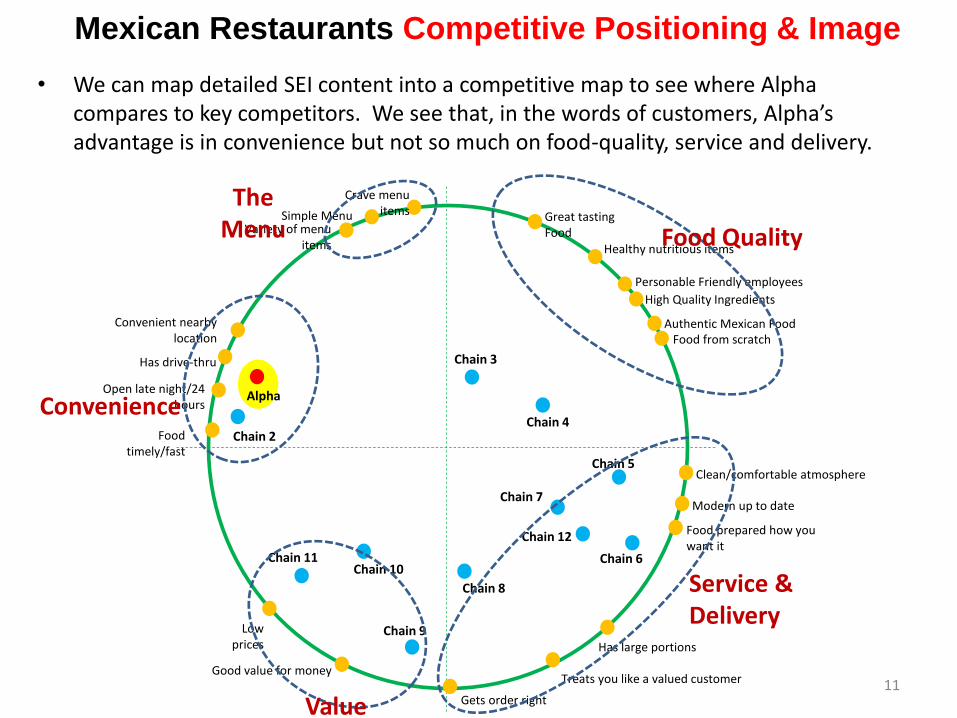
• We can map detailed SEI content into a competitive map to see where Alpha compares to key competitors. We see that, in the words of customers, Alpha’s advantage is in convenience but not so much on food-quality, service and delivery.
11
Sales Contributions
52.6%
4.5%1.3%
2.2%
0.8% 5.6% 3.1% 2.2%1.1%
0.8%7.8%
1.0%1.7%
5.7%
1.3%
6.3%
1.9%
18.0%
Contribution
Baseline Competitive.Media Digital.Display.Media
Digital.Search.Media Digital.Email Direct.Mail
Media.Cable.TV Media.Network.TV Media.Radio
Media.Magazines Consumer.Promotion SEI.Service
SEI.Delivery SEI.Value SEI.Food Quality
SEI.Convenience SEI.The Menu
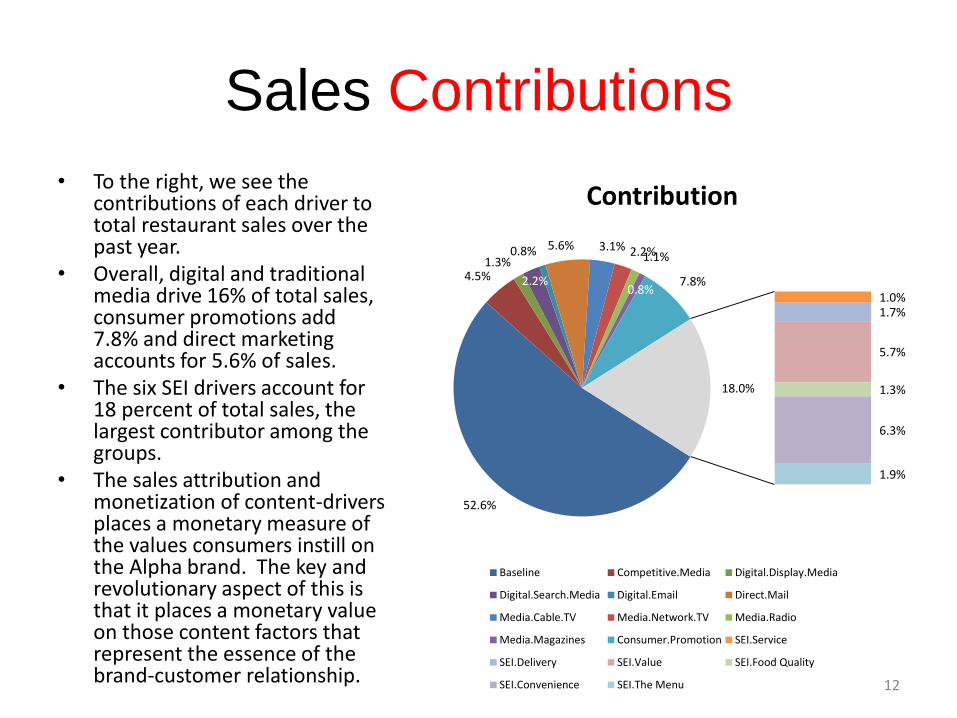
• To the right, we see the contributions of each driver to total restaurant sales over the past year.
• Overall, digital and traditional media drive 16% of total sales, consumer promotions add 7.8% and direct marketing accounts for 5.6% of sales.
• The six SEI drivers account for 18 percent of total sales, the largest contributor among the groups.
• The sales attribution and monetization of content-drivers places a monetary measure of the values consumers instill on the Alpha brand. The key and revolutionary aspect of this is that it places a monetary value on those content factors that represent the essence of the brand-customer relationship. 12
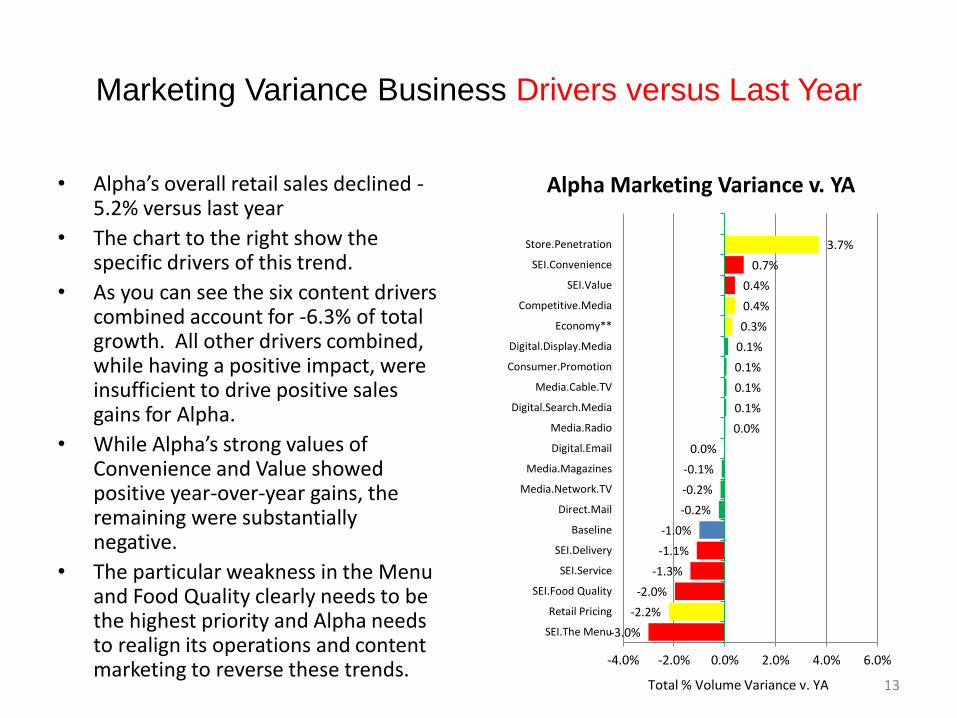
Marketing Variance Business Drivers versus Last Year
-3.0%
-2.2%
-2.0%
-1.3%
-1.1%
-1.0%
-0.2%
-0.2%
-0.1%
0.0%
0.0%
0.1%
0.1%
0.1%
0.1%
0.3%
0.4%
0.4%
0.7%
3.7%
-4.0% -2.0% 0.0% 2.0% 4.0% 6.0%
SEI.The Menu
Retail Pricing
SEI.Food Quality
SEI.Service
SEI.Delivery
Baseline
Direct.Mail
Media.Network.TV
Media.Magazines
Digital.Email
Media.Radio
Digital.Search.Media
Media.Cable.TV
Consumer.Promotion
Digital.Display.Media
Economy**
Competitive.Media
SEI.Value
SEI.Convenience
Store.Penetration
Alpha Marketing Variance v. YA• Alpha’s overall retail sales declined -5.2% versus last year
• The chart to the right show thespecific drivers of this trend.
• As you can see the six content drivers combined account for -6.3% of total growth. All other drivers combined, while having a positive impact, were insufficient to drive positive sales gains for Alpha.
• While Alpha’s strong values of Convenience and Value showed positive year-over-year gains, the remaining were substantially negative.
• The particular weakness in the Menu and Food Quality clearly needs to be the highest priority and Alpha needs to realign its operations and content marketing to reverse these trends.
13Total % Volume Variance v. YA
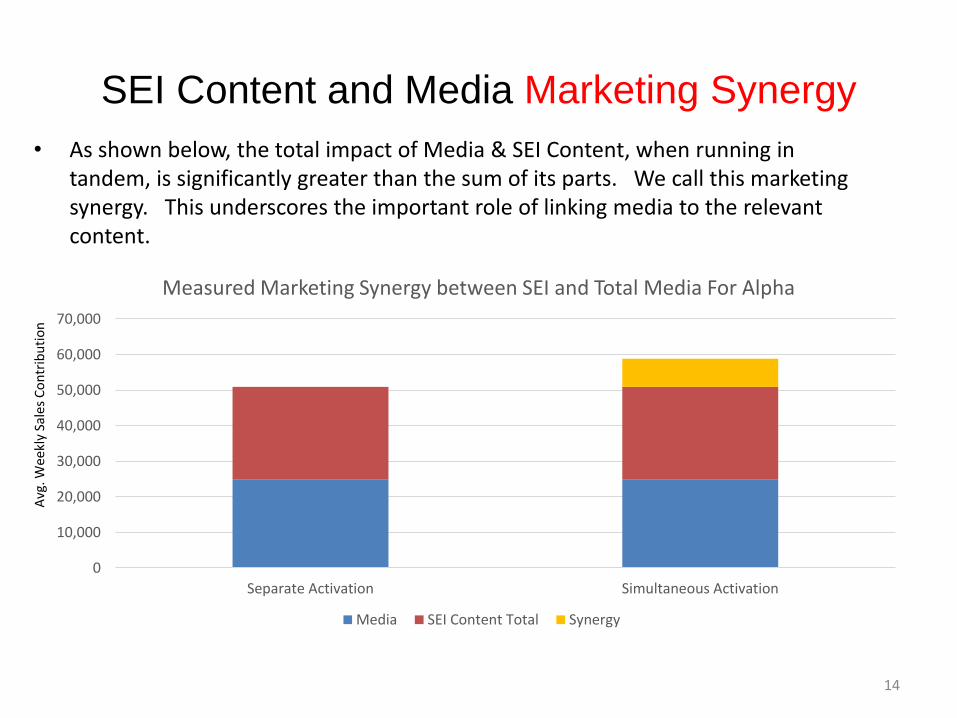
SEI Content and Media Marketing Synergy
0
10,000
20,000
30,000
40,000
50,000
60,000
70,000
Separate Activation Simultaneous Activation
Measured Marketing Synergy between SEI and Total Media For Alpha
Media SEI Content Total Synergy
14
• As shown below, the total impact of Media & SEI Content, when running in tandem, is significantly greater than the sum of its parts. We call this marketing synergy. This underscores the important role of linking media to the relevant content.
Avg
. Wee
kly
Sale
s C
on
trib
uti
on
Strategic Implications
• For the case study restaurant brand, analysis underscored that traditional strategies of focusing only on improving efficiencies in their drive-through and online ordering was not sufficient to drive growth. By ignoring menu diversity and improving food quality, they were driving customers to competition and generating a serious decline in sales.
• The task ahead for Alpha is clear, if not daunting. The company has to focus on improving its menu and the quality of its product and let the world know about it. This will require broadening the content of its marketing messages to communicate to consumers the journey and destination that Alpha is persuingto this end.
• Going forward, Alpha needs to embark on a journey and, in process, direct the content of its marketing message to telling the world about this journey. In so doing, Alpha will tell its customers that they are on a program for improving their menu and product quality. This will make the company appear vulnerable but customers will understand if Alpha comes across as both serious & sincere, and most of all, delivers on its promises. As shown, Content Marketing is all about marrying the right content with the media message.
15

Model Validation
0
50,000
100,000
150,000
200,000
250,000
Model Retail Sales
16
The model of Alpha’s retail sales demonstrated very high accuracy and predictability with an R2 fit of 97.1 percent