Embed Size (px)
Citation preview

1
Intro to Spatial Data Science with R
Alí Santacruzamsantac.co
JULY 2016

2
About me
• Expert in geomatics with a background in environmental sciences
• R geek
• PhD candidate in Geography
• Interested in Spatial Data Science
• Author of several R packages (available on CRAN)

3
Purpose of this talk
• Discuss what Spatial Data Science is
• Give an introductory explanation about how to conduct Spatial Data Science with R

4
What is Spatial Data Science?
Spatial Data Scientist (n.):
Statistician GIS/RS expertGIS developer Software engineer
Spatial Data Scientist
Spatial Data Science
Data Science
Spatial
Person that is better in spatial data analysis than a GIS developer and better in software engineering than a GIS/RS expert

5
Spatial Data Science
All they are combined for data analysis in order to …
Support a better decision making
"The key word in data science is not data; it is science" Jeff Leek. Data Science Specialization. Coursera.

6
Spatial Data
Scientist
Modified from gettingsmart.com

7
Hacking skills
• Programming languages: Python and R (and others)
http://www.kdnuggets.com/2016/06/r-python-top-analytics-data-mining-data-science-software.html

8
Why should we use R?
• Free and open-source
• A large and comprehensive set of packages (> 8600) • Data access
• Data cleaning
• Analysis
• Visualization and report generation
• Excellent development environments – RStudio IDE
• An active and friendly developers community
• A huge users community: > 2 million

9
Why R for spatial analysis
• 160+ packages in CRAN Task View: Analysis of Spatial Data
• Classes for spatial (and spatio-temporal) data
• Spatial data import/export
• Exploratory spatial data analysis
• Support for vector and raster operations
• Spatial statistics
• Data visualization through static and dynamic (web) graphics
• Integration with GIS software
• Easy integration with techniques from non-spatial packages

10
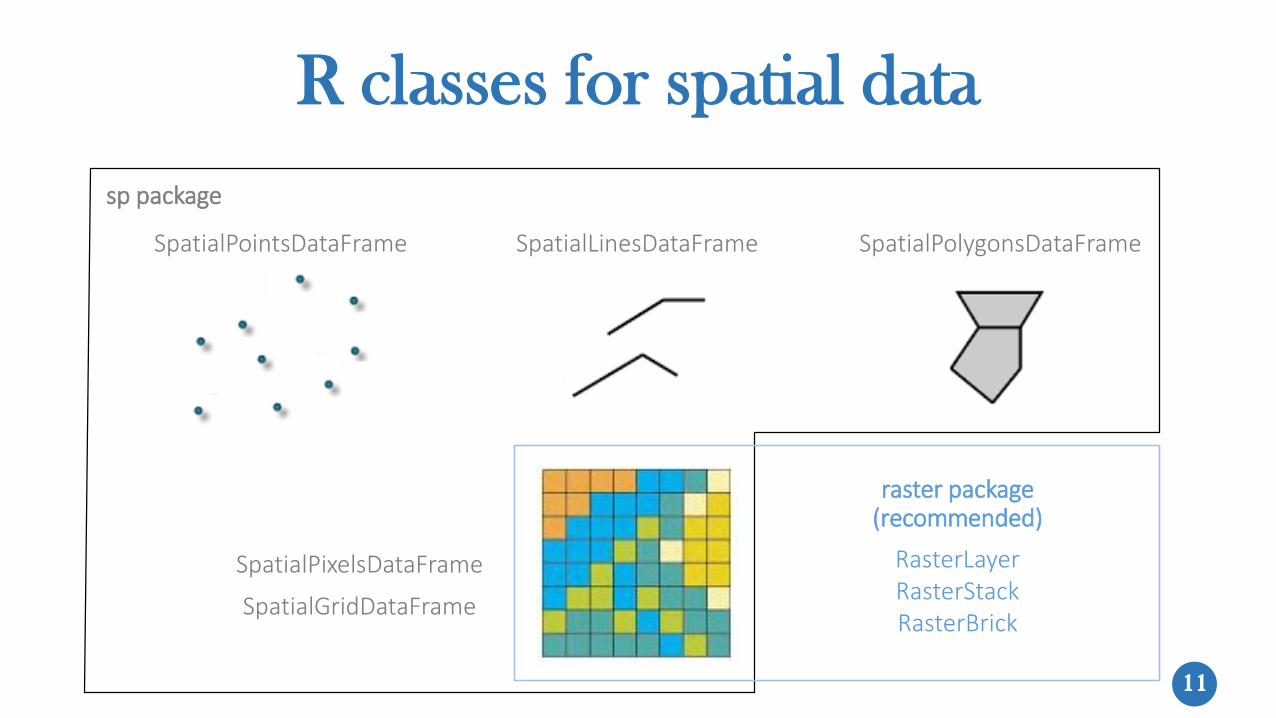
R classes for spatial data
• Before 2003:• Several packages with different assumptions on how spatial data was structured
• From 2003:• ‘sp’ package: extends R classes and methods for spatial data (vector and raster)
• From 2010:• ‘raster’ package: deals with raster files stored in disk that are too large to be
loaded on memory (RAM)
11
R classes for spatial data
SpatialPointsDataFrame SpatialLinesDataFrame SpatialPolygonsDataFrame
SpatialPixelsDataFrame
SpatialGridDataFrame
sp package
RasterLayerRasterStackRasterBrick
raster package (recommended)

12
The Data Science Process
Modified from science2knowledge
Rep
rod
uci
bilit
y

13MODELARlos datosMODELthe data
EXPLORARlos datosEXPLOREthe data
PREPARAR los datosPREPARE the data
• Is this A or B or C? :: classification
• Is this weird? :: anomaly detection
• How much/how many? :: regression
• How is it organized? :: clustering
• How will it change? :: prediction
"The key word in data science is not data; it is science" Jeff Leek. Data Science Specialization. Coursera.
OBTENER los datos
GET the data
Domain expertise
PLANTEAR la pregunta correcta
PLANTEAR la pregunta correcta
ASK the right question
COMUNICARlos resultados
COMMUNICATEthe results

14
• Import vector layers: rgdal, raster packages
• Import raster layers: raster package
• Get geocoded data from APIs: twitteR package, see example
• Download satellite images/geographic data: raster, modis, MODISTools packages
For this slide and following ones see code and examples in in this webpage
MODELARlos datosMODELthe data
EXPLORARlos datosEXPLOREthe data
PREPARAR los datosPREPARE the data
GET the data
PLANTEAR la pregunta correcta
PLANTEAR la pregunta correcta
ASK the right question
COMUNICARlos resultados
COMMUNICATEthe results

15
• Data cleaning, subset, etc.
• Manipulate data with “verbs” from dplyr and other Hadley-verse packages
• Spatial subset (sp, raster packages)
• Vector operations:
• Operations on the attribute table (sp package)
• Overlay: union, intersection, clip, extract values from raster data using points/polygons (raster, rgeos packages)
• Dissolve (sp, rgeos packages), buffer (rgeos package)
• Rasterize vector data (raster package)
• Raster operations:
• Map algebra, spatial filters, resampling, … (raster package)
• Vectorize raster data (rgdal, raster packages)
For slides 14 - 18 see code and examples in this webpage
MODELARlos datosMODELthe data
EXPLORARlos datosEXPLOREthe data
PREPARE the data
OBTENER los datos
GET the data
PLANTEAR la pregunta correcta
PLANTEAR la pregunta correcta
ASK the right question
COMUNICARlos resultados
COMMUNICATEthe results

16
• Descriptive statistics: central tendency and spread measures
• Exploratory graphics (2D, 3D): scatter plot, box plot, histogram, …
• Spatial autocorrelation:
• Global spatial autocorrelation statistics: Moran’s I, Geary’s C, Getis and Ord’sG(d) (spdep package)
• Local spatial autocorrelation statistics: Moran’s Ii, Getis and Ord’s Gi y Gi*(d) (spdep package)
MODELARlos datosMODELthe data
EXPLOREthe data
PREPARAR los datosPREPARE the data
OBTENER los datos
GET the data
PLANTEAR la pregunta correcta
PLANTEAR la pregunta correcta
ASK the right question
COMUNICARlos resultados
COMMUNICATEthe results
For slides 14 - 18 see code and examples in this webpage

17
• Regression:
• Spatial autoregressive models (spdep package)
• Geographically weighted regression (spgwr package)
• Classification (Machine Learning):
• Supervised: RandomForests, SVM, boosting, … (caret package)
• Non-supervised: k-means clustering (stats package)
• Spatial statistics:
• Geostatistics (gstat, geoR, geospt packages and others)
• Spatial point patterns (spatstat package)
MODELthe data
EXPLORARlos datosEXPLOREthe data
PREPARAR los datosPREPARE the data
OBTENER los datos
GET the data
PLANTEAR la pregunta correcta
PLANTEAR la pregunta correcta
ASK the right question
COMUNICARlos resultados
COMMUNICATEthe results
For slides 14 - 18 see code and examples in this webpage

18
• Static or interactive maps: tmap, leaflet, mapview packages
• Interactive graphics, web apps and dashboards:
• plotly (example), rcharts, googleVis (example) packages
• shiny, see example
• flexdashboard, see example
MODELARlos datosMODELthe data
EXPLORARlos datosEXPLOREthe data
PREPARAR los datosPREPARE the data
OBTENER los datos
GET the data
PLANTEAR la pregunta correcta
PLANTEAR la pregunta correcta
ASK the right question
COMMUNICATEthe results
For slides 14 - 18 see code and examples in this webpage

19
Don’t forget: Reproducibility!
• R code and output for examples shown in this webinar (slides 17-21) can be reproduced with this .Rmd document using RMarkdown
• See this example about reproducible spatial analysis using interactive notebooks
• Learn more about reproducible geoscientific research

20
Integrating R with GIS software
• QGIS: see example in this post
• ArcGIS: arcgisbinding package, see example in this post
• GRASS GIS: version 6, spgrass6 package; version 7, rgrass7 package
• gvSIG: more info in this post
• SAGA: RSAGA package
• GME (Geospatial Modelling Environment): more info in this webpage
21
References / Online resources
• Bivand, R., Pebesma, E., Gómez-Rubio, V. 2013. Applied Spatial Data Analysis with R. New York: Springer. 2nd ed.
• R-SIG-Geo mailing list
• CRAN Task View: Analysis of Spatial Data
• Facebook groups: GIS with R, R project en Español
• Google+ groups: Statistics and R, R Programming for Data Analysis
• My blog: amsantac.co/blog.html

If you have any question feel free to contact me:
amsantac.co/contact.html
Thanks!