Embed Size (px)
Citation preview
GEOGRAPHIC INFORMATION SYSTEMS SOCIO-ECONOMIC CAPABILITY
The transport planning team have developed a significant capability in geographic information systems, used for analysis. This enables ‘big data’ to be used to provide insight into particular areas of interest.
Contact: Ian Kirk-Ellis, MSc, I.Eng, FIHE, MCIHT, MTPS. ACIWEM Email: [email protected] Rodgers Leask Ltd, St James House, St Marys Wharf, Mansfield Road, Derby, DE1 3TQ Telephone 01332 285000 www.rodgersleask.co.uk
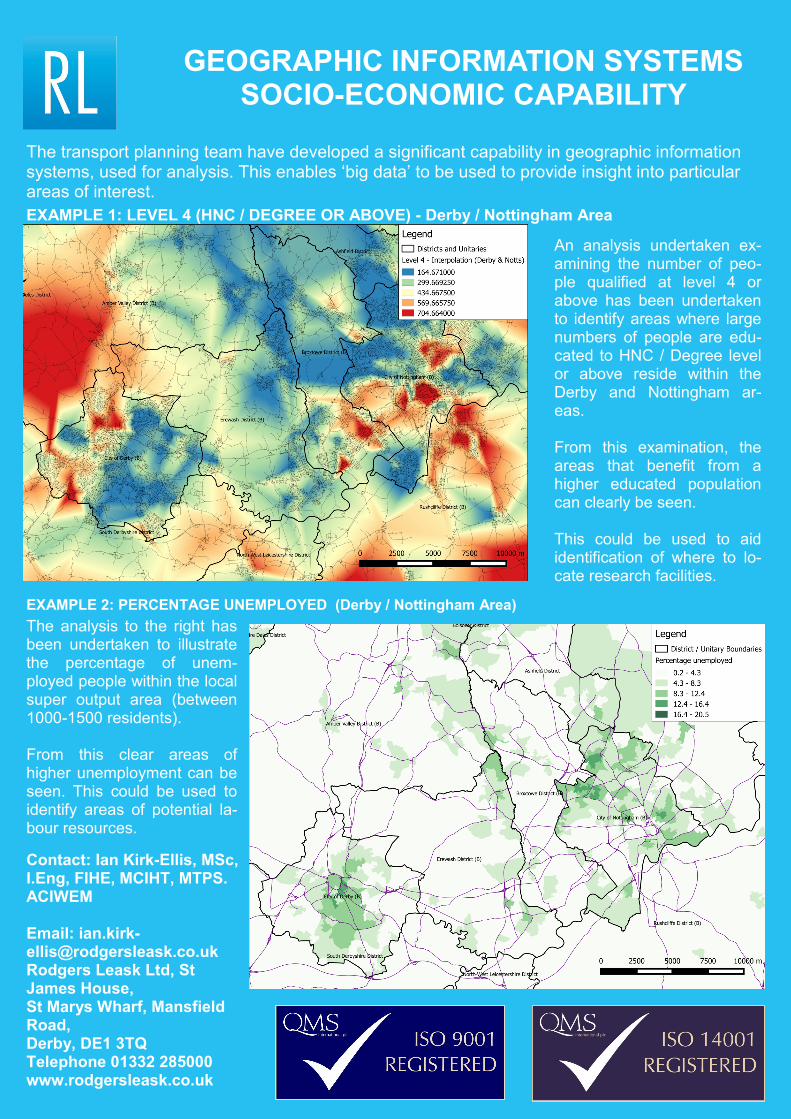
The analysis to the right has been undertaken to illustrate the percentage of unem-ployed people within the local super output area (between 1000-1500 residents). From this clear areas of higher unemployment can be seen. This could be used to identify areas of potential la-bour resources.
An analysis undertaken ex-amining the number of peo-ple qualified at level 4 or above has been undertaken to identify areas where large numbers of people are edu-cated to HNC / Degree level or above reside within the Derby and Nottingham ar-eas. From this examination, the areas that benefit from a higher educated population can clearly be seen. This could be used to aid identification of where to lo-cate research facilities.
EXAMPLE 2: PERCENTAGE UNEMPLOYED (Derby / Nottingham Area)
EXAMPLE 1: LEVEL 4 (HNC / DEGREE OR ABOVE) - Derby / Nottingham Area