Embed Size (px)
Citation preview
SaaS Business Metrics Panel Discussion
March 4, 2015

SaaS Business Metrics Panel
2
Therese Tucker, CEO
Ron Kasner, CFO
Nick Mehta, CEO
Glenn Solomon, General Partner
Moderator
David Spitz, Managing Director

Traditional Perpetual License vs. SaaS
3
Traditional Perpetual
License Software SaaS
o “One and Done”
o Revenues minus costs
essentially tell the story
o LTV and CAC
o Dollar Retention
o Land and Expand
VS. John
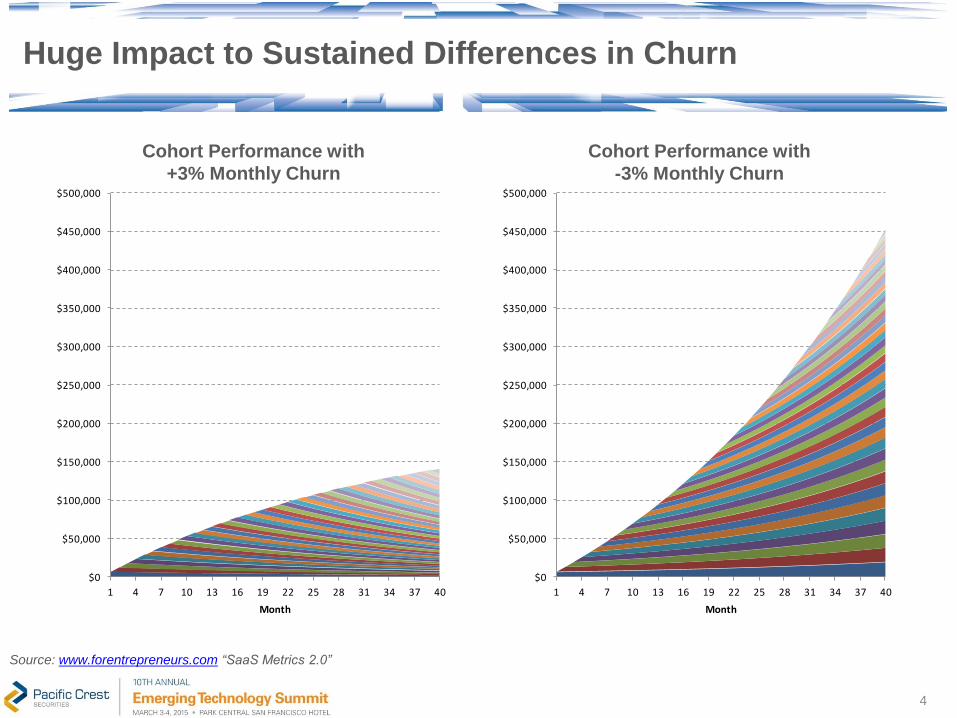
Huge Impact to Sustained Differences in Churn
4
$0
$50,000
$100,000
$150,000
$200,000
$250,000
$300,000
$350,000
$400,000
$450,000
$500,000
1 4 7 10 13 16 19 22 25 28 31 34 37 40
Month
$0
$50,000
$100,000
$150,000
$200,000
$250,000
$300,000
$350,000
$400,000
$450,000
$500,000
1 4 7 10 13 16 19 22 25 28 31 34 37 40
Month
Cohort Performance with
+3% Monthly Churn
Cohort Performance with
-3% Monthly Churn
Source: www.forentrepreneurs.com “SaaS Metrics 2.0”
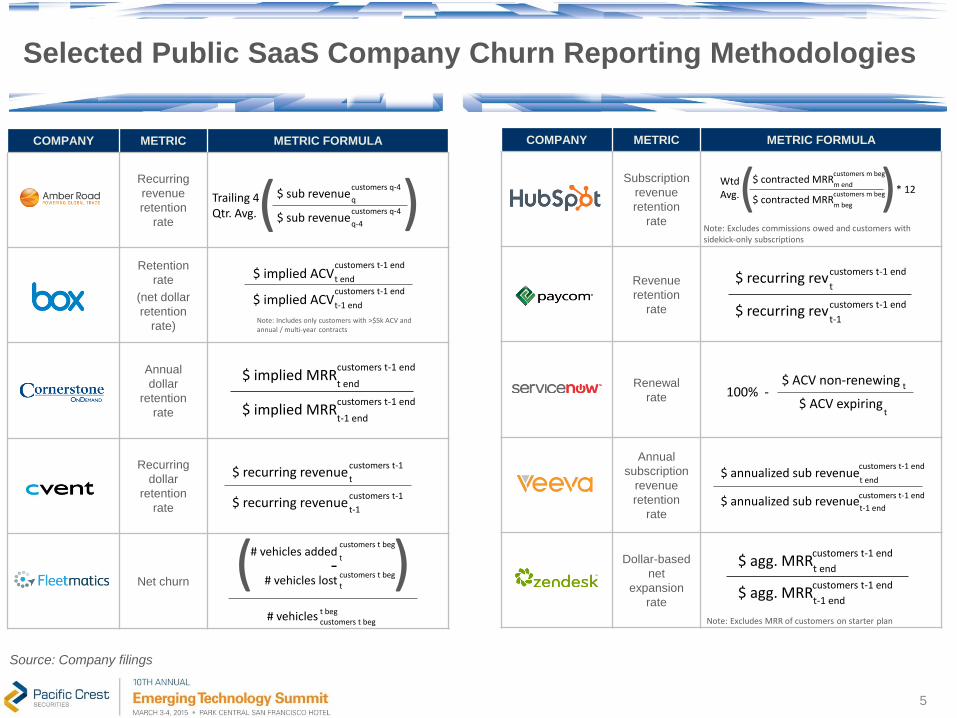
COMPANY METRIC METRIC FORMULA
Recurring
revenue
retention
rate
Retention
rate
(net dollar
retention
rate)
Annual
dollar
retention
rate
Recurring
dollar
retention
rate
Net churn
Note: Includes only customers with >$5k ACV and annual / multi-year contracts
$ implied ACVcustomers t-1 end
t end
$ implied ACVcustomers t-1 end
t-1 end
Selected Public SaaS Company Churn Reporting Methodologies
5
Source: Company filings
COMPANY METRIC METRIC FORMULA
Subscription
revenue
retention
rate
Revenue
retention
rate
Renewal
rate
Annual
subscription
revenue
retention
rate
Dollar-based
net
expansion
rate
Note: Excludes commissions owed and customers with sidekick-only subscriptions
$ sub revenuecustomers q-4
q
$ sub revenuecustomers q-4
q-4( )Trailing 4
Qtr. Avg.
$ implied MRRcustomers t-1 end
t end
$ implied MRRcustomers t-1 end
t-1 end
$ recurring revenuecustomers t-1
t
$ recurring revenuecustomers t-1
t-1
# vehicles addedcustomers t beg
t
-
# vehiclescustomers t begt beg
# vehicles lostcustomers t beg
t)(
$ recurring revcustomers t-1 end
t
$ recurring revcustomers t-1 end
t-1
$ ACV non-renewing
$ ACV expiring100% -
t
t
$ annualized sub revenuecustomers t-1 end
t end
$ annualized sub revenuet-1 end
customers t-1 end
$ agg. MRRcustomers t-1 end
t end
$ agg. MRRcustomers t-1 end
t-1 end
$ contracted MRR customers m beg
m end( )WtdAvg. $ contracted MRR
customers m beg
m beg
* 12
Note: Excludes MRR of customers on starter plan

LTV vs. CAC
6
LTV CAC ?
ARR Gross Margin
Churn
$ Cost to Acquire
a Customer

CAC on New Customers vs. Upsells vs. Renewals
7
“How much do you spend on a fully-loaded sales & marketing cost basis
to acquire $1 of ACV from a customer?”
Source: 2014 Pacific Crest Private SaaS Company Survey
Note: Survey responses as of June / July 2014
Respondents: New ACV from New Customer: 159, Upsell to Existing Customer: 151, Renewals: 153
$0.60
$0.10 $0.06
$1.44
$0.46
$0.26
$1.07
$0.18
$0.12
$0.00
$0.25
$0.50
$0.75
$1.00
$1.25
$1.50
New ACV from NewCustomer
Upsell to ExistingCustomer
Renewals
75th percentile
25th percentile
Median

Cohort Analysis Example – SuccessFactors IPO Roadshow Slide
8
Source: SuccessFactors Roadshow Presentation

WDAY
NOW
DWRE
VEEV
N
ZEN
PFPT
PCTY
TXTR
MKTOCSOD
ULTI
BNFTATHN
CVT
CRM
QLYS
OPWR
SPSC
AMBR
QTWO
ECOM
EOPN
TWOU
PAYC
FLTXLOGM
RNG
TRAK
FIVN
CTCT
SQI
MRINRALY
>34% Mean
24-34% Mean
18-24% Mean
<18% Mean
YDLE
HUBS
NEWR
BOX
WK
0.0x
4.0x
8.0x
12.0x
0% 10% 20% 30% 40% 50% 60%
EV
/ C
Y2
01
6E
Re
ve
nu
e M
ult
iple
Projected CY2015E Revenue Growth
Public SaaS Company Revenue Multiples as a Function of Growth
9
>34% 24-34% 18-24% <18%
’14-’15E Revenue Growth
Source: Capital IQ and company filings
Note: Pricing as of February 27, 2015

Sales & Marketing Spend vs. Projected Growth Rate
10
Source: 2014 Pacific Crest Private SaaS Company Survey
Note: Survey responses as of June / July 2014
Respondents: <10%: 13, 10-15%: 13, 15-20% : 21, 20-25%: 19, 25-30%: 11, 30-35%: 15, 35-40%: 8,
40-50%: 16, 50-60%: 9, 60-80%: 12, 80-100%: 6, >100%: 12
23% 23%
27%
22%24%
29%
48%46% 47%
41%
50%
41%
0%
10%
20%
30%
40%
50%
60%
<10% 10-15% 15-20% 20-25% 25-30% 30-35% 35-40% 40-50% 50-60% 60-80% 80-100% >100%
Med
ian
Sale
s &
Mark
eti
ng
Sp
en
d a
s %
of
Reven
ue
2014E Growth Rate
Median ≈ 28%
50+%
SaaS Business Metrics Panel
11
Therese Tucker, CEO
Ron Kasner, CFO
Nick Mehta, CEO
Glenn Solomon, General Partner
Moderator
David Spitz, Managing Director
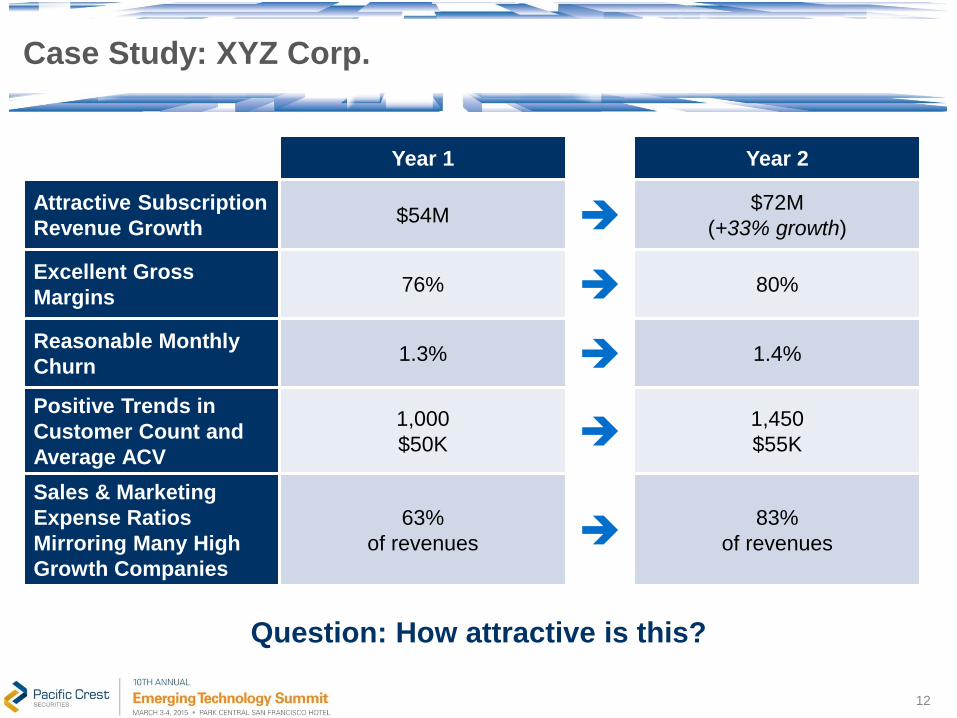
Case Study: XYZ Corp.
12
Year 1 Year 2
Attractive Subscription
Revenue Growth $54M
$72M
(+33% growth)
Excellent Gross
Margins 76% 80%
Reasonable Monthly
Churn 1.3% 1.4%
Positive Trends in
Customer Count and
Average ACV
1,000
$50K 1,450
$55K
Sales & Marketing
Expense Ratios
Mirroring Many High
Growth Companies
63%
of revenues 83%
of revenues
Question: How attractive is this?
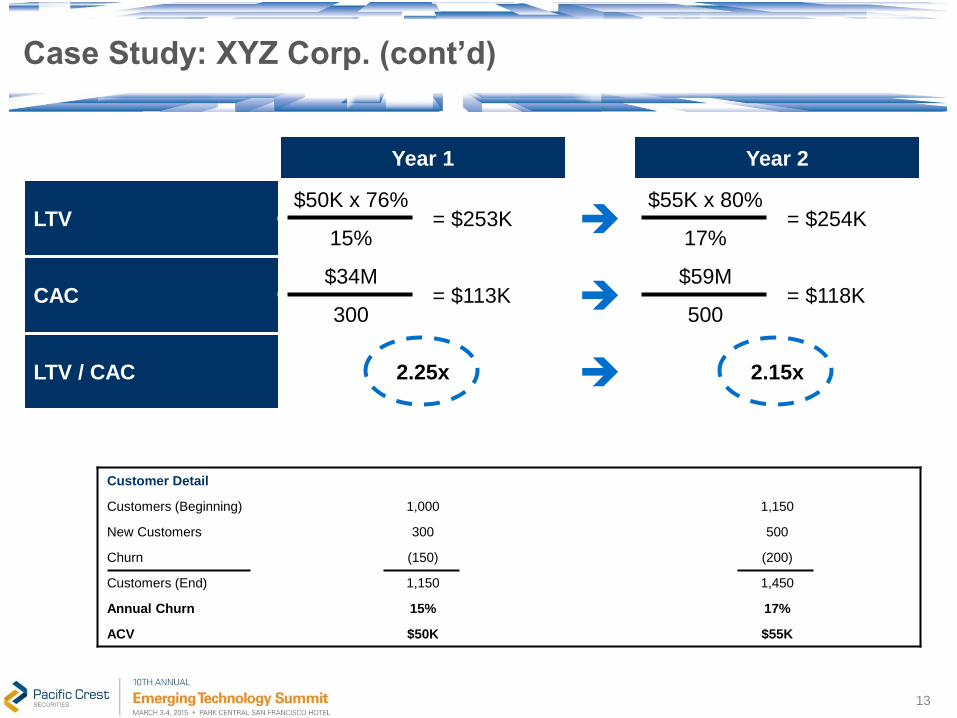
Year 1 Year 2
LTV $50K x 76%
= $253K $55K x 80%
= $254K 15% 17%
CAC $34M
= $113K $59M
= $118K 300 500
LTV / CAC 2.25x 2.15x
Case Study: XYZ Corp. (cont’d)
13
Customer Detail
Customers (Beginning) 1,000 1,150
New Customers 300 500
Churn (150) (200)
Customers (End) 1,150 1,450
Annual Churn 15% 17%
ACV $50K $55K