Embed Size (px)
Citation preview

Information Sharing on Social
Media under Disaster Situation-How to Designing Desirable
Networks-
Fujio Toriumi
The University of Tokyo
Short Lecture in UTP
24th Oct, 2014

Self Introduction 1/2
• Fujio Toriumi
• Affiliation
– The University of Tokyo
– Associate Professor
• Research Field
– Artificial Intelligence
• Social Data Mining
– Web & Social Media, Financial informatics
• Agent Based Modeling & Simulation

Self Introduction 2/2
• Research Theme
– Information Sharing in Disaster Situation
– Finding Risks from Social Data
• Rumors, Flaming, Information Overload, Unusual
Changes in Financial Market
– Design Social Systems by Simulation
• Information Diffusion, Game Theory, Stock Market,
Innovative Community, Community Formation,
Prediction Market
– Communication Games
• Social Game Analysis , AI for “Are you werewolf?”

Today’s Topics
• How people use Social Media under the
disaster situation?
– From Twitter Big Data Analysis
• Who use the Twitter
• Can people use specific features of Social Media?
• How information diffused on Social Media
– Network Structure
– Diffusion Capability
• How can we realize desirable networks?

Research Questions &
Conclusions• Focus on Twitter under the Disaster Situation
• RQ1:How twitter changed before and after
the disaster?
– Communication tools to Information sharing tool
• RQ2:Was Twitter networks desirable for
information diffusion?
– Changed to desirable structure
• RQ3:How can we realize desirable networks?
– Higher reachability and Higher Node Assortativity

Large Scale Disasters
• Large disasters in last ten years
– The Indian Ocean off Sumatra (2004)
– Hurricane Katrina (2005)
– Sichuan earthquake(2008)
– Chile earthquake (2010)
– Great East Japan Earthquake (2011)
– Hurricane Sandy (2012)
– Haiyan Typhoon, Philippines(2013)

Collecting Information under
Disaster Situation
• Important to save lives
– For Victims
• Shelters
• Dangerous points, …
– For Rescuers
• The victim locations
• The availability of supplies, …
How to collect information?
• Information from mass media
– Too much information, but Limited time
– Blackout
– No route to carry Newspapers
– Difficult to collect desired information
• Cellphones with internet, Wifi
– High failure resistance

Collect Information from WEB
• Social media is useful
– Twitter, Facebook, U-Stream and so on
– Accessible by mobile tools

The Great East Japan Earthquake
• Earthquake
– Magnitude 9.0
– 14:46 11th March, 2011
• Tsunami
– Height : 5-20m height (Max Run-up : 38.9m)
– Area Flooded : 507km2
• Fukushima Nuclear Accident
– Loss of power caused by Tsunami
– Meltdown : Units 1, 2, and 3

Usage of Japanese Social Media
MicroBlog
Social Media

How Twitter used in Japan
• Users : 12,820,000 (Feb, 2011)
• Daily average tweets : 18,000,000
• Twitter users increases drastically during
the disaster
– 63.9% users answers that it is useful to collect
information on Twitter
– 34.9% on Facebook
Mobile Marketing Data Labo. (2011)

Before and After the Disaster
• Disaster changes Twitter
– People behaviors, information
– Network structures

Today’s Topic
• How people use Social Media under the
disaster situation?
– From Twitter Big Data Analysis
• Who use the Twitter
• Can people use specific features of Social Media?
• How information network changes?
– Network Structure
– Diffusion Capability
• How can we realize desirable networks?

Data Set
• Date
– 7th – 23th March, 2011
• The Great East Japan Earthquake occurred at 11th
• Number of Tweets
– 363,435,649 (7-80% of all Japanese tweets)
• Number of Retweets
– 29,245,815
• Number of Users
– 2,727,247

Average Number of Tweets
in each Minutes
(Before the disaster)
Lunch
Many botsPeaks found at night

The Great East Earthquake M9.0
M6.6
M6.1M7.2
Increasing rate of Tweet (minute)
• Normalized by average number of Tweet at same time before the disaster– Extracting peaks
• Peaks found at afterquakes occurrence– No peak found at Nuclear accident
M6.0
Nuclear Accidents in Fukushima

Today’s Topic
• How people use Social Media under the
disaster situation?
– From Twitter Big Data Analysis
• Who use the Twitter
• Can people use specific features of Social Media?
• How information network changes?
– Network Structure
– Diffusion Capability
• How can we realize desirable networks?

Changes in Number of Tweets
• Before disaster vs After disaster (4days)
– Before Disaster :7th to 10th March, 2011
– During Disaster :11th to 14th March, 2011
Casual users
increase number of
tweets
Heavy users
decrease number of
tweets

Over 10 tweets per days
• Number of casual users do not change
before and after the disaster
The Great
East Japan Earthquake

Over 400 Tweets per days
• Number of heavy users decreased
The Great
East Japan Earthquake

Changes in Number of Posted
Tweets• People likely to spread information more
frequently during a disaster
– To share many important information
– Why did active users reduce their tweets?
• Who is the frequent tweet user?
– 400 Tweet per day = 1 Tweet per 3.6 minutes
Number of bots
• The users with large amount of tweets
=> Likely to be bots
– Bot
• Computer programs which post tweets
automatically
• Hypothesis : the number of bots
decreased during the disaster
– Check whether active bots decreased

Tweets of bots
• The number of active bots dropped
• Stop to provide unnecessary information
– Most of bots post jokes and advertisements
– Without forcing

Today’s Topic
• How people use Social Media under the
disaster situation?
– From Twitter Big Data Analysis
• Who use the Twitter
• Can people use specific features of Social Media?
• How information network changes?
– Network Structure
– Diffusion Capability
• How can we realize desirable networks?

Usage Analysis of
Twitter Systems• Systems used for information sharing
– Reply :Communication
– Retweet : Information Diffusion
– HashTag : Information clustering & searching
• Can people use specific features of Social
Media?
– How people use the features
– Can people start and master to use features
at the time of disaster?

Usage of Hashtag
• Pre-HashTag User:
– Users who used HashTag before disaster

Usage of Reply
• Pre-Replayer:
– Users who used Reply before disaster

Usage of Retweet
• Pre-Retweeters:
– Users who used Retweet before disaster
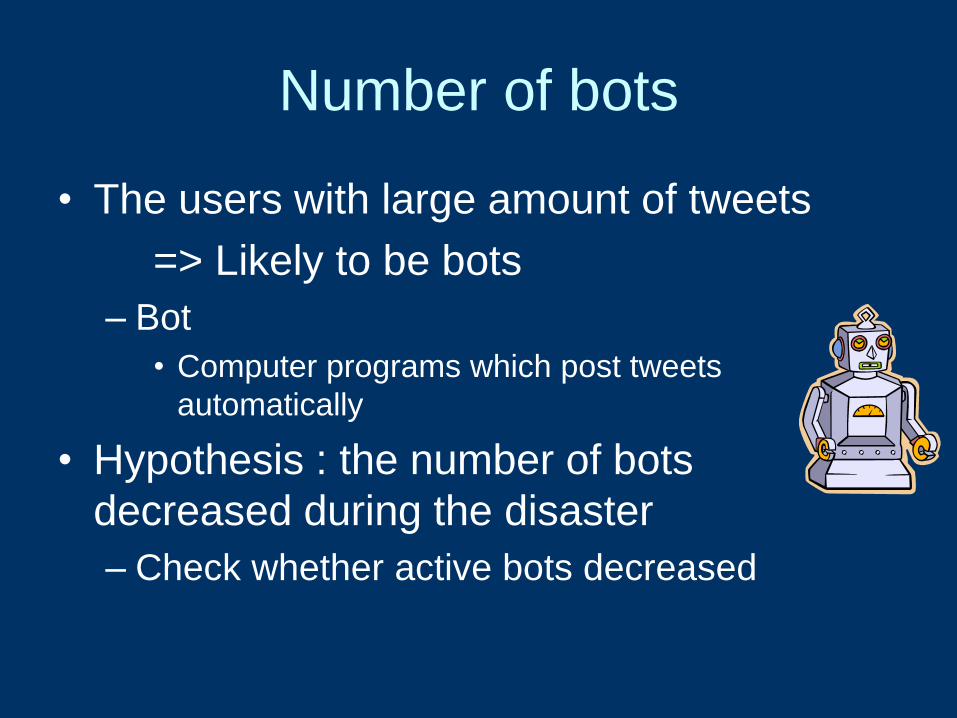
Rate of Usage of Features
• Pre-Users : Used systems actively
• Non-PreUsers :
– Difficult to start using new features
Used in 11th Used before 24th
Hash TagPreUser 25.2% 84.7%
Non-PreUser 4.9% 34.3%
ReplyPreUser 52.3% 92.9%
Non-PreUser 15.1% 68.1%
RetweetPreUser 51.0% 90.8%
Non-PreUser 12.5% 43.1%

Rate of Tweet, Reply and
Retweet

Two types of communication
• Follower network
– Network created from follower-followee
relations
• Reply/Retweet with followers
– Communication with friends
• Reply/Retweet with non-followers
– Communication with non-friends
– Sharing information
follow

Replies with followers
• Private communication structures were not
changed
• Used replies to communicate with friends

Retweets with followers
• Reply information from non-friends
– Not private information
• Use retweets to share global information
– Required information changes

Today’s Topic
• How people use Social Media under the
disaster situation?
– From Twitter Big Data Analysis
• Who use the Twitter
• Can people use specific features of Social Media?
• How information network changes?
– Network Structure
– Diffusion Capability
• How can we realize desirable networks?

How twitter network changes
before and after the disaster
• Information Diffusion Network
– Communication Network
• Connect link between nodes which used RT or Reply
– 7th March to 23rd March
• In-directed Network
Reply
Retweet

Models of Network
Before and After Disaster
Network Before DisasterNetwork After Disaster

Statistical Data of Networks
# of Nodes # of Links Avg. Degree Max Degree
7th March 1505772 7743168 5.14 5143
12th March 1734187 19286490 11.1 108297
23rd March 1738702 10051644 5.78 17700
• # of Nodes Increase
– Increase of Users
• # of Links Increase
– Increase of Communication
• Appearance of huge degree Node
– Center of information sharing

Rate of Over 1000 degree
Users

High Degree Users~Before the disaster~
• @youtube
– Account of Youtube
• @shuumai
– Free talk Bot
• @wwwwww_bot
– Joke bot
• @foursquare
– Account of Foursquare

High Degree Users
~After the disaster~
• @NHK PR
– Public account of NHK press agent
• @FDMA JAPAN
– The Fire and Disaster Management Agency
• @earthquake jp
– Emergency earthquake alert system
• @oohamazaki
– A user who developed web site of shelters in Tokyo

Changes in Roles of Twitter
• Main role of twitter and Hub Users
– Before Disasters• Communication
• Providing topics and communication
– After Disaster• Information sharing
• Providing information
• Role of Twitter
– Communication tool Information sharing tool

Today’s Topic
• How people use Social Media under the
disaster situation?
– From Twitter Big Data Analysis
• Who use the Twitter
• Can people use specific features of Social Media?
• How information network changes?
– Network Structure
– Diffusion Capability
• How can we realize desirable networks?

Twitter networks desirable for
information diffusion?
• Difficult to compare
– Not only structures were change
Analyze how information diffused
on each networks
Information diffusion simulation

Information Diffusion Simulation
• Simulate Information Diffusion on Network
• Analyze the influence of network structures
– Focus on structures, not users
– Which kind of structure accelerate diffusion
• Use Independent Cascade model (IC model)
– Basic diffusion model
– Based on SIR model

Independent Cascade Model
• Status of Nodes
– Susceptible
– Information Sending
– Received
𝑃1
𝑃2
Susceptible
Information Sending
Received

Ability of Information Diffusion
(AID)
• Higher 𝐴𝐼𝐷 network
• Higher capability of information diffusion
Information
source 𝑣
success failure
Rate of users who
received information
𝜎(𝑣)
𝐴𝐼𝐷 =1
𝑁
𝑁
𝜎(𝑣)
N:Num of Users

Diffusion Simulation on networks
before/after the disaster• Purpose
– Analyze how information diffused on each networks from AID
• Method
– Information diffusion simulation on real networks
• Settings
– Use communication networks on Twitter• Directed Network
– Use networks created in 7th Mar, 2011 to 15th
Mar, 2011

Change in 𝐴𝐼𝐷
The
Disaster
Befor
eAfter
AID become higher after the disaster
9%
3%

Models of Network
Before and After Disaster
Lower AID Higher AID

Today’s Topic
• How people use Social Media under the
disaster situation?
– From Twitter Big Data Analysis
• Who use the Twitter
• Can people use specific features of Social Media?
• How information network changes?
– Network Structure
– Diffusion Capability
• How can we realize desirable networks?

How can we realize desirable
networks?
• Purpose
– Find the feature which have high influence to information diffusion
• Method
– Change each feature
– Analyze changes in AID
• Settings
– Use real network features
– Create 100 networks for each feature type

Network Indexes
• reciprocity 𝜌
• Transitibity 𝜏
• Assortativity 𝑟
• Determination
coefficient of power-
law
– In degree 𝑖𝑛𝑅2
– Out degree 𝑜𝑢𝑡𝑅2
• Reachability 𝛼
• Cyerosity 𝑐
• Node Assortativity
• Power Index
– In degree 𝑖𝑛𝛾
– Out degree 𝑜𝑢𝑡𝛾

Proposed Generalized
Network Growth Model
• To realize any types of Networks
– View point of network features
• Basic strategy
– Greedy growth model
– Target similarity evaluation model

Sample of Generated Networks

Information Diffusion Simulation
• Create many networks
– One target index with another fixed indexes
– Change target index and create various
networks
– Ex. High-Reciprocity network and Low-
Reciprocity network which has same other
network indexes
• Calculate AID with the network
– Correlation between AID and changed index
– Is higher reciprocity provides higher AID?

• Use Rank Correlation
Reciprocity Reachability Transitibity Cyerosity Assortativity0.176 0.848 -0.0173 0.205 -0.185
Correlation between AID and
features
Node Assortativity
Determination coefficient(Out)
Power Index(Out)
Determination coefficient(In)
Power Index(In)
0.967 0.0881 0.320 -0.0641 -0.165

• Use Rank Correlation
• High Reachability and High Node
Assrotativity
• High AID: Easy to diffuse information
Correlation between AID and
features
High Correlation
Reciprocity Reachability Transitibity Cyerosity Assortativity0.176 0.848 -0.0173 0.205 -0.185
Node Assortativity
Determination coefficient(Out)
Power Index(Out)
Determination coefficient(In)
Power Index(In)
0.967 0.0881 0.320 -0.0641 -0.165

Reachability
• Reachability: Rate of reachable nodes if
information diffusion start from each node
Reachability:
𝛼 =1
5
5
5+4
5+1
5+4
5+4
5
= 0.72

Reachability
• Reachability: Rate of reachable nodes if information diffusion start from each node
Low Reachability
Many nodes can not reach from start node
Difficult to diffuse information

Node Assortativity
• Correlatoin between in-degree and out-
degree
– High in-degree nodes have high degree node:
Positive Assortativity
– High in-degree nodes have low degree node:
Negative Assortativity
High node assortativity Low node assortativity

In-degree and out-degree
• High in-degree node: High ability to collect
information
• High out-degree node: High ability to diffuse
information
Both abilities are required
to diffuse information
No enough information Intercept information

High Node Assortativity
• To diffuse information:
– High information collect ability
– High information sending ability
High Node Assortativity
Low Node
Assortativity
Low Node
Assortativity
Indexes of Real Network
• How about real network?
– Real network changed to desirable structure
– Was twitter network changes to the BEST
structure for information diffusion?
• To realize more effective structure
– What was enough and what was not
– Check their network indexes

Network indexes of real network
• Before the disaster(10th Mar, 2011)
• After the disaster(12th Mar, 2011)
Reciprocity Reachability Transitibity Cyerosity Assortativity0.527 0.370 -0.0633 0.0381 -0.0998
Node Assortativity
Determination coefficient(Out)
Power Index(Out)
Determination coefficient(In)
Power Index(In)
0.273 0.953 2.51 -0.841 -1.94
Reciprocity Reachability Transitibity Cyerosity Assortativity0.232 0.436 -0.0417 0.0172 -0.221
Node Assortativity
Determination coefficient(Out)
Power Index(Out)
Determination coefficient(In)
Power Index(In)
0.0105 0.948 0.737 -2.81 -1.12

Diffusion capability of real
network• Higher reachability after the disaster
– Before network α = 0 . 370
– After network α = 0 . 436
• Lower Node assortativity after the disaster
– Before network: r node = 0 . 273
– after network: r node = 0 . 0105
Improved
Deteriorated

Diffusion capability of real
network• To realize wider information diffusion
• Keep higher Node assortativity
High node assortativity
High in-degree node
with High out-degree

Conclusions 1/2
• The usage of Twitter per user increased after
the earthquake
• The numbers of bots decreased
• Many users with little experience with such
specific functions as reply and retweet did not
continuously use them after the disaster.

Conclusion 2/2
• Twitter networks desirable for information
diffusion?
– Change to desirable structure
• How can we realize desirable networks?
– Higher reachability and Higher Node Assortativity


![UTP Presentation Slides DRAFT0405 final jb.pptx [Read-Only]ftp.dot.state.tx.us/.../tpp/utp/2014/040513_presentation.pdf · 2013-04-08 · Microsoft PowerPoint - UTP Presentation Slides_DRAFT0405_final_jb.pptx](https://img.pdfslide.us/doc/110x75/5f5d63a88b24f126055f3fd0/utp-presentation-slides-draft0405-final-jbpptx-read-onlyftpdotstatetxustpputp2014040513.jpg)