Embed Size (px)
Citation preview

© 2015 IBM Corporation
Gibt es bei Regen wirklich keine Taxis? Open Data in Aktion: Jeder kann analysieren! data2day conference 2015, Karlsruhe Wilfried Hoge – IT Architect Big Data – [email protected] @wilfriedhoge
Stephan Reimann – IT Specialist Big Data – [email protected] @stereimann
© 2015 IBM Corporation
Motivation: A personal experience – especially when it is raining it seems difficult to get a taxi
§ Is that true?
§ Can analytics provide the answer?
§ Is there any correlation between rain and taxi availability?
2
© 2015 IBM Corporation
First we needed data ... Open Data was the key
§ "Open data is the idea that some data should be freely available to everyone to use and republish as they wish, without restrictions from copyright, patents or other mechanisms of control.“ [Wikipedia, https://en.wikipedia.org/wiki/Open_data]
§ Open Data is available in different fields, e.g. Science, Government
§ Open Government data is available at almost any level: – EU http://open-data.europa.eu/en/data/ – US https://www.data.gov/ – GovData – Das Datenportal für Deutschland https://www.govdata.de/ – Bavaria https://opendata.bayern.de/ – Munich https://www.opengov-muenchen.de/ – Berlin http://daten.berlin.de/ – New York https://nycopendata.socrata.com/ – ...
§ Open Data is available in several categories: census data, traffic, education, environment, economy, health, ...
3
© 2015 IBM Corporation
There is plenty of Open Data, but sometimes it isn’t that easy to find the one you are looking for
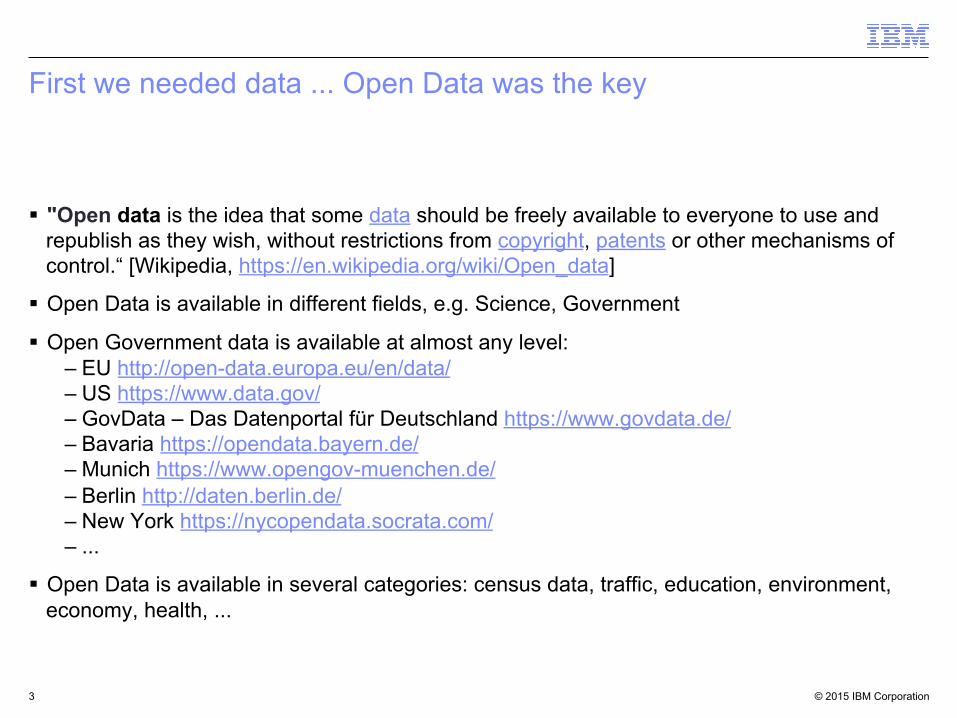
§ We needed taxi & weather data
§ Since we couldn’t find an appropriate taxi data set for Munich, we choose New York
§ The taxi data set is available at http://www.andresmh.com/nyctaxitrips/ and contains 2 areas trip data & trip fares
§ The taxi data set contains all taxi trips in Manhattan for 2013, approx. 4GB/month, overall too big to analyze it on a Laptop
§ For the weather, we could find plenty of weather data, but not detailed enough for our analysis, open weather data was only available on a daily base, but taxi data is on exact time
§ We decided to buy an appropriate data set with hourly weather information for NYC at https://weatherspark.com/ (approx. 10 €)
4
© 2015 IBM Corporation
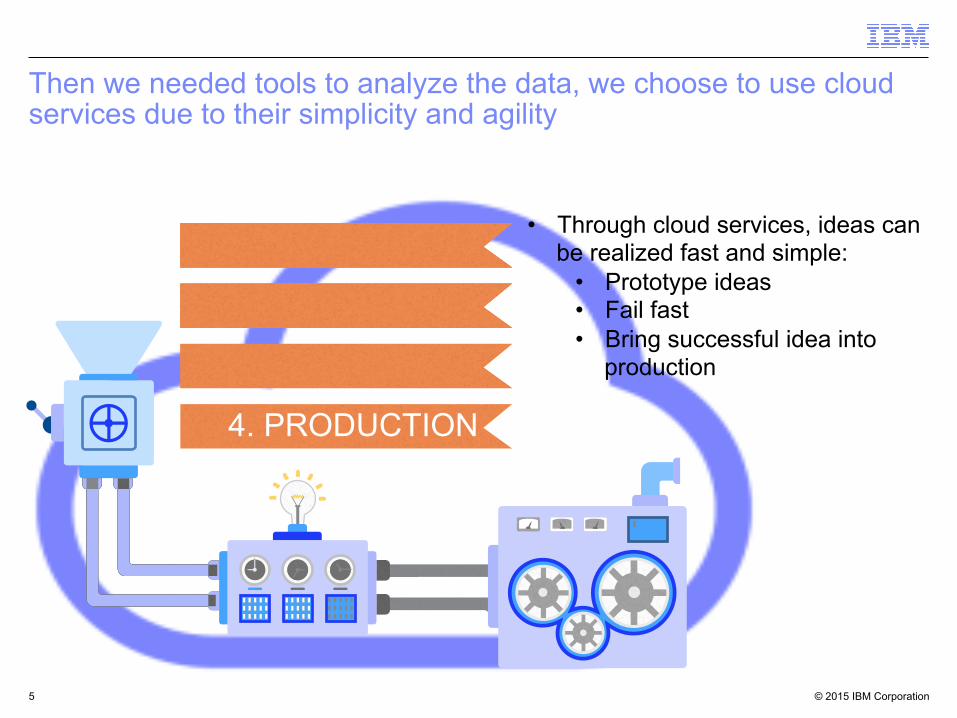
Then we needed tools to analyze the data, we choose to use cloud services due to their simplicity and agility
1. IDEAS
2. PROTOTYPE
3. FAIL FAST
4. PRODUCTION
• Through cloud services, ideas can be realized fast and simple:
• Prototype ideas • Fail fast • Bring successful idea into
production
5
© 2015 IBM Corporation
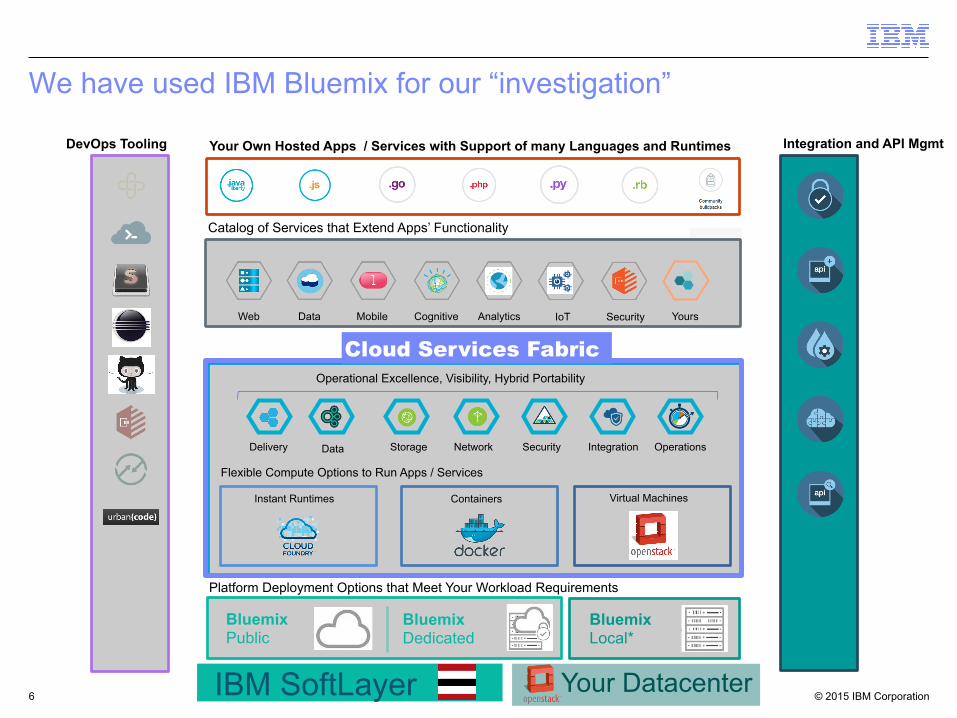
Flexible Compute Options to Run Apps / Services
Instant Runtimes Containers Virtual Machines
Platform Deployment Options that Meet Your Workload Requirements
Bluemix Public
Bluemix Dedicated
Bluemix Local*
DevOps Tooling
IBM SoftLayer
Catalog of Services that Extend Apps’ Functionality
Web Data Mobile Analytics Cognitive IoT Security Yours
Cloud Services Fabric
Delivery Storage Network Security
Operational Excellence, Visibility, Hybrid Portability
Data Integration Operations
Your Own Hosted Apps / Services with Support of many Languages and Runtimes Integration and API Mgmt
Your Datacenter
We have used IBM Bluemix for our “investigation”
6
© 2015 IBM Corporation
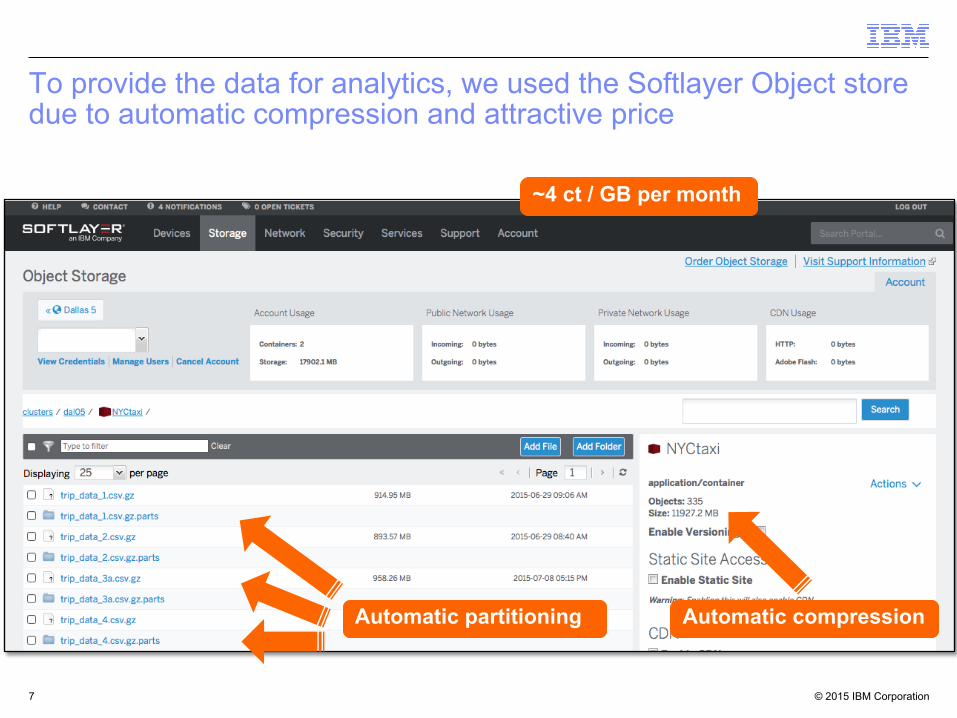
To provide the data for analytics, we used the Softlayer Object store due to automatic compression and attractive price
Automatic partitioning
7
Automatic compression
~4 ct / GB per month
© 2015 IBM Corporation
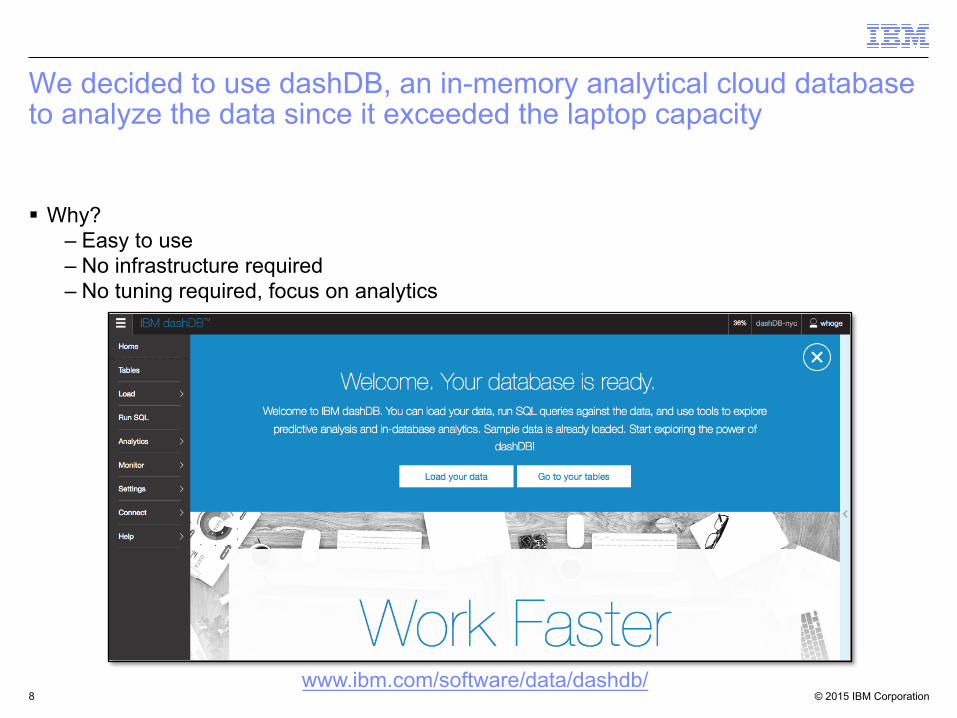
We decided to use dashDB, an in-memory analytical cloud database to analyze the data since it exceeded the laptop capacity
§ Why? – Easy to use – No infrastructure required – No tuning required, focus on analytics
8 www.ibm.com/software/data/dashdb/
© 2015 IBM Corporation
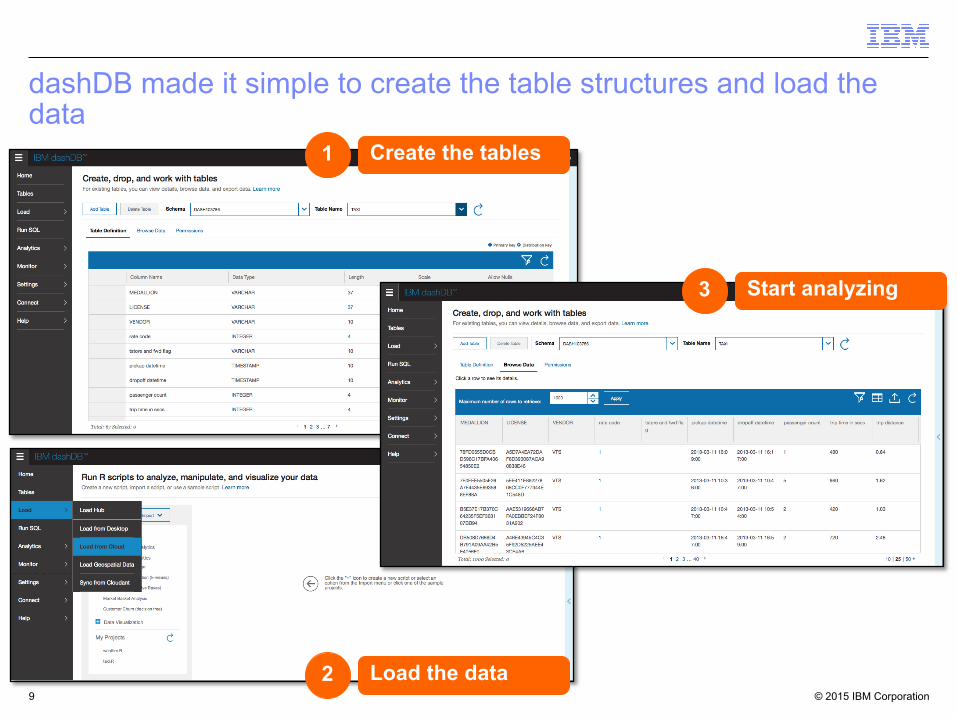
dashDB made it simple to create the table structures and load the data
Create the tables 1
Load the data 2
Start analyzing 3
9
© 2015 IBM Corporation
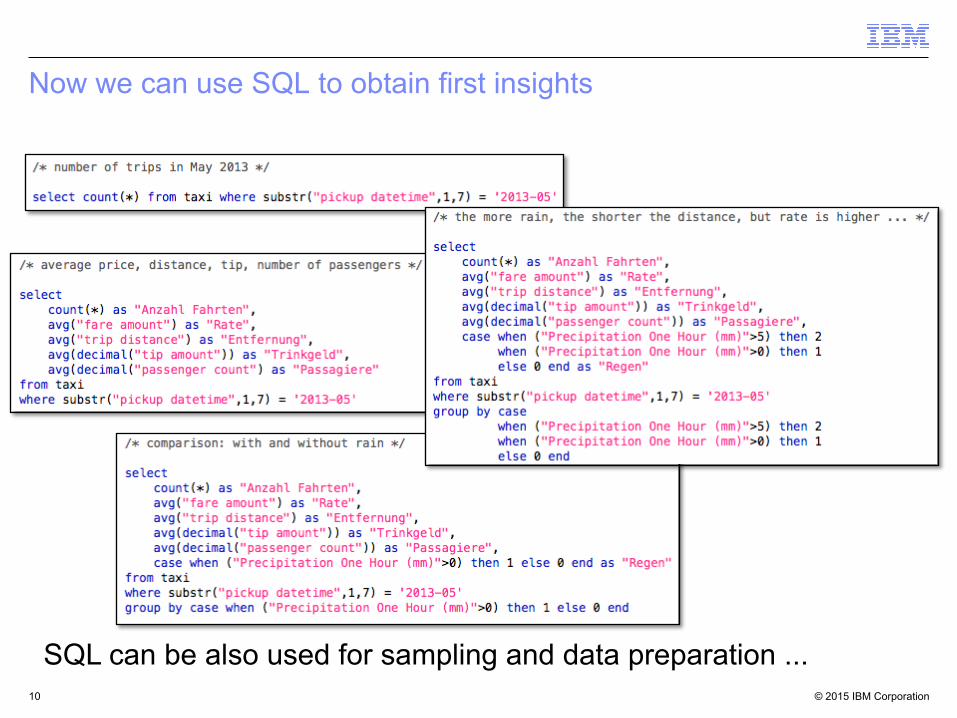
Now we can use SQL to obtain first insights
SQL can be also used for sampling and data preparation ... 10
© 2015 IBM Corporation
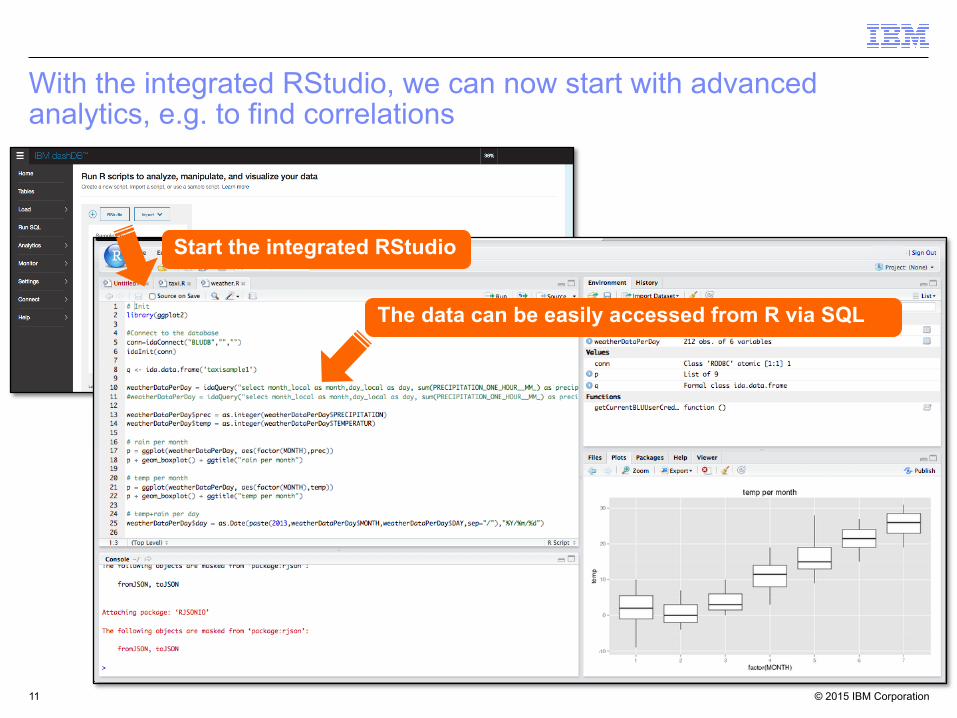
With the integrated RStudio, we can now start with advanced analytics, e.g. to find correlations
The data can be easily accessed from R via SQL
Start the integrated RStudio
11
© 2015 IBM Corporation
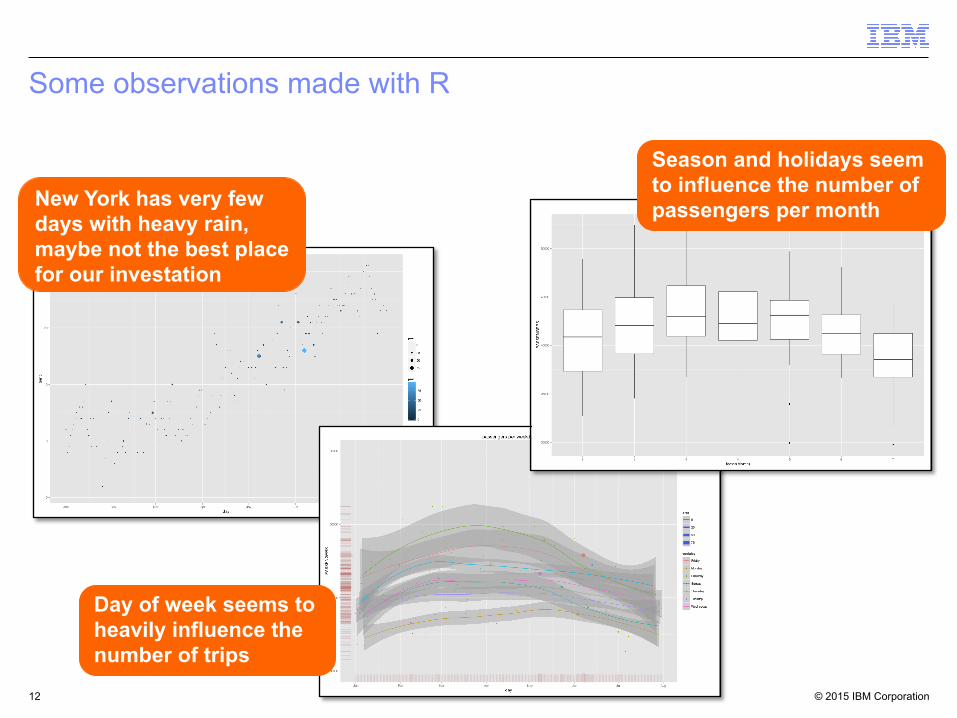
Some observations made with R
12
Day of week seems to heavily influence the number of trips
New York has very few days with heavy rain, maybe not the best place for our investation
Season and holidays seem to influence the number of passengers per month

© 2015 IBM Corporation
So no strong correlations so far, let’s try a T-Test
http://matheguru.com/stochastik/t-test.html#rechner
13
The T-Test indicates that the difference for number of taxi trips doesn’t show significant correlation with rain
© 2015 IBM Corporation
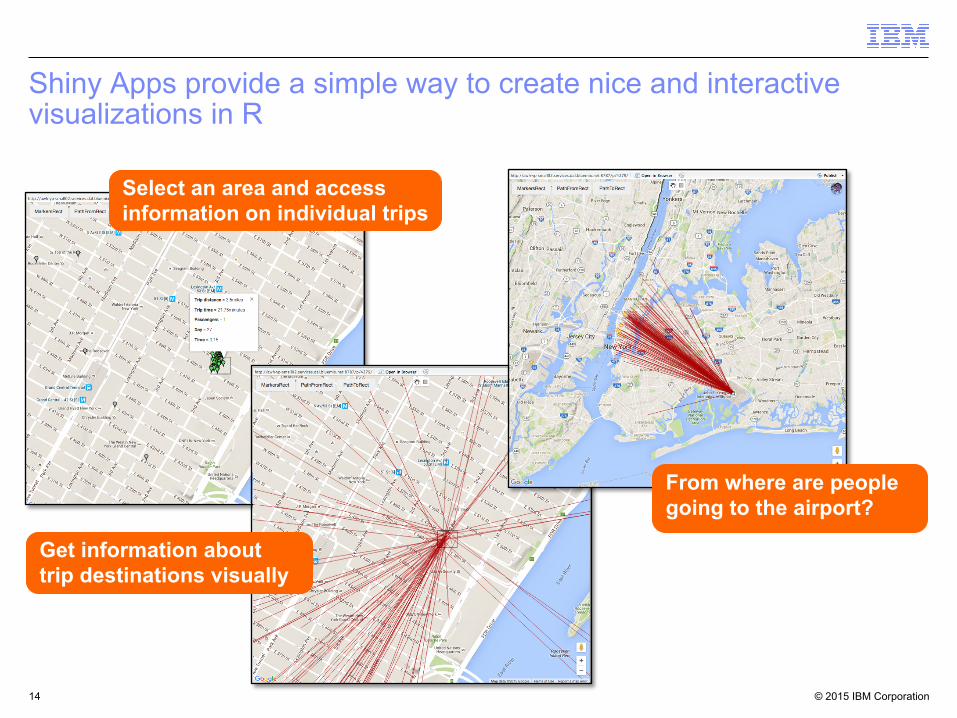
Shiny Apps provide a simple way to create nice and interactive visualizations in R
14
Select an area and access information on individual trips
Get information about trip destinations visually
From where are people going to the airport?
© 2015 IBM Corporation
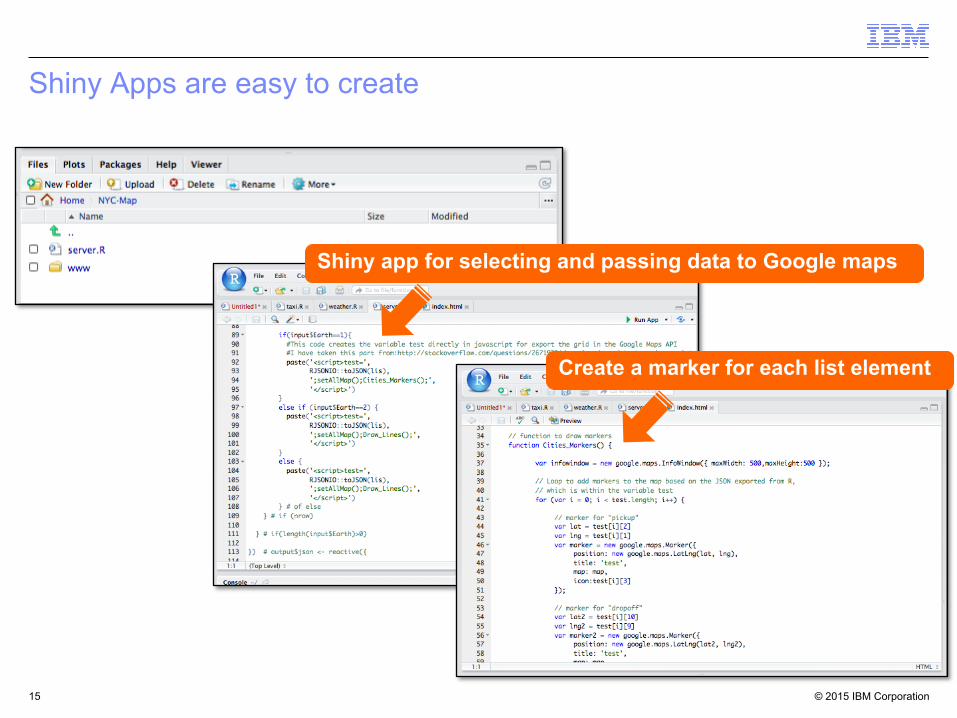
Shiny Apps are easy to create
Create a marker for each list element
Shiny app for selecting and passing data to Google maps
15
© 2015 IBM Corporation
So is it more difficult to get a taxi when it is raining?
§ There are shorter taxi trips when it is raining, but average trip fare is higher è More traffic? Less people using the bike or walk? Traffic jams?
§ T-Test indicates the difference isn’t significant
§ We have analyzed on day level, may be an analysis on an hourly base would show different results
§ So it seems to be a personal impression, but not a correlation, ... But maybe New York just hasn’t enough rain ;-)
§ Find your own answers -> https://github.com/WilHoge/NYC-Taxi-Demo
16
© 2015 IBM Corporation 17
Try it on http://bluemix.net