Embed Size (px)
Citation preview

Georgetown Data Analytics

Hotel Performance Drivers
Ashley Loyd, John Cannon, and Monika Adamczyk
Fall 2015 – Spring 2016

Business Problem
Client:
Hotel Managers & Hotel Investors
Business Problem:
Recent figures show decreasing RevPAR in the Houston hotel market. Investors are worried and suspect that this is because of oil industry.

Hotel Performance: RevPAR
Revenue is not all-encompassing performance metric
Key Metric: RevPAR (Revenue per Available Room) Common performance metric in the hotel industry Best when compared across like time or seasonal periods
RevPAR = Rooms Revenue/Rooms Available Rooms Revenue = revenue generated by room sales Rooms Available = # of rooms available for sale
Also: RevPAR = Occupancy % * ADR (Ave Daily Rate)

Questions
Starting Question: How does the oil and gas industry in
Houston impact hotel performance?
Other questions: Are there other factors that affect
hotel performance in Houston? Is this common in other markets?

Hypothesis
We will find a unique relationship between: Overall employment Employment in the oil and gas
industry Oil prices
...and hotel performance RevPAR
Other factors to consider: Per Diem, PPI, Labor Force, Unemployment rate, YoY changes in factors
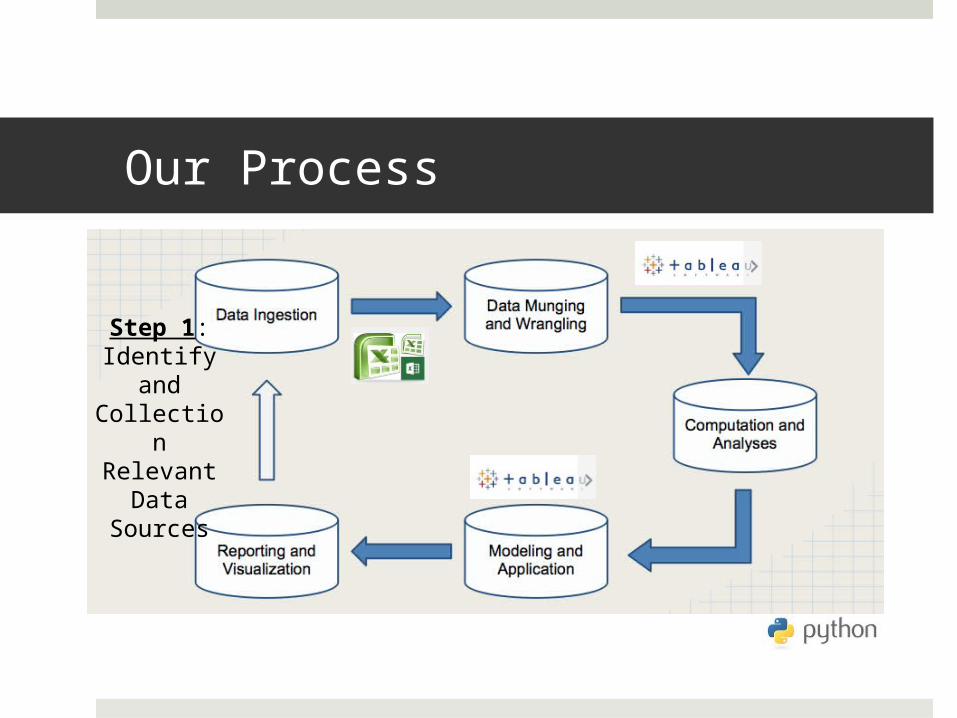
Our Process
Step 1: Identify
and Collection Relevant
Data Sources

Identifying Data Sources/Ingestion
Question: What factors affect RevPAR in Houston? RevPAR Data (Smith Travel Research Data) Employment & PPI Data (Bureau of Labor Statistics) Gas Prices Data (Energy Information Administration) Government Per Diem Data (Data.gov)
Data Ingestion: Collected and wrangled all relevant data sets in Microsoft Excel

Data Wrangling and Challenges
Data came from 4 different sources
Challenges in Munging and Wrangling: Making sure all dates and columns were consistent Ensure that all calculated metrics had no null values Ensure that all data sets could be read by Python to
produce a full scatter matrix plot

Computation & Analysis
First: Use Python (Pandas and MatPlotLib) to look at all factors together and generate a Scatter Plot Matrix
Then: compute regressions for each factor for Houston. If it rendered a useful result, following up and compare to Chicago, New York, and Denver.

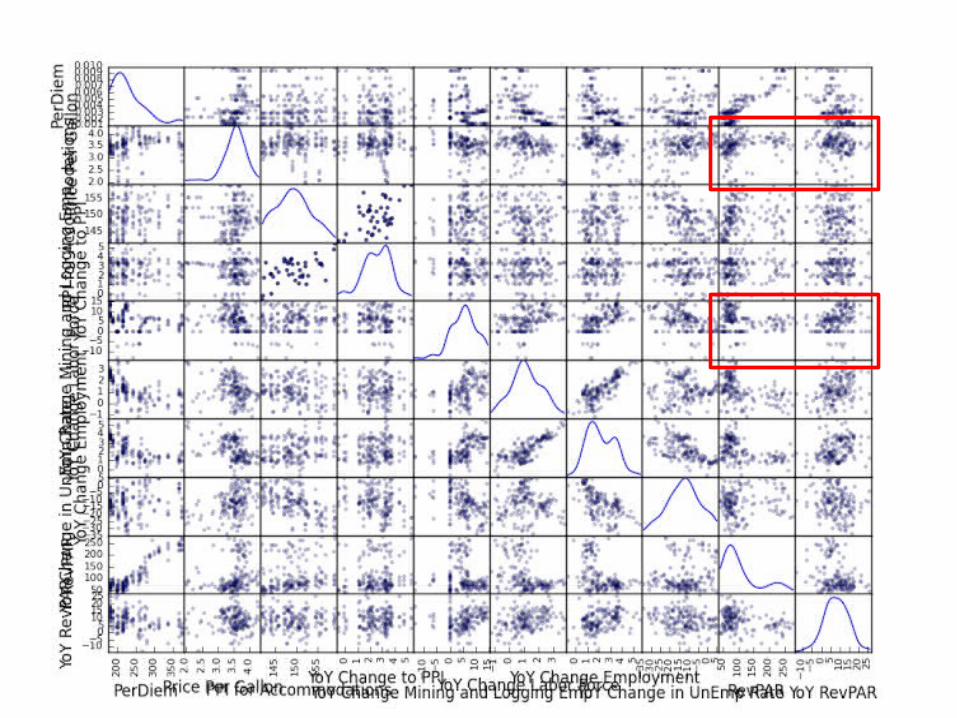
Scatter Plot Matrix
Regression
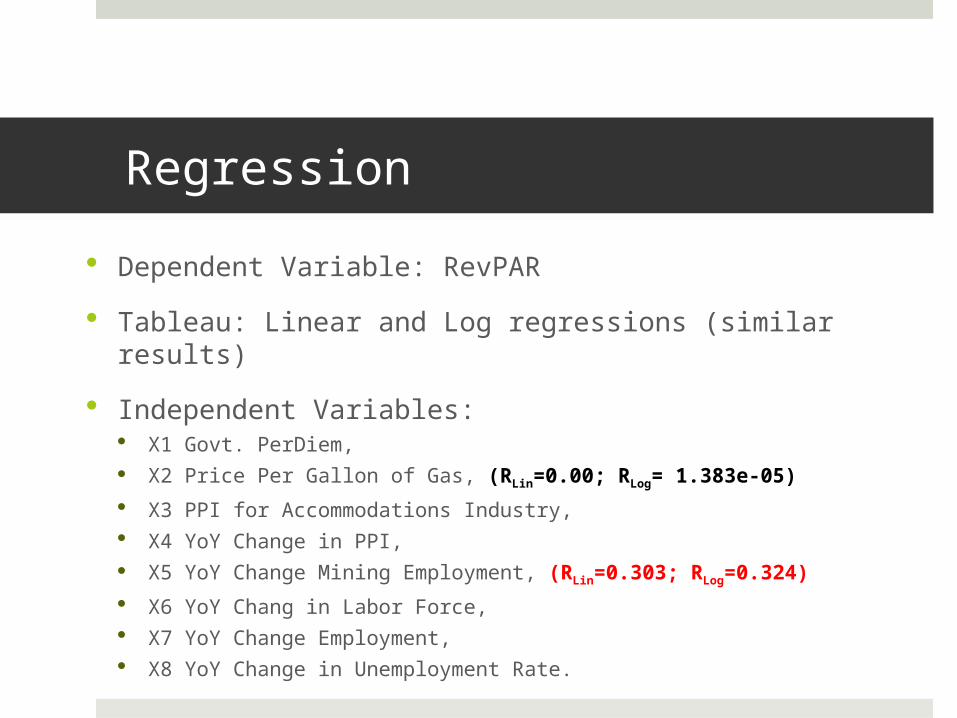
Dependent Variable: RevPAR
Tableau: Linear and Log regressions (similar results)
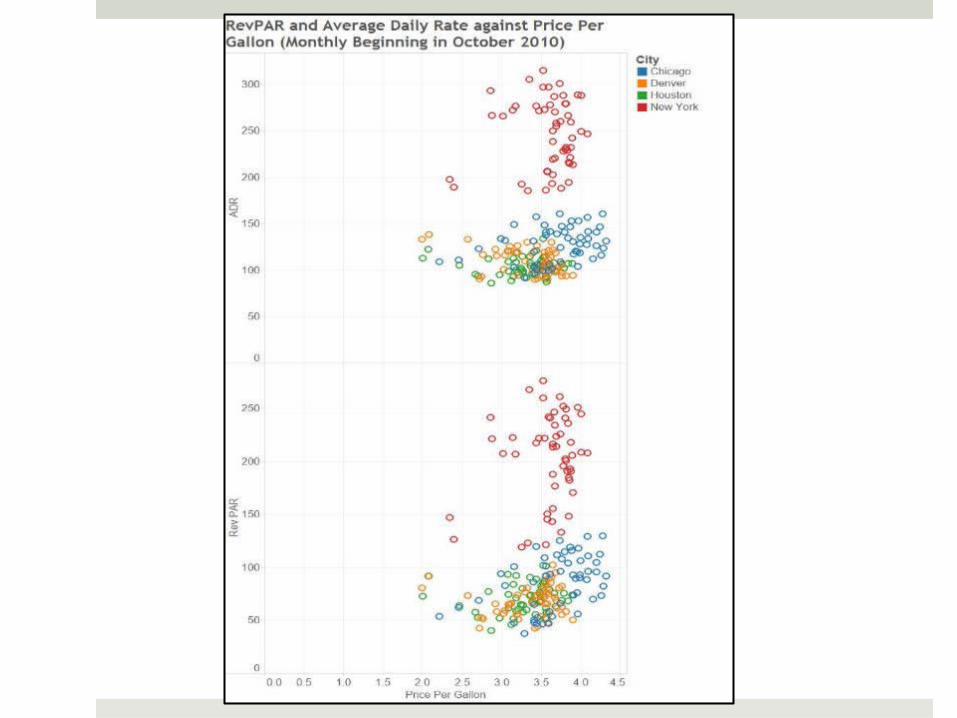
Independent Variables: X1 Govt. PerDiem, X2 Price Per Gallon of Gas, (RLin=0.00; RLog= 1.383e-05)
X3 PPI for Accommodations Industry, X4 YoY Change in PPI, X5 YoY Change Mining Employment, (RLin=0.303; RLog=0.324)
X6 YoY Chang in Labor Force, X7 YoY Change Employment, X8 YoY Change in Unemployment Rate.

Houston in Context
Houston market is closest to Denver market for RevPAR vs. YoY Change in Mining and Logging Employment Data Houston R Value =
0.303 Denver R value
=0.288
Chicago Discrepancy
Results
Hypothesis: In the Houston market, there is a direct, positive correlation between RevPAR and overall employment, employment in the oil and gas industry, and oil prices.
Results: In the Houston market, there is a moderate correlation between: RevPAR and change in mining employment

Applications:Ideally we would investigate more market variables as stepping stones to develop a predictive mode.
Macro level: such a predictive model would indicate performance for an overall market given key factors.
Micro level: this type of model would assist operators and owners in pricing strategies to help them outperform their peers.

Questions?