Embed Size (px)
Citation preview

District-Level Variability in Nutrition Outcomes and Drivers of Stunting at the District Level
Phuong Hong Nguyenwith Derek Headey, Rasmi Avula, Sneha Mani, Lan Mai Tran, Purnima Menon
Poverty, Health and Nutrition Division, International Food Policy Research Institute
May 3, 2017

BackgroundØ India’s progress on nutrition has
accelerated over the last decade
Ø Despite these improvements, levels of stunting and most other nutrition indicators remain unacceptably high.
Ø The positive trends mask wide variation among the Indian states and districts.
Ø Three previous NFHS surveys were only representative at the state level
Ø NFHS-4, with district-level data, offers tremendous learning opportunity
0
10
20
30
40
50
60
70
Stunting Wasting Anemia among women
Exclusive breastfeeding
Low birthweight
%
2006 2016

Objectives
Ø Describe the inter-district variabilities in nutrition outcomes
Ø Analyze drivers of stunting at the district level
Ø How do stunting rates and absolute numbers of stunted children vary across India?
Ø Which underlying determinants have associations with stunting rates?
Ø Which underlying determinants account for the variation in stunting rates observed across high and low burden districts.

Methods
Data sources
Ø District level data set from NHFS-4 Fact Sheets
Ø 2011 Census of India data
Analysis
Ø Mapping nutrition outcomes per district, using WHO cut-off values for public health significance.
Ø Bivariate analyses and multivariate regression analyses of association between various determinants and stunting.
Ø Regression-decomposition to assess the contributions of various underlying determinants to predict spatial patterns in stunting, and differences between high burden and low burden districts
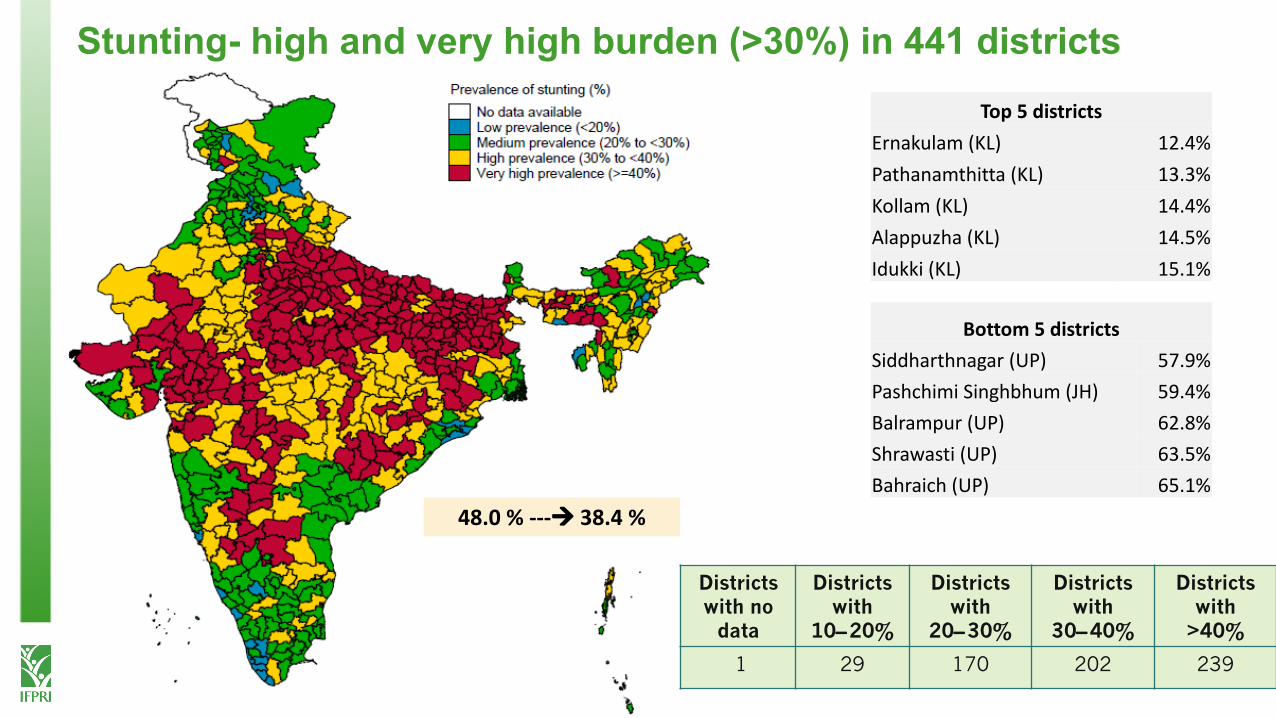
Top 5 districtsErnakulam (KL) 12.4%Pathanamthitta (KL) 13.3%Kollam (KL) 14.4%Alappuzha (KL) 14.5%Idukki (KL) 15.1%
Bottom 5 districtsSiddharthnagar (UP) 57.9%Pashchimi Singhbhum (JH) 59.4%Balrampur (UP) 62.8%Shrawasti (UP) 63.5%Bahraich (UP) 65.1%
Stunting- high and very high burden (>30%) in 441 districts
Districts with no
data
Districts with
10⎼20%
Districts with
20⎼30%
Districts with
30⎼40%
Districts with
>40%
1 29 170 202 239
48.0 % -‐-‐-‐à 38.4 %

Wasting and severe wasting, by district, 2016
Districts with no
data
Districts with
0⎼5%
Districts with
5⎼10%
Districts with
10⎼15%
Districts with
>15%
1 175 307 121 37
Districts with no
data
Districts with 0⎼5%
Districts with
5⎼10%
Districts with
10⎼15%
Districts with
>15%
1 6 42 105 487
19.8 % -‐-‐-‐à 21 % 6.4 % -‐-‐-‐à 7.5 %

Top 5 districtsPhek (NL) 9.0%Champhai (MZ) 12.8%Ukhrul (MN) 16.0%Peren (NL) 17.5%Aizawl (MZ) 18.5%
Bottom 5 districtsSaraikela Kharsawan (JH) 78.8%Dadra and Nagar Haveli (DN) 79.5%Puruliya (WB) 80.0%Kinnaur (HP) 80.8%Lahul and Spiti (HP) 83.2%
Anemia among women of reproductive age, by district, 2016
Districts with no
data
Districts with
10⎼20%
Districts with
20⎼30%
Districts with
30⎼40%
Districts with
>40%
1 7 122 360 151
55.3 % -‐-‐-‐à 53.0 %

Top 5 districtsSurguja (CH) 84.3%Narsimhapur (MP) 84.3%Rajnandgaon (CH) 84.6%Kabirdham (CH) 84.9%Tinsukia (AS) 86.2%
Bottom 5 districtsSouth Garo Hills (ML) 10.4%Muzaffarnagar (UP) 13.3%Rampur (UP) 15.0%Meerut (UP) 15.2%Ambedkar Nagar (UP) 17.4%
Exclusive breastfeeding, by district, 2016
Districts with no
data
Districts with
10⎼40%
Districts with
40⎼50%
Districts with
50⎼60%
Districts with
>60%
216 72 70 89 194
46.4 % -‐-‐-‐à 54.9 %

Overweight and obesity, by district, 2016Men Women
Districts with no
data
Districts with
0⎼10%
Districts with
10⎼20%
Districts with
20⎼30%
Districts with
>30%
1 288 170 149 62
Districts with no
data
Districts with
0⎼10%
Districts with
10⎼20%
Districts with
20⎼30%
Districts with
>30%
1 98 289 160 93
18.6 20.7
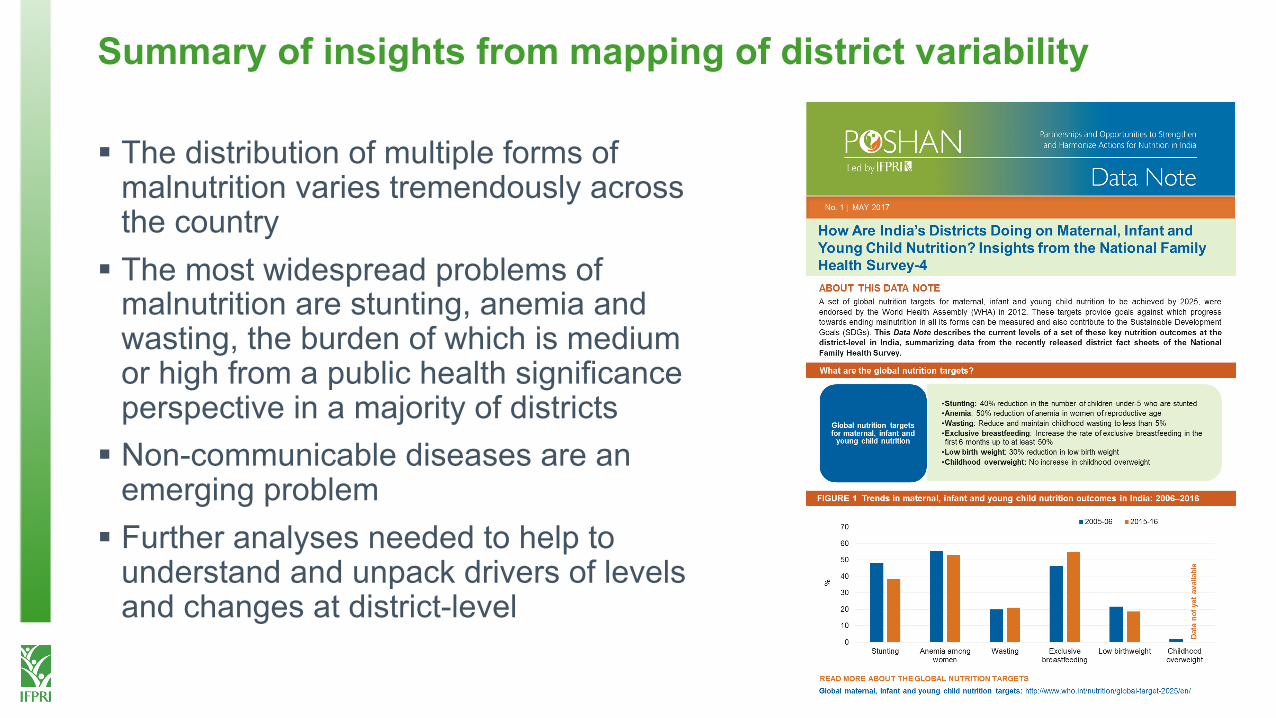
Summary of insights from mapping of district variability
§ The distribution of multiple forms of malnutrition varies tremendously across the country
§ The most widespread problems of malnutrition are stunting, anemia and wasting, the burden of which is medium or high from a public health significance perspective in a majority of districts
§ Non-communicable diseases are an emerging problem
§ Further analyses needed to help to understand and unpack drivers of levels and changes at district-level

Drivers of stunting at the district level – variable selection

Stunting rates and absolute numbers of stunted children among different district categorizations
29
170202
239
0
50
100
150
200
250
300
Low burden (<20%)
Medium burden (20-‐30%)
High burden (30-‐40%)
Very high burden (≥ 40%)
Num
ber o
f districts
723,651
8,872,991
16,363,83037,179,537
Low burden (<20%) Medium burden (20-‐30%)
High burden (30-‐40%) Very high burden (≥ 40%)

Summary of findings on drivers of stunting
Ø Stunting in India remains high and variable among districts
Ø Inter-district differences in stunting are not explained by any single factor, but
rather by a multitude of economic, health, hygiene and demographic factors.
Ø Multi-sectoral strategies with enhanced targeting towards higher burden
districts are needed to reduce inequalities in childhood stunting in India
Ø Next steps: to analyze drivers of change in stunting and other forms of
malnutrition at the district