Embed Size (px)
Citation preview
1/35
OverviewSolution
Microaneurysm detectionConclusions
Diabetic Retinopathy Detection
Sergey Ovcharenko 1 Rasim Akhunzyanov 2
1Deep Learning Engineer at NTech Lab
2Computer Vision Research Engineer at LG Electronics
November 5, 2015
Diabetic Retinopathy Detection
2/35
OverviewSolution
Microaneurysm detectionConclusions
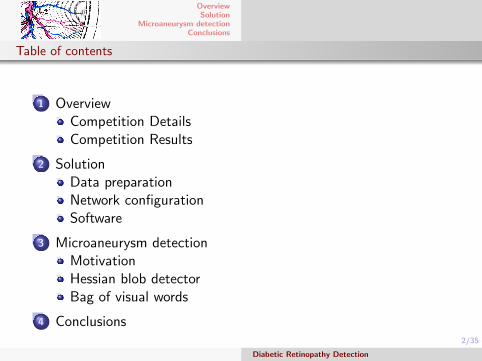
Table of contents
1 OverviewCompetition DetailsCompetition Results
2 SolutionData preparationNetwork configurationSoftware
3 Microaneurysm detectionMotivationHessian blob detectorBag of visual words
4 Conclusions
Diabetic Retinopathy Detection
3/35
OverviewSolution
Microaneurysm detectionConclusions
Competition DetailsCompetition Results
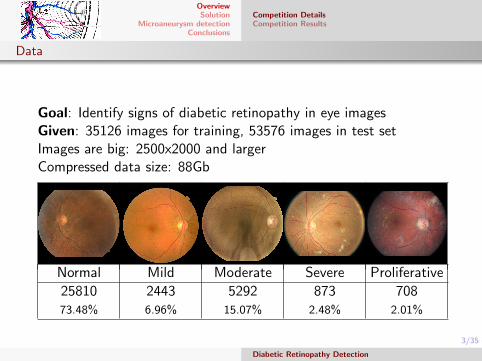
Data
Goal: Identify signs of diabetic retinopathy in eye imagesGiven: 35126 images for training, 53576 images in test setImages are big: 2500x2000 and largerCompressed data size: 88Gb
Normal Mild Moderate Severe Proliferative
2581073.48%
24436.96%
529215.07%
8732.48%
7082.01%
Diabetic Retinopathy Detection
4/35
OverviewSolution
Microaneurysm detectionConclusions
Competition DetailsCompetition Results
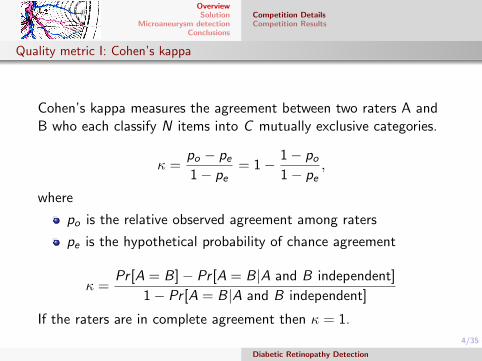
Quality metric I: Cohen’s kappa
Cohen’s kappa measures the agreement between two raters A andB who each classify N items into C mutually exclusive categories.
κ =po − pe1− pe
= 1− 1− po1− pe
,
where
po is the relative observed agreement among raters
pe is the hypothetical probability of chance agreement
κ =Pr [A = B]− Pr [A = B|A and B independent]
1− Pr [A = B|A and B independent]
If the raters are in complete agreement then κ = 1.
Diabetic Retinopathy Detection
5/35
OverviewSolution
Microaneurysm detectionConclusions
Competition DetailsCompetition Results
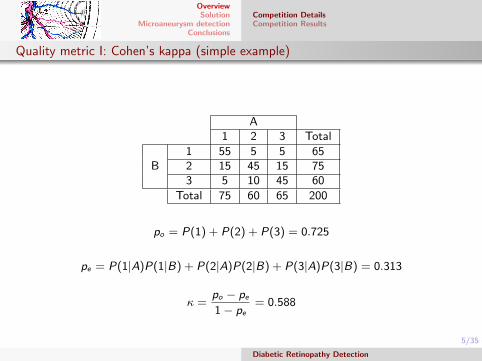
Quality metric I: Cohen’s kappa (simple example)
A1 2 3 Total
B1 55 5 5 652 15 45 15 753 5 10 45 60
Total 75 60 65 200
po = P(1) + P(2) + P(3) = 0.725
pe = P(1|A)P(1|B) + P(2|A)P(2|B) + P(3|A)P(3|B) = 0.313
κ =po − pe1− pe
= 0.588
Diabetic Retinopathy Detection

6/35
OverviewSolution
Microaneurysm detectionConclusions
Competition DetailsCompetition Results
Quality metric II: quadratic weighted kappa
Images have five possible ratings, 0,1,2,3,4. Image is characterized by a tuple(ea, eb), which corresponds to scores by RaterA (human) and RaterB(predicted).Quadratic weighted kappa is calculated as:
κ = 1−∑
i,j wi,jOi,j∑i,j wi,jEi,j
,
where:O is N × N histogram matrix, such that Oi,j corresponds to the numberof images that received a rating i by A and a rating j by B.
E , is N × N histogram matrix of expected ratings. E calculated,assuming that there is no correlation between rating scores. This iscalculated as the outer product between each rater’s histogram vector ofratings, normalized such that E and O have the same sum.
w is N × N matrix of weights, which calculated based on the differencebetween raters’ scores:
wi,j =(i − j)2
(N − 1)2
Diabetic Retinopathy Detection
7/35
OverviewSolution
Microaneurysm detectionConclusions
Competition DetailsCompetition Results
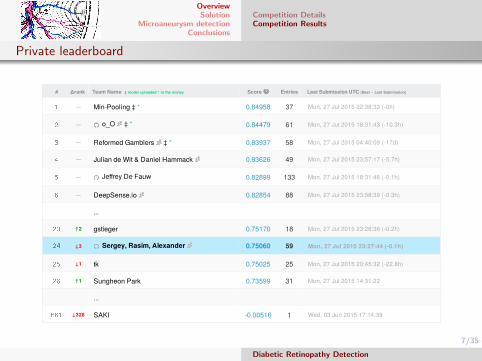
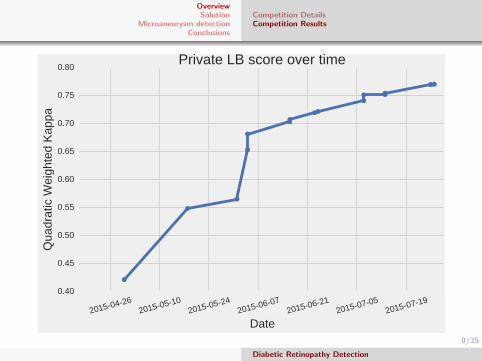
Private leaderboard
# Δrank Team Name ‡ model uploaded * in the money Score Entries Last Submission UTC (Best − Last Submission)
— Min-Pooling ‡ * 0.84958 37 Mon, 27 Jul 2015 22:38:33 (-0h)
— o_O ‡ * 0.84479 61 Mon, 27 Jul 2015 18:31:43 (-10.3h)
— Reformed Gamblers ‡ * 0.83937 58 Mon, 27 Jul 2015 04:40:09 (-17d)
— Julian de Wit & Daniel Hammack 0.83626 49 Mon, 27 Jul 2015 23:57:17 (-5.7h)
— Jeffrey De Fauw 0.82899 133 Mon, 27 Jul 2015 18:31:46 (-0.1h)
— DeepSense.io 0.82854 88 Mon, 27 Jul 2015 23:58:39 (-0.3h)
...
↑2 gstieger 0.75170 18 Mon, 27 Jul 2015 23:28:36 (-0.2h)
↓3 Sergey, Rasim, Alexander 0.75060 59 Mon, 27 Jul 2015 23:27:44 (-0.1h)
↓1 tk 0.75025 25 Mon, 27 Jul 2015 20:45:32 (-22.8h)
↑1 Sungheon Park 0.73599 31 Mon, 27 Jul 2015 14:31:22
...
↓328 SAKI -0.00516 1 Wed, 03 Jun 2015 17:14:39
Diabetic Retinopathy Detection
8/35
OverviewSolution
Microaneurysm detectionConclusions
Competition DetailsCompetition Results
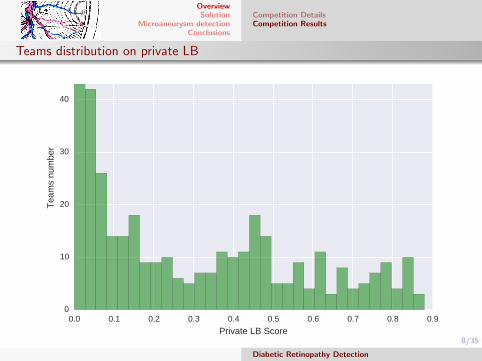
Teams distribution on private LB
0.0 0.1 0.2 0.3 0.4 0.5 0.6 0.7 0.8 0.9Private LB Score
0
10
20
30
40
50T
eam
s nu
mbe
r
Diabetic Retinopathy Detection
9/35
OverviewSolution
Microaneurysm detectionConclusions
Competition DetailsCompetition Results
2015042620150510
2015052420150607
2015062120150705
20150719
Date
0.40
0.45
0.50
0.55
0.60
0.65
0.70
0.75
0.80
Qua
drat
ic W
eigh
ted
Kap
paPrivate LB score over time
Diabetic Retinopathy Detection

10/35
OverviewSolution
Microaneurysm detectionConclusions
Data preparationNetwork configurationSoftware
Domain knowledge: diabetic retinopathy symptoms
DR symptoms cheatsheet: https://goo.gl/s5lMt8
Was prepared with assistance of Vera Shevchenko
International Clinical Diabetic Retinopathy Disease SeverityScale, Detailed Table:http://www.icoph.org/downloads/Diabetic-Retinopathy-Detail.pdf
Diabetic Retinopathy Detection
11/35
OverviewSolution
Microaneurysm detectionConclusions
Data preparationNetwork configurationSoftware
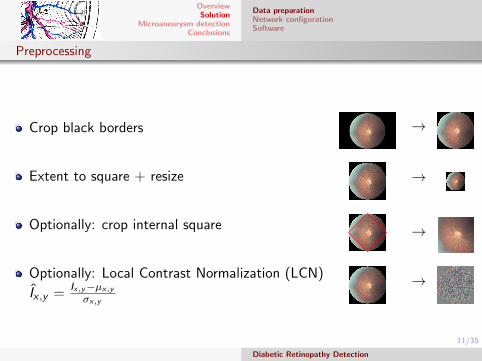
Preprocessing
Crop black borders
Extent to square + resize
Optionally: crop internal square
Optionally: Local Contrast Normalization (LCN)
Ix ,y =Ix,y−µx,yσx,y
→
→
→
→
Diabetic Retinopathy Detection
12/35
OverviewSolution
Microaneurysm detectionConclusions
Data preparationNetwork configurationSoftware
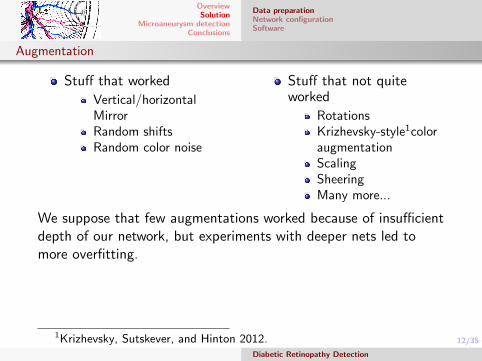
Augmentation
Stuff that worked
Vertical/horizontalMirrorRandom shiftsRandom color noise
Stuff that not quiteworked
RotationsKrizhevsky-style1coloraugmentationScalingSheeringMany more...
We suppose that few augmentations worked because of insufficientdepth of our network, but experiments with deeper nets led tomore overfitting.
1Krizhevsky, Sutskever, and Hinton 2012.Diabetic Retinopathy Detection
13/35
OverviewSolution
Microaneurysm detectionConclusions
Data preparationNetwork configurationSoftware
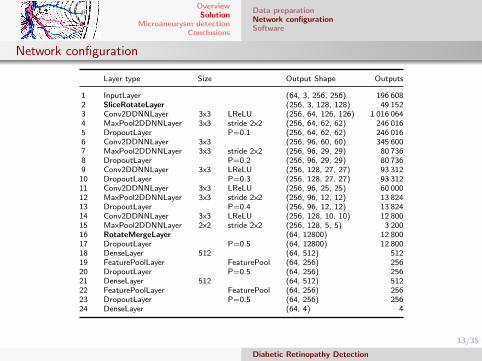
Network configuration
Layer type Size Output Shape Outputs
1 InputLayer (64, 3, 256, 256) 196 6082 SliceRotateLayer (256, 3, 128, 128) 49 1523 Conv2DDNNLayer 3x3 LReLU (256, 64, 126, 126) 1 016 0644 MaxPool2DDNNLayer 3x3 stride 2x2 (256, 64, 62, 62) 246 0165 DropoutLayer P=0.1 (256, 64, 62, 62) 246 0166 Conv2DDNNLayer 3x3 (256, 96, 60, 60) 345 6007 MaxPool2DDNNLayer 3x3 stride 2x2 (256, 96, 29, 29) 80 7368 DropoutLayer P=0.2 (256, 96, 29, 29) 80 7369 Conv2DDNNLayer 3x3 LReLU (256, 128, 27, 27) 93 31210 DropoutLayer P=0.3 (256, 128, 27, 27) 93 31211 Conv2DDNNLayer 3x3 LReLU (256, 96, 25, 25) 60 00012 MaxPool2DDNNLayer 3x3 stride 2x2 (256, 96, 12, 12) 13 82413 DropoutLayer P=0.4 (256, 96, 12, 12) 13 82414 Conv2DDNNLayer 3x3 LReLU (256, 128, 10, 10) 12 80015 MaxPool2DDNNLayer 2x2 stride 2x2 (256, 128, 5, 5) 3 20016 RotateMergeLayer (64, 12800) 12 80017 DropoutLayer P=0.5 (64, 12800) 12 80018 DenseLayer 512 (64, 512) 51219 FeaturePoolLayer FeaturePool (64, 256) 25620 DropoutLayer P=0.5 (64, 256) 25621 DenseLayer 512 (64, 512) 51222 FeaturePoolLayer FeaturePool (64, 256) 25623 DropoutLayer P=0.5 (64, 256) 25624 DenseLayer (64, 4) 4
Diabetic Retinopathy Detection
14/35
OverviewSolution
Microaneurysm detectionConclusions
Data preparationNetwork configurationSoftware
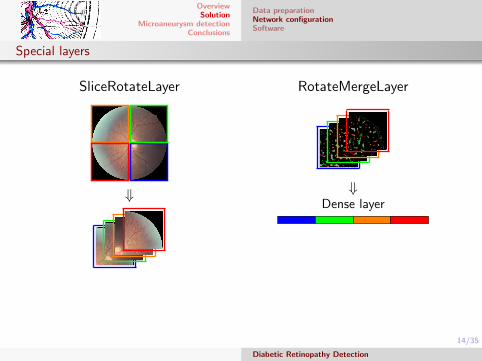
Special layers
SliceRotateLayer
⇓
RotateMergeLayer
⇓Dense layer
Diabetic Retinopathy Detection
15/35
OverviewSolution
Microaneurysm detectionConclusions
Data preparationNetwork configurationSoftware
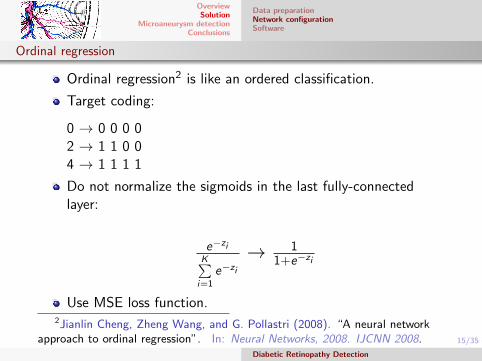
Ordinal regression
Ordinal regression2 is like an ordered classification.
Target coding:
0 → 0 0 0 02 → 1 1 0 04 → 1 1 1 1
Do not normalize the sigmoids in the last fully-connectedlayer:
e−zi
K∑i=1
e−zi
→ 11+e−zi
Use MSE loss function.2Jianlin Cheng, Zheng Wang, and G. Pollastri (2008). “A neural network
approach to ordinal regression”. In: Neural Networks, 2008. IJCNN 2008.Diabetic Retinopathy Detection
16/35
OverviewSolution
Microaneurysm detectionConclusions
Data preparationNetwork configurationSoftware
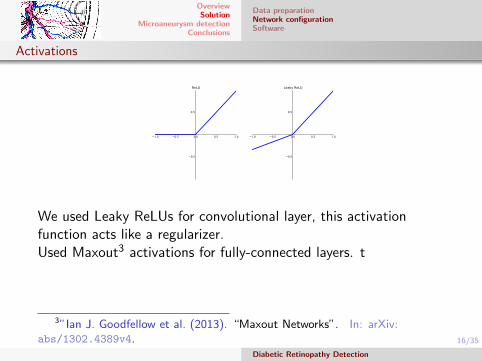
Activations
1.0 0.5 0.0 0.5 1.0
0.5
0.5
ReLU
1.0 0.5 0.0 0.5 1.0
0.5
0.5
Leaky ReLU
We used Leaky ReLUs for convolutional layer, this activationfunction acts like a regularizer.Used Maxout3 activations for fully-connected layers. t
3”Ian J. Goodfellow et al. (2013). “Maxout Networks”. In: arXiv:abs/1302.4389v4.
Diabetic Retinopathy Detection
17/35
OverviewSolution
Microaneurysm detectionConclusions
Data preparationNetwork configurationSoftware
Optimization I
SGD with Nesterov4 momentum of 0.9
About 450000 gradient steps
3 step learning rate decay: 0.02, 0.01, 0.001
Minibatch size of 32
4Y.Nesterov (1983). “A method for unconstrained convex minimizationproblem with the rate of convergence o( 1
k2)”. In: Doklady AN SSSR.
Diabetic Retinopathy Detection
18/35
OverviewSolution
Microaneurysm detectionConclusions
Data preparationNetwork configurationSoftware
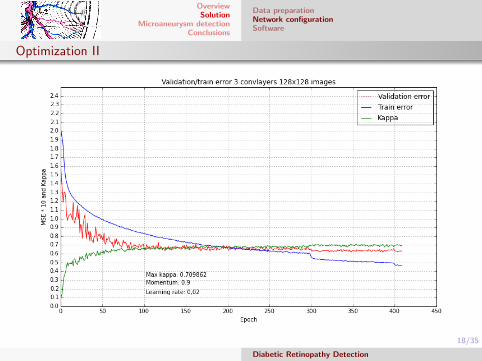
Optimization II
Diabetic Retinopathy Detection
19/35
OverviewSolution
Microaneurysm detectionConclusions
Data preparationNetwork configurationSoftware
Overfitting
During the whole competition we were badly overfitting.
Not all of the augmentation approaches worked for us, whichmade things worse.
The best thing we could come up with was an extensivedropout usage.
Diabetic Retinopathy Detection
20/35
OverviewSolution
Microaneurysm detectionConclusions
Data preparationNetwork configurationSoftware
Decision making
Each eye was processed independently
A maximum score among the eyes was assigned to both ofthem
This improved the score by 0.05 points
Diabetic Retinopathy Detection
21/35
OverviewSolution
Microaneurysm detectionConclusions
Data preparationNetwork configurationSoftware
Ensembling
Our final submission was en ensemble of 5 neural networks.
The predictions were weighted according to the confusionmatrix on a held-out validation set.
This improved the score by 0.05 points (7 % improvement).
Diabetic Retinopathy Detection
22/35
OverviewSolution
Microaneurysm detectionConclusions
Data preparationNetwork configurationSoftware
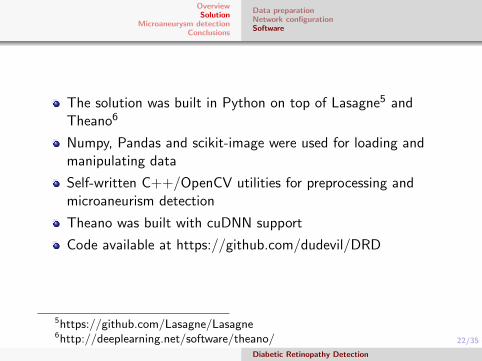
The solution was built in Python on top of Lasagne5 andTheano6
Numpy, Pandas and scikit-image were used for loading andmanipulating data
Self-written C++/OpenCV utilities for preprocessing andmicroaneurism detection
Theano was built with cuDNN support
Code available at https://github.com/dudevil/DRD
5https://github.com/Lasagne/Lasagne6http://deeplearning.net/software/theano/
Diabetic Retinopathy Detection
23/35
OverviewSolution
Microaneurysm detectionConclusions
Data preparationNetwork configurationSoftware
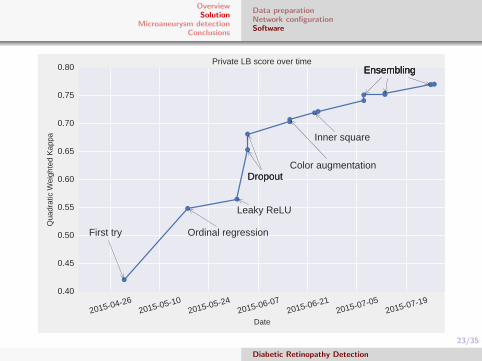
2015042620150510
2015052420150607
2015062120150705
20150719
Date
0.40
0.45
0.50
0.55
0.60
0.65
0.70
0.75
0.80
Qua
drat
ic W
eigh
ted
Kap
pa
First try Ordinal regression
Leaky ReLU
DropoutDropoutColor augmentation
Inner square
EnsemblingEnsemblingEnsemblingPrivate LB score over time
Diabetic Retinopathy Detection
24/35
OverviewSolution
Microaneurysm detectionConclusions
MotivationHessian blob detectorBag of visual words
Motivation I
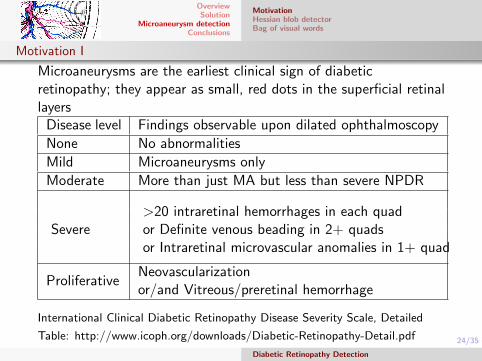
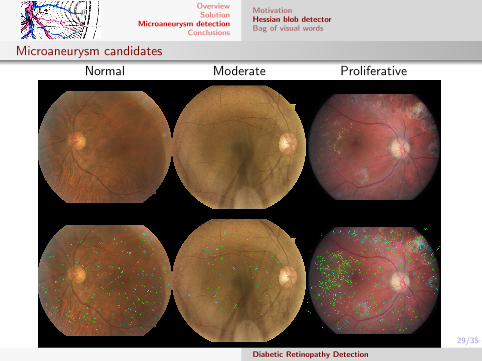
Microaneurysms are the earliest clinical sign of diabeticretinopathy; they appear as small, red dots in the superficial retinallayers
Disease level Findings observable upon dilated ophthalmoscopy
None No abnormalities
Mild Microaneurysms only
Moderate More than just MA but less than severe NPDR
Severe>20 intraretinal hemorrhages in each quador Definite venous beading in 2+ quadsor Intraretinal microvascular anomalies in 1+ quad
ProliferativeNeovascularizationor/and Vitreous/preretinal hemorrhage
International Clinical Diabetic Retinopathy Disease Severity Scale, Detailed
Table: http://www.icoph.org/downloads/Diabetic-Retinopathy-Detail.pdf
Diabetic Retinopathy Detection
25/35
OverviewSolution
Microaneurysm detectionConclusions
MotivationHessian blob detectorBag of visual words
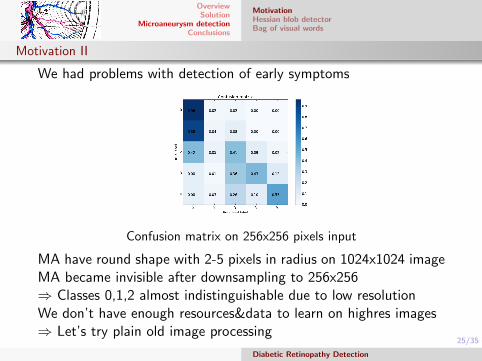
Motivation II
We had problems with detection of early symptoms
Confusion matrix on 256x256 pixels input
MA have round shape with 2-5 pixels in radius on 1024x1024 imageMA became invisible after downsampling to 256x256⇒ Classes 0,1,2 almost indistinguishable due to low resolutionWe don’t have enough resources&data to learn on highres images⇒ Let’s try plain old image processing
Diabetic Retinopathy Detection

26/35
OverviewSolution
Microaneurysm detectionConclusions
MotivationHessian blob detectorBag of visual words
Microaneurysm candidates using the determinant of the Hessian I
We want to know how much pixel location is similar to blob shape. Let’scalculate Hessian matrix at that point:
H(x) =
[Lxx(x) Lxy (x)Lxy (x) Lyy (x)
]
Laa(x) is second partial derivative in the a direction
Lab(x) is the mixed partial second derivative in the a and bdirections.
Derivatives are computed in some scale σI – smoothed by a Gaussiankernel
L(x) = g(σI )⊗ I (x).
Derivatives must be scaled by factor related to the Gaussian kernel: σ2I .
Diabetic Retinopathy Detection

27/35
OverviewSolution
Microaneurysm detectionConclusions
MotivationHessian blob detectorBag of visual words
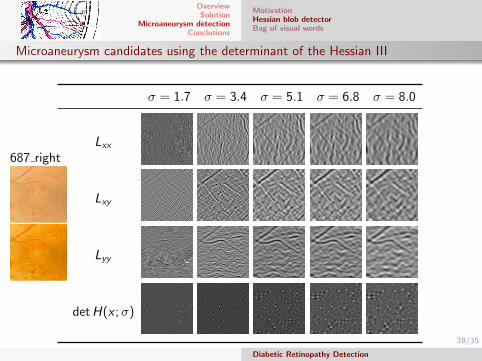
Microaneurysm candidates using the determinant of the Hessian II
At each scale, blobs points are those points that are local extrema ofdeterminant the Hessian matrix.
detH(x ;σ) = σ2I (LxxLyy (x)− L2xy (x))
Sign of the trace of Hessian matrix help distinguish dark from light points:
traceH(x ;σ) = σI (Lxx + Lyy ).
Straightforward differential blob detector with automatic scale selection:
(x , σ) = argmaxlocal(x ;t)(detH(x ;σ))
Diabetic Retinopathy Detection
28/35
OverviewSolution
Microaneurysm detectionConclusions
MotivationHessian blob detectorBag of visual words
Microaneurysm candidates using the determinant of the Hessian III
687 right
σ = 1.7 σ = 3.4 σ = 5.1 σ = 6.8 σ = 8.0
Lxx
Lxy
Lyy
detH(x ;σ)
Diabetic Retinopathy Detection
29/35
OverviewSolution
Microaneurysm detectionConclusions
MotivationHessian blob detectorBag of visual words
Microaneurysm candidates
Normal Moderate Proliferative
Diabetic Retinopathy Detection

29/35
OverviewSolution
Microaneurysm detectionConclusions
MotivationHessian blob detectorBag of visual words
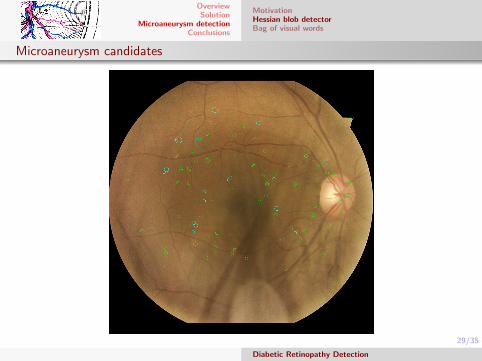
Microaneurysm candidates
Diabetic Retinopathy Detection
29/35
OverviewSolution
Microaneurysm detectionConclusions
MotivationHessian blob detectorBag of visual words
Microaneurysm candidates
Diabetic Retinopathy Detection
30/35
OverviewSolution
Microaneurysm detectionConclusions
MotivationHessian blob detectorBag of visual words
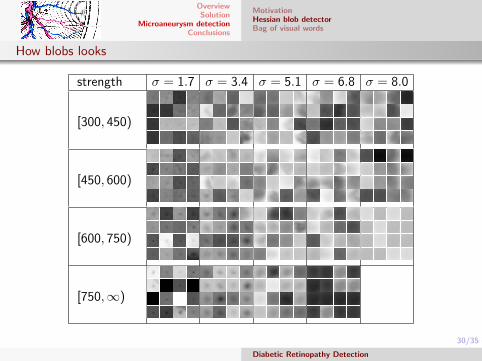
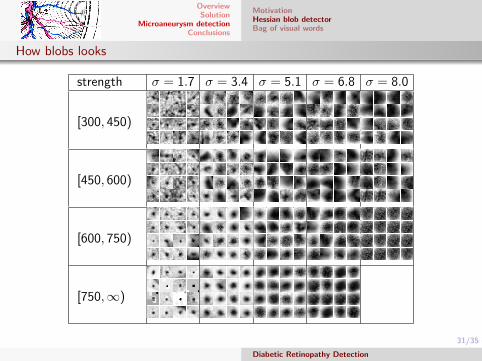
How blobs looks
strength σ = 1.7 σ = 3.4 σ = 5.1 σ = 6.8 σ = 8.0
[300, 450)
[450, 600)
[600, 750)
[750,∞)
Diabetic Retinopathy Detection
31/35
OverviewSolution
Microaneurysm detectionConclusions
MotivationHessian blob detectorBag of visual words
How blobs looks
strength σ = 1.7 σ = 3.4 σ = 5.1 σ = 6.8 σ = 8.0
[300, 450)
[450, 600)
[600, 750)
[750,∞)
Diabetic Retinopathy Detection
32/35
OverviewSolution
Microaneurysm detectionConclusions
MotivationHessian blob detectorBag of visual words
BoVW preparation
Extract local descriptors from blob patch: HOG, LBP
Create code book using K-means vector quantization
Use histograms of visual words as feature vectors
Diabetic Retinopathy Detection
33/35
OverviewSolution
Microaneurysm detectionConclusions
MotivationHessian blob detectorBag of visual words
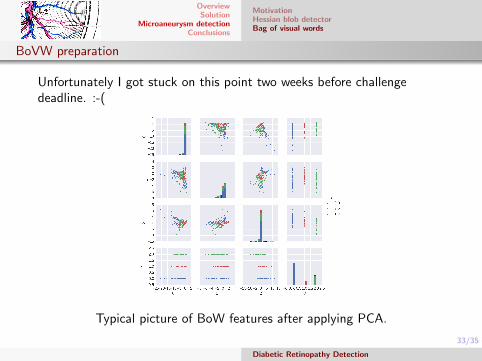
BoVW preparation
Unfortunately I got stuck on this point two weeks before challengedeadline. :-(
Typical picture of BoW features after applying PCA.
Diabetic Retinopathy Detection
34/35
OverviewSolution
Microaneurysm detectionConclusions
Conclusions
Teamwork
Find good tools for effective collaborationDivide and conquerLearn togetherMaintain model diversity
Competition
Setup a reliable experiment-evaluate loopBe careful when keeping track of experimentsPlan ahead when experiments are long (24+ hours in out case)Understand evaluation metricTry different things
Diabetic Retinopathy Detection
35/35
OverviewSolution
Microaneurysm detectionConclusions
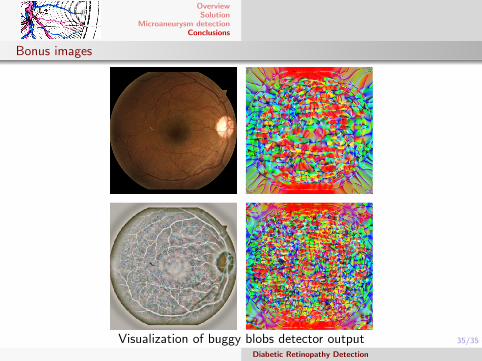
Bonus images
Visualization of buggy blobs detector outputDiabetic Retinopathy Detection
35/35
OverviewSolution
Microaneurysm detectionConclusions
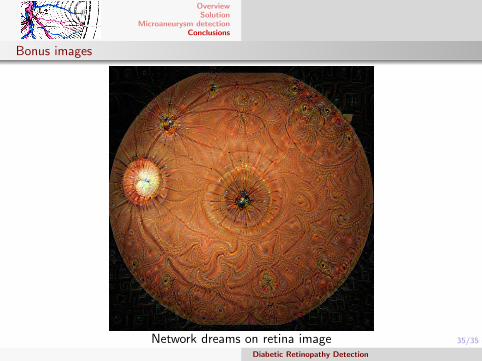
Bonus images
Network dreams on retina imageDiabetic Retinopathy Detection
35/35
OverviewSolution
Microaneurysm detectionConclusions
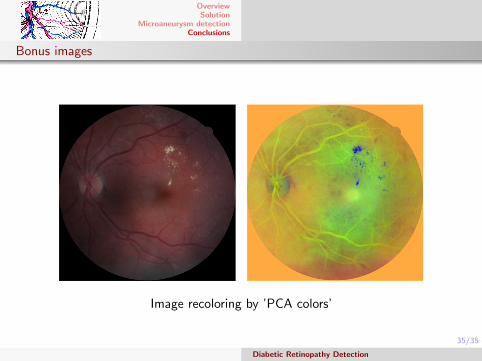
Bonus images
Image recoloring by ’PCA colors’
Diabetic Retinopathy Detection
35/35
OverviewSolution
Microaneurysm detectionConclusions
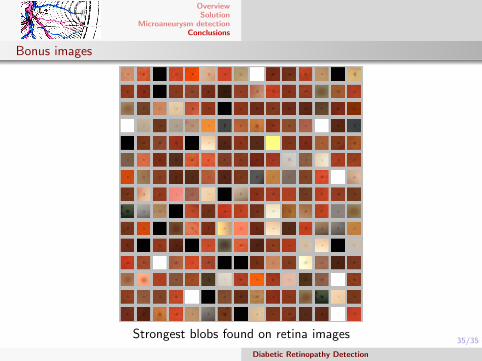
Bonus images
Strongest blobs found on retina images
Diabetic Retinopathy Detection


![The Guide - Diabetic Retinopathy - Vision Lossvisionloss.org.au/wp-content/uploads/2016/05/The... · the guide [diabetic retinopathy] What is Diabetic Retinopathy? Diabetic Retinopathy](https://img.pdfslide.us/doc/110x75/5e3ed00bf9c32e41ea6578a8/the-guide-diabetic-retinopathy-vision-the-guide-diabetic-retinopathy-what.jpg)