Embed Size (px)
Citation preview
A-Z of A/B testingDr. Shrividya RaviData Scientist at MetailData Insights Meetup 3 December 2015
Overview
• Introduction
– What is A/B testing?
– Comparing web and field tests
• Analysis
• Effects that can affect test
– Denominator issues
– Temporal effects
– Hidden bias
• Bootstrapping
• From validation to understanding mechanisms
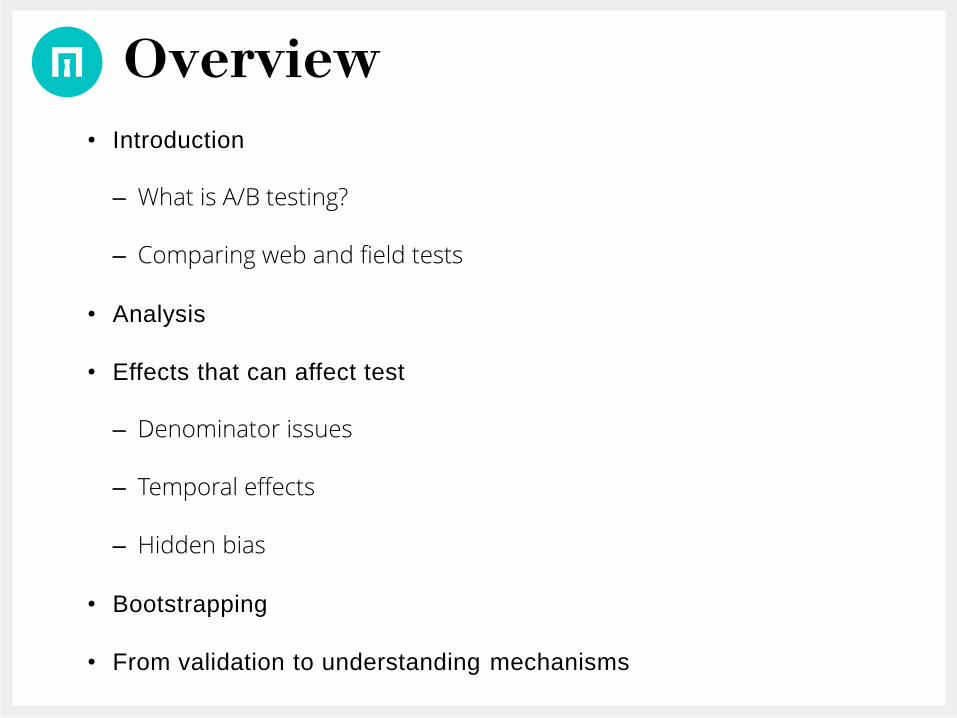
A/B testing
• Essentially a randomized trial
• Split traffic 50:50
• One group sees ‘normal’ site
• The other group sees the variant or ‘treatment’
• After a set period of time, calculate the difference in KPIs between the two groups
• Generally, you can attribute the difference to the treatment
http://www.smashingmagazine.com/2010/06/the-ultimate-guide-to-a-b-testing/
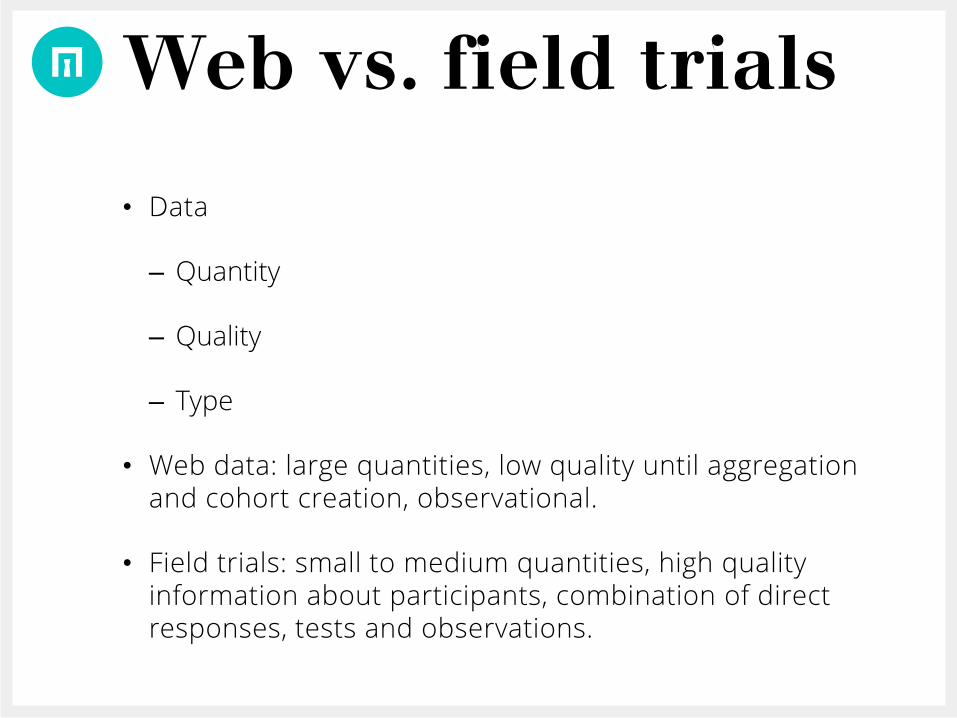
Web vs. field trials
• Data
– Quantity
– Quality
– Type
• Web data: large quantities, low quality until aggregation and cohort creation, observational.
• Field trials: small to medium quantities, high quality information about participants, combination of direct responses, tests and observations.

Events
• Launching the widget
• Adding item to Bag
• Rotating MeModel
• Pressing Share button
• Adding garment to try on
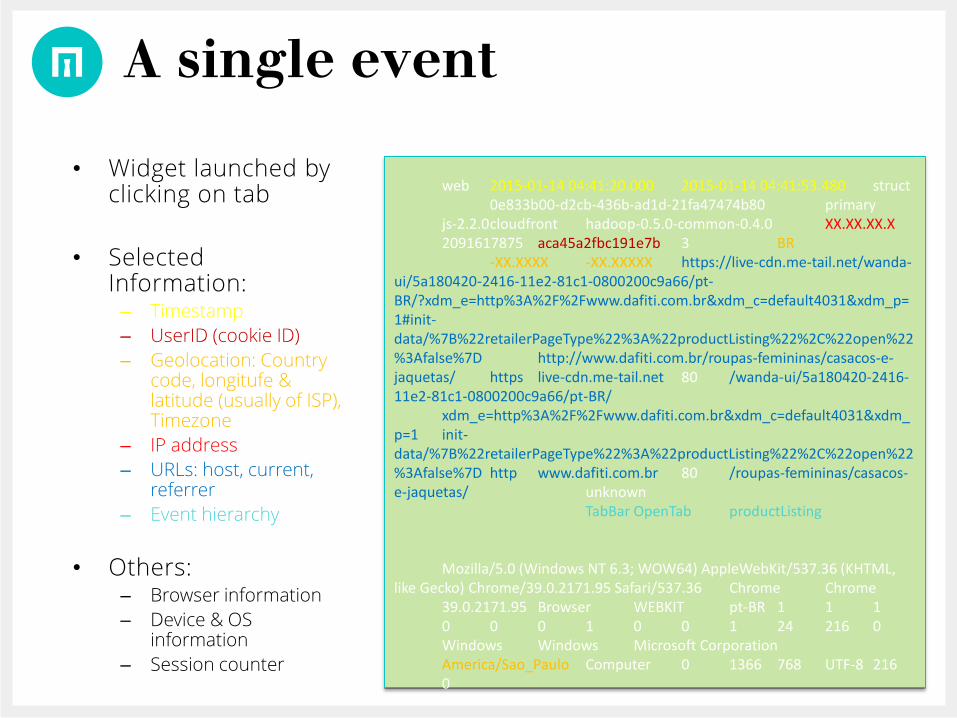
A single event
web 2015-01-14 04:41:20.000 2015-01-14 04:41:53.480 struct0e833b00-d2cb-436b-ad1d-21fa47474b80 primary
js-2.2.0cloudfront hadoop-0.5.0-common-0.4.0 XX.XX.XX.X2091617875 aca45a2fbc191e7b 3 BR
-XX.XXXX -XX.XXXXX https://live-cdn.me-tail.net/wanda-ui/5a180420-2416-11e2-81c1-0800200c9a66/pt-BR/?xdm_e=http%3A%2F%2Fwww.dafiti.com.br&xdm_c=default4031&xdm_p=1#init-data/%7B%22retailerPageType%22%3A%22productListing%22%2C%22open%22%3Afalse%7D http://www.dafiti.com.br/roupas-femininas/casacos-e-jaquetas/ https live-cdn.me-tail.net 80 /wanda-ui/5a180420-2416-11e2-81c1-0800200c9a66/pt-BR/
xdm_e=http%3A%2F%2Fwww.dafiti.com.br&xdm_c=default4031&xdm_p=1 init-data/%7B%22retailerPageType%22%3A%22productListing%22%2C%22open%22%3Afalse%7D http www.dafiti.com.br 80 /roupas-femininas/casacos-e-jaquetas/ unknown
TabBar OpenTab productListing
Mozilla/5.0 (Windows NT 6.3; WOW64) AppleWebKit/537.36 (KHTML, like Gecko) Chrome/39.0.2171.95 Safari/537.36 Chrome Chrome
39.0.2171.95 Browser WEBKIT pt-BR 1 1 10 0 0 1 0 0 1 24 216 0Windows Windows Microsoft CorporationAmerica/Sao_Paulo Computer 0 1366 768 UTF-8 2160
• Widget launched by clicking on tab
• Selected Information:– Timestamp
– UserID (cookie ID)
– Geolocation: Country code, longitufe & latitude (usually of ISP), Timezone
– IP address
– URLs: host, current, referrer
– Event hierarchy
• Others:– Browser information
– Device & OS information
– Session counter
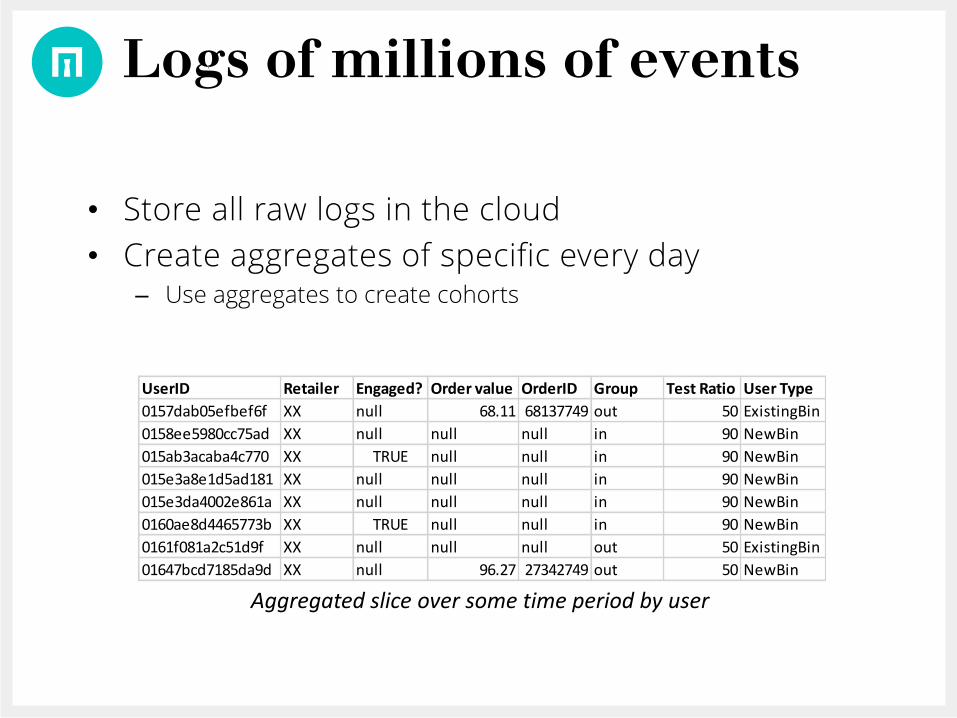
Logs of millions of events
• Store all raw logs in the cloud
• Create aggregates of specific every day– Use aggregates to create cohorts
UserID Retailer Engaged? Order value OrderID Group Test Ratio User Type
0157dab05efbef6f XX null 68.11 68137749 out 50 ExistingBin
0158ee5980cc75ad XX null null null in 90 NewBin
015ab3acaba4c770 XX TRUE null null in 90 NewBin
015e3a8e1d5ad181 XX null null null in 90 NewBin
015e3da4002e861a XX null null null in 90 NewBin
0160ae8d4465773b XX TRUE null null in 90 NewBin
0161f081a2c51d9f XX null null null out 50 ExistingBin
01647bcd7185da9d XX null 96.27 27342749 out 50 NewBin
Aggregated slice over some time period by user

Analysing A/B tests

Basic A/B test
• Change in homepage
• Measure difference in Average Order Value (AOV) between control and treatment.
https://www.google.co.uk/url?sa=i&rct=j&q=&esrc=s&source=images&cd=&cad=rja&uact=8&ved=0ahUKEwjip4_nxr3JAhWFJw8KHTbdAaoQjRwIBw&url=http%3A%2F%2Fpadicode.com%2Fblog%2Femail-marketing-2%2Fab-testing-resources%2F&psig=AFQjCNEnv6hj7n9VW-z0tx54iLl5c3srIA&ust=1449158617165351

Results
AOV = Mean Order Value
Group AOV (monetary units)
Control 114
Variant 103.4
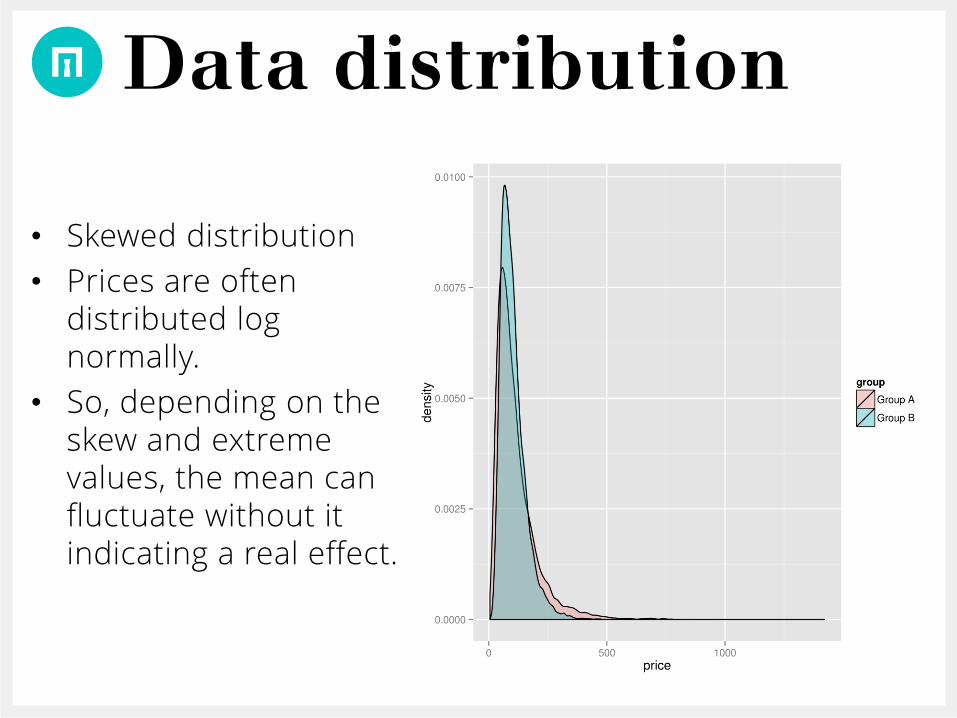
Data distribution
• Skewed distribution
• Prices are often distributed log normally.
• So, depending on the skew and extreme values, the mean can fluctuate without it indicating a real effect.

Significance testing
• z-test of lognormal means between groups
• Critical threshold: 0.05
• H0 = 0; Ha > 0
• Single-tailed p-value:– 0.00682
• Double-tailed p-value– 0.0137

Simulate beforehand
Pitfalls
• Temporal effects
– Novelty
– Spikes
• Noise
– Dilution
• Bias
– Bucketing bias
– Asymmetric cohorts
• Bugs
Temporal effects
• Novelty: strong effect at the beginning wanes over time.
• Spikes/spurious data: Atypical mechanisms.
• Monitoring only p-value going below a critical threshold will misinterpret the effect.

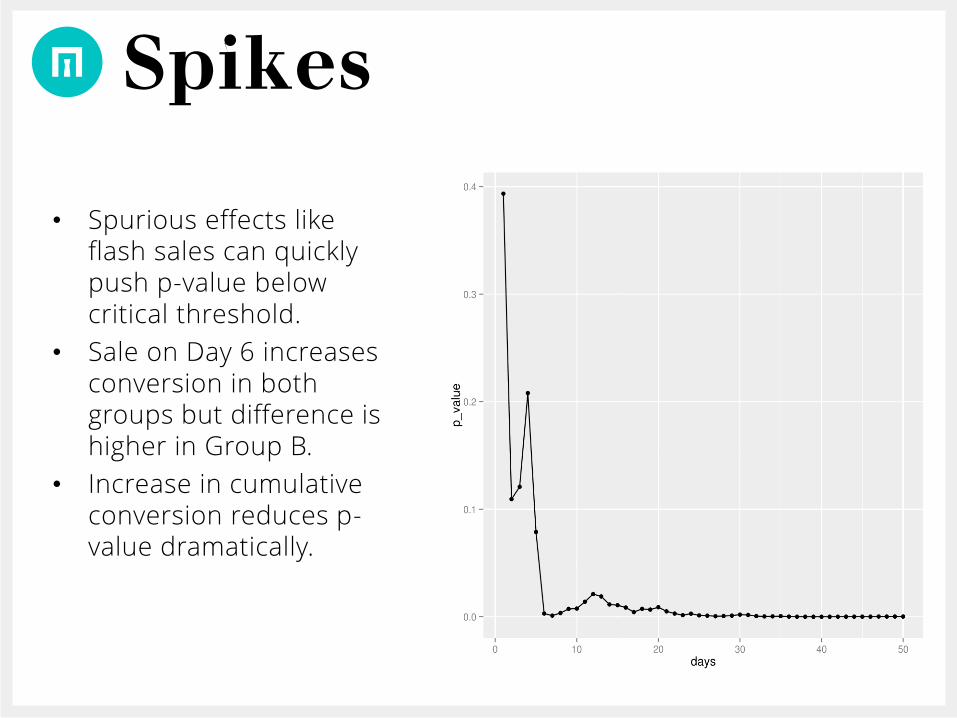
Spikes
• Toy Scenario
Property Group A Group B
Stable conversion 0.2 0.22
Sale conversion 0.3 0.5
Visitor rate (per group)
N(200,20) N(200,20)
Where 𝑁 𝜇, 𝜎 are normal distribution paramters. Conversion data generated using a binomial distribution.
Spikes
• Spurious effects like flash sales can quickly push p-value below critical threshold.
• Sale on Day 6 increases conversion in both groups but difference is higher in Group B.
• Increase in cumulative conversion reduces p-value dramatically.

Spikes
Spurious effects like flash sales can quickly push p-value below critical threshold.
days all_visitors all_orders_a all_orders_b conversion_a conversion_b difference p_value
1 194 32 34 0.165 0.175 0.010 0.393
2 355 63 76 0.177 0.214 0.037 0.109
3 566 110 126 0.194 0.223 0.028 0.121
4 772 155 168 0.201 0.218 0.017 0.208
5 953 185 210 0.194 0.220 0.026 0.079
6 1154 244 300 0.211 0.260 0.049 0.003
7 1331 279 346 0.210 0.260 0.050 0.001
8 1537 323 386 0.210 0.251 0.041 0.003
9 1713 362 422 0.211 0.246 0.035 0.007
10 1931 404 467 0.209 0.242 0.033 0.008
11 2135 451 511 0.211 0.239 0.028 0.014
12 2341 497 555 0.212 0.237 0.025 0.021
13 2553 544 606 0.213 0.237 0.024 0.019
14 2770 595 666 0.215 0.240 0.026 0.011
15 2956 633 707 0.214 0.239 0.025 0.011
16 3143 670 749 0.213 0.238 0.025 0.009
17 3388 713 803 0.210 0.237 0.027 0.004
18 3590 757 843 0.211 0.235 0.024 0.007
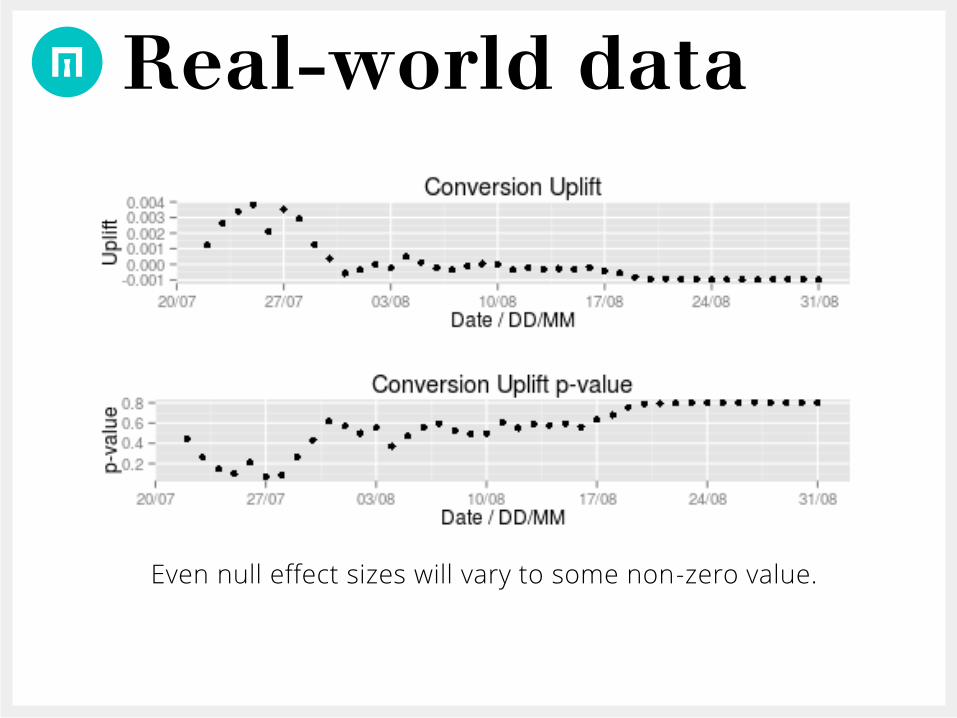
Real-world data
Even null effect sizes will vary to some non-zero value.
Temporal variability
• Instability in effect size.
• Depending on the A/B test, the long term instability of effect size can be debilitating after roll-out.
• But can also provide a source of insight.

Dilution
• Users who can see treatment are a small fraction of population.
http://www.infoq.com/presentations/ab-testing-pinterest
• Create a counterfactual cohort from control group for correct measurement.

Dilution
• Treatment only made available in the ‘Variant’ group and only a small fraction of treatment group actually go through the treatment.
• Can use Instrumental Variables to scale the overall effect
Instrumental variables
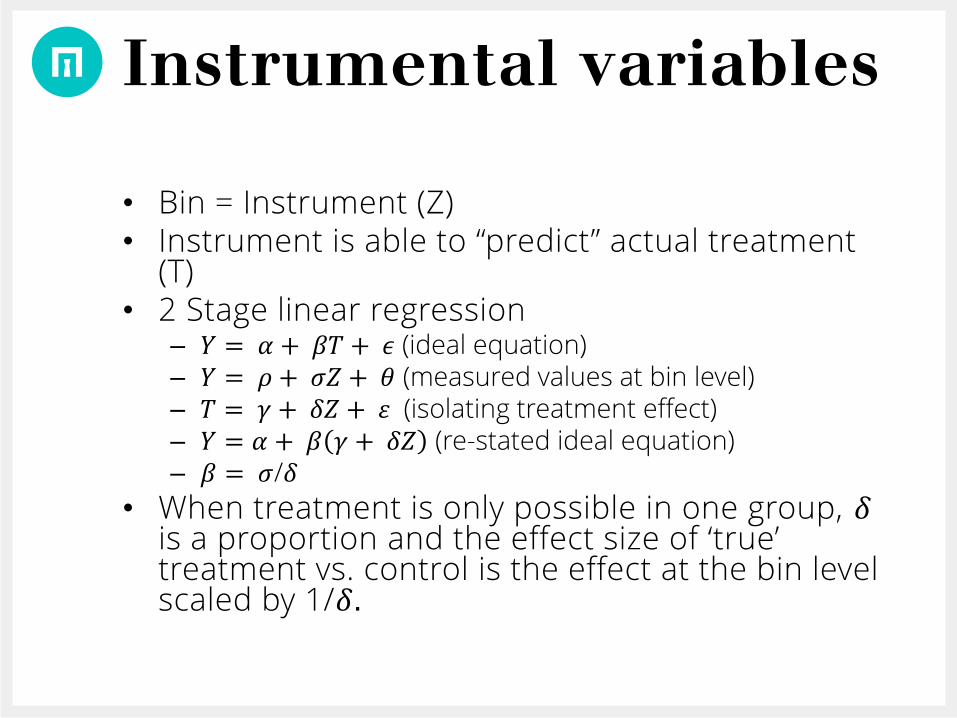
• Bin = Instrument (Z)• Instrument is able to “predict” actual treatment
(T)• 2 Stage linear regression
– 𝑌 = 𝛼 + 𝛽𝑇 + 𝜖 (ideal equation)– 𝑌 = 𝜌 + 𝜎𝑍 + 𝜃 (measured values at bin level)– 𝑇 = 𝛾 + 𝛿𝑍 + 휀 (isolating treatment effect)– 𝑌 = 𝛼 + 𝛽 𝛾 + 𝛿𝑍 (re-stated ideal equation)– 𝛽 = 𝜎/𝛿
• When treatment is only possible in one group, 𝛿is a proportion and the effect size of ‘true’ treatment vs. control is the effect at the bin level scaled by 1/𝛿.
Simulate beforehand
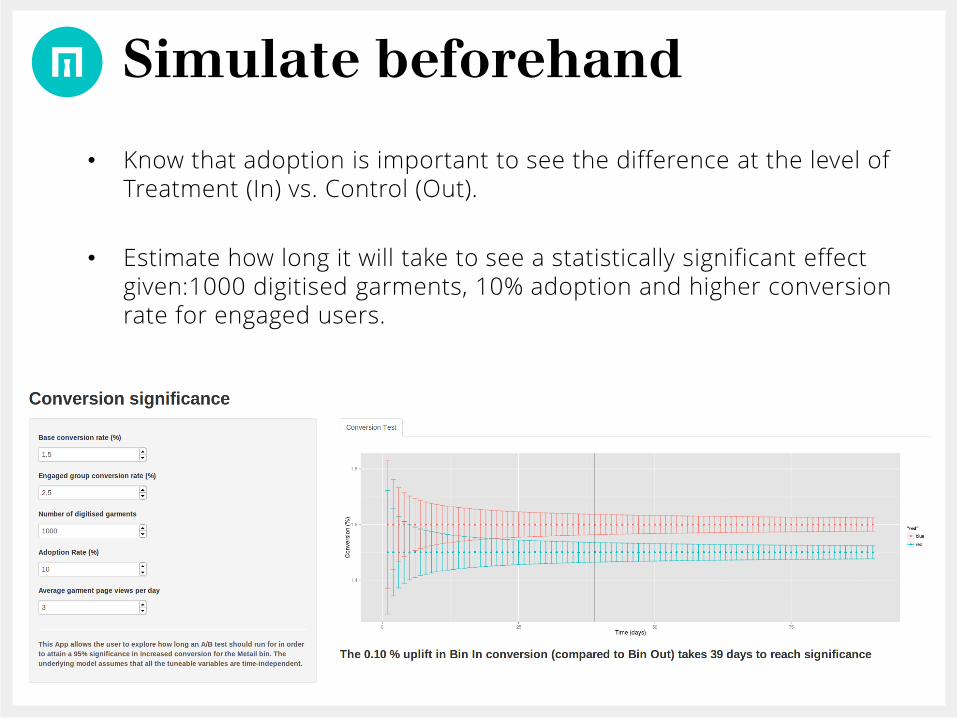
• Know that adoption is important to see the difference at the level of Treatment (In) vs. Control (Out).
• Estimate how long it will take to see a statistically significant effect given:1000 digitised garments, 10% adoption and higher conversion rate for engaged users.

Bucketing bias
• Non-representative population
– Bugs in bucketing
– Bugs in treatment not showing up on selective devices
• Run A/A test
• Examine cohorts carefully
Bucketing bias
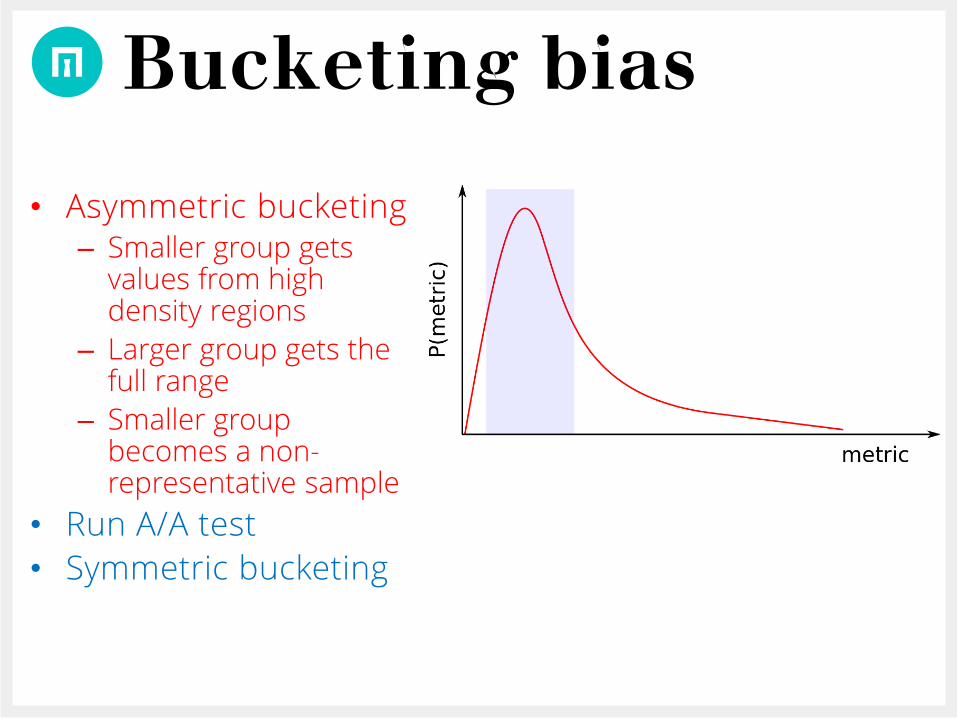
• Asymmetric bucketing– Smaller group gets
values from high density regions
– Larger group gets the full range
– Smaller group becomes a non-representative sample
• Run A/A test
• Symmetric bucketing

Other analyses of A/B tests
Bootstrapping
• No assumptions about data distribution
• Can calculate any metric
• Explicitly performs the assumptions of hypothesis testing so easier to explain
• Can also interpreted from a Bayesian perspective Reference
Bootstrapping
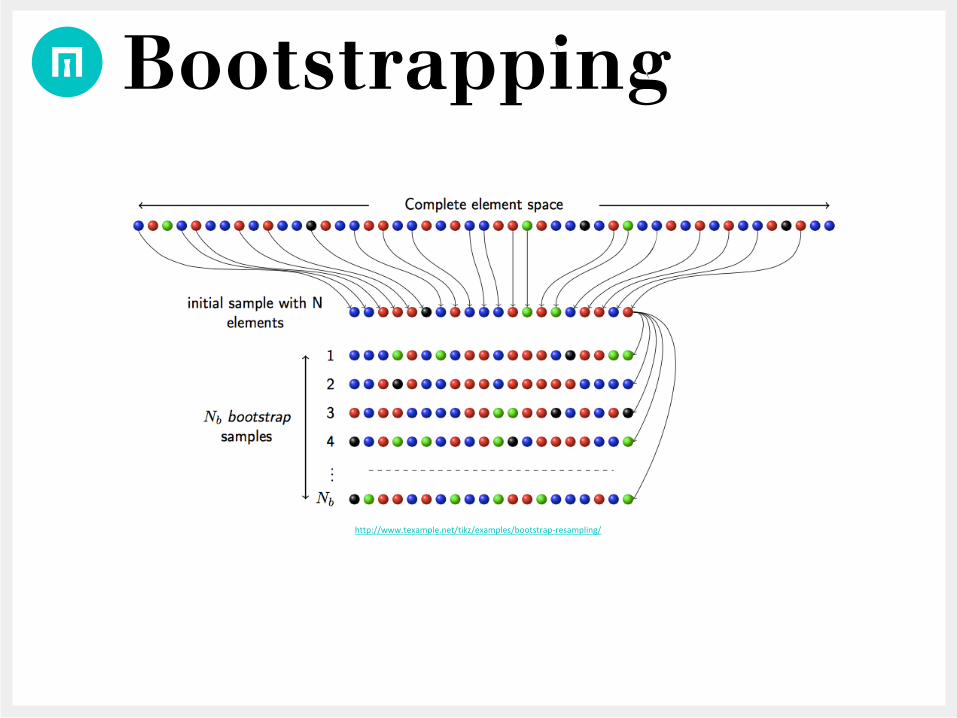
http://www.texample.net/tikz/examples/bootstrap-resampling/
Bootstrapping
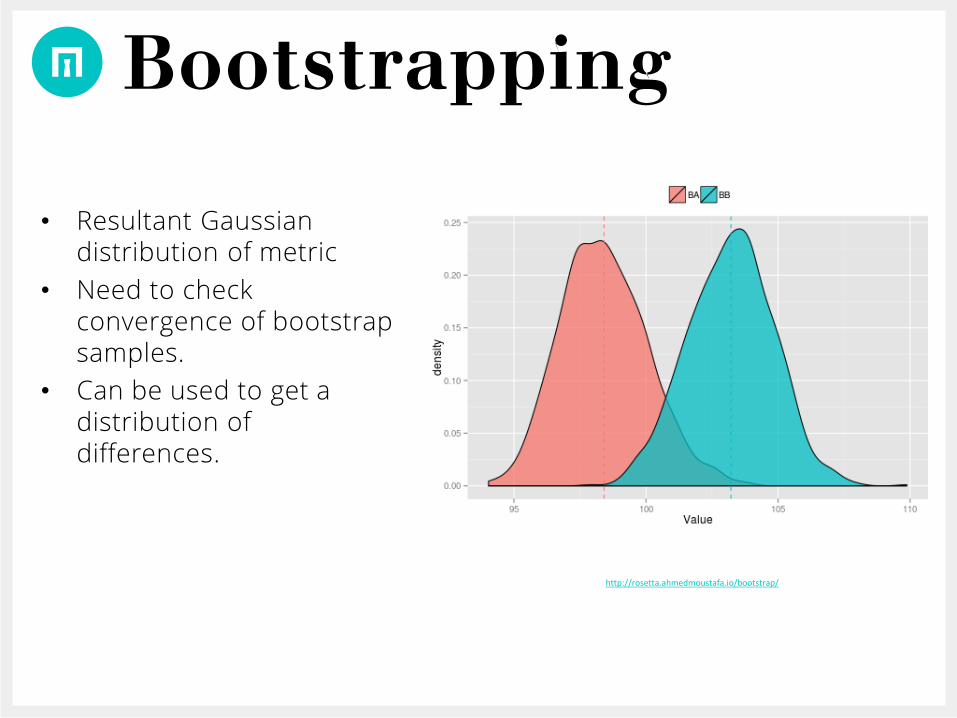
• Resultant Gaussiandistribution of metric
• Need to check convergence of bootstrap samples.
• Can be used to get a distribution of differences.
http://rosetta.ahmedmoustafa.io/bootstrap/
Bayesian models
• Explicit mechanistic modelling of important parameters.
• Answers the question: “What are the range of conversion rates that result in the observed data?”– Use knowledge that conversion rates can be modelled
with a binomial distribution and the parameter space to be explored is p.
Conclusions
• How to analyse an A/B test
• Understand different problems and highlighted some solutions
• Techniques that allow for understanding mechanisms


![[SMA Data Insights] L'Oreal](https://img.pdfslide.us/doc/110x75/55b3dfd2bb61ebf1218b457c/sma-data-insights-loreal.jpg)